Báo cáo y học: "Explicit equilibrium modeling of transcription-factor binding and gene regulation" pdf
Bạn đang xem bản rút gọn của tài liệu. Xem và tải ngay bản đầy đủ của tài liệu tại đây (417.15 KB, 10 trang )
Genome Biology 2005, 6:R87
comment reviews reports deposited research refereed research interactions information
Open Access
2005Granek and ClarkeVolume 6, Issue 10, Article R87
Method
Explicit equilibrium modeling of transcription-factor binding and
gene regulation
Joshua A Granek
*†
and Neil D Clarke
*‡
Addresses:
*
Department of Biophysics and Biophysical Chemistry, Johns Hopkins University School of Medicine, North Wolfe Street,
Baltimore, MD 21205, USA.
†
National Evolutionary Synthesis Center, Broad Street, Durham, NC 27705, USA.
‡
Genome Institute of Singapore,
Biopolis Street, Singapore 138672, Republic of Singapore.
Correspondence: Neil D Clarke. E-mail:
© 2005 Granek and Clarke; licensee BioMed Central Ltd.
This is an Open Access article distributed under the terms of the Creative Commons Attribution License (
which permits unrestricted use, distribution, and reproduction in any medium, provided the original work is properly cited.
Explicit equilibrium modeling of transcription-factor binding and gene regulation<p>A computational model, GOMER, is presented that predicts transcription-factor binding and incorporates effects of cooperativity and competition.</p>
Abstract
We have developed a computational model that predicts the probability of transcription factor
binding to any site in the genome. GOMER (generalizable occupancy model of expression
regulation) calculates binding probabilities on the basis of position weight matrices, and
incorporates the effects of cooperativity and competition by explicit calculation of coupled binding
equilibria. GOMER can be used to test hypotheses regarding gene regulation that build upon this
physically principled prediction of protein-DNA binding.
Background
Transcription is regulated by the binding of proteins to spe-
cific DNA sequences. Until recently, binding and regulation
could only be studied at the level of individual genes, but they
can now be studied as a complex system due to the availability
of genome-wide data on expression and transcription factor
binding. Computational models are needed, however, to eval-
uate co-regulated genes and the sequence motifs associated
with them.
A general strategy for testing the relevance of a DNA binding
motif to gene regulation is to quantify the association of the
motif with co-regulated genes. This can be done by comparing
the regulatory sequences of co-regulated genes with the regu-
latory sequences of all other genes [1-4]. One simple test is to
score for the occurrence of a consensus site within a pre-
scribed distance 5' to the start of transcription. If the fraction
of regulated genes with a consensus site is significantly larger
than the fraction of unregulated genes, as it often is, then the
test has some predictive power [1,5-7]. As with all statistical
tests, there is a model implicit in this test: in this case, the
implicit model is that gene regulation is mediated by a single
consensus binding site.
There are problems with such a simple model. First, the use
of consensus binding sites, even if degenerate, underesti-
mates the importance of motifs that resemble the consensus
but do not match it [8]. At the same time, degenerate consen-
sus sites fail to distinguish among motifs that match the con-
sensus even if the motifs that match differ in affinity. Second,
regulated genes often contain more than one binding site for
a given factor, so scoring based on a single site (or any other
threshold number of sites) is arbitrary. Third, the binding of
a factor is typically affected by cooperative and competitive
interactions with other proteins, so binding sites for those
other proteins may need to be considered. Fourth, gene
expression can be affected by the location, orientation and
spacing of bound transcription factors. Therefore, to be real-
istic, a model for gene regulation should use to full advantage
an accurate representation of binding specificity, integrate
over multiple binding sites of different strength, account for
cooperative and competitive interactions, and be flexible
Published: 30 September 2005
Genome Biology 2005, 6:R87 (doi:10.1186/gb-2005-6-10-r87)
Received: 3 May 2005
Revised: 17 June 2005
Accepted: 30 August 2005
The electronic version of this article is the complete one and can be
found online at />R87.2 Genome Biology 2005, Volume 6, Issue 10, Article R87 Granek and Clarke />Genome Biology 2005, 6:R87
enough to model the variable effects that binding can have on
gene expression.
We previously described an algorithm for predicting the
probability that a transcription factor binds within a pro-
moter region [3]. The algorithm predicts the relative affinity
of binding sites using a position weight matrix (PWM) in
which the elements of the PWM represent contributions to
the free energy of binding for all possible bases at each posi-
tion in a binding site [9]. The algorithm then integrates over
the affinities of all possible binding sites within a region of
interest by calculating the probability that at least one site is
bound at a given assumed protein concentration. Using a
PWM defined by extensive binding equilibrium measure-
ments of yeast Leu3p, we showed that this method was able to
predict the set of known target genes for Leu3p better than
could be achieved by simple enumeration of discrete binding
sites [3].
Building on those results, we report here a very general phys-
ically principled model for transcription factor localization
based on protein-DNA and protein-protein binding equi-
libria. The model, which we have named GOMER (generaliz-
able occupancy modeling of expression regulation), uses
PWMs to predict explicitly the relative affinity of binding
sites, taking into account the effect of cooperative and com-
petitive interactions. Based on the binding predictions,
GOMER predicts gene regulation by weighting binding sites
according to their location and orientation. The weights are
calculated from functions specified or defined by the user.
These functions and their parameters allow the user to test
alternative hypotheses concerning the control of co-regulated
genes.
Here we describe GOMER and give examples of its applica-
tion. We use the program to analyze the effect of cooperativity
between forkhead proteins and the transcription factor
Mcm1p in controlling the expression of a set of cell-cycle reg-
ulated genes in yeast [7,10]. Although in vitro experiments
show that direct interactions between these factors occur over
very short distances [11], we find evidence that cooperative
interactions can extend over a distance of 100 base pairs (bp)
or more. We also use the model to investigate the role of com-
petition between two transcription factors, Ndt80p and
Sum1p, in distinguishing between mitotic and meiotic pro-
grams of gene expression [12]. Competition between these
proteins better explains a set of genes that is regulated by
both transcription factors than does simple non-competitive
binding. Finally, we evaluate the correlation between pre-
dicted and observed binding of Rap1p in a chromatin immu-
noprecipitation microarray (ChIP-array) experiment [13]. We
show that the correlation between predicted and observed
binding can be dramatically improved by a model that
accounts for hybridization to a spot on the array (an array fea-
ture) that is due to binding to sites outside the sequence of the
array feature itself. The GOMER program is freely available.
Results
Realistic modeling of promoter regions using binding
site weight functions
A group of yeast genes named the CLB2 cluster is normally
expressed in a cell-cycle dependent fashion but loses its cell-
cycle dependence in a fkh1
∆
fkh2
∆
mutant lacking forkhead
transcription factors [7,10]. To assess the association of fork-
head binding sites with forkhead-dependent cell-cycle regula-
tion, we used GOMER to score all putative regulatory
sequences using a forkhead PWM that was defined by binding
data for Fkh1p. The data for Fkh2p is not as complete but the
proteins have similar specificity [11]. The ranks of CLB2 clus-
ter genes, based on the GOMER occupancy score, were com-
pared to all other genes in the genome using a receiver
operating characteristic (ROC) curve (Figure 1a) [14]. In this
context, a ROC curve is a series of connected points, each of
which shows the fraction of regulated genes that meet or
exceed a given GOMER occupancy score versus the fraction of
unregulated genes that meet or exceed the same score; these
values are plotted for all observed occupancy scores. The ROC
curve can also be thought of as a graphical representation of
how the ranks of regulated genes are skewed with respect to
the ranks of other genes in the genome when genes are ranked
by their GOMER occupancy score. One way to quantify this
skewing of ranks is by calculating the area under the ROC
curve (ROC AUC). We have previously discussed the merits of
the ROC AUC value as a criterion for evaluating models of
gene regulation, and the metric is used here extensively [15].
In GOMER, regulatory regions are defined by user specified
functions that assign a weight to each binding site based on its
location. For example, it is common practice to assume that
yeast regulatory regions consist of the 600 bp 5' to the start of
translation [1,5,16]. To model this regulatory region in
GOMER we used a function that simply assigns a weight of 1
to all sites that lie within the region and 0 to all sites outside.
The region itself is defined by parameters to the function that
specify the endpoints of the region with respect to the 5' end
of an open reading frame (ORF). Figures 1a and 1c show the
effect of varying the parameters for this simple model (the
beginning and end points of the regulatory region).
While the conventional 600 bp definition of the regulatory
region works well (ROC AUC = 0.75), alternative parameters
explain the CLB2 cluster genes somewhat better. The choice
of parameters that works best defines a regulatory region
extending from 650 bp 5' to the ORF to 150 bp inside the ORF
(ROC AUC = 0.78). Exclusion of the 150 bp inside the ORF
makes the model perform somewhat less well (ROC AUC =
0.75), which means that sites within the first 150 bp contrib-
ute to our ability to distinguish true forkhead regulated genes
from other genes that happen to have forkhead binding sites.
Thus, there may be weak but biologically relevant binding
sites within the coding region of some forkhead-regulated
genes.
Genome Biology 2005, Volume 6, Issue 10, Article R87 Granek and Clarke R87.3
comment reviews reports refereed researchdeposited research interactions information
Genome Biology 2005, 6:R87
Real regulatory regions rarely have strict boundaries like the
600 bp definition used by convention in yeast, and sites
within these regions can differ substantially in their func-
tional importance. One advantage of the GOMER approach is
that it allows users to evaluate more realistic models of gene
regulation by defining their own regulatory-region weight
functions. Figure 1b illustrates, as an example, a Gaussian
weight function, and Figure 1d shows the results of using this
function with various parameters. The Gaussian weight func-
tion models a regulatory mechanism in which there is an opti-
mal position for a bound protein to affect gene expression.
The effect of a bound protein decreases with distance from
this optimal position. Unlike the uniform weight function,
there is no sudden and substantial drop in weights (though
weights below a user-specified threshold are rounded down
to zero in the interests of computational efficiency).
Figures 1c and 1d compare the effectiveness of the uniform
and Gaussian functions over an equivalent range of parame-
ters. The two functions achieve similar ROC AUC values using
their optimal parameters, but the uniform weight function is
much more sensitive to the choice of parameter values than is
the Gaussian function. This is evident from the irregular con-
tours in Figure 1c, which are a consequence of the hard cutoffs
imposed by the uniform weight function. Thus, GOMER's
flexible definition of gene regulatory regions allows for regu-
latory models that are both more realistic and more robust.
Homotypic and heterotypic cooperativity in the
regulation of cell-cycle genes by forkhead transcription
factors
The forkhead PWM is able to distinguish CLB2 cluster genes
reasonably well using either the uniform-weight definition of
the regulatory region or the Gaussian-weight definition.
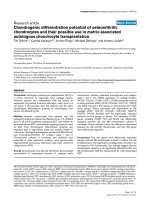
Alternative definitions of the regulatory region and their effect on the prediction of gene regulationFigure 1
Alternative definitions of the regulatory region and their effect on the
prediction of gene regulation. (a) Receiver operating characteristic (ROC)
curves showing how CLB2 cluster genes rank compared to all other genes
using the forkhead probability matrix and two different definitions of the
regulatory region. ROC curves plot the fraction of true positives that
meet a threshold value (here, a given GOMER score) against the fraction
of false positives that meet that same threshold. The thick line plots a
ROC curve for a regulatory region defined as the sequence between 650
base pairs (bp) 5' to the ORF and 150 bp 3' to the start of the ORF; the
thin line plots a ROC curve for a regulatory region defined as the
sequence between 1,000 bp and 500 bp 5' to the ORF. The latter
definition of the regulatory region has no predictive value as reflected in
the nearly diagonal ROC curve (area under the ROC curve (ROC AUC)
of approximately 0.5). (b) Schematics of a conventional uniform weight
function and a Gaussian weight function. (c) Comparison of the uniform
weight function and (d) the Gaussian weight function for several hundred
combinations of parameter values. The contoured areas are shaded
according to ROC AUC value as indicated on the scale. To facilitate
comparison, the regulatory regions defined by the uniform weight function
are plotted in terms of the center of the region, analogous to the center of
the Gaussian distribution. Center values are expressed as distance from
the open reading frame (ORF); negative values are 5' to the ORF start. For
the Gaussian function, weights below 1/1,000
th
the maximum value are
rounded down to 0.
750
500
250
0
0
-800
-600
-200
200
400
-400
0
-800
-600
-200
200
400
-400
3,000
2,000
1,000
0
ORF ORF
Gaussian weight functionUniform weight function
0
0.2
0.4
0.6
0.8
1.0
0 0.2 0.4 0.6 0.8 1.0
Fraction of cell-cycle genes
Fraction of unregulated
Thick
line
Thin
line
Legend
( )
( )
².50
.53
.56
.59
.74
.80
.77
.62
.65
.68
.71
Length (bp)
Standard deviation (bp)
Center (bp)
uniform function
Center (bp)
ROC
AUC
(
c)
(
a)
(
b)
(d)
Modeling Fkh2p-Mcm1p cooperativity improves the ability to identify cell-cycle genesFigure 2
Modeling Fkh2p-Mcm1p cooperativity improves the ability to identify cell-
cycle genes. Scores for the area under the receiver operating
characteristic curve (ROC AUC) are plotted as a function of the maximum
distance over which cooperative interactions between Fkh2p and Mcm1p
are allowed to occur. Different symbols correspond to different assumed
values for K
dimer
, a parameter that specifies the strength of cooperative
interactions (10
-1
(circles), 10
-2
(squares), 10
-3
(diamonds) and 10
-4
(triangles)). The horizontal gray line indicates the ROC AUC value in the
absence of cooperative interactions with Mcm1p. All calculations were
performed using the optimal regulatory region definition previously
determined for non-cooperative binding (Gaussian weight function with
mean = 250 base pairs (bp) and SD = 250 bp).
10
-1
10
-2
10
-3
10
-4
K
dimer
0
0.8
0.9
1.0
ROC AUC
1 10 100 1,000
Maximum cooperative distance (bp)
R87.4 Genome Biology 2005, Volume 6, Issue 10, Article R87 Granek and Clarke />Genome Biology 2005, 6:R87
However, neither model is exceptionally good: both have
ROC AUC values of approximately 0.78. In vitro experiments
suggest that Fkh2p binds cooperatively to DNA with itself and
with the transcription factor Mcm1p [11,17]. The lack of coop-
erative interactions in the models might explain their subop-
timal performance.
To see whether performance of the model could be improved
by including homotypic (Fkh2p-Fkh2p) or heterotypic
(Fkh2p-Mcm1) interactions, we used GOMER to model these
interactions, varying the strength of the dimerization con-
stant and the allowed distance between cooperatively inter-
acting binding sites (Figure 2). The inclusion of homotypic
cooperativity had little effect on our ability to explain regula-
tion of the forkhead-regulated genes (not shown). The inclu-
sion of heterotypic interactions with Mcm1p, however,
dramatically improves the quality of the model. For parame-
ter values that model a strongly cooperative interaction, the
ROC AUC achieves its highest value when the maximum
allowed distance between Fkh2 and Mcm1 binding sites is 25
bp. If we assume the interaction is weaker, the maximum
ROC AUC value is not quite as high but it increases steadily to
a maximum distance between binding sites of 500 bp. This
result was unexpected because in vitro binding experiments
had suggested preferences for close and precise spacing in the
cooperative interaction of Fkh2p and Mcm1p [17]. One possi-
bility is that Fkh2p and Mcm1 bind cooperatively by two dif-
ferent mechanisms: through direct interaction over short
distances; and indirectly over longer distances. One plausible
mechanism for indirect, long-range cooperative interaction is
through mutual competition with nucleosome binding [18].
Thus, the computational analysis supports the idea that coop-
erativity is an important feature of the regulation of these
genes, and suggests that cooperative effects may occur over a
longer range than had been anticipated.
The model for cooperativity used in this analysis is extremely
simple: all sites within a given distance are considered to be
equally capable of interacting cooperatively. However,
GOMER's 'plug-in' weight functions make it easy to explore
more elaborate models for cooperativity (see Materials and
methods).
Competitive interactions between Sum1 and Ndt80
Competition among transcription factors is a potentially
important mechanism for controlling complex biological
responses. We have incorporated a realistic model for com-
petitive interactions into GOMER (see Materials and meth-
ods) and have used this model to study the interaction of yeast
transcription factors Ndt80p and Sum1p. Ndt80p is an acti-
vator of genes expressed during the middle stage of sporula-
tion [5,19]. Sum1p represses genes during mitotic growth and
the early stage of sporulation [12,20]. A number of the genes
induced by Ndt80p during middle sporulation are targets of
repression by Sum1p. Ndt80p and Sum1p have overlapping
binding specificities, which suggests that competition
between these transcription factors may be important for
regulation. Competition for binding has been demonstrated
in vitro by gel-shift assays and in vivo using reporter con-
structs [12].
We first calculated the GOMER occupancy scores for all yeast
genes using either a Sum1p PWM alone or an Ndt80p PWM
alone. As expected, the Sum1p PWM does a good job of iden-
tifying genes that are regulated by Sum1p (including those
that are also regulated by Ndt80p), but it does a poor job of
identifying genes that are regulated by Ndt80p only (not
shown). Conversely, the Ndt80p PWM does a poor job of
identifying genes that are regulated only by Sum1p, and a rea-
sonably good job of identifying Ndt80p regulated genes
(including those that are also regulated by Sum1p). In fact,
genes that are regulated by Sum1p in addition to Ndt80p are
better explained by Ndt80p binding sites than are the genes
regulated by Ndt80p alone (Figure 3).
If competition between Sum1p and Ndt80p were relevant to
the regulation of a particular gene, we would expect the regu-
latory sequence for that gene to be sensitive to the concentra-
tions of the two transcription factors. To test this, we fixed the
concentration of Ndt80p in the model and explored the effect
of increasing concentrations of competing Sum1p. Impor-
tantly, the genes that are regulated by both proteins, and
therefore are the best candidates for being affected by compe-
tition between the proteins, show the greatest sensitivity to
competition by Sum1p (Figure 3). At higher Sum1p
concentrations there is substantially less specific binding by
Ndt80p to these genes, as reflected in lower ROC AUC values
Effect of competition by Sum1p on predicted binding by Ndt80pFigure 3
Effect of competition by Sum1p on predicted binding by Ndt80p. Sequence
logos [37] for (a) Ndt80p and (b) Sum1p binding specificity. (c) Values for
the area under the receiver operating characteristic curve (ROC AUC)
quantify how well predicted Ndt80 binding distinguishes regulated genes
from non-regulated genes. The regulated gene sets are the genes
controlled by Ndt80 only (black), Sum1 only (white), or both (gray). For all
comparisons, the set of non-regulated genes consists of genes not
regulated by Ndt80 or by Sum1. Sum1p concentration is expressed as a
ratio to the optimal predicted K
d
value for Sum1p binding; Ndt80p
concentration is set equal to the optimal predicted K
d
value for Ndt80p
binding. The regulatory region was defined by the uniform weight function
over the sequence between 600 base pairs 5' to the open reading frame
and the start of translation.
Genome Biology 2005, Volume 6, Issue 10, Article R87 Granek and Clarke R87.5
comment reviews reports refereed researchdeposited research interactions information
Genome Biology 2005, 6:R87
for this set of genes when scored for Ndt80p occupancy. Sub-
stantially smaller effects of Sum1p concentration are seen for
the genes that are regulated by Ndt80p alone, consistent with
the observation that Sum1p does not regulate these genes. A
similar conclusion was recently reported independently by
Wang et al. [21]. These results suggest that binding site vari-
ants that are found in genes regulated by both Ndt80p and
Sum1p have been tuned by evolution to be sensitive to the rel-
ative concentration of the two proteins. Binding sites in genes
regulated by only one of the transcription factors tend to more
closely match the specificity of that particular transcription
factor and are, therefore, less sensitive to the effects of the
competing factor.
Improved correlation between predicted and observed
binding in ChIP-array experiments
The GOMER model was designed to provide flexibility in
modeling gene regulation, but it can also be used to model the
genome-wide binding of transcription factors. As an example,
we have used it to analyze the in vivo binding of Rap1p as
determined by whole-genome ChIP-array [13]. Using a Rap1p
PWM we determined GOMER scores for the genomic
sequences represented on the array and used ROC curves to
evaluate the association of predicted binding with Rap1p
immunoprecipitation (Figure 4). On the whole, enrichment of
genomic sequences is reasonably well explained by the model
for Rap1p binding (ROC AUC = 0.70). However, this is an
average value: array features (spots on the array) that
correspond to intergenic sequences score exceptionally well
(ROC AUC = 0.84), but features that correspond to coding
sequence score no better than random (ROC AUC = 0.47).
This difference is largely due to the naïve model we used ini-
tially to score sequence features on the array. This model con-
siders only the sequence of the array feature itself (Figure 4a).
Because bound DNA is sheared to a size of several hundred
base pairs in the ChIP procedure, some of the molecules that
are immunoprecipitated due to binding to a site within one
array feature overlap the sequence of a neighboring feature,
as previously pointed out by Lieb et al. [13]. We can model
this effect in GOMER using a weight function that allows sites
outside the feature to contribute in proportion to the fraction
of immunoprecipitated molecules we expect to hybridize.
Doing so dramatically improves our ability to explain the
Rap1p ChIP data, especially for ORF features (Figure 4b,
right). This suggests that much of the experimental enrich-
ment of ORF features is actually due to binding sites that are
in sequences flanking the ORFs (that is, in intergenic
regions).
Discussion
The GOMER scoring function uses PWM scores to estimate
relative free energies of binding to potential sites. How well
this works depends on how well the PWM represents the con-
tributions of each base to the free energy of binding. These
Application of GOMER to chromatin immunoprecipitation microarray experimentsFigure 4
Application of GOMER to chromatin immunoprecipitation microarray
experiments. (a) The contribution to array feature enrichment by binding
sites outside the sequence of the array feature. (i) A single protein bound
to a single high-affinity site (ii) yields a population of enriched DNA
molecules averaging approximately 500 base pairs in length. (iii)
Hybridization of the enriched sequences to a DNA microarray results in a
signal for those array features that overlap the enriched DNA sequences
(N-1 and N). (iv) If the sequence of the array features alone is used to
predict binding, enrichment of feature N cannot be accurately predicted.
(v) Enrichment can be predicted if flanking sequences are included in the
calculation. Binding sites outside the array feature sequence are down-
weighted as a function of distance from the array feature boundary. (b)
Receiver operating characteristic (ROC) curves for Rap1p enriched versus
unenriched features, with features ranked by GOMER scores. GOMER
scores were calculated using only the features themselves (left) or the
features plus weighted flanking sequences (right). ROC curves for different
subsets are indicated by shading under the curve: open reading frame
(ORF) features only (light gray); both intergenic and ORF features
(medium gray); intergenic features only (dark gray).
Array
feature
N-1
Array
feature
N
Array
feature
N+1
TF
Binding
site
Binding
site
Binding
site
++ +
-
++
-
++
-
-
+
Genomic DNA
IP-enriched DNA
fragments
Observed
enrichment
Sequence-based
GOMER score
(feature only)
Sequence-based
GOMER score
(feature plus
weighted flanks)
(i)
(
ii)
(
iii)
(
iv)
(
v)
Feature only
Feature plus
weighted flanks
0 0.2 0.4 0.6 0.8 1.0
Fraction of unbound
0
0.2
0.4
0.6
0.8
1.0
Fraction of Rap1p bound
0
0.2
0.4
0.6
0.8
1.0
Fraction of Rap1p bound
0 0.2 0.4 0.6 0.8 1
.0
Fraction of unbound
ORF IntergenicORF and intergenic
(
a)
(
b)
R87.6 Genome Biology 2005, Volume 6, Issue 10, Article R87 Granek and Clarke />Genome Biology 2005, 6:R87
free energy contributions can be directly estimated from ther-
modynamic binding data, but more commonly they are
inferred from the base frequencies in known binding sites.
This is possible because there is a connection between the
information content in a set of sequences and the thermody-
namics and specificity of binding (see Materials and methods
for a fuller discussion) [9]. A variation on this idea treats the
PWM as a predictor of affinity and then uses protein concen-
tration as a variable to maximize the likelihood of observing
the set of known sequences [22]. Regardless of how the PWM
is defined, GOMER itself can be used to compare the predic-
tive value of different PWMs by assessing their ability to
explain experimental binding or expression data. For exam-
ple, we have shown that PWMs defined either by direct meas-
urement of binding affinities or by computational motif
discovery are equally good at explaining an independent ChIP
experiment. [23]
A key attribute of GOMER is its flexibility. GOMER uses
weight functions, specified by the user, to create position-
dependent models that define the size and shape of regulatory
regions and describe the nature of cooperative and competi-
tive interactions (see Materials and methods). These func-
tions can be as complex as the user desires, although care
should be taken not to use more parameters than is justified
by the data. The power of this approach for modeling gene
regulation will become more valuable as more data become
available.
One parameter used by GOMER is the free concentration of
transcription factors, which is needed for calculating binding
site occupancies based on predicted affinities (see Materials
and methods). When a single, non-cooperative factor is ana-
lyzed, concentration has only a marginal effect on the ROC
curve. This is because only the ranks of the genes are relevant
to the curve, not the absolute occupancy of the gene by the
transcription factor. (There can be a modest effect of concen-
tration in this case because the occupancy score for a gene
with a single high-affinity site changes with concentration
somewhat differently than does the occupancy score of a gene
with several lower-affinity sites [3].) Varying the concentra-
tion can, however, have a much more substantial effect when
cooperative and competitive interactions are included in the
model (Figures 2 and 3). Because cooperative and competi-
tive interactions are common in gene regulation, the explicit
consideration of concentration is likely to be necessary for a
complete understanding of gene regulation.
GOMER is a physically principled method because of the way
it uses PWMs to estimate binding affinities but also because
its weight functions and parameters can be understood in
terms of specific physical and biological models. This distin-
guishes GOMER from machine learning methods that search
for rules describing gene regulation without the assumption
of an underlying physical model [4]. GOMER also differs in
philosophy from purely empirical algorithms. For example,
rules for defining clusters of binding sites have been devel-
oped that help distinguish regulated genes from other genes
that have a comparable number of binding sites [24-26].
GOMER, on the other hand, can distinguish genes with clus-
tered binding sites from genes whose sites are dispersed by
modeling cooperative binding interactions. These coopera-
tive interactions are likely to be the reason why sites are clus-
tered in the first place.
We showed previously that gene scoring functions that are
based on enumeration of binding sites are typically poorer
predictors of gene regulation than is the simple GOMER
occupancy score, which integrates over binding sites of differ-
ing predicted affinities [3]. We expect, of course, that any
motif searching algorithm that uses PWMs in a related way,
and which ranks genes based on the scores for all sites, would
perform similarly. To verify this, we ran the motif searching
program PATSER using the FKH1 and NDT80 PWM, and
obtained scores for the top five sites upstream of every gene
[27]. PATSER does not provide an integrated binding site
score for each gene, so we ranked genes according to their
highest scoring site. In the event of ties, the second highest
scoring site was used as a tie breaker, then the third highest
scoring site, and so on. For the largest gene set analyzed, the
genes regulated by NDT80 only, the ROC AUC values for the
simple GOMER function and the PATSER-based ranking
algorithm are nearly identical (between 0.70 and 0.71). For
two smaller gene sets, the simple GOMER function per-
formed better than the PATSER-based algorithm in one case
(0.78 versus 0.72 for the CLB2 cluster genes) and less well in
the other (0.80 versus 0.89 for the genes regulated by both
NDT80 and SUM1).
The purpose of this paper is to demonstrate that a substantial
improvement in these scores can be obtained using GOMER's
cooperative and competitive modeling functions. GOMER is
unique thus far in its ability to model cooperative and com-
petitive interactions, so we are not able to compare these
important features of GOMER to other algorithms. We hope
the availability of GOMER and the data sets used in this paper
will permit others in the field to test GOMER against new
algorithms as these new algorithms are developed.
Conclusion
Computational models of gene regulation are far from perfect
because gene regulation is a complex phenomenon. It is
because of this complexity, though, that it is important to
develop realistic, quantitative models like GOMER. By
assessing how well (or poorly) we can predict the effect of
mutations or environmental signals, we can better identify
deficiencies in our understanding of gene regulation and
allow the development of new additions to the model.
GOMER can be applied to other organisms besides yeast, and
indeed we have begun using it to study developmentally
important transcription factors in Caenorhabditis elegans.
Genome Biology 2005, Volume 6, Issue 10, Article R87 Granek and Clarke R87.7
comment reviews reports refereed researchdeposited research interactions information
Genome Biology 2005, 6:R87
GOMER can also be used to study sequence signals that reg-
ulate transcription termination [28], and it could be adapted
to study any regulatory mechanism that involves sequence
specific binding, not just transcription. In the future, we
anticipate incorporating experimental data on the distribu-
tion of nucleosomes and nucleosome modifications, and we
will begin to address differences in the kinetics of binding in
addition to differences in affinity.
Materials and methods
Representation of binding specificity and the prediction
of binding affinity
The elements of a PWM are base-specific scores for each posi-
tion of a potential binding site. The values of the PWM can be
defined by direct measurement of binding affinities [3,12],
but more often they are estimated from the frequency of
occurrence of each base at each position in a set of presump-
tive binding sites. These sites are determined experimentally,
for example by binding site selection [29] or by computa-
tional analysis of co-regulated genes [2,30,31], or by a combi-
nation of selection and computational analysis [23].
Typically, a PWM element [b,j], is derived from the ratio f
b,j
/
p
b
where f
b,j
is the observed frequency of base b at position j,
and p
b
is the prior probability of base b (usually the frequency
of b in the genome). The ratio f
b,j
/p
b
can be thought of as an
equilibrium constant between the protein binding to sites
that contain base b at position j and the protein binding to a
mixture of sites containing each of the four bases at position
j, with the frequency of the bases the same as that found in the
genome [9]. It follows that if PWM elements are calculated as
RTln(f
b,j
/p
b
) (where R is the gas constant and T is the temper-
ature), the value of element [b,j] can be interpreted as the
contribution to the relative free energy of binding to a base b
at position j in a particular sequence. In practice, GOMER
generates the PWM internally from data supplied by the user:
a probability matrix (PM) file (which contains the position-
specific base frequencies), and the expected base frequencies
(calculated from the sequences). A temperature of 300 K is
used in calculating the PWM from the PM.
Sequence windows (potential binding sites) are scored by
summing the appropriate base-specific values for each posi-
tion in the window, as defined by the PWM. The score for a
site is computed as the sum of position scores, based on the
assumption that each base makes an independent contribu-
tion to the free energy of binding to the site. This assumption
is a good approximation in most cases [32]. The PWM score
for a window can be interpreted, therefore, as a relative free
energy of binding and from that value an equilibrium binding
constant (K
d
= e
-∆G/RT
) can be calculated. A default tempera-
ture of 300 K is used to calculate the equilibrium constant
from the PWM; however, the temperature parameter can be
varied, changing the relative affinity for favored bases over
disfavored.
Probability of protein occupancy for regulatory
sequences
Once an equilibrium constant has been calculated for a
sequence window, i, the probability of binding to that site, P
i
,
can be calculated from the standard equation for a simple
binding isotherm:
where K
d,X,i
is the predicted equilibrium dissociation constant
for X binding to window i and [X] is the free concentration of
X. Although [X] represents a real physical quantity, it is
exceedingly difficult to determine its in vivo value experimen-
tally [33], so for most purposes [X] is an adjustable parame-
ter. By default, [X] is set equal to the K
d,X
for the optimal
binding site, resulting in an occupancy score of 0.5 for opti-
mal sites.
The probability of binding is calculated for all sequence win-
dows within a regulatory sequence. GOMER then integrates
over all sequence windows by calculating the probability, P
occ
,
that the protein is bound to at least one site within the regu-
latory sequence based on the probability of binding to each
site, P
i
.
The probability of not being bound at site i, 1 - P
i
, is
where K
a,X,i
, is an equilibrium association constant and is the
reciprocal of K
d,X,i
.
Therefore:
(We used K
d
, the equilibrium dissociation constant, at the
beginning of the derivation because its use in the standard
binding isotherm equation is familiar to biochemists, but we
switch here to K
a
, the equilibrium association constant,
because the final form of the GOMER scoring function is vis-
ually less complicated using this substitution).
Regulatory regions are defined in GOMER by user-
specified weight functions
Generally, we want to use GOMER to predict the probability
of a gene being regulated rather than just the probability that
a transcription factor binds in its vicinity. To determine this
functional probability, we need to weight binding sites by
their expected relevance to regulation. In GOMER, equilib-
P
X
KX
d,X,i
i
=
+
[]
[]
PP
occ i
=− −
()
=
∏
11
1i
windows
11
1
−=−
+
=
+
=
+
P
X
KX
K
KX
1
KX
i
d,X,i
d,X,i
d,X,i a,X,i
[]
[] [] []
P
1
KX
occ
a,X,i
=−
+
=
∏
1
1
1
[]
i
windows
R87.8 Genome Biology 2005, Volume 6, Issue 10, Article R87 Granek and Clarke />Genome Biology 2005, 6:R87
rium constants are modified by weights calculated from user-
specified functions. These functions weight sites based on
their location and/or orientation with respect to genome fea-
tures (for example, the start of transcription). Thus, we define
a GOMER score, S, which is similar to P
occ
but which incorpo-
rates functional weights.
where K
a,eff,X,i
= κ
i
K
a,X,i
and κ
i
is the weight for site i based on
the user-specified function.
Cooperative interactions
The cooperative binding of proteins X and Y to DNA can be
separated thermodynamically into the formation of an XY
dimer and the binding of that dimer to DNA; this is thermo-
dynamically equivalent to protein X binding to its site with
higher affinity in the presence of pre-bound Y. This leads to a
conceptually simple means for incorporating cooperative
interactions into the GOMER model: the probability that a
given site i is occupied by X depends not only on the probabil-
ity that it is occupied by monomeric X but also on the proba-
bility that it is occupied by XY. Calculating the probability of
occupancy by the XY dimer requires us to take into account all
possible pairs of binding sites that consist of a site i to which
X binds and a second site, j, to which Y binds. These site pairs
need not be contiguous. Extending the expression derived
above for monomer binding, the expression for calculating
the GOMER score, accounting for cooperative interactions,
is:
K
a,eff,XY,i,j
is the equilibrium constant for an XY dimer binding
to a site that consists of windows i and j; it is analogous to
K
a,eff,X,i
, the equilibrium constant for monomeric X binding to
site i in that it is the product of an intrinsic binding affinity,
K
a,XY,i,j
, and a weight, κ
C,i,j
, which is assigned by a user-speci-
fied weight function κ
C
. GOMER assumes that the intrinsic
binding affinity of the dimer, K
a,XY,i,j
, is the product of the
binding constants of the two proteins, X and Y, for their
respective sites, i and j. Thus:
K
a,eff,XY,i,j
= κ
C,i,j
·K
a,X,Y,i,j
= κ
C,i,j
·(K
a,eff,X,i
·K
a,Y,j
)
where the affinity of protein Y for its site j (K
a,Y,j
) is calculated
from a PM in the same way as we have described for protein
X. There is no need to apply a functional weight to Y binding
because the only role for Y in the model is modification of X
binding, rather than a direct role in modulating expression.
The weight function, κ
C
, will typically define weights depend-
ing on the spacing and orientation of site j with respect to site
i. For example, if two sites must be adjacent for cooperative
binding to occur, then a simple weight function can be used
that assigns a weight of 1 for adjacent sites and a weight of 0
to all other sites. The concentration of the dimer, [XY], is the
product of [X], [Y], and the dimerization constant, K
a,dimer
([XY] = [X][Y]K
a,dimer
). By default, [X] and [Y] are set equal to
the K
d
for their respective optimal sites, and K
a,dimer
is equal to
the K
a
for binding of monomeric Y to its optimal site. All these
values are parameters in the model. The strength of the coop-
erative interaction can be adjusted by varying the affinity
between X and Y (K
a,dimer
).
There is no limit to how many transcription factors can bind
cooperatively with protein X. The product is therefore taken
over all cooperative factors, Y. Homotypic cooperativity is
simply a special case, where the same transcription factor
matrix is supplied for both X and Y:
Competition
For a single competitor protein, Q, binding in direct competi-
tion to the same sites as protein X, the higher the concentra-
tion of Q or the stronger its affinity for window i, the lower the
probability that X will be bound to that window. Formally:
where K
a,Q,i
is the predicted binding constant for Q at site i
based on the PM for protein Q. More generally:
where
The competition term, C
i
, incorporates all potential competi-
tors binding at any window, k, that affects binding of protein
X to site i. κ
Q,i,k
is a weight defined by a user-specified func-
tion that determines the effect of protein Q binding at site k
on the binding of protein X at site i. For a simple competition
weight function, the weight might be a binary function of the
distance between sites i and k, such that for sites closer than
a distance threshold, the weight is 1 (binding of Q completely
occludes binding of X) and for sites further than the threshold
distance the weight is 0 (no competition). This function mod-
els simple steric exclusion, but more complex functions of the
distance and orientation between sites can be used to model
more complex interactions.
S
1
KX
a,eff,X,i
=−
+
=
∏
1
1
1
[]
i
windows
S
1
KX
1
KXY
a,eff,X,i a,eff,XY,i,j
=−
+
+
1
11[] [ ]
i
j===
∏∏
11
windows
i
windows
S
1
KX
1
KXY
a,eff,X,i a,eff,XY,i,j
=−
+
+
1
11[] [ ]
i
j====
∏∏∏
111
windows
Y
cooperative
factors
i
windows
P
KQ
KQKX
i
a,Q,i
a,Q,i a,X,i
=
+
++
1
1
[]
[] []
P
C
CK X
i
i
i a,X,i
=
+
++
1
1[]
CKQ
i Q,i,j a,Q,j
=
==
∑∑
κ
[]
j
windows
Q
competitive
factors
11
Genome Biology 2005, Volume 6, Issue 10, Article R87 Granek and Clarke R87.9
comment reviews reports refereed researchdeposited research interactions information
Genome Biology 2005, 6:R87
The complete GOMER model
Adding the effect of competition to the scoring function
derived above for cooperative interactions, we obtain the
complete model for in vivo binding and gene regulation, as
implemented by the GOMER program.
GOMER reports the GOMER score, S, for all regulatory
sequences that are of interest. These can be specified in sev-
eral ways: by reference to a gene annotation file (for example,
the 1,000 bases 5' to the start of an ORF or a snRNA gene);
using a list of genome sequence coordinate pairs (see the
analysis of ChIP-array data below); or providing FASTA-for-
matted sequence files. In addition to the scores for each
sequence of interest, GOMER also reports statistical meas-
ures that quantify the ability of a model to distinguish
sequences that have been classified as regulated from those
that are not. Here, we restrict our discussion to the ROC AUC
[14]. A fuller discussion of evaluation metrics is available else-
where [15].
Genome sequence, regulated gene sets and probability
matrices
All analyses were performed using Saccharomyces cerevisiae
genome sequence and genome annotation files obtained from
the Saccharomyces Genome Database [34] on January 29,
2004. PMs used in this work and lists of regulated genes are
available as Additional data files 2, 3, 4, 5, 6. For analysis of
ChIP-array data, the genome sequence coordinates that
define each microarray spot were determined from the
sequences of the PCR primers used to make the array (see
supplementary methods in Additional data file 1 for details).
Program implementation
The GOMER program was written in Python [35]. Weight
functions are Python modules with a defined programming
interface so users can create novel functions to fit their regu-
latory system of interest without needing to know the internal
design of GOMER. The software and a manual for its use are
available from the GOMER web site [36].
Additional data files
The following additional data are available with the online
version of this paper. Additional data file 1 is a PDF file pro-
viding supplementary methods. Additional data file 2 is a
table of the Fkh1p binding probability matrix. Additional data
file 3 is a table of the Mcm1p binding probability matrix.
Additional data file 4 is a table of the Sum1p binding proba-
bility matrix. Additional data file 5 is a table of the Ndt80p
binding probability matrix. Additional data file 6 is a table of
the Rap1p binding probability matrix. Additional data file 7 is
a table listing the CLB2 cluster (Fkh/Mcm1 regulated genes).
Additional data file 8 is a table listing open reading frames
regulated by Sum1p (derepressed in a Sum1 knockout). Addi-
tional data file 9 is a table listing listing open reading frames
regulated by Ndt80p (induced by Ndt80p overexpression).
Additional data file 10 is a table listing open reading frames
regulated by both Sum1p and Ndt80p (intersection of Sum1p
regulated ORFs and Ndt80p regulated ORFs). Additional
data file 11 is a table listing open reading frames that are chro-
matin immunoprecipitated by Rap1p. Additional data file 12
is a table listing intergenic regions that are chromatin immu-
noprecipitated by Rap1p.
Additional data file 1Supplementary methodsDescription of how PWMs, regulated gene sets, and microarray fea-ture sequences were defined.Click here for fileAdditional data file 2A table (Table 1) of the Fkh1p binding probability matrixThis matrix was derived from binding site selection data published in [10].Click here for fileAdditional data file 3A table (Table 2) of the Mcm1p binding probability matrixThis matrix was derived from binding site selection data published in [38].Click here for fileAdditional data file 4A table (Table 3) of the Sum1p binding probability matrixThis matrix was derived from in vitro and in vivo binding experi-ments published in [12].Click here for fileAdditional data file 5A table (Table 4) of the Ndt80p binding probability matrixThis matrix was derived from in vitro and in vivo binding experi-ments published in [12].Click here for fileAdditional data file 6A table (Table 5) of the Rap1p binding probability matrixThis matrix was derived from a computationally defined matrix published in [13].Click here for fileAdditional data file 7A table (Table 6) lisitng the CLB2 cluster (Fkh/Mcm1 regulated genes)This list of CLB2 cluster genes was determined by expression microarray experiments published in [7].Click here for fileAdditional data file 8A table (Table 7) listing open reading frames regulated by Sum1p (derepressed in a Sum1 knockout)This list of Sum1 regulated genes was derived from genes identified as Sum1 regulated by expression microarray experiments pub-lished in [12].Click here for fileAdditional data file 9A table (Table 8) listing open reading frames regulated by Ndt80p (induced by Ndt80p overexpression)This list of Ndt80 regulated genes was derived from expression microarray experiments published in [5].Click here for fileAdditional data file 10A table (Table 9) listing open reading frames regulated by both Sum1p and Ndt80p (intersection of Sum1p regulated ORFs and Ndt80p regulated ORFs)This list of Sum1 and Ndt80 regulated genes was derived from data on Sum1 regulated and Ndt80 regulated genes published in [12].Click here for fileAdditional data file 11A table (Table 10) listing open reading frames that are chromatin immunoprecipitated by Rap1pThis list of Rap1p bound ORF sequences is derived from chromatin immunoprecipitation experiments published in [13].Click here for fileAdditional data file 12A table (Table 11) listing intergenic regions that are chromatin immunoprecipitated by Rap1pThis list of Rap1p bound intergenic sequences is derived from chro-matin immunoprecipitation experiments published in [13].Click here for file
Acknowledgements
We thank David Noll for thoughtful contributions and suggestions through-
out this work. We also thank Jason Lieb for his careful reading of an earlier
version of the manuscript and his helpful comments. This work was sup-
ported by a grant from the National Institute of General Medical Sciences
Health to N.D.C. and a National Science Foundation Graduate Research
Fellowship to J.A.G.
References
1. DeRisi JL, Iyer VR, Brown PO: Exploring the metabolic and
genetic control of gene expression on a genomic scale. Sci-
ence 1997, 278:680-686.
2. Hughes JD, Estep PW, Tavazoie S, Church GM: Computational
identification of cis-regulatory elements associated with
groups of functionally related genes in Saccharomyces
cerevisiae. J Mol Biol 2000, 296:1205-1214.
3. Liu X, Clarke ND: Rationalization of gene regulation by a
eukaryotic transcription factor: calculation of regulatory
region occupancy from predicted binding affinities. J Mol Biol
2002, 323:1-8.
4. Beer MA, Tavazoie S: Predicting gene expression from
sequence. Cell 2004, 117:185-198.
5. Chu S, DeRisi J, Eisen M, Mulholland J, Botstein D, Brown PO, Her-
skowitz I: The transcriptional program of sporulation in bud-
ding yeast. Science 1998, 282:699-705.
6. Iyer VR, Horak CE, Scafe CS, Botstein D, Snyder M, Brown PO:
Genomic binding sites of the yeast cell-cycle transcription
factors SBF and MBF. Nature 2001, 409:533-538.
7. Spellman PT, Sherlock G, Zhang MQ, Iyer VR, Anders K, Eisen MB,
Brown PO, Botstein D, Futcher B: Comprehensive identification
of cell cycle-regulated genes of the yeast Saccharomyces cer-
evisiae by microarray hybridization. Mol Biol Cell 1998,
9:3273-3297.
8. Schneider TD: Information content of individual genetic
sequences. J Theor Biol 1997, 189:427-441.
9. Stormo GD, Fields DS: Specificity, free energy and information
content in protein-DNA interactions. Trends Biochem Sci 1998,
23:109-113.
10. Zhu G, Spellman PT, Volpe T, Brown PO, Botstein D, Davis TN,
Futcher B: Two yeast forkhead genes regulate the cell cycle
and pseudohyphal growth. Nature 2000, 406:90-94.
11. Hollenhorst PC, Pietz G, Fox CA: Mechanisms controlling differ-
ential promoter-occupancy by the yeast forkhead proteins
Fkh1p and Fkh2p: implications for regulating the cell cycle
and differentiation. Genes Dev 2001, 15:2445-2456.
12. Pierce M, Benjamin KR, Montano SP, Georgiadis MM, Winter E, Ver-
shon AK: Sum1 and Ndt80 proteins compete for binding to
middle sporulation element sequences that control meiotic
gene expression. Mol Cell Biol 2003, 23:4814-4825.
13. Lieb JD, Liu X, Botstein D, Brown PO: Promoter-specific binding
of Rap1 revealed by genome-wide maps of protein-DNA
association. Nat Genet 2001, 28:327-334.
14. Hanley JA, McNeil BJ: The meaning and use of the area under a
receiver operating characteristic (ROC) curve. Radiology
1982, 143:29-36.
15. Clarke ND, Granek JA: Rank order metrics for quantifying the
association of sequence features with gene regulation. Bioin-
S
C
CK X
1C
CK
i
i a,eff,X,i
i
i a,eff,XY,i,j
=−
+
++
+
++
1
1
11[] [
i
XXY]
==
∏∏
j
windows
Y
cooperative
factors
i 11==
∏
1
windows
R87.10 Genome Biology 2005, Volume 6, Issue 10, Article R87 Granek and Clarke />Genome Biology 2005, 6:R87
formatics 2003, 19:212-218.
16. Roth FP, Hughes JD, Estep PW, Church GM: Finding DNA regula-
tory motifs within unaligned noncoding sequences clustered
by whole-genome mRNA quantitation. Nat Biotechnol 1998,
16:939-945.
17. Boros J, Lim FL, Darieva Z, Pic-Taylor A, Harman R, Morgan BA, Shar-
rocks AD: Molecular determinants of the cell-cycle regulated
Mcm1p-Fkh2p transcription factor complex. Nucleic Acids Res
2003, 31:2279-2288.
18. Miller JA, Widom J: Collaborative competition mechanism for
gene activation in vivo. Mol Cell Biol 2003, 23:1623-1632.
19. Hepworth SR, Friesen H, Segall J: NDT80 and the meiotic recom-
bination checkpoint regulate expression of middle sporula-
tion-specific genes in Saccharomyces cerevisiae. Mol Cell Biol
1998, 18:5750-5761.
20. Xie J, Pierce M, Gailus-Durner V, Wagner M, Winter E, Vershon AK:
Sum1 and Hst1 repress middle sporulation-specific gene
expression during mitosis in Saccharomyces cerevisiae.
EMBO J 1999, 18:6448-6454.
21. Wang W, Cherry JM, Nochomovitz Y, Jolly E, Botstein D, Li H: Infer-
ence of combinatorial regulation in yeast transcriptional net-
works: a case study of sporulation. Proc Natl Acad Sci USA 2005,
102:1998-2003.
22. Djordjevic M, Sengupta AM, Shraiman BI: A biophysical approach
to transcription factor binding site discovery. Genome Res
2003, 13:2381-2390.
23. Liu X, Noll DM, Lieb JD, Clarke ND: DIP-chip: Rapid and accu-
rate determination of DNA-binding specificity. Genome Res
2005, 15:421-427.
24. Markstein M, Markstein P, Markstein V, Levine MS: Genome-wide
analysis of clustered Dorsal binding sites identifies putative
target genes in the Drosophila embryo. Proc Natl Acad Sci USA
2002, 99:763-768.
25. Berman BP, Nibu Y, Pfeiffer BD, Tomancak P, Celniker SE, Levine M,
Rubin GM, Eisen MB: Exploiting transcription factor binding
site clustering to identify cis-regulatory modules involved in
pattern formation in the Drosophila genome. Proc Natl Acad
Sci USA 2002, 99:757-762.
26. Rebeiz M, Reeves NL, Posakony JW: SCORE: a computational
approach to the identification of cis-regulatory modules and
target genes in whole-genome sequence data. Site clustering
over random expectation. Proc Natl Acad Sci USA 2002,
99:9888-9893.
27. Hertz GZ, Stormo GD: Identifying DNA and protein patterns
with statistically significant alignments of multiple
sequences. Bioinformatics 1999, 15:563-577.
28. Carroll KL, Pradhan DA, Granek JA, Clarke ND, Corden JL: Identi-
fication of cis elements directing termination of yeast non-
polyadenylated snoRNA transcripts. Mol Cell Biol 2004,
24:6241-6252.
29. Oliphant AR, Brandl CJ, Struhl K: Defining the sequence specifi-
city of DNA-binding proteins by selecting binding sites from
random-sequence oligonucleotides: analysis of yeast GCN4
protein. Mol Cell Biol 1989, 9:2944-2949.
30. Liu X, Brutlag DL, Liu JS: BioProspector: discovering conserved
DNA motifs in upstream regulatory regions of co-expressed
genes. Pac Symp Biocomput 2001:127-138.
31. Conlon EM, Liu XS, Lieb JD, Liu JS: Integrating regulatory motif
discovery and genome-wide expression analysis. Proc Natl
Acad Sci USA 2003, 100:3339-3344.
32. Benos PV, Bulyk ML, Stormo GD: Additivity in protein-DNA
interactions: how good an approximation is it? Nucleic Acids
Res 2002, 30:4442-4451.
33. Murtin C, Engelhorn M, Geiselmann J, Boccard F: A quantitative
UV laser footprinting analysis of the interaction of IHF with
specific binding sites: re-evaluation of the effective concen-
tration of IHF in the cell. J Mol Biol 1998, 284:949-961.
34. Saccharomyces Genome Database [ />yeast/]
35. van Rossum G, de Boer J: Interactively testing remote servers
using the python programming language. CWI Quarterly 1991,
4:283-303.
36. GOMER [ />37. Schneider TD, Stephens RM: Sequence logos: a new way to dis-
play consensus sequences. Nucleic Acids Res 1990, 18:6097-6100.
38. Wynne J, Treisman R: SRF and MCM1 have related but distinct
DNA binding specificities. Nucleic Acids Res 1992, 20:3297-3303.
39. Rice P, Longden I, Bleasby A: EMBOSS: the European Molecular
Biology Open Software Suite. Trends Genet 2000, 16:276-277.