Báo cáo y học: "The design of transcription-factor binding sites is affected by combinatorial regulation" pps
Bạn đang xem bản rút gọn của tài liệu. Xem và tải ngay bản đầy đủ của tài liệu tại đây (219.46 KB, 10 trang )
Genome Biology 2005, 6:R103
comment reviews reports deposited research refereed research interactions information
Open Access
2005Bilu and BarkaiVolume 6, Issue 12, Article R103
Research
The design of transcription-factor binding sites is affected by
combinatorial regulation
Yonatan Bilu
*
and Naama Barkai
*†
Addresses:
*
Department of Molecular Genetics, Weizmann Institute of Science, 76100 Rehovot, Israel.
†
Department of Physics of Complex
Systems, Weizmann Institute of Science, 76100 Rehovot, Israel.
Correspondence: Naama Barkai. E-mail:
© 2005 Bilu and Barkai; licensee BioMed Central Ltd.
This is an open access article distributed under the terms of the Creative Commons Attribution License ( which
permits unrestricted use, distribution, and reproduction in any medium, provided the original work is properly cited.
Design of transcription factor binding sites<p>Short abstract here</p>
Background: Transcription factors regulate gene expression by binding to specific cis-regulatory
elements in gene promoters. Although DNA sequences that serve as transcription-factor binding
sites have been characterized and associated with the regulation of numerous genes, the principles
that govern the design and evolution of such sites are poorly understood.
Results: Using the comprehensive mapping of binding-site locations available in Saccharomyces
cerevisiae, we examined possible factors that may have an impact on binding-site design. We found
that binding sites tend to be shorter and fuzzier when they appear in promoter regions that bind
multiple transcription factors. We further found that essential genes bind relatively fewer
transcription factors, as do divergent promoters. We provide evidence that novel binding sites tend
to appear in specific promoters that are already associated with multiple sites.
Conclusion: Two principal models may account for the observed correlations. First, it may be that
the interaction between multiple factors compensates for the decreased specificity of each specific
binding sequence. In such a scenario, binding-site fuzziness is a consequence of the presence of
multiple binding sites. Second, binding sites may tend to appear in promoter regions that are subject
to low selective pressure, which also allows for fuzzier motifs. The latter possibility may account
for the relatively low number of binding sites found in promoters of essential genes and in divergent
promoters.
Background
Gene expression is controlled through the action of transcrip-
tion factors, which bind specific DNA sequences in the
upstream region of genes and interact with the basic tran-
scription machinery to facilitate or repress transcription.
Characterizing the DNA sequences that serve as transcription
factor binding sites is an important first step toward elucidat-
ing the logic of transcription regulation. Indeed, advances in
experimental and computational methods generated a
genome-wide mapping of cis-regulatory elements in certain
model organisms, most notably the budding yeast Saccharo-
myces cerevisiae. In contrast, the principles that govern the
design and evolution of such sites are still poorly understood.
For example, it is not clear what controls the length or specif-
icity of cis-regulatory elements. These two properties appear
Published: 2 December 2005
Genome Biology 2005, 6:R103 (doi:10.1186/gb-2005-6-12-r103)
Received: 10 May 2005
Revised: 20 July 2005
Accepted: 8 November 2005
The electronic version of this article is the complete one and can be
found online at />R103.2 Genome Biology 2005, Volume 6, Issue 12, Article R103 Bilu and Barkai />Genome Biology 2005, 6:R103
to differ greatly between bacteria and eukaryotes; in
Escherichia coli the average length of a consensus motif is
24.5 base pairs (bp) [1], whereas the average motif length in
the fruit fly Drosophila is only 12.5 bp [2]. Similarly, whereas
the major sigma factor binding-site in E. coli has 12 conserved
positions [3], the analogous TATA box in eukaryotes is only 6
bp long [4]. Large differences in length also appear for bind-
ing sites within the same genome. For example, in Drosophila
engrailed binds a sequence of 7 bp whereas Adf-1 binds a 21
bp sequence.
Differences in binding-site length may reflect different strat-
egies for maintaining specificity and controlling for random
appearances of motifs in unregulated regions. For example,
the expected number of randomly appearing sequences of
length 24 bp in the E. coli genome is about 3.5 × 10
-7
(assum-
ing uniform nucleotide distribution). In contrast, spurious
appearances of short binding sites are abundant in the large
genome of multicellular eukaryotes. In fact, in eukaryotes
most apparent binding sites appearances are not functional.
Sequences that are short or 'fuzzy' (that is, far from the so-
called consensus motif) can still activate the transcription of
certain genes [5]. Specificity in this case requires the combi-
natorial action of several transcription factors. Indeed,
whereas bacterial transcription is typically controlled by a
single transcription factor [6], combinatorial regulation is
copious in eukaryotes, in which promoters containing 10-50
binding sites for 5-15 different transcription factors are not
unusual [7]. However, a direct link between combinatorial
regulation and binding-site specificity within the same organ-
ism has not yet been demonstrated.
In the present study we used comprehensive mapping of tran-
scription factor binding sites in S. cerevisiae to address, on a
genome-wide scale, the connection between the length or spe-
cificity of a binding site and the degree to which it participates
in combinatorial regulation. We further characterized the
genes whose regulation involves a large number of binding
sites, and the gene promoters that are most amenable to the
addition or deletion of binding sites. Based on this analysis,
we suggest that multiple occurrences of binding sites within a
promoter often reflect weaker negative selection on these
regions, allowing for the accretion of binding sites.
Results
The number of binding sites is correlated with
expression variability
To examine whether there is a connection between combina-
torial regulation and the length of transcription factor bind-
ing sites, we considered the comprehensive map of S.
cerevisiae binding site locations, derived by Harbison and
coworkers [8]. This map was generated using a ChIP-chip
assay, characterizing all promoter regions that bind a specific
transcription factor, followed by a computational analysis
that predicted the precise location of each binding site. All
together, the data set includes 9,715 binding sites for 102
transcription factors (about 30% of all putative factors), dis-
tributed among 2,928 gene promoters.
The number of binding sites varied greatly among gene pro-
moters. Whereas in most promoters at most one or two bind-
ing sites were identified, a fraction of genes (about 4%)
exhibited more than ten binding sites in their promoter
region (Figure 1a). Genes displaying multiple binding sites in
their promoter exhibit a more variable expression pattern
(Figure 1b; see Materials and methods, below), suggesting
that the number of binding sites appearing in a gene's pro-
moter can serve as a plausible measure of the degree of com-
binatorial regulation.
Binding sites for specific transcription factors are less
specific when they act in combination with other sites
To examine whether binding site properties depend on their
co-appearance with additional sites in the same promoter
region, we focused first on binding sites for specific transcrip-
tion factors. The factor that binds the largest number of genes
(293) is Reb1, whose well defined consensus binding site con-
sists of seven nucleotides. As expected, in most gene promot-
ers the predicted Reb1 binding site somewhat deviates from
the precise consensus. We considered whether this deviation
depends on the number of additional binding sites appearing
in the same promoter.
The match of the Reb1 binding site to its consensus motif
decreased sharply with the number of co-appearing binding
sites (Figure 2). Although this is particularly striking for Reb1,
similar behavior was observed for two-thirds of all 102 tran-
scription factors and for 82.5% of the 40 transcription factors
that regulate at least 50 genes (P = 5 × 10
-5
was estimated for
this number of factors, by randomly shuffling the binding
sites of each factor and assuming a normal distribution). We
conclude that binding sites for a specific transcription factor
tend to be less specific when they co-appear with additional
binding sites in the same promoter regions.
Because different factors often compete for the same binding
site [9], we considered whether the reduced precision of the
motif reflects the need to comply with several factors, and
perhaps also to tune the binding equilibrium between them.
However, our analysis does not support this possibility
because there was no significant difference between the fit to
the consensus of binding sites that overlap other binding sites
and of those that do not. In fact, for 25 of the 40 transcription
factors that regulate at least 50 genes, the average fit to the
motif was higher for binding sites that overlap other sites as
compared with those that do not (see Materials and methods,
below).
Genome Biology 2005, Volume 6, Issue 12, Article R103 Bilu and Barkai R103.3
comment reviews reports refereed researchdeposited research interactions information
Genome Biology 2005, 6:R103
Binding sites that appear in combination with other
sites tend to be shorter and less specific
The results above focus on a particular binding site and com-
pare its sequence in different promoter regions. We then con-
sidered whether binding sites that tend to appear in
promoters containing multiple sites are shorter, on average,
than are binding sites that act in isolation. To examine this,
we counted for each gene the number of binding sites in its
promoter and measured their average length (as it appears in
[8]). Indeed, there is a clear inverse correlation between these
two values; the higher the number of binding site, the shorter
is their average length (Figure 3a; Additional data file 7). Note
that length here is defined according to the motif consensus,
as indicated by Harbison and coworkers [8].
One possibility is that this negative correlation merely reflects
the fact that shorter binding sites appear more often (or are
predicted more often by the computational method used). To
control for this possibility, we examined the distribution of
correlations obtained by reshuffling the binding data. Indeed,
the observed correlation is 13.6 standard deviations away
from the mean of this random distribution, corresponding to
a P value of about 10
-42
(assuming a normal distribution).
Moreover, essentially the same results are obtained when
controlling for multiple appearance of the same binding sites,
and considering only the number of transcription factors that
bind the promoter (Additional data file 4). In contrast to the
total number of binding sites, this latter measure is independ-
ent of the computational methods used by Harbison and cow-
orkers [8] in defining binding sites.
Importantly, the negative correlation between the length of a
binding site and the number of additional sites appearing in
the same promoter region does not depend on the precise def-
inition of binding-site length. In fact, similar correlations,
with equivalent statistical significance, were observed also for
more refined definitions of binding-site length or 'fuzziness',
including Euclidean or KL distance of the motif from the
Distribution of binding sites numbers and correlation to gene expressionFigure 1
Distribution of binding sites numbers and correlation to gene expression. (a) Cumulative fraction of genes according the number of binding sites in their
promoter region. (b) Expression variance averaged over all genes with like number of binding sites in their promoter. The dashed red line shows the best
linear fit to the data points.
0 10 20
30 40
0.5
0.6
0.7
0.8
0.9
1
Number of binding sites
Cumulative fraction of genes
0 5 10 15
300
350
400
450
500
550
600
650
Number of binding sites
Variance of expression profile
(a) (b)
'Fuzziness' of Reb1 binding sitesFigure 2
'Fuzziness' of Reb1 binding sites. Average fit of Reb1 binding sites to the
consensus matrix, as a function of the number of binding sites within the
promoter they appear in.
0 2 4 6 8
0.15
0.2
0.25
0.3
0.35
0.4
Number of binding sites
Average fit to motif
R103.4 Genome Biology 2005, Volume 6, Issue 12, Article R103 Bilu and Barkai />Genome Biology 2005, 6:R103
background distribution, the average fit of a binding site to
the motif, and the probability of a given binding site to appear
at random (see Materials and methods, below; also see Addi-
tional data file 1).
Particularly informative is the fuzziness measure, which
describes the average fit of the motif to its consensus site
(Additional data file 1 [panel d]). Longer motifs are expected
to have more ambiguous positions than shorter ones because
there is some flexibility in defining the boundaries of a bind-
ing site, and also simply because there are more positions that
can be ambiguous. Indeed, when considering all appearances,
longer sites tend to be fuzzier than shorter ones (Additional
data file 2). Because motif length is negatively correlated with
the number of co-appearing sites (Figure 3a), the null hypoth-
esis is that motif fuzziness is negatively correlated with the
number of co-appearing sites. The observation that the oppo-
site phenomenon occurs (Additional data file 1 [panel d]) fur-
ther emphasizes the statistical significance of the correlation
between motif fuzziness and the number of co-appearing
binding sites.
Functional characterization of genes under
combinatorial control
Taken together, our results suggest that multiple binding sites
are associated with shorter and less specific binding
sequences. One possibility is that motif multiplicity allows for
mutations that decrease the length and specificity of the
Average promoter and gene properties as a function of the number of binding sitesFigure 3
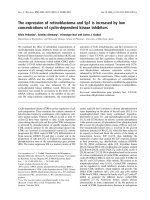
Average promoter and gene properties as a function of the number of binding sites. (a) Average binding site length. (b) Fraction of essential genes. (c)
Sum of expression correlations. (d) Fraction of binding sites that are 'new' (not conserved in other species). P values for the displayed correlations are as
follows: (a), 10
-42
; (b), 6 × 10
-7
; (c), 10
-16
; and (d), 10
-22
. Dashed red lines show the linear line that best matches the data points. Graphs show promoters
of up to 15 binding sites. These constitute 97% of the promoters for which data are available.
0 5 10 15
180
200
220
240
260
Number of binding sites
Sum of expression correlations
0 5 10 15
7.5
8
8.5
9
9.5
Number of binding sites
Average binding site length
0 5 10
1
5
0.05
0.1
0.15
0.2
0.25
Number of binding sites
Fraction of essential genes
0 5 10
15
0.2
0.3
0.4
0.5
0.6
0.7
Number of binding sites
Fraction of 'new' binding sites
(a) (b)
(c) (d)
Genome Biology 2005, Volume 6, Issue 12, Article R103 Bilu and Barkai R103.5
comment reviews reports refereed researchdeposited research interactions information
Genome Biology 2005, 6:R103
motif. In this model, interactions between factors can
compensate for the decreased specificity of each individual
site, ensuring precise expression of the associated gene.
Alternatively, shorter and fuzzier motifs may indicate lower
pressure to maintain precise control of the expression of the
associated gene. Lower selective pressure would allow for
mutations that reduce binding-site specificity on the one
hand, and would also allow for the addition of new binding
sites on the other. In this case, both binding-site fuzziness and
combinatorial regulation reflect the same gene property, but
they do not cause each other.
To try to differentiate between the two possibilities, we exam-
ined the properties of genes with promoters that exhibit a
large number of binding sites. Interestingly, we found that
essential genes (in rich glucose medium [10]) are over-repre-
sented among genes with few binding sites (Figure 3b). This
preferential appearance of binding sites in the promoter
regions of nonessential genes, the regulation of many of
which we conjecture to be under lower negative selection,
supports the possibility that binding site abundance depends
on the selective pressure acting on the region.
Genes that are not essential for growth in rich glucose
medium might still be essential for growth in other condi-
tions. To complement the analysis described above, we also
analyzed the number of binding sites upstream from genes
whose knockout led to slow and fast growth in different
growth mediums (Yeast Deletion Project [11,12]). As shown in
Table 1, in all five conditions for which data are available
those genes whose deletion leads to slow growth and whose
regulation we conjecture to be under stronger negative selec-
tion have, on average, few binding sites. Similarly, genes
whose deletion does not hamper growth tend to have a large
number of binding sites. We note, however, that these addi-
tional conditions are still only a subset of those that are of rel-
evance, and ultimately more experiments are needed to test
this hypothesis in full.
As another indicator of the functional importance of the tran-
scriptional regulation of a particular gene, we considered the
number of genes that are correlated with it. Indeed, genes
that are part of large co-regulated groups tend to exhibit a
lower number of binding sites in their promoter region, as
compared with genes that are co-regulated with only a few
genes (Figure 3c; P = 10
-16
). A similar although less significant
(P = 0.04) correlation was observed for genes that participate
in large protein complexes [13].
The gene properties above provide only an indirect indication
of the functional importance of a gene and thus of the selec-
tive pressure to maintain its expression. Perhaps a more
direct way to identify promoters that are under negative
selective pressure is to differentiate between promoters that
potentially regulate two genes on the two opposing strands
('divergent promoters') and those that regulate only one. The
former group is likely to be under stronger negative selection
because mutations there will potentially effect the regulation
of both genes. Indeed, as can be seen in Figure 4, divergent
promoters tend to exhibit a lower number of binding sites,
supporting the proposal that binding site multiplicity reflects
lower selection pressure on promoter regions.
Finally, we also looked for Gene Ontology terms associated
with sets of genes whose promoters exhibit an exceptionally
high or low average number of binding sites (Table 2). Genes
involved in metabolism appear to have a higher number of
binding sites, but this enrichment is only marginally signifi-
cant (P values shown are the probability for a set of this size
to have the observed average number of binding sites).
'Preferential attachment' pattern for the addition of
new binding sites
Our findings are consistent with a model whereby increased
fuzziness and increased number of binding sites both reflect
reduced selection pressure to maintain precise expression. To
examine this possibility from a different angle, we considered
whether new binding sites tend to appear preferentially in
some promoter regions. If multiple sites merely compensate
Table 1
Average number of binding sites for genes leading to slow and fast growth
Medium Low growth rate High growth rate P
Average number of sites Number of genes Average number of sites Number of genes
YPD 1.3563 174 1.9530 3642 6.8 × 10
-5
YPDGE 1.3133 233 1.9588 3569 1.2 × 10
-5
YPG 1.4188 351 1.9844 3521 9.1 × 10
-7
YPE 1.4108 370 1.9951 3447 3 × 10
-7
YPL 1.4114 333 1.9832 3572 5.6 × 10
-7
The overall average is 1.87. Media: YPD, 2% glucose; YPDGE, 0.1% glucose, 3% glycerol, and 2% ethanol; YPE, 2% ethanol; YPG, 3% glycerol; and YPL,
2% lactate.
R103.6 Genome Biology 2005, Volume 6, Issue 12, Article R103 Bilu and Barkai />Genome Biology 2005, 6:R103
for binding-site specificity, then no specific trend is expected.
By contrast, if multiple sites (and the fuzziness of binding
sites) reflect reduced constraints on gene expression control,
then new binding sites would be expected to appear in pro-
moters of genes that already exhibit a large number of bind-
ing sites. Indeed, their appearance in such regions is probably
less likely to be selected against.
To examine the appearance of new binding sites, we used the
data comparing the conservation of binding sites between S.
cerevisiae and the three sensu stricto species whose genomes
were recently sequenced [14]. It is likely that sites that are
conserved in these species were also present in the genome of
the common ancestor and thus represent ancient binding
sites. In contrast, binding sites that are not conserved in any
of the species may represent the new additions to the S. cere-
visiae genome.
We found that new binding sites tend to appear in promoter
regions that already contain a large number of binding sites
(Figure 3d). By randomly shuffling the binding-site data, we
estimated this observation to be highly significant (P is
approximately 10
-22
, assuming a normal distribution).
Discussion
Specific regulation of gene expression can be realized either
by employing a small number of transcription factors with
long, unambiguous binding sites, or by employing a larger
number of factors, with short, fuzzy motifs. The strategy for
transcription regulation in E. coli represents one extreme of
this approach - most genes are regulated by only one or two
transcription factors [6]. On the other extreme are multicellu-
lar eukaryotes, whose promoter regions tend to be long and
contain many short transcription factor binding sites [7].
Combinatorial regulation is certainly more likely to evolve in
species in which binding sites are short and fuzzy, precisely
because spurious appearances will occur relatively frequently
[15]. Moreover, it might be required because of the greater
complexity of eukaryotes [16,17]. Motif fuzziness may be
explained by the type of regulation required, for instance
when several transcription factors bind the promoter region,
and the required logic is that of an AND gate (as in the enhan-
ceosome of interferon-ß in humans [4]). The low affinity for
each factor ensures that it initiates transcription only in com-
bination with the other factors and not by itself. In addition,
the motif fuzziness might have to do with the fact that in
eukaryotes many transcription factors are enhancers, which
have less stringent constraints on their appearance [5].
In this work, which focuses on binding site organization
within a single organism, we suggest that fuzziness and co-
appearance of binding sites may also indicate lower selection
pressure to maintain a precise expression pattern of these
genes. We provided three pieces of evidence that support this
possibility. First, we found a lower level of combinatorial reg-
ulation for essential genes and for genes that are part of a
large co-expressed module. It is likely that the expression of
these genes is more tightly controlled. Similarly, promoters
that potentially control two genes ('divergent promoter'),
which are also expected to be under stricter selection, tend to
have fewer binding sites as well. In addition, we found that
new binding sites tend to appear in promoters of genes that
already contain a large number of binding sites. Taken
together, these results suggest that gene functionality affects
the probability that a new binding site will evolve.
A conservative interpretation of this claim is that new binding
sites will appear at random where they are not selected
against, allowing them the time to evolve toward a more
advantageous combination that will lead to specific regula-
Distribution of 'divergent' promotersFigure 4
Distribution of 'divergent' promoters. The fraction of promoters that
potentially regulate two genes in each subset of promoters with an equal
number of binding sites.
0 5 10 1
5
0.35
0.4
0.45
0.5
0.55
0.6
0.65
0.7
Number of binding sites
Fraction of 'divergent' promoters
Table 2
Average number of binding sites according to GO annotations
GO term Number of
genes
Average
number of sites
P
Metabolism 511 2.02 0.02
Transferase activity 263 2.07 0.06
Amino acid metabolism 68 2.04 0.22
RNA metabolism 65 2.02 0.24
DNA metabolism 60 2.17 0.17
Binding 103 1.22 0.05
Protein modification 49 1.39 0.25
The overall average is 1.72. GO, Gene Ontology.
Genome Biology 2005, Volume 6, Issue 12, Article R103 Bilu and Barkai R103.7
comment reviews reports refereed researchdeposited research interactions information
Genome Biology 2005, 6:R103
tion for different conditions. Alternatively, such stochastic
accretion of binding sites may be taken to support previous
observations of fitness-neutral variation in binding sites pat-
terns [18,19], and theoretical models for motif fuzziness [20]
and position of transcription initiation sites [21]. It might also
provide insight to the actual mechanism that allows promoter
sequences to evolve, within the context of theories for neutral
evolution of gene expression [22,23].
Interestingly, our observation that multiple binding sites are
associated with a more variable gene expression profile is
explained differently by these two models. In the first it is
interpreted as indicating that the gene's expression is tightly
regulated, resulting in widely varying levels under varying
conditions. In the latter the variable expression profile of
many genes is interpreted as being 'fuzzy', due to multiple,
nonprecise binding sites. A key goal in distinguishing
between these two possibilities is therefore to determine
whether expression of genes with multiple binding sites is
tightly controlled or, rather, very 'noisy'. With availability of
the full library of green fluorescent protein tagged yeast pro-
teins, this can now be tested directly.
Materials and methods
Map of transcription factor binding sites
Harbison and coworkers [8] compiled a list of 9,715 binding
sites for 102 transcription factors along the S. cerevisiae
genome. This is largely based on ChIP-chip data, in which
binding was determined with high confidence (P < 0.001).
An array of computational methods was then employed to
determine the exact location of each binding site. In addi-
tion, the conservation of each site is reported, that is, the
number of sensu strictu strains (S. paradoxus, S. mikatae,
and S. bayanus) in which it appears. About half the binding
sites (51.2%) were found to be conserved in at least two other
species.
We define the promoter region of a gene as the 1,000 bp
upstream of its translation start site, as listed in the Saccha-
romyces Genome Database [24]. Under this definition, for
2,928 genes there is at least one relevant binding site listed in
the dataset. Figure 1a shows the distribution of the number of
binding sites among promoter regions.
Binding-site motifs
Based on the discovered binding sites, Harbison and cowork-
ers [8] constructed, for each transcription factor, a probabil-
ity matrix for the motif it binds. For a motif of length l, this is
a 4-by-l non-negative matrix, in which each column describes
the nucleotide distribution in the corresponding position (for
example, the sum of each column is 1).
The length of motifs ranges from 5 bp to 19 bp, and the aver-
age length in this dataset is 9.3 bp.
Expression data
Ihmels and coworkers [25] compiled a dataset of 1,011 expres-
sion profiles; for each gene and each of 1,011 experimental
conditions it lists the log ratio between the observed expres-
sion level and the control level. The data were compiled from
about 200 environmental stresses conditions, about 100 cell
cycle conditions, about 100 sporulation time points, about
300 deletion mutants, about 50 mating-related conditions,
and several others.
We define the expression variability of each gene as the sum
of squares of these values. This can be thought of as the vari-
ance of the log ratio, if we expect the mean to be zero (expres-
sion level in experimental condition = control level). We
define the level of co-regulation of two genes as the normal-
ized inner product of their expression profiles.
Essential genes
Giaever and coworkers [10] compiled a list of 1,100 genes that
were found to be essential for growth via single knockout
experiments. Of these, 505 have at least one binding site in
their promoter region, as per the definition given above.
Growth rates
The Yeast Deletion Project [12] lists relative growth rates for
4,706 homozygous diploid deletion strains, in five different
growth mediums: YPD (2% glucose), YPDGE (0.1% glucose,
3% glycerol, and 2% ethanol), YPE (2% ethanol), YPG (3%
glycerol), and YPL (2% lactate). We defined 'slow growers' as
those strains whose growth rate is at most 75% of wild-type
in both reported time courses, and 'fast growers' as those
whose growth rate is at least 95% of wild-type in both time
courses.
Table 1 lists the average number of binding sites for genes
whose deletion leads to slow and fast growth. P values were
estimated by drawing, at random, subsets of genes of equal
size to those listed, and computing the standard deviation of
the average number of binding sites over such subsets. From
these, Z scores were computed for the real data, and the P val-
ues were estimated assuming a normal distribution.
Measures of fuzziness
We suggest four ways to measure the fuzziness of a binding
site or of a motif. The first two methods can be thought of as
refinements to simply looking at the length of a motif. The
third and fourth measure fuzziness more directly:
Euclidean distance from background
A motif of length l is represented by a 4-by-l matrix M (as
described under Binding-site motifs, above). Let B be the 4-
by-l matrix corresponding to the background distribution;
that is, each column contains the overall nucleotide fre-
quency (31% for A and T, 19% for C and G). The Euclidean
distance of a motif from the background is simply the Eucli-
R103.8 Genome Biology 2005, Volume 6, Issue 12, Article R103 Bilu and Barkai />Genome Biology 2005, 6:R103
dean distance between M and B, and is given by the follow-
ing expression:
KL distance from background
Let M and B be as described above. We define the KL distance
(Kullback-Leibler distance, also called relative entropy [26])
of a motif from the background as the sum of KL distances
between the columns of M and B:
This is essentially the same evaluation as that used by Frech
and coworkers [27].
Average fit to motif
Let s be a binding site of length l. Each such site is associated
with a matrix M (as above), which describes the consensus
distribution over all sites bound by the same transcription
factor. We define the fit of s to M at position i as the probabil-
ity listed in column i of matrix M for the nucleotide at position
i of s. We define the average fit of s to M as the average of these
values.
Probability of site to occur at random
For a binding site s, this is simply the product of the probabil-
ities that each nucleotide in s will be seen, according to the
background distribution.
Measure of correlation
The data set of 2,928 genes for which binding site information
is available was partitioned according to the number of such
sites in the gene's promoter region. For each gene, various
properties, such as the average length of a binding site in its
promoter region, were computed.
We denote as S
i
the subset of genes with i binding sites in their
promoter regions. For a given property P, we denote its value
for a gene g by P
g
, and we define as follows:
Figures showing correlation of various properties to the
number of binding sites depict as a function of i (for exam-
ple, Figure 3a–d). We note that the variance of the values P
g
tends to be high in the data set and is not displayed.
To determine whether a property is positively correlated or
negatively correlated with the number of binding sites, define
for each gene g a point (i, P
g
) in the plane, where i is the
number of binding sites in the promoter region of gene g. Let
l
obs
be the linear line that best fits the points (in the sense that
it minimizes the sum of squares of the distances). The sign of
the slope of l
obs
defines the correlation as positive or negative.
It should be emphasized that we do not expect a linear rela-
tion between the points, and so measuring the Pearson corre-
lation between them is inappropriate. The slope of l
obs
is
simply an ad hoc quantifiable measure of whether the corre-
lation is negative or positive.
Measure of correlation for a specific transcription
factor
A similar procedure to that described above is taken when cal-
culating how well binding sites for a specific factor match the
overall motif, as a function of the combinatorial regulation in
which this factor is involved.
We define the fit of binding site s to a probability matrix M
describing the corresponding motif as above. The fit of s to M
at position i is the probability listed in column i of matrix M
for the nucleotide at position i of s. The overall fit of s to M,
denoted f
s
, is the product of these probabilities. In other
words, it is the probability that such a sequence will be gener-
ated according to the probability matrix M.
Let T be some transcription factor, and let R be the set of pro-
moter regions to which T binds. Partition R according to the
number of binding sites in the promoter (for any factor). Let
R
i
be the subset of promoter regions with i binding sites, and
let S
i
be the set of all binding sites for T that appear in some
promoter region in R
i
. The average fit of binding sites associ-
ated with T over promoter regions with i binding sites is given
by the following equation:
Figure 2a depicts as a function of i for the transcription
factor Reb1.
Estimating the correlation significance
To estimate the significance of a correlation we use random
simulation. In each simulation, the binding sites are shuffled
at random while keeping the number of sites within each pro-
moter region the same as in the true data. That is, the binding
sites map is reordered according to a random permutation.
For each gene g, the value of the relevant property (for
example, average binding-site length) is then recalculated
from the shuffled sites. The random values are used to derive
a set of points (I, ), as above, and a linear line l
rand
that
best fits these points is constructed.
Repeating this simulation n times gives us an estimate of the
mean value of l
rand
and its standard deviation. In the results
()
,,
,
MB
ij ij
ij
−
∑
2
MMB
ij ij ij
ij
,,,
,
log( / )⋅
∑
P
i
PP
i
S
g
gS
i
i
=
∈
∑
1
||
P
i
f
S
f
i
i
s
sS
i
=
∈
∑
1
||
f
i
P
g
rand
P
g
rand
Genome Biology 2005, Volume 6, Issue 12, Article R103 Bilu and Barkai R103.9
comment reviews reports refereed researchdeposited research interactions information
Genome Biology 2005, 6:R103
reported here, n = 10
5
, and for all of the examined scenarios
none of the random slopes was as steep as the observed one.
When estimating the significance of the correlation between
combinatorial regulation and whether a gene is essential (Fig-
ure 3b), the tagging of the genes (essential/nonessential) was
shuffled, rather than the binding sites.
Similar simulations were used to estimate the significance of
correlation to the number of transcription factors. In doing
so, the genes are partitioned according to the number of fac-
tors that bind their promoter regions, rather than the number
of sites, and the analysis was carried out in the same way as
described above.
Alternative measures for combinatorial regulation
In the analysis discussed, the total number of binding sites,
regardless of whether they correspond to the same transcrip-
tion factor or to different ones, was used as a measure of com-
binatorial control. We repeated the analysis using the number
of transcription factors that bind the promoter region, rather
than the total number of binding sites, for this purpose (Addi-
tional data files 3 [panel a] and 4). Moreover, the analysis was
also repeated on two restricted subsets of promoters: for one,
in each promoter all binding sites are associated with the
same transcription factor (Additional data files 3 [panel b]
and 5); and for the other, in each promoter each binding site
is associated with a different factor (Additional data files 3
[panel c] and 6). Although these three scenarios probably rep-
resent different definitions for combinatorial control, similar
results were obtained in nearly all cases.
Additional data files
The following additional data are included with the online
version of this article: a figure depicting the effective length
and fuzziness of motifs as a function of the number of binding
sites in the promoter region (Additional data file 1); a figure
depicting the correlation between fit of binding sites to the
motif and the length of the motif (Additional data file 2); a fig-
ure depicting the distribution of promoters according to the
number of associated transcription factors/binding sites
(Additional data file 3); a figure depicting average promoter
and gene properties as a function of the number of transcrip-
tion factors (Additional data file 4); a figure depicting average
promoter and gene properties as a function of the number of
binding sites, for promoters to which exactly one factor binds
(Additional data file 5); a figure depicting average promoter
and gene properties as a function of the number of binding
sites, for promoters for which each factor has exactly one
binding site (Additional data file 6); and a figure depicting the
distribution of correlations between motif length and number
of binding sites in randomly shuffled data (Additional data
file 7).
Additional data file 1A figure depicting the effective length and fuzziness of motifs as a function of the number of binding sites in the promoter regionA figure depicting the effective length and fuzziness of motifs as a function of the number of binding sites in the promoter regionClick here for fileAdditional data file 2A figure depicting the correlation between fit of binding sites to the motif and the length of the motifA figure depicting the correlation between fit of binding sites to the motif and the length of the motifClick here for fileAdditional data file 3A figure depicting the distribution of promoters according to the number of associated transcription factors/binding sitesA figure depicting the distribution of promoters according to the number of associated transcription factors/binding sitesClick here for fileAdditional data file 4A figure depicting average promoter and gene properties as a func-tion of the number of transcription factorsA figure depicting average promoter and gene properties as a func-tion of the number of transcription factorsClick here for fileAdditional data file 5A figure depicting average promoter and gene properties as a func-tion of the number of binding sites, for promoters to which exactly one factor bindsA figure depicting average promoter and gene properties as a func-tion of the number of binding sites, for promoters to which exactly one factor bindsClick here for fileAdditional data file 6A figure depicting average promoter and gene properties as a func-tion of the number of binding sites, for promoters for which each factor has exactly one binding siteA figure depicting average promoter and gene properties as a func-tion of the number of binding sites, for promoters for which each factor has exactly one binding siteClick here for fileAdditional data file 7A figure depicting the distribution of correlations between motif length and number of binding sites in randomly shuffled dataA figure depicting the distribution of correlations between motif length and number of binding sites in randomly shuffled dataClick here for file
Acknowledgements
We thank Tzachi Pilpel, Noa Rappaport, and Itay Tirosh for helpful com-
ments and discussions. We thank Ben Gordon for his help with the ChIP-
Chip data. This work was supported by the NIH grant no. A150562 and a
grant from the Kahn fund for Systems Biology at the Weizmann institute of
science. Y.B. is supported by the Dewey David Stone Postdoctoral
Fellowship.
References
1. Robison K, McGuire AM, Church GM: A comprehensive library
of DNA-binding site matrices for 55 proteins applied to the
complete Escherichia coli K-12 genome. J Mol Biol 1998,
284:241-254.
2. Matys V, Fricke E, Geffers R, Gossling E, Haubrock M, Hehl R, Hor-
nischer K, Karas D, Kel AE, Kel-Margoulis OV, et al.: TRANSFAC:
transcriptional regulation, from patterns to profiles. Nucleic
Acids Res 2003, 31:374-378.
3. Lisser S, Margalit H: Compilation of E. coli mRNA promoter
sequences. Nucleic Acids Res 1993, 21:1507-1516.
4. Carey M, Smale ST: Transcriptional Regulation in Eukaryotes Cold Spring
Harbor, New York: CSHL Press; 1999.
5. Struhl K: Fundamentally different logic of gene regulation in
eukaryotes and prokaryotes. Cell 1999, 98:1-4.
6. Gralla JD, Collado-Vides J: Organization and function of tran-
scription regulatory elements. In Cellular and Molecular Biology:
Escherichia coli and Salmonella 2nd edition. Edited by: Neidhardt FC,
Ingraham J, Lin ECC, Low KB, Magasanik B, Reznikoff W, Schaechter
M, Umbarger HE, Riley M. Washington, DC: American Society for
Microbiology; 1996:1232-1245.
7. Wray GA, Hahn MW, Abouheif E, Balhoff JP, Pizer M, Rockman MV,
Romano LA: The evolution of transcriptional regulation in
eukaryotes. Mol Biol Evol 2003, 20:1377-1419.
8. Harbison CT, Gordon DB, Lee TI, Rinaldi NJ, Macisaac KD, Danford
TW, Hannett NM, Tagne JB, Reynolds DB, Yoo J, et al.: Transcrip-
tional regulatory code of a eukaryotic genome. Nature 2004,
431:99-104.
9. Karin M: Too many transcription factors: positive and nega-
tive interactions. New Biol 1990, 2:126-131.
10. Giaever G, Chu AM, Ni L, Connelly C, Riles L, Veronneau S, Dow S,
Lucau-Danila A, Anderson K, Andre B, et al.: Functional profiling
of the Saccharomyces cerevisiae genome. Nature 2002,
418:387-391.
11. Steinmetz LM, Scharfe C, Deutschbauer AM, Mokranjac D, Herman
ZS, Jones T, Chu AM, Giaever G, Prokisch H, Oefner PJ, et al.: Sys-
tematic screen for human disease genes in yeast. Nat Genet
2002, 31:400-404.
12. Yeast Deletion Project and Proteomics of Mitochondria
Database [ />YDPM_index.html]
13. Han JD, Bertin N, Hao T, Goldberg DS, Berriz GF, Zhang LV, Dupuy
D, Walhout AJ, Cusick ME, Roth FP, et al.: Evidence for dynami-
cally organized modularity in the yeast protein-protein
interaction network. Nature 2004, 430:88-93.
14. Kellis M, Patterson N, Endrizzi M, Birren B, Lander ES: Sequencing
and comparison of yeast species to identify genes and regu-
latory elements. Nature 2003, 423:241-254.
15. Stone JR, Wray GA: Rapid evolution of cis-regulatory
sequences via local point mutations. Mol Biol Evol 2001,
18:1764-1770.
16. Rubin GM, Yandell MD, Wortman JR, Gabor Miklos GL, Nelson CR,
Hariharan IK, Fortini ME, Li PW, Apweiler R, Fleischmann W, et al.:
Comparative genomics of the eukaryotes. Science 2000,
287:2204-2215.
17. Mattick JS, Gagen MJ: Mathematics/computation. Accelerating
networks. Science 2005, 307:856-858.
18. Ludwig MZ, Patel NH, Kreitman M: Functional analysis of eve
stripe 2 enhancer evolution in Drosophila: rules governing
conservation and change. Development 1998, 125:949-958.
19. Ludwig MZ, Bergman C, Patel NH, Kreitman M: Evidence for sta-
bilizing selection in a eukaryotic enhancer element. Nature
2000, 403:564-567.
20. Gerland U, Hwa T: On the selection and evolution of regula-
tory DNA motifs. J Mol Evol 2002, 55:386-400.
21. Lynch M, Scofield DG, Hong X: The evolution of transcription-
initiation sites. Mol Biol Evol 2005, 22:1137-1146.
R103.10 Genome Biology 2005, Volume 6, Issue 12, Article R103 Bilu and Barkai />Genome Biology 2005, 6:R103
22. Khaitovich P, Weiss G, Lachmann M, Hellmann I, Enard W, Muetzel
B, Wirkner U, Ansorge W, Paabo S: A neutral model of transcrip-
tome evolution. PLoS Biol 2004, 2:E132.
23. Yanai I, Graur D, Ophir R: Incongruent expression profiles
between human and mouse orthologous genes suggest wide-
spread neutral evolution of transcription control. Omics 2004,
8:15-24.
24. Saccharomyces Genome Database [ />yeast/]
25. Ihmels J, Bergmann S, Barkai N: Defining transcription modules
using large-scale gene expression data. Bioinformatics 2004,
20:1993-2003.
26. Kearns MJ, Vazirani U: An Introduction to Computational Learning Theory
Cambridge, MA: MIT Press; 1994.
27. Frech K, Herrmann G, Werner T: Computer-assisted prediction,
classification, and delimitation of protein binding sites in
nucleic acids. Nucleic Acids Res 1993, 21:1655-1664.