Báo cáo y học: "Discovery of biological networks from diverse functional genomic data" ppt
Bạn đang xem bản rút gọn của tài liệu. Xem và tải ngay bản đầy đủ của tài liệu tại đây (804.78 KB, 16 trang )
Genome Biology 2005, 6:R114
comment reviews reports deposited research refereed research interactions information
Open Access
2005Myerset al.Volume 6, Issue 13, Article R114
Method
Discovery of biological networks from diverse functional genomic
data
Chad L Myers
*†
, Drew Robson
‡
, Adam Wible
*
, Matthew A Hibbs
*†
,
Camelia Chiriac
†
, Chandra L Theesfeld
§
, Kara Dolinski
†
and
Olga G Troyanskaya
*†
Addresses:
*
Department of Computer Science, Princeton University, 35 Olden Street, Princeton, NJ 08544, USA.
†
Lewis-Sigler Institute for
Integrative Genomics, Carl Icahn Laboratory, Princeton University, Princeton, NJ 08544, USA.
‡
Department of Mathematics, Princeton
University, Washington Road, Princeton, NJ 08540, USA.
§
Department of Genetics, School of Medicine, Mailstop-S120, Stanford University,
Stanford, CA 94305-5120, USA.
Correspondence: Olga G Troyanskaya. E-mail:
© 2005 Myers et al; licensee BioMed Central Ltd.
This is an open access article distributed under the terms of the Creative Commons Attribution License ( which
permits unrestricted use, distribution, and reproduction in any medium, provided the original work is properly cited.
Biological networks discovery<p>BioPIXIE is a probabilistic system for query-based discovery of pathway-specific networks through integration of diverse genome-wide data.</p>
Abstract
We have developed a general probabilistic system for query-based discovery of pathway-specific
networks through integration of diverse genome-wide data. This framework was validated by
accurately recovering known networks for 31 biological processes in Saccharomyces cerevisiae and
experimentally verifying predictions for the process of chromosomal segregation. Our system,
bioPIXIE, a public, comprehensive system for integration, analysis, and visualization of biological
network predictions for S. cerevisiae, is freely accessible over the worldwide web.
Background
Understanding biological networks on a whole-genome scale
is a key challenge in modern systems biology. Broad availabil-
ity of diverse functional genomic data from protein-protein
interaction, gene expression, localization, and regulation
studies should enable fast and accurate generation of network
models through computational prediction and experimental
validation. Reliability of experimental results varies among
data sets and technologies, however, and these data generally
provide only pair-wise evidence for biological relationships
between genes or proteins. Most cellular mechanisms, on the
other hand, involve groups of genes or gene products that
behave in a coordinated way to perform a specific biological
process. We will refer to such groups of functionally related
genes as process-specific networks. Although a wide variety of
functional genomic data is available, and much has been
learned from them, we are far from exploiting the full poten-
tial of these data for discovering such process-specific net-
works. There are several reasons for this: lack of accessibility
to data and methods to analyze them, barriers to incorporat-
ing expert knowledge in the network discovery process, and
noise and heterogeneity in high-throughput gene data.
The first problem is simply the lack of accessibility of both the
data and analysis methods. Even when data are publicly avail-
able, results are often buried in large files, and computational
methods developed to analyze them are often not available in
forms that the typical biologist can use. Thus, experimental
researchers are unable to identify interesting results from
computational studies that are worth verifying. Instead, most
biologists are limited to what the authors of such studies
deem important or interesting enough to highlight in the
written publication. Our ability to effectively utilize genomic
data for process-specific network discovery has thus been
Published: 19 December 2005
Genome Biology 2005, 6:R114 (doi:10.1186/gb-2005-6-13-r114)
Received: 1 July 2005
Revised: 31 August 2005
Accepted: 21 November 2005
The electronic version of this article is the complete one and can be
found online at />R114.2 Genome Biology 2005, Volume 6, Issue 13, Article R114 Myers et al. />Genome Biology 2005, 6:R114
hampered by the lack of effective interfaces to both the data
and the relevant analysis methods.
The second challenge is to allow biology researchers to inte-
grate their biological knowledge in analysis. When biologists
inquire about particular biological processes, they bring with
them existing knowledge that can and should be used to gen-
erate the most sensitive and precise hypotheses possible.
Such information is hard to extract automatically, and effec-
tively incorporating biological expert knowledge is of course
closely linked to the accessibility challenge noted above. Most
previous methods for process-specific network prediction
have not allowed biologists to use their previous knowledge in
their area of interest to target the analysis process. Biological
research demands convenient and accessible systems that
leverage existing knowledge to direct and facilitate discovery.
The third challenge in constructing accurate process-specific
networks from diverse genomic data lies in the heterogeneity
and high noise levels in large-scale data sets. High-through-
put data by nature are often noisy and simple combinations of
results from different types of experiments (for example, con-
clusions of genome-scale two-hybrid experiments and micro-
array studies) are of limited effectiveness because they
sacrifice either sensitivity or specificity.
Recent applications of probabilistic data integration to the
related but simpler problem of predicting protein function
from diverse genomic data have demonstrated that inte-
grated analysis of heterogeneous sources provides a substan-
tial increase in prediction accuracy. Much of the work in
function prediction focuses on fusing information from mul-
tiple heterogeneous sources for pairs of proteins to make
more reliable statements about pair-wise functional relation-
ships. Bayesian networks [1,2] and variations of this approach
[3-5] have been applied successfully to construct 'functional
linkage maps' whose connecting edges represent probabilistic
support for a functional relationship between the adjacent
proteins. Protein functions are then inferred through 'guilt by
association' with surrounding nodes of known function. Sev-
eral studies have formalized this 'guilt by association'
approach by using Markov Random Field models to propa-
gate known functional annotations through confidence-
weighted edges [6-8].
Despite much investigation into heterogeneous data integra-
tion for the purpose of function prediction, there have been
only limited attempts to use confidence-weighted linkage
maps from integrated data to address the more biologically
significant problem of how to group functionally related pro-
teins together into process-specific networks. These network-
level questions are distinctly different from function predic-
tion problems and require new methodology for general data
integration and network discovery. Previous work in identify-
ing groups of genes involved in specific biological pathways
from interaction networks has focused on mainly binary
interactions, which are prone to false positives and inade-
quate coverage when only limited types of genomic evidence
are used. For instance, two studies [9,10] describe
approaches for finding highly connected subgraphs in binary
interaction graphs from high-throughput experiments. They
found that highly connected groups in these graphs often cor-
respond to protein complexes or biological processes.
Another study [11] introduced the notion of modular decom-
position of protein-protein interaction networks to make
inferences about pathways. While these approaches have
demonstrated the promise of using protein-protein interac-
tion networks for recognizing groups of proteins involved in
specific processes, they are constrained by their reliance on
limited types of interaction data and their use of binary,
rather than probabilistic networks. A recent study extended
these approaches to a weighted interaction network and used
graph clustering analysis to detect coordinated functional
modules [12]. A common theme among many of these studies
is their unsupervised approach to network detection. Incor-
porating expert knowledge in the search process, however,
can dramatically improve both the specificity and sensitivity
of process-specific network discovery from protein-protein
interaction data.
To our knowledge, the only existing work that leverages
expert knowledge in constructing biological networks or pro-
tein complexes from integrated data is a network reliability
approach to protein complex recovery [13] and a greedy
search algorithm applied to a confidence-weighted protein-
protein interaction network [14]. The former was specifically
targeted towards protein complexes, while we focus on the
more general problem of discovering not just physically inter-
acting sets of proteins, but functional or process-specific net-
works. The latter algorithm, proposed by Bader [14],
leveraged both physical and genetic interaction data with the
goal of extracting more general protein networks. Distinc-
tions between Bader's and our approach are that we integrate
functional genomic data in a Bayesian framework that allows
a probabilistic, rather than heuristic, graph search. This prob-
abilistic search incorporates both direct and indirect protein-
protein links while integrating a wider variety of data (for
example, microarray expression, co-localization). Further-
more, we are the first to our knowledge to develop an interac-
tive, web-accessible system that both facilitates discovery of
novel biological networks and allows exploratory analysis of
the underlying genomic data that support these predictions.
To address these challenges to discovering process-specific
networks from functional genomic data, we have created a
publicly available system called bioPIXIE (biological Process
Inference from eXperimental Interaction Evidence). The sys-
tem allows users to enter a set of proteins and then uses a
novel probabilistic graph search algorithm on a protein-pro-
tein linkage map derived from diverse genomic data to pre-
dict the surrounding process-specific network for the local
neighborhood of interest. Most importantly, the system
Genome Biology 2005, Volume 6, Issue 13, Article R114 Myers et al. R114.3
comment reviews reports refereed researchdeposited research interactions information
Genome Biology 2005, 6:R114
includes a convenient interface for dynamic visualization of
the resulting predictions and provides analysis of their func-
tional coherence. We have completed an extensive evaluation
of our method against known pathways as well as experimen-
tally verified a subset of predictions made by our system.
Results
Evaluation of the method on known biological
networks
Our system achieves accurate network prediction by effec-
tively integrating diverse data sets and probabilistically iden-
tifying new components of process-specific networks given
only one or a few known members. We evaluated the ability of
our approach to recover known process-specific networks
given initial query sets by using a collection of well-annotated
functional groups, including KEGG pathways, sets of biologi-
cal process GO terms, and MIPS protein complexes. We
restricted our evaluation to groups of 15 to 250 total proteins
in which at least half of the member proteins had one type of
evidence linking them with another member protein. We
identified 31 such groups from the set of KEGG pathways,
MIPS protein complexes, and GO terms (see Additional data
file 2 and supplemental Table S1 in [15]). We evaluated the
performance of our method on each group by sampling 100
random query sets consisting of 10 proteins each from the
pathway or complex of interest, applying our data integration
and search algorithm, and analyzing the returned set of pro-
teins for consistency with the remaining proteins in the
group.
The advantage of using bioPIXIE to integrate multiple types
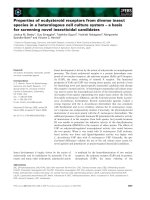
of genomic data is illustrated in Figure 1a-c for three diverse
KEGG pathways (graphs for all 31 processes are available in
supplemental Figure S2 in [15]). bioPIXIE dramatically and
consistently improves the number of network components
recovered over any of the individual types of evidence. For
example, for KEGG cell cycle proteins (Figure 1a), given a ran-
dom 10-protein query set, we identified an average of 42 of
the remaining 77 proteins using integrated data, whereas only
25 were identified by either physical or genetic evidence, and
only 18 by microarray evidence alone. Different evidence
types have varying degrees of relevance for different path-
ways - microarray correlation is very informative for ribos-
ome proteins (Figure 1b) whereas physical interactions are
more informative for proteins involved in ATP synthesis (Fig-
ure 1c).
This advantage of integrating diverse data types is confirmed
in a more comprehensive evaluation of bioPIXIE's perform-
ance, where we averaged results over the entire set of 31 proc-
esses and complexes described above. Figure 1d compares the
precision-recall characteristics of our network identification
method using Bayesian integrated data versus using individ-
ual evidence types. Given only 10 query genes, the integrated
version recovered 50% of the remaining members at a preci-
sion of 30% whereas the method applied to independent sub-
sets achieved only 15% (physical association), 10% (genetic
association), and 3% (microarray correlation) precision at the
same recall (Figure 1d). Thus, combining data from multiple
sources clearly improves network recovery.
One might expect that due to the relative sparseness of cur-
rent functional genomic data, simple combinations of these
sources followed by a straightforward search would be suffi-
cient for precise network recovery. However, such combina-
tions are substantially less effective than our approach, as
shown in Figure 1e, which plots the average precision-recall
characteristics of two such approaches to integration and
recovery. The first approach ('Binary recovery') uses all avail-
able evidence, but only as a binary 'yes' or 'no', depending on
whether evidence of any type is present for a particular pro-
tein pair. Given a query, connected proteins are then added in
an arbitrary order. The second approach ('Counting-based
recovery') also uses all available evidence but counts observed
evidence for each pair such that overlaps between multiple
sources of evidence receive higher weights. Proteins are then
added in order of weight for network recovery. Neither of
these simpler approaches achieves accuracy similar to that of
our method. In fact, the counting-based approach yields a 4-
fold lower prediction precision than our approach and the
binary approach results in a 10-fold lower prediction preci-
sion at 50% recall.
In addition to these two naive methods, we have also com-
pared our system to two previously published methods for
query-based protein complex discovery, SEEDY [13] and
Complexpander [14]. bioPIXIE's performance is superior to
both existing methods; it achieves an average of 30% preci-
sion at 50% recall while SEEDY yields 12% and Complex-
pander 7% at 50% recall (Figure 1f). Furthermore, calculating
the average area under the precision-recall curve (AUC) for
each pathway individually, we find that the average bioPIXIE
AUC exceeds the average SEEDY AUC by more than one
standard deviation for 22 of the 31 groups, while SEEDY out-
performs only bioPIXIE for only 1 of the 31 groups (Addi-
tional data file 3 and supplemental Figure S4 in [15]).
Similarly bioPIXIE outperforms Complexpander for 26 of the
31 groups, while the converse never occurs (Additional data
file 3 and supplemental Figure S4 in [15]).
There are several reasons for the superior performance of
bioPIXIE. A major factor in its improvement is the robust
integration of a wide variety of genomic data. Both Asthana et
al[13] and Bader [14] focused their integration methodology
on physical interactions data (two-hybrid and affinity precip-
itation data). Our goal is to predict process-specific networks
rather than only complexes, which requires a more general
integration method applicable beyond physical interactions.
These diverse data types have varying degrees of information
across different complexes and processes, as evident from the
three KEGG pathways illustrated in Figure 1 and a broader
R114.4 Genome Biology 2005, Volume 6, Issue 13, Article R114 Myers et al. />Genome Biology 2005, 6:R114
Figure 1 (see legend on next page)
0 0.1 0.2 0.3 0.4 0.5 0.6 0.7 0.8 0.9 1
0
0.2
0.4
0.6
0.8
1
Recall
( TP / [TP + FN] )
Precision
( TP/ [TP +FP] )
Integrated evidence
Physical association evidence
Genetic association evidence
Microarray correlation evidence
Performance of individual evidence types
0 0.1 0.2 0.3 0.4 0.5 0.6 0.7 0.8 0.9 1
0
0.2
0.4
0.6
0.8
1
Recall
( TP/[TP + FN] )
Precision
( TP/[TP + FP] )
bioPIXIE recovery
Binary recovery
Countingbased recovery
Comparison with naive methods
0 0.1 0.2 0.3 0.4 0.5 0.6 0.7 0.8 0.9 1
0
0.2
0.4
0.6
0.8
1
Recall
( TP / [TP + FN] )
Precision
( TP / [TP + FP] )
bioPIXIE recovery
SEEDY recovery
Complexpander recovery
Comparison with existing methods
0
5
10
15
20
25
Number of proteins recovered
0 50 100 150 200 250 300
0
0.2
0.4
0.6
0.8
1
Total graph size
Fraction of pathway recovered
Integrated evidence
Physical association evidence
Genetic association evidence
Microarray correlation evidence
0
10
20
30
40
50
60
70
80
Number of proteins recovered
0 50 100 150 200 250 300
0
0.2
0.4
0.6
0.8
1
Total graph size
Fraction of pathway recovered
Integrated evidence
Physical association evidence
Genetic association evidence
Microarray correlation evidence
0
10
20
30
40
50
60
70
80
90
100
110
120
130
140
Number of proteins recovered
0 50 100 150 200 250 300
0
0.2
0.4
0.6
0.8
1
Total graph size
Fraction of pathway recovered
Integrated evidence
Physical association evidence
Genetic association evidence
Microarray correlation evidence
Cell cycle (KEGG sce04110)
ATP synthesis (KEGG sce00193)
Ribosome (KEGG sce03010)
(a)
(b)
(c)
(d)
(e)
(f)
Genome Biology 2005, Volume 6, Issue 13, Article R114 Myers et al. R114.5
comment reviews reports refereed researchdeposited research interactions information
Genome Biology 2005, 6:R114
study of bioPIXIE's performance on subsets of evidence (see
Additional data file 3). Our Bayesian integration can robustly
incorporate these data, which allows us to harness the infor-
mation from heterogeneous data types without sacrificing
specificity.
The search algorithm applied to the resulting integrated
probabilistic network is also a factor in bioPIXIE's improve-
ment over existing approaches. Our algorithm incorporates
information about both direct and indirect links between can-
didate proteins and the query set in a way that favors tightly
connected groups. SEEDY returns the weight of the maxi-
mum confidence link between a candidate protein and any
member of the query set, which only takes into account direct
connections and uses little information about the topology of
the network. Furthermore, the maximum is susceptible to
noise in both the query set and weights between pairs of pro-
teins. A single erroneous high-confidence link can bring a
candidate protein into the result set. The other algorithm
included for comparison, Complexpander, samples several
random binary networks whose edges are present with prob-
ability corresponding to the confidence in that interaction.
Proteins are ranked by the fraction of random networks in
which there exists a path, up to a maximum length (default of
four), from each protein to the query set. Although this algo-
rithm uses more information than SEEDY, both in terms of
topology and indirect links, we found its performance to scale
poorly with increased density of the weighted interaction net-
work. Specifically, as more genomic data are included in the
integration, the probabilistic integrated network becomes
more populated, resulting in many more possible (probability
>0) paths between any one protein and a particular query set.
There are so many paths that the fraction of random binary
networks with paths to the query set is no longer a discrimi-
native measure, which results in more false positives.
Although such a method might be appropriate for sparse
data, it does not appear to work well when larger datasets are
applied to the problem of query-based complex or pathway
recovery.
Another factor in the performance of our method is its robust-
ness to the quality and size of the query set. For each of the 31
groups of proteins described earlier, we evaluated the recov-
ery performance for 20 query proteins, of which between 1
and 19 were randomly chosen from the entire proteome and
the rest were chosen from the appropriate process or com-
plex. All 31 groups could tolerate 25% query set noise with less
than a 10% reduction in the average AUC; 27 of those could
tolerate 50% query set noise, and 14 of those could tolerate up
to 75% random proteins in the query set (see supplemental
Figure S5 in [15]). Thus, our method is robust to imperfect
query sets. We also evaluated the recovery performance over
a range of query set sizes from 4 to 60 proteins to determine
whether there was a noticeable decline in performance for
very small query sets. We found that, in general, the quality of
the network recovered from a pure query set of 4 to 5 proteins
is comparable to the result of a much larger query (40 to 50
proteins) on the same process, suggesting that relatively few
proteins are required to obtain a signal (supplemental Figure
S6 in [15]). For instance, with only a 4-protein query set,
bioPIXIE's maximum AUC score was within 10% of the max-
imum AUC score obtained on up to 60-protein query sets for
22 of the 31 processes (see supplemental Figure S6 in [15] for
supporting plot).
The query-driven nature of the search algorithm is a key fac-
tor in the accuracy of our method. The relationships between
query proteins selected by the user affect which neighboring
proteins are added to the final network. Thus, the network
resulting from a query is not simply a sub-section of the com-
plete integrated protein-protein interaction graph rooted at
the query proteins; rather, it is probabilistically biased by the
network search algorithm toward the specific biological con-
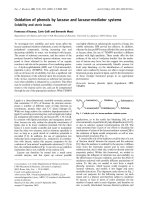
text represented in the query set. Figure 2 illustrates this
effect for the query protein Rad23. Rad23 is known to form a
complex with Rad4 (NEF2) and participate in nucleotide
excision repair [16]. Recent work has also suggested that
Rad23 facilitates DNA repair by inhibiting the degradation of
specific substrates in response to DNA damage [17,18].
Depending on which partners are included in a query with
Rad23, the network recovered by our system can focus on
Rad23's involvement in nucleotide excision repair or in ubiq-
uitin-dependent protein catabolism. For instance, when the
query includes DNA repair proteins Rad4, Rad3, and Rad24
bioPIXIE network recovery evaluationFigure 1 (see previous page)
bioPIXIE network recovery evaluation. (a-c) Typical network recovery performance for three KEGG pathways. For all pathways, ten proteins from the
pathway were randomly picked as a query set. The results of 100 independent query set samplings are shown. The fraction of the total known process
components recovered is plotted versus the size of the graph grown from the query set. (d-f) An average over 31 KEGG pathways, GO biological
processes, and MIPS complexes. Performance is measured and reported as the trade-off between precision (the proportion of correct pathway
components returned to the total size of the returned network) and recall (the proportion of correct pathway components returned to the number of
total non-query pathway proteins). Precision and recall are derived from true positives (TP), false positives (FP), and false negatives (FN) as noted in the
axis labels. (d) The improvement gained by using our network prediction algorithm on a Bayesian integration of genomic evidence compared to separate
evidence types. bioPIXIE shows considerable improvement in both the number of known member proteins recovered and the precision of predicted
members for the integrated evidence over any individual evidence type. (e) The improved network recovery offered by the bioPIXIE algorithm versus
more naïve approaches to integration and graph search. Specifically, we plot the performance of bioPIXIE on integrated data against a naïve binary
approach for which information from all evidence types is used but only as a binary 'yes' or 'no' relationship, and a more sophisticated approach where
overlapping evidence receives higher weights and connected proteins are recovered in order of confidence. (f) Comparison of the performance of
bioPIXIE to two existing methods for query-based protein complex recovery [13,14].
R114.6 Genome Biology 2005, Volume 6, Issue 13, Article R114 Myers et al. />Genome Biology 2005, 6:R114
Figure 2 (see legend on next page)
(a)
(b)
Genome Biology 2005, Volume 6, Issue 13, Article R114 Myers et al. R114.7
comment reviews reports refereed researchdeposited research interactions information
Genome Biology 2005, 6:R114
in addition to Rad23, the recovered network of 44 total pro-
teins (Figure 2a) is highly enriched for DNA repair
(GO:0006281), with 22 of the 44 having direct or indirect
annotations (P value < 10
-22
). However, when Rad23 is
entered as a query with proteasome components Pup1, Pre6,
Rpn12, the resulting network (Figure 2b) is instead enriched
for ubiquitin-dependent catabolism (GO:0006511), with 36
of the 44 having direct or indirect annotations (P value < 10
-
55
). Rad23 has high-confidence relationships with several
proteins in both processes, but the recovered network
returned by our system is dependent on the context implied
by the query. This query-driven context facilitates accurate
recovery of network components related to the biological
process or pathway of interest.
Experimental validation of novel network components
bioPIXIE does not simply recapitulate known biology, but it
also predicts novel network components based on the diverse
types of input data. In fact, the 'false positives' identified by
bioPIXIE in the evaluation above may be novel discoveries or
known proteins that interact very closely with the biological
process in question but are not annotated to it by the current
standard. Thus, although the computational evaluation above
is an accurate comparative evaluation of the methods, we
wanted to experimentally confirm the quality of predictions
made by our method. We have done so by using bioPIXIE to
generate hypotheses about previously uncharacterized pro-
teins in yeast and experimentally testing these hypotheses.
Specifically, for several biological processes of interest, we
entered member proteins as queries and identified uncharac-
terized proteins consistently returned in the predicted net-
works. One biological process with high-confidence
uncharacterized proteins was the process of chromosomal
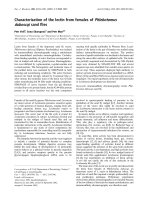
segregation. In yeast strains null for these genes (YPL017C,
YPL077C, and YPL144W), we observed a significantly
increased number of large-budded cells with a single nucleus
at the bud neck compared to wild-type populations (for exam-
ple, 75% compared to 22% in wild type, Fisher exact test P
value of 5 × 10
-9
for YPL017C), which is consistent with the
phenotype of mutants known to affect chromosome segrega-
tion such as ctf4∆ [19] (Figure 3 and supplemental Figure S8
in [15]). This example demonstrates that bioPIXIE facilitates
experimental design by providing high-confidence predic-
tions that can be readily tested experimentally using standard
molecular biology techniques. Overall, we have observed
1,006 uncharacterized yeast genes with links to known bio-
logical processes, and we are able to make high-confidence
predictions for 92 of them (supplemental Table S3 in [15]).
Example use of the system: Prediction of novel targets
for the Cdc37-Hsp90 complex
We expect that bioPIXIE will be a convenient and effective
tool for biologists to explore the growing sets of functional
genomic data as well as direct further experimentation in
their domains of interest. As an example of this type of explor-
atory analysis, we used bioPIXIE to examine the Cdc37-
Hsp90 complex and found evidence for previously uncharac-
terized roles in important processes. Hsp90 is a molecular
chaperone that participates in the folding of several proteins,
including signaling kinases and hormone receptors, which
are involved in growth and apoptotic pathways; it has thus
been identified as a possible anticancer drug target. Hsp90 is
a highly conserved protein found in organisms from bacteria
to humans, and there are two Hsp90 homologs in yeast,
HSC82 and HSP82 (reviewed in [20-22]).
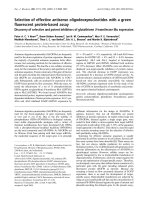
Using bioPIXIE, we were able to identify known and novel
targets of Hsp90 and its co-chaperones, in particular Cdc37.
Cdc37 and other proteins associated with Hsp90 are thought
both to function as chaperones themselves and potentially to
determine Hsp90 target specificity. Cdc37 interacts with
Hsp90 and is involved in the folding of protein kinases
(CDKs, MAP kinases), and previous work has suggested that
Cdc37 might be a general kinase chaperone [23]. When Cdc37
is entered as a seed protein into bioPIXIE, our algorithm
detects associations between Cdc37 and several kinases that
are known interaction partners (Cdc28 [21,24,25], Mps1 [26],
Cak1 [24,25], Ste11 [27,28], Cdc5 [24]) (Figure 4). In addi-
tion, bioPIXIE predicts previously uncharacterized connec-
tions between Cdc37 and the protein kinase Ctk1, based on
high-throughput affinity precipitation, thus providing further
support for the hypothesis that Cdc37 may be a general kinase
chaperone.
Furthermore, our algorithm predicts a potential novel role of
the Cdc37-Hsp90 complex in DNA replication. Specifically,
bioPIXIE identifies connections between components of this
complex and Cdc7, a serine/threonine kinase involved in rep-
lication origin firing, which is regulated by Dbf4 in a manner
analogous to the way that CDKs are regulated by cyclins [29].
Our system predicts this interaction (confidence of 0.49)
based on a combination of two hybrid evidence and
bioPIXIE query-driven context illustrationFigure 2 (see previous page)
bioPIXIE query-driven context illustration. Nodes represent proteins, and edges represent functional links between them. Edge color indicates the
confidence of the links ordered by color from red (highest confidence), orange, yellow, to green (lowest confidence). Query proteins are indicated by gray
nodes. Rad23 is known to form a complex with Rad4 (NEF2) and participate in nucleotide excision repair and has also been implicated in inhibiting the
degradation of specific substrates in response to DNA damage. (a) Rad23 was entered with Rad4, Rad3, and Rad24 and the resulting network is enriched
(22 of 44, P value < 10
-22
) for DNA repair proteins (GO:0006281). (b) Rad23 was entered with proteasome components Pup1, Pre6, Rpn12 and the
recovered network is enriched (36 of 44, P value < 10
-55
) for ubiquitin-dependent catabolism proteins (GO:0006511) and only contains 2 DNA repair
proteins (Rad6 and Rad23). Rad23 has high-confidence relationships with several proteins in both processes, but the network recovery algorithm is
dependent on the context of the query, which results in two different views of Rad23 and its neighbors.
R114.8 Genome Biology 2005, Volume 6, Issue 13, Article R114 Myers et al. />Genome Biology 2005, 6:R114
correlated expression data. Although this putative interaction
was identified in a two hybrid screen, it was not further char-
acterized [24]. In further support of the DNA replication link,
bioPIXIE also identifies previously uncharacterized interac-
tionsbetween Cdc7 and two other members of the Hsp90
complex, Sti1 and Cpr7(supplemental Figure S9 in [15]). Sti1
is also functionally linked to Dbf4, a regulator of Cdc7, by the
algorithm on the basis of a high-throughput genetic interac-
tion [30] and correlated gene expression in a microarray
experiment [31]. Because our system integrates diverse data
sources, it highlights interesting interactions that may other-
wise go unnoticed. Furthermore, bioPIXIE's network identi-
fication and interactive exploration features allow generation
of novel, experimentally testable hypotheses, in this case that
Cdc37-Hsp90 complexes may have a previously uncharacter-
ized role in some aspect of DNA replication.
Functional links across biological pathways
Our approach of combining data integration with a method
for process-specific network discovery provides a convenient
framework for addressing biological questions at a higher
level. Thus, in addition to constructing specific and testable
hypotheses about individual biological processes, we can use
the system to discover novel interplay, or cross-talk, among
Experimental validation of bioPIXIE prediction for the biological role of YPL017CFigure 3
Experimental validation of bioPIXIE prediction for the biological role of YPL017C. bioPIXIE was used to predict previously uncharacterized genes likely to
participate in processes related to chromosomal segregation (data for YPL017C shown). Yeast cells were fixed, stained, and photographed using
differential interference contrast imaging and 4'-6-diamidino-2-phenylindole (DAPI) staining. When compared with wild-type cells, populations of cells
lacking YPL017C have a higher proportion of large-budded cells with a single nucleus at the bud neck (75% compared to 22% in wild type, Fisher exact test
P value of 5 × 10
-9
). Large budding cells are indicated by arrows. This morphology and failure of nuclear separation are analogous to that of ctf4∆ mutants
[19], supporting the hypothesis that YPL017C, like CTF4, is involved in chromosome segregation. See Figure S8 in [15] for experimental verification of
YPL077C and YPL144W.
Differential interference contrast
DAPI
Wild type
YPL017C
Genome Biology 2005, Volume 6, Issue 13, Article R114 Myers et al. R114.9
comment reviews reports refereed researchdeposited research interactions information
Genome Biology 2005, 6:R114
biological networks. To investigate possible cross-talk among
biological networks, we start with a single functional group as
our query set, use bioPIXIE to predict additional network
components, and analyze the resulting superset of proteins
for statistical enrichment of other functional groups. By
repeating this for each process of interest, we can construct a
map of cross-talk that represents a variety of high-level bio-
logical relationships (see Materials and methods for details of
this analysis). We have applied this approach to map func-
tional links among a set of 363 KEGG pathways, GO catego-
ries, and co-regulated transcription factor targets. By using
this variety of classification systems, we can detect links
across different biological relationships - from biological
roles (GO process ontology) to cellular locations (GO compo-
nent ontology) to metabolic pathways (KEGG). Upon map-
ping cross-talk among these groups, we clustered the results
to reveal biologically significant groups of inter-related proc-
esses (Figure 5 and supplemental Figure S10 and Table S4 in
[15]).
This analysis identifies several known or expected relation-
ships between networks with related functions. For example,
one would expect that the processes of actin cytoskeleton
organization, vesicle-mediated transport, and budding would
be well connected with each other, and that proteins involved
in these processes would share similar functional links to pro-
teins localized to the sites of polarized growth or proteins that
when mutated cause morphological defects. Indeed, these
groups of genes are found in a tight cluster in our cross-talk
analysis (Figure 5, top cluster).
bioPIXIE output for Cdc37Figure 4
bioPIXIE output for Cdc37. Nodes represent genes, and edges represent functional links between them. Edge color indicates the confidence of the links
ordered by color, from red (highest confidence), orange, yellow, to green (lowest confidence). In this example, CDC37 was entered as input (gray node);
other genes displayed (white nodes) were identified by the bioPIXIE prediction algorithm. Red nodes indicate that the gene is uncharacterized. These
results and networks for other proteins can be viewed at [54].
R114.10 Genome Biology 2005, Volume 6, Issue 13, Article R114 Myers et al. />Genome Biology 2005, 6:R114
In addition to such clusters that are expected based on cur-
rent biological knowledge, we also identified novel relation-
ships. For example, one such cluster contains four previously
unrelated groups, namely genes that have Swi5 binding sites,
genes with Ino2 binding sites, proteins with lyase activity, and
genes that have Cbf1 binding sites. Swi5 activates genes
expressed at the M/G1 boundary and during G1 phase of the
cell cycle, and Ino2 regulates expression of phospholipid bio-
synthetic genes. Cbf1 is required for the function of centro-
meres and MET gene promoters, and recent work suggests a
general role for Cbf1 in chromatin remodeling [32]. These
four groups are found in the same cluster because they share
significant links with ribosome biogenesis and assembly,
nucleolus, RNA binding, and RNA metabolism. This suggests
an explicit, functional link among the processes of cell cycle
regulation, transcriptional regulation, inositol metabolism
and protein synthesis.
Although the cross-talk across all of these biological processes
has not yet been well characterized, evidence in the literature
supports these predicted connections.
For instance, the expression pattern of CBF1, INO2, or SWI5
is well correlated with the expression of NOP7 (for example,
as cells undergo diauxic shift and during sporulation, CBF1
and NOP7 are co-expressed with a Pearson correlation of
greater than 0.8 [33-35]). Du and Stillman [36] found that
Nop7/Yph1, a protein required for the biogenesis of 60S
ribosomal subunits [37-39], associates with the origin recog-
nition complex, cell cycle-related proteins, and MCM pro-
teins. As cells are depleted of Nop7p, they exhibit cell cycle
arrest, and in wild-type cells, Nop7 levels vary in response to
different carbon sources [39]. Taken together, these previous
experimental results support our prediction linking meta-
bolic pathways, the cell cycle, and ribosome assembly. It is
important to note that while the characterization of Nop7 is
consistent with this prediction, the individual experiments
with Nop7 described above were not part of the input data to
our system. Rather, our system was able to make the pre-
dicted links across these functional groups based on other
heterogeneous, and mostly high throughout, data through
bioPIXIE integration and network analysis. Thus, cross-talk
analysis using bioPIXIE is effective in identifying novel
A map of cross-talk between 363 biological groups in S. cerevisiaeFigure 5
A map of cross-talk between 363 biological groups in S. cerevisiae. The combination of our Bayesian data integration system and our network discovery
algorithm allows us to find biologically significant cross-talk among known biological groups. The interaction matrix was generated based on 363 KEGG
pathways, GO categories, and co-regulated transcription factor targets. Rows of this matrix correspond to the query group and columns correspond to
potential cross-talk partner processes; red boxes signify statistically significant links. The cross-talk matrix has been clustered [58] to reveal tightly
connected groups of interacting processes (clusters in this matrix correspond to sets of groups who interact with same partners). Highlighted clusters are
discussed in the text. See supplemental Figure S10 in [15] for a complete, labeled map.
cell cycle defects
conditional phenotypes
cytoskeleton
organelle organization and biogenesis
cytoskeleton organization and biogenesis
cell morphology and organelle mutants
protein binding
motor activity
microtubule -based process
microtubule cytoskeleton organization
transport
vesicle-mediated transport
site of polarized growth
bud
actin cytoskeleton organization and biogenesis
cell cortex
cell budding
establishment and/or maintenance of cell polarity
signal transduction
morphogenesis
mating and sporulation defects
signal transducer activity
MAPK signaling pathway
cell wall organization and biogenesis
carbohydrate metabolism
aminosugars metabolism
RLM1 binding site
cell cortex
PHD1 binding site
actin cytoskeleton organization and biogenesis
STE12 binding site
plasma membrane
SWI4 binding site
pseudohyphal growth
protein kinase activity
cytokinesis
inositol phosphate metabolism
nicotinate and nicotinamide metabolism
site of polarized growth
carbohydrate metabolism
bud
starch and sucrose metabolism
benzoate degradation via CoA ligation
morphogenesis
vesicle-mediated transport
cell budding
establishment and/or maintenance of cell polarity
signal transduction
cell wall organization and biogenesis
MAPK signaling pathway
cell wall
CBF1 binding site
lyase activity
INO2 binding site
SWI5 binding site
RNA metabolism
RNA binding
ribosome biogenesis and assembly
nucleolus
Genome Biology 2005, Volume 6, Issue 13, Article R114 Myers et al. R114.11
comment reviews reports refereed researchdeposited research interactions information
Genome Biology 2005, 6:R114
interplay among pathways, biological processes, cellular loca-
tions, and regulatory modules.
Discussion
We have developed bioPIXIE, an analysis and visualization
system for the discovery of biological process-specific net-
works. bioPIXIE's public interface allows researchers to use
their knowledge to explore novel and previously known com-
ponents of a variety of biological processes. The system pro-
vides detailed information about experimental sources for
each prediction, including links to original literature, and can
be used to generate testable hypotheses. It is important to
note that predictions made by bioPIXIE require further
experimental validation; we hope that the public availability
of our system and all results presented here will encourage
such verification by yeast biology laboratories.
A key strength of our system is in addressing network-level
behavior as opposed to focusing purely on pair-wise protein
relationships. This is critical because many biologically signif-
icant questions involve the behavior of groups of proteins in
networks or the interplay among networks with different
functions. Furthermore, from a computational standpoint,
the network-level approach to analysis and modeling of bio-
logical data is beneficial because subtle but coordinated group
behavior can provide a more accurate picture of biological
relationships than can be detected through pair-wise protein
linkages. Although we focus on discovering networks,
bioPIXIE can also be used for function prediction of individ-
ual proteins. Functions of uncharacterized proteins can be
predicted either by analyzing uncharacterized components
that are returned by the system given a known query set or by
using an uncharacterized protein itself as the query, building
the local interaction graph around it with our network-dis-
covery algorithm, and analyzing the proteins in the final
graph for statistical enrichment for particular functions.
Another advantage of bioPIXIE is the probabilistic nature of
the method that can easily adapt to new types of data. In the
future, bioPIXIE will incorporate additional data sets from
sources already modeled by the system as well as data from
new approaches such as protein microarrays.
Another future direction for our method is to use process-spe-
cific neighborhoods generated by the system as a starting
point for deciphering more precise details of biological rela-
tionships. Our notion of functional relationship is intention-
ally rather general so a wide variety of biological interactions
can be detected. However, developing detailed models of how
groups of functionally related proteins specifically relate to
each other requires more precise definitions of relationships.
We propose our method as a way to pinpoint groups of pro-
teins acting together, after which other methods can be
applied to investigate details of relationships between these
proteins. This narrowing process will undoubtedly improve
downstream computational approaches.
Finally, our method may be applicable to higher eukaryotes.
Additional challenges for such applications include handling
multiple cell types, less comprehensive sets of functional
genomics data, and incomplete genome annotation. Our
method is general, and by extending the Bayesian network
structure to organism-specific data sources and learning the
corresponding integration weights from available annotation
data, bioPIXIE can enable discovery and accurate modeling
of previously uncharacterized process-specific networks in a
diverse range of organisms. It is important to stress that the
success of applying our method and other related approaches
to higher eukaryotes depends on public availability of func-
tional genomics data for these organisms and continued
improvement of their annotation data, ideally through expert
curation.
Conclusions
We have developed a novel probabilistic methodology for
identification of biological process-specific networks based
on diverse genomic data and have used this methodology to
create a fully functional system for network analysis and vis-
ualization. bioPIXIE allows researchers to identify novel
pathway components and to study specific interactions
among them. Predictions made by our system are specific
enough to be tested using common molecular biology tech-
niques. Using this approach, we have accurately modeled
multiple known processes in Saccharomyces cerevisiae,
characterized unknown components in these processes, and
identified novel cross-talk relationships. We are making
bioPIXIE publicly available through the web to ensure that
analysis and interpretation of accurate network predictions
we generate, as well as the underlying data, are conveniently
accessible to biological researchers.
Materials and methods
Our method relies on four critical components: Bayesian inte-
gration of heterogeneous data; an expert-driven search para-
digm; a probabilistic graph search algorithm; and an easily
accessible interface for interpretation of the results (Figure
6). In simple terms, bioPIXIE integrates different types of
data (for example, gene expression, interaction data, high-
throughput or single experiments) using a Bayesian frame-
work that is learned from proteins (or genes) that are known
to be functionally linked. This Bayesian data integration step
reduces the heterogeneous input data to protein pairs with a
score indicating the likelihood that they functionally interact,
allowing different types of data to be combined with each
other. Then, given a protein or group of proteins as a query set
(the expert-driven search component), a novel probabilistic
algorithm considers the integrated pair-wise relationships to
build a local process-specific network around the query
proteins.
R114.12 Genome Biology 2005, Volume 6, Issue 13, Article R114 Myers et al. />Genome Biology 2005, 6:R114
Bayesian integration of heterogeneous data
This component uses a Bayesian network to integrate diverse
data to derive a probabilistic linkage map among proteins.
Functional genomic input data
We have collected a diverse set of evidence from over 950
publications from several databases, including complete
physical and genetic interaction data from the GRID and
BIND databases (downloaded on 6/25/04), which contain
both high-throughput interaction data sets and some interac-
tions from individual experiments curated from the literature
[35,40,41]. We also make use of cellular localization data
[42], curated sequence data in the form of shared transcrip-
tion factor binding sites from the Saccharomyces cerevisiae
Promoter Database (SCPD) [43], and biological complex
curated literature from the Saccharomyces Genome Data-
base (SGD) [35]. Additionally, we have collected gene expres-
sion data from 10 different microarray studies, totaling more
than 300 arrays and 29 distinct biological conditions
[31,33,34,44-50]. Pearson correlation between genes across
each set of related conditions is used as a measure of similar-
ity. Correlation coefficients in each dataset are converted to
Z-scores and combined across datasets. References to all
sources of genomic data are listed in [51].
Bayesian network structure and conditional probabilities
Given these diverse data, we can answer questions about pair-
wise protein relationships using a Bayesian network that lev-
erages our previous work [2]. A Bayesian network essentially
weights each evidence type according to a measure of confi-
Overview of the bioPIXIE systemFigure 6
Overview of the bioPIXIE system. Diverse data sets are integrated with a Bayesian network, which weighs each evidence type probabilistically based on its
accuracy (a). This Bayesian integration produces a graph with confidence-weighted relationships between each gene pair (characterized in supplemental
Figure S1 in [15]). Based on this integrated network graph and a user-defined query set of proteins of interest (b), the network prediction algorithm
identifies novel network components by finding proteins with the maximum expected number of direct and indirect relationships with the query set (c).
The resulting network is then displayed to the user using a spring model layout, such that the geometric proximity of genes reflects how related they are
to each other, and the edge color reflects the confidence of pair-wise connections (d). Details of each component are presented in Materials and methods.
User-selected seed set entered via a web-accessible interface
Gene expression dataset 1
Transcription factor binding sites
Gene expression dataset 2
Gene expression dataset N
Yeast two-hybrid dataset 1
Co-precipitation dataset 1
Gene expression
Physical interactions
Genetic interactions
Synthetic lethality dataset
Synthetic rescue dataset
Sequence & text
Localization
Curated literature
Data integration via a Bayesian
network weights each evidence
type probabilistically based on its
accuracy and coverage
1
2
3
g
w
4
h
14
5
h
15
3
(a)
(b
)
(c)
(d)
Pathway prediction via a probabilistic
algorithm that considers direct and indirect
connections of each gene to the seed
gene set
Results displayed in a dynamic visualization
Genome Biology 2005, Volume 6, Issue 13, Article R114 Myers et al. R114.13
comment reviews reports refereed researchdeposited research interactions information
Genome Biology 2005, 6:R114
dence in the source of that evidence and then estimates the
posterior probability that a relationship exists between two
proteins given all observed data [52]. The critical components
of such a network are the structure, which determines rela-
tionships between evidence nodes, and the conditional prob-
ability tables (CPTs), which capture the reliability of each
evidence type. The structure of the network used here is
expert-based and derived from our previous work [2]. Unlike
our previous work, which also relied on experts for estimating
the CPTs, here we generalize the framework and automati-
cally learn the CPT for each evidence type using protein-pro-
tein relationships inferred by the GO biological process
ontology.
Specifically, we obtained gold standard protein-protein rela-
tionships for learning the network CPTs by propagating each
biological process annotation up to its ancestors and counting
the number of unique annotations per GO term. Because the
biological specificity of each term roughly corresponds to the
number of total annotations, we chose two thresholds to
define the set of positive (functionally related) and negative
(not functionally related) protein pairs. Protein pairs whose
most specific co-annotation occurs in GO terms of 300 total
annotations or less were considered positives, while pairs
whose most specific co-annotation occurs in GO terms of
1,000 total annotations or more were considered negatives.
The resulting set of positive and negative protein pairs can
also be downloaded from the online supplement [15].
Given this set of gold standard pairs, we used the expectation-
maximization algorithm [53] to compute the CPTs. As expec-
tation-maximization is guaranteed to identify a local, not glo-
bal, maximum on the likelihood surface, we computed a
reasonable starting point for the algorithm based on inde-
pendent counting of individual evidence sources. We used a
discrete Bayesian network, and continuous-valued microar-
ray expression correlation was discretized into 16 bins (see
Additional data file 1 for details). Both the structure and final
learned conditional probabilities are available as Additional
data file 1 and can also be downloaded as supplemental Figure
S1 from [15]. The final probabilistic output of the Bayesian
network for the whole yeast proteome can be downloaded
from the online supplement in [15]. We have performed
cross-validation analysis by excluding all related GO relation-
ships from the gold standard for each pathway we attempt to
predict.
Expert-driven search paradigm
A critical aspect of our method is that we make use of existing
expert biological knowledge to improve the accuracy of proc-
ess-specific network prediction by allowing the biologist to
drive the search process. Specifically, the user enters a list of
proteins (of arbitrary size) he or she either expects to play a
role in the same biological process, or wants to test for
functional relationships. Our system then queries the sur-
rounding confidence-weighted network derived from inte-
grated data for additional related proteins. The resulting
process-specific network is not a simple sub-section of the
complete integrated protein-protein interaction graph; rather
it is probabilistically biased by the graph search algorithm
(described in detail below) toward the biological process rep-
resented in the set of query proteins. This paradigm is based
on two important observations: first, detailed knowledge of
specific biological processes is typically learned in a directed
fashion, not by taking a completely unsupervised view of
high-throughput data; and second, novel process-specific
proteins can be predicted more precisely when we consider
their relationship to groups of known proteins simultane-
ously. This query-driven process results in a view of the inte-
grated genomic data in the context of the specific process
being interrogated. Figure 2, discussed in detail in Results,
illustrates this behavior for Rad23, a DNA repair protein.
Probabilistic graph search algorithm
Given an initial set of query proteins defined by the user, we
wish to find other proteins with significant connectivity back
to the starting group. It is unrealistic to expect related pro-
teins to have direct connections to all other proteins in the
same biological process due to incomplete data. Thus, we
measure connectivity back to the original query set via both
direct and indirect relationships. A brief overview of the algo-
rithm follows: Starting with a user-defined query set of
related proteins, first, find the n
1
direct neighbors with largest
connections to the query set. Secondly, find the n
2
direct or
indirect neighbors with largest connections to the query set,
requiring that all indirect paths pass through proteins from
step 1. Finally, return n
1
+ n
1
proteins and associated links.
Because we used a Bayesian approach to data integration,
weights of edges connecting pairs of proteins are precisely the
posterior probability of a functional relationship between the
proteins given all observed evidence for the pair, for example,
for each edge weight, e
ij
, in the integrated network:
e
ij
= P (protein i is functionally related to protein j | evidence).
Given this formulation, the existence of any pairwise biologi-
cal relationship can be treated as a Bernoulli random variable,
X
ij
, with probability of success e
ij
. The number of direct rela-
tionships protein p
i
shares with the original query set, Q, can
then be found by summing over all p
i
's connections to pro-
teins in Q. Letting the random variable S
Q
(p
i
) denote this
sum, we obtain:
Then, the expected number of direct relationships to the
query set for protein p
i
is:
Sp X
Qi ij
pQ
j
()
=
∈
∑
.
R114.14 Genome Biology 2005, Volume 6, Issue 13, Article R114 Myers et al. />Genome Biology 2005, 6:R114
As not all proteins involved in a particular process will have
high-probability direct relationships with other members of
the same process, we also need to measure indirect connectiv-
ity to the query set. However, from a biological standpoint,
not all indirect connections are actually meaningful. We
expect there are a limited number of high-probability adja-
cent neighbors of the query set through which indirect con-
nections are meaningful. Thus, our approach relies on a two-
step search approach where a pre-defined number of direct
neighbors are found (first neighborhood, referred to as N
1
)
after which the maximally connected indirect neighbors adja-
cent to the first neighborhood and the original query set are
added (second neighborhood, referred to as N
2
). Letting the
random variable denote the number of two-step
indirect connections between protein p
i
and the query set (Q)
through first neighborhood proteins (N
1
), we obtain:
and the expected number of indirect connections through the
first neighborhood is:
Here, we implicitly assume independence of X
ij
and X
jk
. This
requires that the existence of a relationship between any pro-
teins p
i
and p
j
be independent of the relationship between
proteins p
j
and p
k
, which is a reasonable assumption. Also, we
do not consider indirect connections beyond two steps from
the query set. We have empirically evaluated the algorithm
for more distant indirect relationships, but found the per-
formance on two-step relationships superior. The search
algorithm is summarized as follows: Given a user-defined
query set, Q, first find
Secondly, find
Finally, return {N
1
, N
2
}.
We have empirically determined that a first neighborhood of
between 10 and 20 proteins (that is, 10 ≤ n
1
≤ 20) provides the
best precision and recall over a wide range of biological proc-
esses. This was determined by optimizing the difference of
recall and impurity (1-precision) with respect to the first
neighborhood size. Representative examples and further
details are included in supplemental figure S7 in [15]. The
number of second neighborhood proteins returned (n
2
)
reflects a tradeoff between precision and recall as demon-
strated in Figure 1. We choose n
2
based on the density of the
local network and the limits of the user interface (a typical
user is unable to draw useful information from interaction
graphs of more than 40 proteins). Thus, second neighbor-
hood proteins are added to the graph until the total number
of proteins reaches 40 or no neighbors with links exceeding
the prior probability of interaction remain.
Publicly available interface
We provide public, web-based access to our integrated proc-
ess-specific network analysis and visualization system [54].
This allows biologists to browse the integrated set of
functional genomic data for proteins of interest, and explore
our network predictions. Furthermore, users can directly
query specific links leading to the reported predictions, an
important part of the analysis pipeline.
Cross-talk analysis method
To measure cross-talk between processes, we start with a sin-
gle pathway as our query set, build the graph of interactions
around this query using bioPIXIE, and analyze the resulting
superset of proteins for statistical enrichment of other proc-
esses. More specifically, we first remove the original query set
from the recovered set of proteins and obtain counts of pro-
teins in the remaining set for every other possible interacting
pathway. We then use a hypergeometric test to estimate the
significance of the observed counts. For example, suppose we
use a query pathway, Q, and with a graph of size X recover m
proteins annotated to a different pathway, R, of total size M.
If there are N total known proteins in the organism of inter-
est, the probability of observing a number this large or greater
under the null assumption that the two pathways do not
interact is:
We repeated this calculation for all pairwise combinations of
pathways (see list in supplemental Table S2 in [15]). We con-
servatively corrected for multiple hypothesis testing by Bon-
ferroni correction and only report results with corrected P
values of < 10
-2
.
ES p E X EX e
Qi ij
pQ
ij
pQ
ij
pQ
jj j
()
=
=
=
∈∈ ∈
∑∑ ∑
.
Sp
NQi
1
→
()
Sp XX
NQi ijjk
pNpQ
jk
1
1
→
∈∈
()
=
∑∑
ES p E XX ee
NQi ijjk
pNpQ
ij jk
pNpQ
jkjk
1
11
→
∈∈∈∈
()
=
=
∑∑∑∑∑
.
Nn ESp e
Qi ij
pQ
j
11
≡
()
=
∈
∑
proteins with largest
Nn ES pESp ee
NQi Qi ijjk22
1
≡
()
+
()
=
→
proteins with largest ++
∈∈∈
∑∑∑
e
ik
pQpNpQ
kjk 1
P value =−
−
−
=
−
∑
1
0
1
M
i
NM
Xi
N
X
i
m
Genome Biology 2005, Volume 6, Issue 13, Article R114 Myers et al. R114.15
comment reviews reports refereed researchdeposited research interactions information
Genome Biology 2005, 6:R114
Implementation
The Bayesian network used in integrating genomic data was
implemented using SMILE, a C++ library developed by the
Decision Systems Laboratory at the University of Pittsburgh
[55]. The user interface tool, GeNIe, useful for developing and
analyzing Bayesian models, was also used extensively during
the development of bioPIXIE [55]. bioPIXIE's web interface
is implemented in PHP and all genomic data are stored in a
MySQL database. The graph server that performs probabilis-
tic searches and renders results is implemented in C++ and
renders graphs in SVG, which allows for user-friendly brows-
ing and interactivity. AT&T's Graphviz [56] is used for layout
of all graphs.
Additional data files
The following additional data are available with the online
version of this paper. Additional data file 1 is a DSL file of the
bioPIXIE Bayesian network for genomic data integration.
This file contains the structure and final learned conditional
probability tables used for integrating multiple heterogene-
ous sources of functional genomic data. GeNIe, available at
[57], is recommended for viewing the DSL file. Additional
data file 2 contains a list of pathways and protein complexes
that were used to evaluate the performance of bioPIXIE. The
source of the group and the number of proteins in each is also
included. Additional data file 3 contains a comparison of the
performance of bioPIXIE to existing methods for biological
network recovery.
Additional data file 1bioPIXIE Bayesian network for genomic data integrationThis file contains the structure and final learned conditional prob-ability tables used for integrating multiple heterogeneous sources of functional genomic data. GeNIe, available at is recommended for viewing the dsl file.Click here for fileAdditional data file 2Evaluation pathways and protein complexesThis file contains a list of pathways and protein complexes that were used to evaluate the performance of bioPIXIE. The source of the group and the number of proteins in each is also included.Click here for fileAdditional data file 3Results of comparison with existing methodsThis file contains a comparison of the performance of bioPIXIE to existing methods for biological network recovery. The area under the precision-recall curve (AUC) is computed and plotted sepa-rately for each of the 31 evaluation pathways and complexes.Click here for file
Acknowledgements
The authors would like to thank the David Botstein, Sandy Silverman, David
Gresham, Peter Kasson, Maitreya Dunham, Kai Li, John Matese, and the
Botstein and Kruglyak labs for insightful comments and suggestions. We
also gratefully acknowledge John Wiggins, Mark Schroeder, and Fan Kang
for excellent technical support. C.L.M. is supported by the Quantitative and
Computational Biology Program NIH grant T32 HG003284. M.A.H. is sup-
ported by NSF grant DGE-9972930. O.G.T. is an Alfred P Sloan Research
Fellow. This research was partially supported by NIH grant R01 GM071966
to O.G.T, NSF grant IIS-0513552 to O.G.T., NIH grant R01 HG003471 to
K.D. (co-Principal Investigator) and David Botstein (Principal Investigator),
and NIGMS Center of Excellence grant P50 GM071508 to David Botstein.
References
1. Jansen R, Yu H, Greenbaum D, Kluger Y, Krogan NJ, Chung S, Emili
A, Snyder M, Greenblatt JF, Gerstein M: A Bayesian networks
approach for predicting protein-protein interactions from
genomic data. Science 2003, 302:449-453.
2. Troyanskaya OG, Dolinski K, Owen AB, Altman RB, Botstein D: A
Bayesian framework for combining heterogeneous data
sources for gene function prediction in Saccharomyces
cerevisiae. Proc Natl Acad Sci USA 2003, 100:8348-8353.
3. Lee I, Date SV, Adai AT, Marcotte EM: A probabilistic functional
network of yeast genes. Science 2004, 306:1555-1558.
4. Jaimovich A, Elidan G, Margalit H, Friedman N: Towards an inte-
grated protein-protein interaction network. In Research in
Computational Molecular Biology: 9th Annual International Conference,
RECOMB, Proceedings: May 14-18 2005, Cambridge, MA Edited by: Miy-
ano S, Mesirov J, Kasif S, Istrail S, Pevzner P, Waterman M. Springer
Verlag-GmbH; 2005:14-30.
5. von Mering C, Huynen M, Jaeggi D, Schmidt S, Bork P, Snel B:
STRING: a database of predicted functional associations
between proteins. Nucleic Acids Res 2003, 31:258-261.
6. Deng M, Tu Z, Sun F, Chen T: Mapping Gene Ontology to pro-
teins based on protein-protein interaction data. Bioinformatics
2004, 20:895-902.
7. Karaoz U, Murali TM, Letovsky S, Zheng Y, Ding C, Cantor CR, Kasif
S: Whole-genome annotation by using evidence integration
in functional-linkage networks. Proc Natl Acad Sci USA 2004,
101:2888-2893.
8. Letovsky S, Kasif S: Predicting protein function from protein/
protein interaction data: a probabilistic approach. Bioinformat-
ics 2003, 19(Suppl 1):i197-204.
9. Bader GD, Hogue CW: An automated method for finding
molecular complexes in large protein interaction networks.
BMC Bioinformatics 2003, 4:2.
10. Spirin V, Mirny LA: Protein complexes and functional modules
in molecular networks. Proc Natl Acad Sci USA 2003,
100:12123-12128.
11. Gagneur J, Krause R, Bouwmeester T, Casari G: Modular decom-
position of protein-protein interaction networks. Genome Biol
2004, 5:R57.
12. Pereira-Leal JB, Enright AJ, Ouzounis CA: Detection of functional
modules from protein interaction networks. Proteins 2004,
54:49-57.
13. Asthana S, King OD, Gibbons FD, Roth FP: Predicting protein
complex membership using probabilistic network reliability.
Genome Res 2004, 14:1170-1175.
14. Bader JS: Greedily building protein networks with confidence.
Bioinformatics 2003, 19:1869-1874.
15. bioPIXIE Online Supplement [ />ment]
16. Prakash S, Prakash L: Nucleotide excision repair in yeast. Mutat
Res 2000, 451:13-24.
17. van Laar T, van der Eb AJ, Terleth C: A role for Rad23 proteins in
26S proteasome-dependent protein degradation?. Mutat Res
2002, 499:53-61.
18. Schauber C, Chen L, Tongaonkar P, Vega I, Lambertson D, Potts W,
Madura K: Rad23 links DNA repair to the ubiquitin/proteas-
ome pathway. Nature 1998, 391:715-718.
19. Miles J, Formosa T: Evidence that POB1, a Saccharomyces cere-
visiae protein that binds to DNA polymerase alpha, acts in
DNA metabolism in vivo. Mol Cell Biol 1992, 12:5724-5735.
20. Bagatell R, Whitesell L: Altered Hsp90 function in cancer: a
unique therapeutic opportunity. Mol Cancer Ther 2004,
3:1021-1030.
21. Gerber MR, Farrell A, Deshaies RJ, Herskowitz I, Morgan DO: Cdc37
is required for association of the protein kinase Cdc28 with
G1 and mitotic cyclins. Proc Natl Acad Sci USA 1995,
92:4651-4655.
22. Beliakoff J, Whitesell L: Hsp90: an emerging target for breast
cancer therapy. Anticancer Drugs 2004, 15:651-662.
23. Hunter T, Poon RYC: Cdc37: a protein kinase chaperone?.
Trends in Cell Biology 1997, 7:157-161.
24. Mort-Bontemps-Soret M, Facca C, Faye G: Physical interaction of
Cdc28 with Cdc37 in Saccharomyces cerevisiae. Mol Genet
Genomics 2002, 267:447-458.
25. Farrell A, Morgan DO: Cdc37 promotes the stability of protein
kinases Cdc28 and Cak1 Mol Cell Biol 2000, 20:749-754.
26. Schutz AR, Giddings TH Jr, Steiner E, Winey M: The yeast CDC37
gene interacts with MPS1 and is required for proper execu-
tion of spindle pole body duplication. J Cell Biol 1997,
136:969-982.
27. Lee P, Shabbir A, Cardozo C, Caplan AJ: Sti1 and Cdc37 can
stabilize Hsp90 in chaperone complexes with a protein
kinase. Mol Biol Cell 2004, 15:1785-1792.
28. Abbas-Terki T, Donze O, Picard D: The molecular chaperone
Cdc37 is required for Ste11 function and pheromone-
induced cell cycle arrest. FEBS Lett 2000, 467:111-116.
29. Johnston LH, Masai H, Sugino A: First the CDKs, now the DDKs.
Trends Cell Biol 1999, 9:249-252.
30. Tong AH, Lesage G, Bader GD, Ding H, Xu H, Xin X, Young J, Berriz
GF, Brost RL, Chang M, et al.: Global mapping of the yeast
genetic interaction network. Science 2004, 303:808-813.
31. Gasch AP, Spellman PT, Kao CM, Carmel-Harel O, Eisen MB, Storz
G, Botstein D, Brown PO: Genomic expression programs in the
response of yeast cells to environmental changes. Mol Biol Cell
2000, 11:4241-4257.
32. Kent NA, Eibert SM, Mellor J: Cbf1p is required for chromatin
remodeling at promoter-proximal CACGTG motifs in yeast.
R114.16 Genome Biology 2005, Volume 6, Issue 13, Article R114 Myers et al. />Genome Biology 2005, 6:R114
J Biol Chem 2004, 279:27116-27123.
33. DeRisi JL, Iyer VR, Brown PO: Exploring the metabolic and
genetic control of gene expression on a genomic scale. Sci-
ence 1997, 278:680-686.
34. Chu S, DeRisi J, Eisen M, Mulholland J, Botstein D, Brown PO, Her-
skowitz I: The transcriptional program of sporulation in bud-
ding yeast. Science 1998, 282:699-705.
35. Saccharomyces Genome Database [ />yeast/]
36. Du YC, Stillman B: Yph1p, an ORC-interacting protein: poten-
tial links between cell proliferation control, DNA replication,
and ribosome biogenesis. Cell 2002, 109:835-848.
37. Harnpicharnchai P, Jakovljevic J, Horsey E, Miles T, Roman J, Rout M,
Meagher D, Imai B, Guo Y, Brame CJ, et al.: Composition and func-
tional characterization of yeast 66S ribosome assembly
intermediates. Mol Cell 2001, 8:505-515.
38. Oeffinger M, Leung A, Lamond A, Tollervey D: Yeast Pescadillo is
required for multiple activities during 60S ribosomal subunit
synthesis. RNA 2002, 8:626-636.
39. Adams CC, Jakovljevic J, Roman J, Harnpicharnchai P, Woolford JL Jr:
Saccharomyces cerevisiae nucleolar protein Nop7p is neces-
sary for biogenesis of 60S ribosomal subunits. RNA 2002,
8:150-165.
40. Alfarano C, Andrade CE, Anthony K, Bahroos N, Bajec M, Bantoft K,
Betel D, Bobechko B, Boutilier K, Burgess E, et al.: The Biomolecu-
lar Interaction Network Database and related tools 2005
update. Nucleic Acids Res 2005:D418-424.
41. Breitkreutz BJ, Stark C, Tyers M: The GRID: the General Repos-
itory for Interaction Datasets. Genome Biol 2003, 4:R23.
42. Huh WK, Falvo JV, Gerke LC, Carroll AS, Howson RW, Weissman
JS, O'Shea EK: Global analysis of protein localization in bud-
ding yeast. Nature 2003, 425:686-691.
43. Zhu J, Zhang MQ: SCPD: a promoter database of the yeast Sac-
charomyces cerevisiae. Bioinformatics 1999, 15:607-611.
44. Spellman PT, Sherlock G, Zhang MQ, Iyer VR, Anders K, Eisen MB,
Brown PO, Botstein D, Futcher B: Comprehensive identification
of cell cycle-regulated genes of the yeast Saccharomyces cer-
evisiae by microarray hybridization. Mol Biol Cell 1998,
9:3273-3297.
45. Gasch AP, Huang M, Metzner S, Botstein D, Elledge SJ, Brown PO:
Genomic expression responses to DNA-damaging agents
and the regulatory role of the yeast ATR homolog Mec1p.
Mol Biol Cell 2001, 12:2987-3003.
46. Ogawa N, DeRisi J, Brown PO: New components of a system for
phosphate accumulation and polyphosphate metabolism in
Saccharomyces cerevisiae revealed by genomic expression
analysis. Mol Biol Cell 2000, 11:4309-4321.
47. Shakoury-Elizeh M, Tiedeman J, Rashford J, Ferea T, Demeter J, Gar-
cia E, Rolfes R, Brown PO, Botstein D, Philpott CC: Transcriptional
remodeling in response to iron deprivation in Saccharomy-
ces cerevisiae. Mol Biol Cell 2004, 15:1233-1243.
48. Zhu G, Spellman PT, Volpe T, Brown PO, Botstein D, Davis TN,
Futcher B: Two yeast forkhead genes regulate the cell cycle
and pseudohyphal growth. Nature 2000, 406:90-94.
49. Sudarsanam P, Iyer VR, Brown PO, Winston F: Whole-genome
expression analysis of snf/swi mutants of Saccharomyces
cerevisiae. Proc Natl Acad Sci USA 2000, 97:3364-3369.
50. Yoshimoto H, Saltsman K, Gasch AP, Li HX, Ogawa N, Botstein D,
Brown PO, Cyert MS: Genome-wide analysis of gene expres-
sion regulated by the calcineurin/Crz1p signaling pathway in
Saccharomyces cerevisiae. J Biol Chem 2002, 277:31079-31088.
51. bioPIXIE Genomic data source list [ />pixie/supplement/sources.html]
52. Eddy SR: What is Bayesian statistics? Nat Biotechnol 2004,
22:1177-1178.
53. Dempster AP, Laird NM, Rubin DB: Maximum likelihood from
incomplete data via Em algorithm. J Roy Statistical Soc
Methodological 1977, 39:1-38.
54. bioPIXIE []
55. Decision Systems Laboratory [ />56. Graphviz [ />57. GeNIe []
58. Saeed AI, Sharov V, White J, Li J, Liang W, Bhagabati N, Braisted J,
Klapa M, Currier T, Thiagarajan M, et al.: TM4: a free, open-source
system for microarray data management and analysis. Bio-
techniques 2003, 34:374-378.