Báo cáo y học: " Predicting genes for orphan metabolic activities using phylogenetic profiles" pptx
Bạn đang xem bản rút gọn của tài liệu. Xem và tải ngay bản đầy đủ của tài liệu tại đây (633.26 KB, 13 trang )
Genome Biology 2006, 7:R17
comment reviews reports deposited research refereed research interactions information
Open Access
2006Chen and VitkupVolume 7, Issue 2, Article R17
Method
Predicting genes for orphan metabolic activities using phylogenetic
profiles
Lifeng Chen and Dennis Vitkup
Address: Center for Computational Biology and Bioinformatics and Department of Biomedical Informatics, Columbia University, St Nicholas
Avenue, Irving Cancer Research Center, New York, NY 10032, USA.
Correspondence: Dennis Vitkup. Email:
© 2006 Chen and Vitkup; licensee BioMed Central Ltd.
This is an open access article distributed under the terms of the Creative Commons Attribution License ( which
permits unrestricted use, distribution, and reproduction in any medium, provided the original work is properly cited.
Orphan metabolic activities<p>A method that combines local structure of a metabolic network with phylogenetic profiles is described and used to assign genes to orphan metabolic activities in yeast and <it>Escherichia coli</it>.</p>
Abstract
Homology-based methods fail to assign genes to many metabolic activities present in sequenced
organisms. To suggest genes for these orphan activities we developed a novel method that
efficiently combines local structure of a metabolic network with phylogenetic profiles. We validated
our method using known metabolic genes in Saccharomyces cerevisiae and Escherichia coli. We show
that our method should be easily transferable to other organisms, and that it is robust to errors in
incomplete metabolic networks.
Background
It is hard to overestimate the potential impact of accurate net-
work reconstruction algorithms on systems biology. Accurate
models of biological networks will be essential in diverse
areas from genetics of common human diseases to synthetic
biology. Current computational methods of metabolic net-
work reconstruction can directly benefit from many decades
of experimental biochemical studies [1,2]. Available homol-
ogy-based annotation methods assign metabolic functions to
sequences by establishing sequence similarity to known
enzymes. State of the art homology approaches use different
types of sequence and structural similarity, such as the overall
sequence homology [3-5], presence of conserved functional
motifs and blocks [6], specific spatial positions of functional
residues [7,8], or a combination of the above [9]. Unfortu-
nately, in spite of the overall success, homology-based meth-
ods fail to annotate metabolic genes with poor homology to
known enzymes. This has resulted in partially reconstructed
metabolic networks, such as for Escherichia coli [10] and Sac-
charomyces cerevisiae [11].
The inability to annotate all enzymes using homology-based
methods leaves members of metabolic pathways 'missing'
[12]. That is, although biochemical evidence may indicate that
a certain group of reactions takes place in an organism, we do
not know which genes encode the enzymes responsible for the
catalyses. It is perhaps natural to call these 'missing' genes
orphan metabolic activities, to emphasize the fact that certain
metabolic activities are not assigned to any sequences. As
suggested by Osterman et al. [12], we can classify orphan
metabolic activities as 'local' or 'global'. Global orphan activi-
ties do not have a single representative sequence in any
organism [13]. In contrast, local orphan activities represent
reactions for which we do not have a representative sequence
in an organism of interest, although one or several sequences
catalyzing the reaction may be known in other organisms. The
problem of assigning sequences to orphan activities is con-
ceptually conjugate to the problem of assigning activities
(functions) to hypothetical sequences. Although progress in
solving the former problem will necessarily improve solution
of the latter, optimal methods and algorithms for these two
problems may be different.
Published: 15 February 2006
Genome Biology 2006, 7:R17 (doi:10.1186/gb-2006-7-2-r17)
Received: 1 September 2005
Revised: 1 December 2005
Accepted: 12 January 2006
The electronic version of this article is the complete one and can be
found online at />R17.2 Genome Biology 2006, Volume 7, Issue 2, Article R17 Chen and Vitkup />Genome Biology 2006, 7:R17
Several non-homology methods have been developed in order
to establish functional links between proteins [14,15]. These
so-called context-based approaches include gene phyloge-
netic profiles (measuring co-occurrence of gene pairs across
genomes) [16,17], the protein fusion (Rosetta Stone) method
(detecting fusion events between genes) [18-20], gene co-
expression [21,22], and conserved gene neighborhoods
(measuring chromosomal co-localization between genes)
[23-25]. It was demonstrated that the functional links gener-
ated by the context-based methods recover members of pro-
tein complexes, functional modules, molecular pathways and
gene-phenotype relationships [26-28].
Previously, Osterman et al. [12] illustrated how context-based
methods can be successfully used to fill the remaining gaps in
the metabolic networks, while Green et al. [29] proposed a
Bayesian method for identifying missing enzymes using pri-
marily sequence homology and chromosomal proximity
information. In contrast to Green, the approach reported here
uses exclusively non-homology information. Consequently,
our method should be particularly useful when the gene
encoding the enzyme catalyzing a particular orphan function
has little or no sequence similarity to any known enzymes.
Recently, we used mRNA co-expression data and local struc-
ture of a metabolic network to fill metabolic gaps in a partially
reconstructed network of S. cerevisiae [11]. Using exclusively
co-expression information, for 20% of all metabolic reactions
it was possible to rank a correct gene within the top 50 out of
5,594 candidate yeast genes.
In this study, we demonstrate that it is possible to signifi-
cantly improve prediction of sequences responsible for
orphan metabolic activities by using gene phylogenetic pro-
files. Importantly, in contrast to mRNA co-expression data,
which are usually available only for several model organisms,
phylogenetic profiles can be readily calculated for any
sequenced organism. The accuracy of phylogenetic profiles
will increase as genomic pipelines reveal more protein
sequences. In comparison to previous studies that demon-
strated that it is possible to cluster proteins from annotated
biochemical pathways using phylogenetic profiles [17,27,30],
our goal is significantly more specific in that we want to pre-
dict genes responsible for particular orphan activities. By
directly taking into account the structure of a partially recon-
structed metabolic network (for example, giving more weight
to genes closer to a network gap) our method is able to com-
bine the information of a 'known core' of the network with
phylogenetic correlations to the remaining gaps. We show
that our method is readily applicable to less-studied organ-
isms with partially known metabolic networks.
Results and discussion
The main approach
As was demonstrated by us previously [31,32], the closer
genes are in a metabolic network the more similar are the
genes' evolutionary histories. It is important to know whether
this relationship is strong enough to determine the exact net-
work location of a hypothetical gene. The established distance
metrics (see Materials and methods) allows us to quantify the
relationship between the gene distance in the network and the
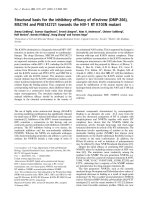
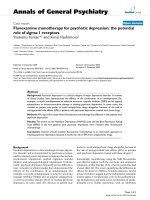
average gene co-evolution (Figure 1). In Figure 1 we show
Pearson's correlations of phylogenetic profiles between a tar-
get gene and all other network genes separated from the tar-
get by distances one, two, three, and so on. The background
correlation (0.11) was estimated by averaging correlation
coefficients between all non-metabolic and metabolic genes.
The average correlation between metabolic genes decreases
monotonically with their separation in the metabolic net-
work, ranging between 0.29 for metabolic distance 1 and 0.13
for metabolic distance 8. This relationship suggests that we
can use gene phylogenetic profiles and their location in the
metabolic network to predict sequences for orphan activities.
The idea behind our method is similar to that used by us pre-
viously in the context of mRNA co-expression networks [31].
We used a heuristic cost function to determine how a test
gene 'fits' into a network gap. The 'fit' of a test gene in a net-
work gap is determined by its phylogenetic correlations with
network genes close to the gap. The parameters of the cost
function were optimized to achieve the best predictive ability
by minimizing the log sum of the ranks for all correct meta-
The average phylogenetic correlation between a target gene and all other network genes at a certain metabolic network distanceFigure 1
The average phylogenetic correlation between a target gene and all other
network genes at a certain metabolic network distance. The standard
deviation of the average correlation for all possible network gaps is
represented by the error bars. The dashed line shows the background
correlation, estimated by the average phylogenetic correlation between
any metabolic and non-metabolic genes. The average phylogenetic
correlation between two genes decreases monotonically with their
separation in the network.
012345678
0.0
0.1
0.2
0.3
0.4
0.5
0.6
Average phylogenetic correlation
Metabolic network distance
Genome Biology 2006, Volume 7, Issue 2, Article R17 Chen and Vitkup R17.3
comment reviews reports refereed researchdeposited research interactions information
Genome Biology 2006, 7:R17
bolic enzymes. Several functional forms of the cost function
were tested (see Equations 1 to 3 below).
Equation 1 represents a cost function similar to the one used
previously [31], where x is the candidate gene, n is a gene from
the network neighborhood of the gap, c(x, n) is the phyloge-
netic correlation between genes x and n, is the vector of
layer weights, and p1 is the power factor for the phylogenetic
correlations. The summation in Equation 1 is, first, over all
genes in a given layer N
i
around the gap and, second, over all
layers up to the layer R. Only three layers around the network
gaps were used in all calculations in the paper. |N| is the total
number of genes in all three layers.
Equation 2 represents a cost function that takes into account
the specificity of connections established by metabolites. The
idea behind the connection specificity is the following: if a
metabolite participates in establishing few connections (that
is, the metabolite participates in a small number of reactions),
the corresponding connections are given more weight in the
cost function compared to connections established by widely
used metabolites. The connection specificity was taken into
account by an additional weight parameter (g, n), deter-
mined by an inverse power function of the total number of
connections established by the metabolite linking the gap
gene g and its neighboring gene n. If more than one metabo-
lite establishes the connection between g and n, the most spe-
cific one (the metabolite with the fewest connections) was
used.
Equation 3 represents an exponential cost function, which is
used to increase the sensitivity to differences between phylo-
genetic correlations. A set of new parameters (
β
i
) was intro-
duced to account for different weighting of the exponent in
different layers.
We found that the functions with connection specificity
adjustment (Equations 2 and 3) significantly outperform the
function without specificity adjustment (Equation 1). How-
ever, we found no difference in predictive power between
Equation 2 and 3 (Additional data file 4). In the text below,
unless otherwise specified, we present results obtained using
Equation 2.
Self-consistent test and parameter optimization
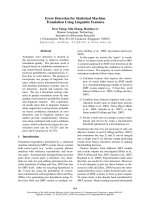
To optimize the cost function parameters and assess the per-
formance of our method we carried out a self-consistent test
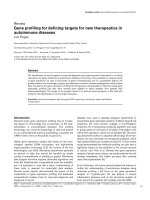
illustrated in Figure 2. The test consists of: removing a known
gene from its position in the network (leading to a network
gap); adding the gene to a collection of 6,093 non-metabolic
yeast genes; and ranking all candidate genes in terms of their
'fit' in the network gap according to the cost function. As the
correct gene occupying the gap is known, we can accurately
measure the performance of the method based on the
obtained ranking. The overall performance of the method was
quantified by calculating the fraction of correct genes that are
ranked as the top, within the top 10 and within the top 50 out
of all non-metabolic yeast genes. These performance meas-
ures are directly related to the main goal of our method: to
suggest candidates for orphan activities to be tested experi-
mentally. Even if our method is not always able to rank the
correct gene as the top candidate, it may be useful, for exam-
ple, to rank it within the top 10 candidates. These top 10 can-
didates can then be tested experimentally to find out the exact
gene responsible for the orphan activity.
The optimal values for the cost function parameters were
determined by minimizing the log sum of the ranks of all
known metabolic enzymes in their correct network positions
(see Materials and methods). Two types of parameter optimi-
zation algorithm were used: a deterministic Nelder-Mead
simplex algorithm [33] and a stochastic global optimization
by simulated annealing (SA) [34]. The best performance was
obtained from the SA optimizations and is reported below.
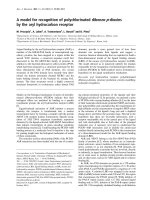
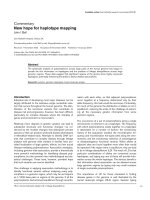
The optimized prediction algorithm identifies 22.8%, 37.3%
and 46.2% of the correct genes as the top candidates, within
the top 10 candidates, and within the top 50 candidates out of
6,094 genes, respectively (Figure 3a). In comparison, under
random ranking, the fraction of correct genes as the top can-
didate, within the top 10 candidates, and within the top 50
candidates is only 0.016%, 0.16% and 0.8%, respectively. For
Equation 2, optimal performance was observed with the cor-
relation power p1 = 1.81 (95% confidence interval (CI): 1.40-
2.21) and the connection specificity power p2 = 0.79 (95% CI:
0.68-0.90). As the ratio of the number of the cost function
adjustable parameters to observations is around 1:100, our
method does not suffer from overfitting. We achieved almost
identical prediction accuracies using the training and test sets
in ten-fold cross-validation (Additional data file 5).
The functional information present in the currently available
phylogenetic profiles allows us to significantly improve the
performance in comparison to a similar method based on
gene co-expression. Using mRNA co-expression, we pre-
dicted 4.1%, 12.7% and 23.8% of the correct enzyme-encoding
genes to be top ranked, within the top 10, and within the top
50, respectively [31]. The improved performance reflects
larger coverage of the available phylogenetic profiles, which
can be calculated for many sequences in various genomes; in
G
w
i
Fx
N
wcxn
i
nNii
R
p
() (,)=
()
∈=
∑∑
1
1
1
1
∗
G
w
e
Fx
N
wcxn wgn
i
nNii
R
p
e
p
() (,) (,)=
()
∈=
∑∑
1
2
1
12
∗∗
Fx
N
wwgn e
i
nNii
R
e
p
cxn
i
() (,)
(,)
=
()
∈=
∑∑
1
3
1
2
∗∗
∗
β
R17.4 Genome Biology 2006, Volume 7, Issue 2, Article R17 Chen and Vitkup />Genome Biology 2006, 7:R17
contrast, mRNA co-expression data are mostly available for
model organisms and genes with significant mRNA expres-
sion changes. Another important improvement of the current
approach is the use of the connection specificity adjustment.
The specificity adjusted cost functions (Equations 2 and 3)
predict 5% to 18% more correct genes within the top ranks
compared to functions without specificity adjustment (Equa-
tion 1; Figure 3b).
It is interesting to investigate the relative contribution of dif-
ferent layers around a network gap to the cost function. As
only the relative difference in layer weights impact the algo-
rithm performance, the weight of the first layer was always set
to 1. The best performance of the algorithm based on Equa-
tion 2 was achieved with the following weights for the second
and third layers around the gap: w2 = 0.0085 (95% CI:
0.0051-0.0120) and w3 = 0.0024 (95% CI: 0.0011-0.0037).
Smaller values for the weights w2 and w3 indicate that the
phylogenetic correlations at the distances 2 and 3 from the
gap are not as informative as the correlations of the first layer
neighbors. But, as there are 5 and 13 times more genes in the
second and third layers, respectively, their contribution to the
cost function values is around 5% to 10% for the highly ranked
genes and more than 10% for enzymes ranked between 200
and 600. As we show below, the contribution of the second
and third layers roughly doubles for predictions on partially
known networks.
Performance based on phylogenetic profiles generated
using COG
As described in Materials and methods, BLAST searches were
used in this work to calculate phylogenetic profiles. In con-
trast, a number of previous studies [27,35] relied on the Clus-
ter of Orthologous Groups (COG) database [36] to obtain
phylogenetic profiles. We investigated the performance of our
algorithm on COG-based phylogenetic profiles. Using the
same algorithm and the COG-based profiles, we predicted
34.1%, 56.2% and 69.0% of the correct yeast metabolic genes
to be the top ranked, within the top 10 and within the top 50,
respectively. This indicates an improvement of about 50%
over the results based on the BLAST searches; however, this
result is unlikely to indicate superior performance. First, the
current coverage of the COG database is significantly biased
towards genes encoding known metabolic enzymes. For
example, 72% (443 out of 615) of known metabolic genes have
COG profiles while only 19% (1,148 out of 6,093) of non-met-
abolic genes have COG profiles. This bias leads to a significant
overestimation of the 'real-world' performance of the COG-
based profiles. Second, the COG database has a very limited
set of hypothetical proteins, making it impractical to predict
'Fit' test of a candidate gene in a network gapFigure 2
'Fit' test of a candidate gene in a network gap. We use a self-consistent test in which a known gene E4 is removed from the network, leaving a gap in its
place. We then: 1, put candidate genes in the gap one by one; 2, determine the function value for every candidate gene (Equations 1 to 3); and 3, rank all
candidate genes based on their function values. In the figure we show an example when the correct gene E4 was ranked as number 6.
E1
E
2
?
E
E
E
E
E
E
E
E
E
E
E
E1
E
2
E3 E4
E
E
E
E
E
E
E
E
E
E
E
E
…
ORF1
ORF2
ORF3
ORF
4
ORF5
ORF6
ORF7
ORF8
ORF
9
ORF1
0
…
Metabolic network
M
et
a
bo
li
c
n
e
t
wor
k
with a
“
ga
p
”
Remove E4 and
Leave a gap in
n
etwork
Candi
dat
e
g
en
e
s
1) Put a ca
n
didat
e
gene in
th
e gap
………
1
02
3
ORF
8
960ORF6
8100ORF10
7150
O
RF
9
6200ORF4
5230ORF1
4
2
45ORF3
3257ORF7
2
300ORF5
1
4
55ORF2
R
ankFun
ctio
n
value
ORF
Na
m
e
3) Rank candidate genes
according to t he cost f
unction
2
)
Ca
lc
u
l
ate f
u
n
c
tion value
f
o
rt
he
c
a
nd
i
d
at
eg
e
n
e
Genome Biology 2006, Volume 7, Issue 2, Article R17 Chen and Vitkup R17.5
comment reviews reports refereed researchdeposited research interactions information
Genome Biology 2006, 7:R17
hypothetical genes responsible for orphan activities using
COG.
Performance using hypotheticals as candidate genes
In practice, it is logical to test only hypothetical genes for
orphan metabolic activities in a given organism. To simulate
this for the yeast metabolic network, we repeated our self-
consistent test procedure using only hypothetical yeast genes
as gap candidates. We identified 1,514 hypothetical yeast
open reading frames (ORFs) for this analysis. As the number
of hypothetical genes is smaller than the total number of
genes (usually 30% to 70% smaller), the performance of our
method should improve. Indeed, testing only hypothetical
genes improved the algorithm performance: 30.4%, 48.0%
and 57.1% correct enzymes were ranked as the top 1, within
the top 10 and within the top 50 among all candidate
sequences, respectively (Figure 3c). We note that the
observed 25% improvement in performance is not due to a
better discrimination against hypothetical genes. Similar
improvement was observed when a candidate set of 1,514 ran-
domly selected genes with known functions was used (Addi-
tional data file 6).
Performance on the E. coli metabolic network
To understand the transferability of our approach to other
organisms, we repeated our analysis using the E. coli meta-
Enzyme predictions based on phylogenetic profilesFigure 3
Enzyme predictions based on phylogenetic profiles. (a) The cumulative fraction of correctly predicted genes as a function of rank among all non-metabolic
genes. All 6,093 non-metabolic yeast genes plus a known correct gene were ranked using Equation 2. The cumulative distribution is shown for ranks from
1 to 100; the inset shows the same distribution for all ranks. (b) The effect of connection specificity adjustment. Only highly ranked genes (1 to 50) are
shown. (c) Comparison of the performance with all non-metabolic genes as candidates to that with only hypothetical genes as candidates for an orphan
activity. (d) Predictions for the E. coli metabolic network. The cost function with the parameters optimized for the yeast network showed comparable
performance to the cost function with the parameters specifically optimized for the E. coli network.
01020304050
0.20
0.25
0.30
0.35
0.40
0.45
0.50
Fr
a
c
t
ion of correct
l
yp
r
edicted genes
Rank thresold
W ith connection specificity adjustment
W ithout connection specificity adjustment
(b)
0 20406080100
0.0
0.1
0.2
0.3
0.4
0.5
0.6
0.7
Fraction of correctly predicted genes
Rank threshold
Using all non-metabolic genes as candidates
Using hypothetical genes as candidates
Random chance
(c)
020406080100
0.0
0.1
0.2
0.3
0.4
0.5
Fraction of correctl
y
pr
e
dict
e
dg
e
nes
Rank threshold
Using parameters optimized for S. cerevisiae
Using parmameters optimized for E. coli
Random chance
(d)
0 20 40 60 80 100
0.00
0.05
0.10
0.15
0.20
0.25
0.30
0.35
0.40
0.45
0.50
F
raction of correctly predicted genes
Rank threshold
Predicted using the algorithm
Random chance
(a)
0 1,000 2,000 3,000 4,000 5,000 6,000
0.0
0.2
0.4
0.6
0.8
1.0
R17.6 Genome Biology 2006, Volume 7, Issue 2, Article R17 Chen and Vitkup />Genome Biology 2006, 7:R17
bolic network. The same procedures were used to construct
the metabolic network for E. coli (see Materials and
methods). First, the optimal parameters obtained for the S.
cerevisiae metabolic network, without further modifications,
were applied to rank E. coli metabolic genes. As a result, the
algorithm predicts 13.3%, 30.0%, and 41.3.% of known E. coli
metabolic genes to be top ranked, within the top 10 and
within the top 50, respectively, out of 3,578 non-metabolic E.
coli genes. Second, the simulated annealing optimization was
performed to optimize the cost function specifically for the E.
coli network. Based on the optimized parameters slightly bet-
ter results were obtained: 18.0%, 33.8%, and 45.6% of the
correct genes were ranked as the top candidate, within the top
10, and within the top 50, respectively (Figure 3d). The opti-
mal E. coli parameters for the cost function are generally sim-
ilar to the optimal parameters for the S. cerevisiae metabolic
network. This suggests that parameters obtained on several
model organisms can be directly used for predictions in other
organisms, although an organism-specific optimization will
slightly improve the algorithm performance.
Performance based on genes without independent
homology information
Our prediction method is designed primarily for enzymatic
activities without good homology information. Above, we val-
idated the approach using all known metabolic enzymes from
E. coli and S. cerevisiae. In addition, it is interesting to iden-
tify a set of enzymes for which independent homology infor-
mation is not available (that is, the biochemical experiments
have been conducted only in E. coli, for example) and test the
performance on this subset.
We obtained a subset of E. coli enzymatic EC numbers with-
out representative sequences in other organisms. The subset,
identified using the SWISS-PROT database [37], includes EC
numbers with representative sequences exclusively from E.
coli. We also included EC numbers with representative
sequences in the TrEMBL database (a computer-annotated
complement to the SWISS-PROT), but only if these were
computationally annotated from E. coli sequences and, con-
Table 1
Performance of our method with Escherichia coli orphan activities without independent sequence homology information
EC number Description Responsible gene Rank
1.14.11.17 Taurine dioxygenase b0368/tauD 1,143
1.1.1.251 Fructose 6-phosphate aldolase b0825/fsa 1
1.1.1.264 L-idonate 5-dehydrogenase b4267/idnD 44.5
1.2.1.22 Lactaldehyde dehydrogenase b0356/adhC 1
1.2.1.22 Lactaldehyde dehydrogenase b1241/adhE 18
1.2.1.22 Lactaldehyde dehydrogenase b3588/aldB 208
1.2.1.22 Lactaldehyde dehydrogenase b1415/aldA 654
1.2.2.2 Pyruvate oxidase b0871/poxB 1,451
1.2.1.39 Phenylacetaldehyde dehydrogenase b1385/feaB 1
1.1.1.57 Mannonate oxidoreductase b4323/uxuB 71.5
1.1.1.77 Lacaldehyde reductase b2799/fucO 10
2.7.1.130 Tetraacyldisaccharide 4'kinase b0915/lpxK 1,507
2.6.1.66 Valine-pyruvate aminotransferase b3572/avtA 70.5
2.7.1.58 2-Dehydro-3-deoxygalactonokinase b3693/dgoK 68
2.7.1.73 Insosine kinase b0477/gsk 1,041
3.2.2.4 AMP nucleosidase b1982/amn 69
2.7.7.58 2,3-Dihydroxybenzoate adenylate synthase b0594/entE 30
4.1.2.20 5-Dehydro-4-deoxyglucarate aldolase b3126/garL 2,057.5
4.1.1.41 Methylmalonyl-CoA decarboxylase b2919/ygfG 889
4.1.1.47 Glyoxalate carboligase b0507/gcl 1
4.2.1.42 Galactarate dehydratase b3128/garD 757
4.2.1.6 galactonate dehydratase b3692/dgoA 1,841.5
4.2.1.7 Altronate hydrolase b3091/uxaA 25
5.3.1.22 Hydroxypyruvate isomerase b0508/hyi 33
6.2.1.30 Phenylacetate-CoA ligase b1398/paaK 9
The subset of orphan activities, identified using the SWISS-PROT database [37], includes EC numbers with representative sequences exclusively from
E. coli. We also included EC numbers with representative sequences in the TrEMBL database, but only if these were computationally annotated from
E. coli sequences.
Genome Biology 2006, Volume 7, Issue 2, Article R17 Chen and Vitkup R17.7
comment reviews reports refereed researchdeposited research interactions information
Genome Biology 2006, 7:R17
sequently, cannot provide independent homology informa-
tion. Each identified EC number was then manually checked.
The identified subset consists of 25 enzymes and is listed in
Table 1. The performance of our method on the subset was
comparable to the performance observed for the set of all E.
coli enzymes: 16.0%, 24.0% and 44.0% of the correct enzymes
were ranked as the top, within the top 10, and within the top
50, respectively, among all E. coli candidate genes. Conse-
quently, the algorithm is effective for sequences that are likely
to be missed by homology-based methods.
Importance of the neighborhood
The performance of our algorithm for a specific network gap
should crucially depend on the available evolutionary infor-
mation for network genes located around the gap. As we opti-
mized our algorithm we found that for about one-third of all
gaps the algorithm performance is no better than random. To
investigate this further, we calculated the discrimination ratio
of the cost function value for the correct gene and the average
for all non-metabolic genes. The distribution of the discrimi-
nation ratios for all possible gaps in the metabolic network is
shown in Figure 4a. Confirming our expectation, about one-
third of all gaps did not allow any discrimination between the
correct and average genes (bin 0 in Figure 4a represents gaps
with discrimination ratios less than 1). On the other hand,
about 50% of the gaps have discrimination ratios equal or
greater than 7 (bin >= 7 in Figure 4a). For comparison, the
average rank of the correct genes for the gaps in bin 0 is only
1,989, while it is 26 for the gaps in bin >= 7.
We found that an important feature that separates the
informative and non-informative gaps is the availability of
accurate phylogenetic correlations for the neighborhood
genes around the gaps. Clearly, if accurate phylogenetic cor-
relations cannot be calculated - because, for example, the cor-
responding genes exist only in several related genomes - the
cost function will not be able to discriminate between correct
and incorrect genes. Figure 4b illustrates this point by show-
ing the relationship between the average phylogenetic corre-
lation between the first layer genes and the fraction of well-
predicted gaps. For gaps with a first layer correlation of at
least 0.5, 95% of the correct genes are ranked within the top
Importance of metabolic neighborhood for the predictive power of the algorithmFigure 4
Importance of metabolic neighborhood for the predictive power of the algorithm. (a) Informative and non-informative gaps. About one-third of the gaps
did not allow any discrimination between the correct and average genes (represented by bin 0 in the figure), that is, the function value of the correct gene
is equal to or smaller than the function value for average genes determined by Equation 2. The red line shows the average rank of correct genes
represented in each bin. Genes filling gaps with higher discrimination ratios are ranked higher by the algorithm. (b) The relationship between the rank of a
correct enzyme in a gap and the average correlation of first layer genes around the gap. A metabolic gene for a gap with a high average first layer
correlation (>0.5) is usually highly ranked by the prediction algorithm (black line) but the fraction of such gaps is small (red bins).
0123456>=7
0.0
0.1
0.2
0.3
0.4
0.5
Dis criminatio n ra t io =
=cost function value for correct gene/cost function value for average genes
Fraction of gaps with certai
ndiscriminat
ion
ratio
2,000
1,500
1,000
500
1
Average rank of correct genes i
n
t
h
ebin
0.0 0.2 0.4 0.6 0.8 1.0
0.0
0.2
0.4
0.6
0.8
1.0
Average 1st-layer phylogenetic correlation for gaps
Fra c t i on of
c
o
rr
ect
ly
predicted
g
en
e
swit
h
in t
h
et
o
p50
0.00
0.05
0.10
0.15
0.20
0.25
0.30
Fraction of gap
s
with average 1
s
t-layer
phylog
e
ne
t
ic correla
t
ions of certain v
a
lue
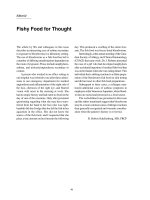
The algorithm performance using an incomplete metabolic networkFigure 5
The algorithm performance using an incomplete metabolic network. We
show the algorithm performance for yeast networks with a certain
fraction of genes randomly deleted. The performance decrease is gradual
as up to 50% of the network nodes are deleted. For example, when half of
the network is deleted, we can still predict more than 33% of the correct
metabolic genes within the top 50 among all candidate genes, compared to
0.8% by random chance.
10% 20% 30% 50%
0.00
0.05
0.10
0.15
0.20
0.25
0.30
0.35
0.40
0.45
Fraction of correctly predicted genes
Percentage of network nodes deleted
To p 1
To p 1 0
To p 5 0
R17.8 Genome Biology 2006, Volume 7, Issue 2, Article R17 Chen and Vitkup />Genome Biology 2006, 7:R17
50. In contrast, less than 20% of the correct genes are ranked
within the top 50 if the average first layer correlation is below
0.1. In practice, the discrimination ratio can be used to esti-
mate the predictive ability of different gaps.
Performance based on a partially known networks
Currently available metabolic networks are significantly
incomplete. As our algorithm directly relies on the network
structure, it is important to understand that the algorithm
performance depends on the network completeness. To
investigate this we deliberately removed a certain fraction of
known genes from the yeast network and retrained our algo-
rithm on the incomplete network. We tried two approaches to
simulate incomplete networks. First, we completely deleted a
fraction of genes from the network and removed all connec-
tions to the deleted genes. Second, we effectively converted a
fraction of the metabolic network into orphan activities. In
this case the connections established by the orphan activities
are preserved, but the genes responsible for these activities
are converted into orphan activities. These two deletion
approaches gave similar results and we report here only the
effects of complete gene deletions. As Figure 5 demonstrates,
the performance of our method decreases only gradually
when increasing fractions of network genes are deleted. Even
when as many as 50% of the network genes are deleted, the
algorithm still performs reasonably well, predicting 13.7% as
the top candidate (95% CI: 10.5-15.6%), 27.9% to be within
the top 10 (95% CI: 24.2-31.5%), and 33.1% within the top 50
(95% CI: 29.2-37.1%). Interestingly, when a high percentage
(20% to 50%) of the network was deleted, the relative cost
function contributions from genes of the second and third
layers around gaps increased approximately twice. This sug-
gests that, for an incomplete network, the second and third
layers play a larger role in 'focusing' a correct gene towards
the corresponding gap.
The relative insensitivity of our method to the network com-
pleteness suggests that the algorithm based on phylogenetic
profiles will be useful not only for metabolic networks of
model organisms, such as S. cerevisiae and E. coli, but also
for networks of less studied organisms.
Predictions for orphan activities in S. cerevisiae and E.
coli
As the metabolic networks of E. coli and S. cerevisiae are rel-
atively well studied, it is likely that the developed algorithm
will be most useful in less studied species with a larger frac-
tion of orphan metabolic activities. Nevertheless, we
investigated in detail several predictions for orphan activities
in the E. coli and S. cerevisiae networks.
Although considered as gaps in the originally reconstructed
E. coli [10] and S. cerevisiae networks [11], a number of
orphan activities have been recently identified. For example,
the yeast enzyme 5-formyltetrahydrofolate cyclo-ligase (EC
6.3.3.2) appears as a gap in the network model by Forster et
al. [11]. However, the gene responsible for this activity,
YER183C/FAU1, has been cloned and characterized by Hol-
mes and Appling [38]. This gene is present in the updated
model by Duarte et al. [39]. In the E. coli iJR904 model, the
arabinose-5-phosphate isomerase (API, EC 5.3.1.13) is listed
as an orphan activity. However, the yrbH/b3197 gene has
been recently characterized as encoding the enzyme responsi-
ble for this metabolic reaction [40]. Significantly, without any
sequence homology information, our algorithm was able to
rank the S. cerevisiae FAU1 gene and the E. coli yrbH gene as
the number 10 and number 1 candidate, respectively, for their
corresponding enzymatic activities. More examples for
recently identified orphan activities and predictions can be
found in Additional file 9.
Several orphan activities in S. cerevisiae and E. coli remain
unassigned to any gene. We found several interesting
predictions for the NAD+ dependent succinate-semialdehyde
dehydrogenase (EC 1.2.1.24) in E. coli. E. coli seems to pos-
sess two different types of succinate semialdehyde dehydro-
genases [41]: one is NAD(P)+ dependent and is encoded by
the b2661/gabD gene (EC 1.2.1.16); the other is specific for
NAD+ only (EC 1.2.1.24). One E. coli gene, b1525/yneI, was
predicted as the top candidate for this orphan activity. We
believe yneI is a good candidate for the orphan activity
because of the following additional functional clues. It has
32% sequence identity (E-value 5*10
-61
) to the other E. coli
succinate semialdehyde dehydrogenase encoded by gabD and
30% sequence identity to the human enzyme ALDH5A1 (EC
1.2.1.24, E-value 7*10
-59
). In addition, yneI is adjacent on the
bacterial chromosome to the gene yneH/glsA2/b3512, which
encodes glutaminase 2 (EC 3.5.1.2). The gene yneH is
involved in the same glutamate metabolism pathway as EC
1.2.1.24. The closeness of yneI and yneH on the chromosome
suggests that they are involved in related functions.
Conclusion
We demonstrate in this work that genes encoding orphan
metabolic activities can be effectively identified by integrating
phylogenetic profiles with a partially known network. The
reported approach is significantly more accurate in compari-
son to a similar method based on mRNA co-expression [31].
We are able to predict five times more correct genes as the top
candidates and two times more within the top 50 candidates
out of about 6,000 unrelated yeast genes. It is likely that the
improvement in performance reflects larger functional cover-
age of the available phylogenetic profiles over mRNA co-
expression data. Indeed, the performances of the algorithms
based on mRNA co-expression and phylogenetic profiles are
similar when only well-perturbed network neighborhoods,
the neighborhoods with large changes in gene expression, are
considered.
The larger functional coverage of phylogenetic profiles allows
our approach to be extended to organisms with no or little
Genome Biology 2006, Volume 7, Issue 2, Article R17 Chen and Vitkup R17.9
comment reviews reports refereed researchdeposited research interactions information
Genome Biology 2006, 7:R17
expression data. As we demonstrate, the optimized parame-
ters are likely to be directly transferable between organisms.
Importantly, the incompleteness of the currently available
metabolic networks is not a major hindrance to the applica-
tion of our algorithm.
The performance of our algorithm significantly improves if
the specificity of the connections established by different
metabolites is taken into consideration. To account for the
connection specificity, the algorithm assigns smaller cost
function weights to connections established by widely used
(that is, non-specific) metabolites. Similar specificity correc-
tions should be useful for calculations based on other context-
based descriptors, such as mRNA expression.
Ultimately, to achieve maximal performance it will be neces-
sary to combine various sequence-based and context-based
descriptors. In Figure 6 we show how different context-based
associations change as a function of the network distance
between the metabolic genes. Four different context-based
associations are shown: gene co-expression, gene fusions
(Rosetta Stone), phylogenetic profiles, and chromosomal
gene clustering (similar relationships for E. coli are shown in
Additional data file 7). The figures demonstrate that different
context-based associations can contribute to 'focusing' a
hypothetical gene to its proper location in the network. We
are currently building a combined method (P. Kharchenko,
L.C., Y. Freund, D.V., G.M. Church, unpublished data) that
will integrate different associations in order to predict genes
responsible for orphan metabolic activities. We also plan to
apply similar gap-filling methods to other cellular networks.
Materials and methods
Construction of metabolic networks
We used the manually curated metabolic reaction set of For-
ster et al. [11] to construct the S. cerevisiae metabolic
network. The reaction set consists of 1,172 metabolic reac-
tions. The method to build a metabolic network from a reac-
tion set has been described elsewhere [31,32] and is
illustrated in Figure 7. The nodes of the network correspond
to metabolic genes, and the edges correspond to the connec-
tions established by metabolic reactions (Figure 7). Two met-
abolic genes are connected if the corresponding enzymes
share a common metabolite among their reactants or prod-
ucts. By calculating the shortest path between any two meta-
bolic genes we established the network distance metrics.
Orphan metabolic activities appear in the network as gaps
(Figure 7). We refer to 'first layer neighbors' (yellow in Figure
7) of a target gene to describe the collection of genes with dis-
tance one to the target gene, 'second layer neighbors' (blue in
Figure 7) to describe the genes with distance two, and so on.
While any metabolite can be used to establish connections
between metabolic genes, common metabolites and cofac-
tors, such as ATP, water or hydrogen, are not likely to connect
genes with similar metabolic functions. Indeed, the
performance of our algorithm on the network in which all
connections were present was significantly worse than on the
network in which highly connected metabolites were
excluded [31]. In order to determine an exclusion threshold,
we gradually removed the most highly connected metabolites
while monitoring the overall performances of the algorithm.
We found that the best performance was achieved when the
15 most highly connected metabolites were excluded from the
network reconstruction. Exclusion of more than the 15 most
connected metabolites increases prediction accuracy by a
slight margin, although the coverage of metabolic genes in the
network is reduced significantly. For instance, 20% and 50%
metabolic genes lost all their network connections when 120
and 240 most frequent metabolites were excluded, respec-
tively, while the network retains more than 99% of all meta-
bolic genes when only the 15 most frequent metabolites were
excluded. The results presented in this paper are thus based
on the metabolic network constructed without these 15 most
frequent metabolites: ATP, ADP, AMP, CO2, CoA, glutamate,
H, NAD, NADH, NADP, NADPH, NH3, GLC, orthophosphate
and pyrophosphate.
The reconstructed yeast network contains 615 known meta-
bolic genes and 230 orphan activities. On average, a meta-
bolic gene has 15.8, 76.2 and 200.0 neighbors on its first,
second and third layers in the neighborhood, respectively.
The average distance between a pair of metabolic genes in the
yeast network (network radius) is 3.48. In a similar manner
as for S. cerevisiae, we constructed the metabolic network for
E. coli from the iJR904 model by Reed et al. [10]. Again, the
15 most frequent metabolites were excluded. The E. coli net-
work contains 613 known metabolic enzymes and 136 orphan
activities with a network radius of 3.81.
Phylogenetic profile measures
Binary phylogenetic profiles
We constructed phylogenetic profiles for all 6,708 S. cerevi-
siae and 4,199 E. coli ORFs using automated BLAST searches
against a collection of 70 prokaryotic and eukaryotic genomes
(Additional data file 1). Our collection of genomes is similar to
the one used by Bowers et al. [26]. We deliberately filtered
evolutionarily similar genomes. To calculate phylogenetic
profile correlations between genes we used a 70-dimensional
binary vector representing presence or absence of homologs
of a target yeast or E. coli gene in query genomes. The
Pearson's correlation between the profile vectors (31) was cal-
culated using Equation 4:
where N is the total number of the lineages considered. For
genes X and Y, x is the number of times X occurs in the N lin-
eages, y is the number of times Y occurs in the N lineages, and
z is the number of times X and Y occur together.
r
Nz xy
Nx x Ny n
=
−
−−
()
()()
22
4
R17.10 Genome Biology 2006, Volume 7, Issue 2, Article R17 Chen and Vitkup />Genome Biology 2006, 7:R17
Naturally, our calculations of phylogenetic profiles rely on the
BLAST E-value threshold used for considering protein
homology of target genes. In the study by Bower et al. an E-
value of 10
-10
was used [26]. We tried different E-value cutoffs
(10
-2
to 10
-12
) looking for the best algorithm performance. We
found that an E-value of 10
-3
gave significantly better results
in comparison with either more (10
-10
) or less stringent (10
-2
)
thresholds; 3 and 5 times better, respectively. In this report,
unless otherwise specified, the binary phylogenetic profile
correlations were calculated using E = 10
-3
as the homology
threshold.
Normalized phylogenetic profiles and mutual information
Date et al. [42] introduced the use of normalized phylogenetic
profiles to infer functional associations. Instead of using a
predetermined E-value threshold to determine the presence
of a homolog for a protein i in a genome j, they proposed using
the value -1/logE
ij
, where E
ij
is the BLAST E-value of the top-
scoring sequence alignment hit for the target protein i in the
query genome j. In this way different degrees of sequence
divergence are captured without a predefined cutoff. We cal-
culated the Pearson's correlation coefficients between the
normalized phylogenetic profiles for all S. cerevisiae and E.
coli genes.
The study by Wu et al. [30], together with the study by Date
et al. [42], also suggested using mutual information (MI) to
assess protein functional association. We calculated MI
according to Equation 5:
Context-based associations versus the metabolic network distance for the yeast metabolic networkFigure 6
Context-based associations versus the metabolic network distance for the yeast metabolic network. (a) mRNA expression distance. The expression
distance is calculated as 1-|correlation|, where correlation is the Spearman's rank correlation between genes' mRNA expression. Close neighbors in the
metabolic network have similar expression profiles. (b) Gene fusion events (Rosetta Stone). The fraction of proteins involved in gene fusion events. The
adjacent genes in the network are much more likely to form a Rosetta Stone protein. (c) Phylogenetic profiles. Pearson's correlations between
phylogenetic profiles for genes close in the network are more likely to be similar. (d) Chromosomal distance between genes. The mean physical distances
(in kilobase pairs (kbp)) between ORFs are shown. The adjacent genes in the network are significantly closer to each other on yeast chromosomes.
Gene co-expression
0.76
0.78
0.8
0.82
0.84
0.86
0.88
12345678>=9
M etabolic network distance
E
xpres sio n dis tan c e
Gene fusion
0
0.0021
0.0042
0.0063
0.0084
0.0105
123456>=7
Metabolic network distan ce
Fraction of fusion events
Gene clustering
25
30
35
40
45
50
55
1234567>=8
Metabolic network distance
Mean distance (kb
p
)
Phylogenetic profile
0.1
0.15
0.2
0.25
0.3
12345678>=9
Metabolic network distance
Me
an
cor
r
elation
(a) (b)
(c)
(d)
Genome Biology 2006, Volume 7, Issue 2, Article R17 Chen and Vitkup R17.11
comment reviews reports refereed researchdeposited research interactions information
Genome Biology 2006, 7:R17
MI(A, B) = H(A) + H(B) - H(A, B) (5)
where H(A) = -∑p(a)lnp(a) represents the marginal entropy
of the probability distribution p(a) of gene A of occurring
among all query genomes and H(A, B) = -∑p(a, b)lnp(a, b)
represents the relative entropy of the joint probability distri-
bution p(a, b) of the genes A and B occurring across all the
query genomes used in this study. Two sets of MI, based on
the binary and normalized phylogenetic profiles described
above, were generated and used in our prediction.
We tested the effect of normalized phylogenetic profiles as
well as mutual information in our algorithm but did not
detect any significant improvements compared to binary
profiles (Additional data file 8). Since the procedure of gener-
ating binary phylogenetic profiles is more straightforward, in
this report, unless otherwise specified, we use the correla-
tions generated using binary phylogenetic profiles (E = 10
-3
).
COG-based phylogenetic profile
In addition to using BLAST searches to generate phylogenetic
profiles, we also utilize the COG database [36] as the source of
orthology information to create phylogenetic profiles. We
used the January 2005 version of the COG database consist-
ing of 44 genomes. We consider that an ortholog of a target
ORF exists in a query genome if a sequence from that genome
co-occurs in the same COG as the target gene. Based on the
COG orthology information, a binary phylogenetic profile
string was calculated for each gene and pair-wise correlations
were calculated using Equation 4.
Cost function optimization
Two methods were used to optimize the parameters of the
cost functions. First, following our previous analysis [31], the
layer weights were optimized using the Nelder-Mead simplex
algorithm [33]. The simplex optimization usually took 6 to 8
hours to converge on a Dell PowerEdge 1750 with Dual CPUs
at 2.8 GHz and 2 GB DDR SDRAM memory. We usually
carried out the simplex optimizations starting from many (10
to 15) randomly chosen starting points to check the sensitivity
towards initial conditions. Second, because the simplex algo-
rithm is deterministic and may miss a global parameter min-
imum, we also used a global SA algorithm [34]. We used the
SA algorithm to optimize all parameters used in the cost func-
tions, including the layer weights and the power factors for
both phylogenetic correlations and connection specificities.
Several annealing schedules were tried. Naturally, the SA
algorithm took much longer (usually >20 hours on the same
machine) to converge.
Using the SA optimization we obtained lower average ranks
for correct metabolic genes and thus better overall perform-
ance. For this reason, the results reported in the paper are
based on the SA optimization. However, we want to point out
Construction of a network from a list of metabolic reactionsFigure 7
Construction of a network from a list of metabolic reactions. The direct connections are established between the dependency pairs: gene pairs sharing
metabolites (M) as reactants or products. An orphan activity (metabolic network gap) is marked by a question mark and surrounded by known metabolic
genes. The first and second network layers around the gap are colored yellow and blue, respectively. E, enzyme.
+
E1
M1 M2
M3
E2
M4 M5
E3
M5 M3
Metabolic Netwo
r
k
E1
E3
Me
t
a
b
olic
R
e
a
c
t
io
n
s
?
M
1
M4
…
E2
E3
E2?
E1
?
…
E
E
E
E
E
M
M
?
E3
E1
E2
E3 ?
E
E
E
E
E
E
E
E
E
E
E
EE
E
E
E
E
E
E
Depe
n
dency Pairs
R17.12 Genome Biology 2006, Volume 7, Issue 2, Article R17 Chen and Vitkup />Genome Biology 2006, 7:R17
that these two algorithms (SA and the simplex) have compa-
rable performance on highly ranked genes (ranked 1 to 100;
Additional data file 3). Since our ultimate goal is to generate
a list of highly probable candidates for orphan activities to be
tested experimentally, the number of candidate genes for
each gap should probably not exceed 50 to 100. Thus, the sim-
plex algorithm, although not optimal, is probably sufficient
for this purpose.
Ten-fold cross-validation
We carried out a ten-fold cross-validation to estimate the
accuracy of our method and generalization errors. The set of
the known enzymes was randomly split into ten groups. One
such group of enzymes was left out each time and designated
as the test group. We then trained our method on the remain-
ing 90% of the enzymes and used the obtained parameters to
evaluate the performance on the test group.
Performance on partially known network
To evaluate the performance on incomplete metabolic net-
works, we deliberately deleted up to 50% of the enzyme nodes
in the S. cerevisiae metabolic network. The deleted nodes
were added to the candidate gene set, and the performance of
the algorithm was evaluated using the incomplete network.
This experiment was repeated ten times and the results
averaged.
Additional data files
The following additional data are available with the online
version of this paper. Additional data file 1 is a table showing
the genomes used in this study to generate phylogenetic pro-
files. Additional data file 2 is a table showing the effect of con-
nection specificity adjustment. Additional data file 3 is a
figure comparing the performance of the simplex and simu-
lated annealing algorithms. Additional data file 4 is a figure
comparing the predictions based on Equations 2 and 3.
Additional data file 5 is a figure showing 10-fold cross-valida-
tion of the algorithm. Additional data file 6 is a figure compar-
ing the predictions based on all yeast non-metabolic genes as
the candidate gene set, all hypothetical genes or a randomly
selected subset of yeast non-metabolic genes. Additional data
file 7 is a figure showing context-based association as a func-
tion of metabolic network distance in E. coli. Additional data
file 8 compares predictions based on normalized gene phylo-
genetic profiles, mutual information, and the method
reported in the paper. Additional data file 9 is a dataset of
sample predictions for E. coli and S. cerevisiae orphan
activities.
Additional File 1Genomes used in this study to generate phylogenetic profilesGenomes used in this study to generate phylogenetic profiles.Click here for fileAdditional File 2The effect of connection specificity adjustmentThe effect of connection specificity adjustment.Click here for fileAdditional File 3Comparison of the performance of the simplex and simulated annealing algorithmsComparison of the performance of the simplex and simulated annealing algorithms.Click here for fileAdditional File 4Comparison of the predictions based on Equations 2 and 3Comparison of the predictions based on Equations 2 and 3.Click here for fileAdditional File 5Ten-fold cross-validation of the algorithmTen-fold cross-validation of the algorithm.Click here for fileAdditional File 6Comparison of the predictions based on all yeast non-metabolic genes as the candidate gene set, all hypothetical genes or a ran-domly selected subset of yeast non-metabolic genesComparison of the predictions based on all yeast non-metabolic genes as the candidate gene set, all hypothetical genes or a ran-domly selected subset of yeast non-metabolic genes.Click here for fileAdditional File 7Context-based association as a function of metabolic network dis-tance in E. coliContext-based association as a function of metabolic network dis-tance in E. coli.Click here for fileAdditional File 8Comparison of predictions based on normalized gene phylogenetic profiles, mutual information, and the method reported in the paperComparison of predictions based on normalized gene phylogenetic profiles, mutual information, and the method reported in the paper.Click here for fileAdditional File 9Dataset of sample predictions for E. coli and S. cerevisiae orphan activitiesDataset of sample predictions for E. coli and S. cerevisiae orphan activities.Click here for file
Acknowledgements
We thank Drs Peter Kharchenko and Andrey Rzhetsky for valuable discus-
sions. We also thank anonymous reviewers for helpful suggestions.
References
1. Krieger CJ, Zhang P, Mueller LA, Wang A, Paley S, Arnaud M, Pick J,
Rhee SY, Karp PD: MetaCyc: a multiorganism database of met-
abolic pathways and enzymes. Nucleic Acids Res 2004:D438-442.
2. Schomburg I, Chang A, Ebeling C, Gremse M, Heldt C, Huhn G,
Schomburg D: BRENDA, the enzyme database: updates and
major new developments. Nucleic Acids Res 2004:D431-433.
3. Rost B: Enzyme function less conserved than anticipated. J
Mol Biol 2002, 318:595-608.
4. Tian W, Skolnick J: How well is enzyme function conserved as
a function of pairwise sequence identity? J Mol Biol 2003,
333:863-882.
5. Wilson CA, Kreychman J, Gerstein M: Assessing annotation
transfer for genomics: quantifying the relations between
protein sequence, structure and function through traditional
and probabilistic scores. J Mol Biol 2000, 297:233-249.
6. Henikoff JG, Pietrokovski S, Henikoff S: Recent enhancements to
the Blocks Database servers. Nucleic Acids Res 1997, 25:222-225.
7. Fetrow JS, Skolnick J: Method for prediction of protein function
from sequence using the sequence-to-structure-to-function
paradigm with application to glutaredoxins/thioredoxins and
T1 ribonucleases. J Mol Biol 1998, 281:949-968.
8. Wallace AC, Borkakoti N, Thornton JM: TESS: a geometric hash-
ing algorithm for deriving 3D coordinate templates for
searching structural databases. Application to enzyme
active sites. Protein Sci 1997, 6:2308-2323.
9. Tian W, Arakaki AK, Skolnick J: EFICAz: a comprehensive
approach for accurate genome-scale enzyme function
inference. Nucleic Acids Res 2004, 32:6226-6239.
10. Reed JL, Vo TD, Schilling CH, Palsson BO: An expanded genome-
scale model of Escherichia coli K-12 (iJR904 GSM/GPR).
Genome Biol 2003, 4:R54.
11. Forster J, Famili I, Fu P, Palsson BO, Nielsen J: Genome-scale
reconstruction of the Saccharomyces cerevisiae metabolic
network. Genome Res 2003, 13:244-253.
12. Osterman A, Overbeek R: Missing genes in metabolic pathways:
a comparative genomics approach. Curr Opin Chem Biol 2003,
7:238-251.
13. Karp PD: Call for an enzyme genomics initiative. Genome Biol
2004, 5:401.
14. Bork P, Jensen LJ, von Mering C, Ramani AK, Lee I, Marcotte EM: Pro-
tein interaction networks from yeast to human. Curr Opin
Struct Biol 2004, 14:292-299.
15. Eisenberg D, Marcotte EM, Xenarios I, Yeates TO: Protein function
in the post-genomic era. Nature 2000, 405:823-826.
16. Huynen MA, Bork P: Measuring genome evolution. Proc Natl
Acad Sci USA 1998, 95:5849-5856.
17. Pellegrini M, Marcotte EM, Thompson MJ, Eisenberg D, Yeates TO:
Assigning protein functions by comparative genome analy-
sis: protein phylogenetic profiles. Proc Natl Acad Sci USA 1999,
96:4285-4288.
18. Enright AJ, Iliopoulos I, Kyrpides NC, Ouzounis CA: Protein inter-
action maps for complete genomes based on gene fusion
events. Nature 1999, 402:86-90.
19. Marcotte EM, Pellegrini M, Ng HL, Rice DW, Yeates TO, Eisenberg
D: Detecting protein function and protein-protein interac-
tions from genome sequences. Science 1999, 285:751-753.
20. Yanai I, Derti A, DeLisi C: Genes linked by fusion events are gen-
erally of the same functional category: a systematic analysis
of 30 microbial genomes. Proc Natl Acad Sci USA 2001,
98:7940-7945.
21. DeRisi JL, Iyer VR, Brown PO: Exploring the metabolic and
genetic control of gene expression on a genomic scale. Sci-
ence 1997, 278:680-686.
22. Wu LF, Hughes TR, Davierwala AP, Robinson MD, Stoughton R, Alt-
schuler SJ: Large-scale prediction of Saccharomyces cerevisiae
gene function using overlapping transcriptional clusters. Nat
Genet 2002, 31:255-265.
23. Dandekar T, Snel B, Huynen M, Bork P: Conservation of gene
order: a fingerprint of proteins that physically interact.
Trends Biochem Sci 1998, 23:324-328.
24. Lee JM, Sonnhammer EL: Genomic gene clustering analysis of
pathways in eukaryotes. Genome Res 2003, 13:875-882.
25. Overbeek R, Fonstein M, D'Souza M, Pusch GD, Maltsev N: The use
of gene clusters to infer functional coupling. Proc Natl Acad Sci
USA 1999, 96:2896-2901.
26. Bowers PM, Pellegrini M, Thompson MJ, Fierro J, Yeates TO, Eisen-
Genome Biology 2006, Volume 7, Issue 2, Article R17 Chen and Vitkup R17.13
comment reviews reports refereed researchdeposited research interactions information
Genome Biology 2006, 7:R17
berg D: Prolinks: a database of protein functional linkages
derived from coevolution. Genome Biol 2004, 5:R35.
27. von Mering C, Zdobnov EM, Tsoka S, Ciccarelli FD, Pereira-Leal JB,
Ouzounis CA, Bork P: Genome evolution reveals biochemical
networks and functional modules. Proc Natl Acad Sci USA 2003,
100:15428-15433.
28. Korbel JO, Doerks T, Jensen LJ, Perez-Iratxeta C, Kaczanowski S,
Hooper SD, Andrade MA, Bork P: Systematic association of
genes to phenotypes by genome and literature mining. PLoS
Biol 2005, 3:e134.
29. Green ML, Karp PD: A Bayesian method for identifying missing
enzymes in predicted metabolic pathway databases. BMC
Bioinformatics 2004, 5:76.
30. Wu J, Kasif S, DeLisi C: Identification of functional links
between genes using phylogenetic profiles. Bioinformatics 2003,
19:1524-1530.
31. Kharchenko P, Vitkup D, Church GM: Filling gaps in a metabolic
network using expression information. Bioinformatics 2004,
20(Suppl 1):I178-I185.
32. Kharchenko P, Church GM, Vitkup D: Expression dynamics of a
cellular metabolic network. Mol Systems Biol 2005. doi:10.1038/
msb4100023.
33. Nelder JA, Mead R: A simplex method for function
minimization. Comput J 1965, 7:308-313.
34. Kirkpatrick S, Gelatt CD Jr, Vecchi MP: Optimization by simu-
lated annealing. Science 1983, 220:671-680.
35. von Mering C, Jensen LJ, Snel B, Hooper SD, Krupp M, Foglierini M,
Jouffre N, Huynen MA, Bork P: STRING: known and predicted
protein-protein associations, integrated and transferred
across organisms. Nucleic Acids Res 2005:D433-437.
36. Tatusov RL, Fedorova ND, Jackson JD, Jacobs AR, Kiryutin B, Koonin
EV, Krylov DM, Mazumder R, Mekhedov SL, Nikolskaya AN, et al.:
The COG database: an updated version includes eukaryotes.
BMC Bioinformatics 2003, 4:41.
37. Apweiler R, Bairoch A, Wu CH, Barker WC, Boeckmann B, Ferro S,
Gasteiger E, Huang H, Lopez R, Magrane M, et al.: UniProt: the Uni-
versal Protein knowledgebase. Nucleic Acids Res 2004:D115-119.
38. Holmes WB, Appling DR: Cloning and characterization of
methenyltetrahydrofolate synthetase from Saccharomyces
cerevisiae. J Biol Chem 2002, 277:20205-20213.
39. Duarte NC, Herrgard MJ, Palsson BO: Reconstruction and valida-
tion of Saccharomyces cerevisiae iND750, a fully compart-
mentalized genome-scale metabolic model. Genome Res 2004,
14:1298-1309.
40. Meredith TC, Woodard RW: Escherichia coli YrbH is a D-arab-
inose 5-phosphate isomerase. J Biol Chem 2003,
278:32771-32777.
41. Donnelly MI, Cooper RA: Two succinic semialdehyde dehydro-
genases are induced when Escherichia coli K-12 Is grown on
gamma-aminobutyrate. J Bacteriol 1981, 145:1425-1427.
42. Date SV, Marcotte EM: Discovery of uncharacterized cellular
systems by genome-wide analysis of functional linkages. Nat
Biotechnol 2003, 21:1055-1062.