Báo cáo y học: "Modulation of the transcription regulatory program in yeast cells committed to sporulation" ppt
Bạn đang xem bản rút gọn của tài liệu. Xem và tải ngay bản đầy đủ của tài liệu tại đây (592.99 KB, 14 trang )
Genome Biology 2006, 7:R20
comment reviews reports deposited research refereed research interactions information
Open Access
2006Friedlanderet al.Volume 7, Issue 3, Article R20
Research
Modulation of the transcription regulatory program in yeast cells
committed to sporulation
Gilgi Friedlander
*
, Daphna Joseph-Strauss
*
, Miri Carmi
*
, Drora Zenvirth
†
,
Giora Simchen
†
and Naama Barkai
*
Addresses:
*
Departments of Molecular Genetics and Physics of Complex System, Weizmann Institute of Science, Rehovot 76100, Israel.
†
Department of Genetics, The Hebrew University of Jerusalem, Jerusalem 91904, Israel.
Correspondence: Giora Simchen. Email: Naama Barkai. Email:
© 2006 Friedlander et al.; licensee BioMed Central Ltd.
This is an open access article distributed under the terms of the Creative Commons Attribution License ( which
permits unrestricted use, distribution, and reproduction in any medium, provided the original work is properly cited.
Commitment to sporulation<p>Analysis of the gene expression program in yeast cells suggests that commitment to sporulation involves an active modulation of the gene expression program.</p>
Abstract
Background: Meiosis in budding yeast is coupled to the process of sporulation, where the four
haploid nuclei are packaged into a gamete. This differentiation process is characterized by a point
of transition, termed commitment, when it becomes independent of the environment. Not much
is known about the mechanisms underlying commitment, but it is often assumed that positive
feedback loops stabilize the underlying gene-expression cascade.
Results: We describe the gene-expression program of committed cells. Sporulating cells were
transferred back to growth medium at different stages of the process, and their transcription
response was characterized. Most sporulation-induced genes were immediately downregulated
upon transfer, even in committed cells that continued to sporulate. Focusing on the metabolic-
related transcription response, we observed that pre-committed cells, as well as mature spores,
responded to the transfer to growth medium in essentially the same way that vegetative cells
responded to glucose. In contrast, committed cells elicited a dramatically different response.
Conclusion: Our results suggest that cells ensure commitment to sporulation not by stabilizing
the process, but by modulating their gene-expression program in an active manner. This unique
transcriptional program may optimize sporulation in an environment-specific manner.
Background
Meiosis is a specialized cell division by which haploid gametes
are generated from diploid cells. The principal features of
meiosis are common to all eukaryotic organisms and include
a single round of DNA replication ('premeiotic' replication)
followed by two consecutive nuclear divisions, meiosis I and
meiosis II. In the first meiotic division homologous chromo-
somes segregate to opposite poles, whereas in the second
division the two sister chromatids separate from each other.
Meiosis is characterized by a high frequency of recombination
events, occurring during a prolonged prophase that separates
DNA replication from the first meiotic division. This genetic
exchange between homologous chromosomes ensures that
they segregate properly and that the offspring differ geneti-
cally from their parents and from each other.
The meiotic process is coupled to a program of cellular differ-
entiation, which ultimately packages the haploid nuclei into
Published: 8 March 2006
Genome Biology 2006, 7:R20 (doi:10.1186/gb-2006-7-3-r20)
Received: 12 October 2005
Revised: 22 December 2005
Accepted: 9 February 2006
The electronic version of this article is the complete one and can be
found online at />R20.2 Genome Biology 2006, Volume 7, Issue 3, Article R20 Friedlander et al. />Genome Biology 2006, 7:R20
Figure 1 (see legend on next page)
357
2 3 4 5 6 7 8 9 10 11 12
20
40
60
80
1
00
2 4 6 8 10 12
10
10
0
R
e
c
M
I
M
I
I
A
sci
a
p
p
e
aran
ce
10
100
Rec
MI
MII
Asci
appearance
Asci in glucose (%)
Percentage (%)
Four nuclei (%)
Sporulation (hours)
(a)
Cell
morphology
Chromosomal
state
Early
(Ime1)
Middle
(Ndt80)
Mid-late
(?)
Late
(?)
Commitment
Meiosis I
Replication
DSBs formation
Recombination
Meiosis II
Spore
maturation
IME1 IME2 NDT80
SUM1
Early genes Middle genes
(b) (c)
(e) (f)(d)
Sporulation medium (hours)
Transfer
to rich
medium
(minutes)
23456 10987
5
20
40
140
80
MAT Nutrients
Sporulation (hours) Sporulation (hours)
His+/10
4
CFU
20
40
100
80
60
21291110874653
21291110874653
20
40
100
80
60
20
40
0
80
60
before transfer
after transfer
Genome Biology 2006, Volume 7, Issue 3, Article R20 Friedlander et al. R20.3
comment reviews reports refereed researchdeposited research interactions information
Genome Biology 2006, 7:R20
gametes. In the budding yeast Saccharomyces cerevisiae,
meiosis is coupled to the process of sporulation, in which the
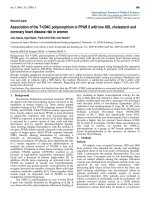
four haploid nuclei are packaged into spores (Figure 1a). In
this organism, diploid cells initiate meiosis when starved for
glucose and nitrogen. Starvation signals as well as diploidy
induce the transcription of IME1, which functions as a master
regulator of the sporulation process [1-5]. By activating mei-
otic regulators, Ime1 initiates a transcription cascade (Figure
1b). In addition, Ime1 directly induces the first wave of mei-
otic gene induction, consisting of genes involved in early mei-
otic events, such as DNA replication, recombination, and
synaptonemal complex formation. The second wave of gene
induction is observed at mid-sporulation, at about the time
when the cells initiate the first meiotic division, and includes
genes involved in the two meiotic divisions and spore-wall
formation. Notably, the principal regulator of mid-sporula-
tion genes, Ndt80, autoactivates its own expression [6].
Genome-wide assessment of transcription during sporulation
in yeast has revealed more than 1,000 genes whose mRNA
levels were significantly induced or repressed during the
process [7,8]. High-throughput loss-of-function studies have
shown that some, but not all, of these induced genes are
indeed essential for meiosis and spore formation [9-11].
Diploid yeast cells undergoing early stages of meiosis and
sporulation may return to the mitotic cell division if provided
with nutrients, especially glucose and a nitrogen source.
These return-to-growth (RTG) cells complete some meiotic
processes, such as high-frequency recombination [12,13], but
switch to the mitotic mode of chromosome segregation and
produce diploid cells, following a single division. It is not yet
clear how RTG cells resolve the high frequency of double-
strand breaks to ensure chromosomal fidelity, and how the
cells reinitiate the mitotic cell-cycle program after DNA repli-
cation but before chromosomal separation.
RTG may occur only up to a certain stage in the sporulation
process. Beyond this stage, cells will continue with sporula-
tion events even if challenged with rich nutritional condi-
tions. This stage of irreversibility was termed "commitment to
meiosis" [14]; it occurs after premeiotic DNA replication and
recombination have taken place, but before meiosis I. This
commitment is probably essential for ensuring cell viability,
as the sporulation process involves drastic changes in mor-
phology, chromosomal state and cell-wall composition, which
may be hazardous if abandoned before completion.
The molecular mechanism underlying commitment is not
understood. It was proposed that commitment to the meiotic
process involves the separation of spindle pole bodies (SPBs)
[15]. Indeed, SPB separation was shown to correlate with
commitment to mitosis [16]. Conditions that impair late
sporulation events may also impact on commitment [17]. In
particular, cells mutated in the SPO14 gene, which codes for
phospholipase D and is required for late sporulation events,
are able to return to growth even after completing meiosis I
[17]. The role of phospholipase D-dependent signaling in the
progression of the meiotic program is not yet clear.
To better understand the process of commitment to meiosis,
we examined the genome-wide transcription response trig-
gered by the transfer of sporulating cells to rich growth
medium at different stages of the process. At all stages, the
transfer initiated large-scale changes in the gene-expression
pattern. The majority of genes that were induced during
sporulation were immediately repressed upon the transfer to
growth medium, even in committed cells that continued to
sporulate. At the same time, committed cells displayed a
unique response to nutrients, which was dramatically differ-
ent from that observed in all other cell types examined (pre-
committed cells, spores or vegetative cells exposed to glu-
cose). This unique response consisted of metabolic-related
genes, as well as genes involved in competing developmental
processes such as pseudo-hyphal growth. Our findings sug-
gest that commitment to meiosis is achieved not by stabilizing
the transcription cascade, but rather by an active modulation
of the gene-expression program, the detailed nature of which
is only starting to be unraveled.
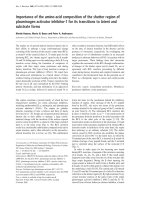
Experimental designFigure 1 (see previous page)
Experimental design. (a) Meiotic landmarks. The point of commitment is indicated. DSBs, double-strand breaks. (b) The regulatory network underlying
the sporulation gene-expression program. Known interactions are shown. Arrows denote activation, and barred lines represent inhibition. Solid lines
indicate regulation on the level of transcription while dashed lines indicate post-transcriptional regulation (for example, by protein phosphorylation).
Transcription factors are shown in black and the kinase in green. The input of the cascade is shown in gray and scissors indicate degredation. IME2
activates middle gene expression, at least in part, by relieving Sum1-mediated repression of NDT80 [34]. (c) The experimental design. The sporulation
process was initiated by transferring cells to sporulation medium. Cells were allowed to progress through the process for varying lengths of times, and
were then transferred back to rich nutrient-containing medium. Each circle represents a time point at which genome-wide gene expression was
monitored. (d) Temporal progression of sporulation. The percentages of cells that completed the first meiotic division (MI, triangles) or the second
meiotic division (MII, circles) are shown in red, the percentage of asci in black and the recombination frequencies (Rec, determined by the frequency of
His
+
cells) in gray. CFU, colony-forming units. (e,f) Commitment to sporulation. (e) Cells were transferred to YPD at different stages of sporulation and
were followed in YPD until 8 hours after sporulation initiation. The percentage of cells with four nuclei (determined by DAPI staining) before and after the
transfer is shown. The time of transfer from sporulation medium (SPM) is indicated. (f) Cells were transferred from SPM to glucose solution (4%) at
various times, as indicated. For each glucose culture, we calculated the fraction of cells that became spores, 24 hours after the initiation of the sporulation
process (normalized by the sporulation efficiency at that experiment, which was 80%). Cells that were transferred early (before 5 hours in SPM) arrested
in the cell cycle, as glucose alone does not support growth. At later times, cells continued the sporulation process and generated spores. Commitment
occurs at around 5-6 hours in SPM.
R20.4 Genome Biology 2006, Volume 7, Issue 3, Article R20 Friedlander et al. />Genome Biology 2006, 7:R20
Results
Experimental design
To examine the transcription program associated with com-
mitment to sporulation, we employed the RTG experimental
paradigm [12,18]. The sporulation process was initiated by
transferring cells to sporulation medium (SPM). Cells were
allowed to progress through the process for varying lengths of
times, and were then transferred back to nutrient-containing
media (Figure 1c). Cells that were transferred early, before the
initiation of the first meiotic division, grew buds and resumed
mitotic divisions. In contrast, most cells transferred at later
stages continued the sporulation process to produce spores
[12,14,18] (Figure 1d-e).
To define the time of commitment, we first followed meiotic
landmarks events (Figure 1d). Previous studies associated
commitment with a time before the completion of meiosis I,
which in our conditions occurred at around 5-6 hours in SPM.
Indeed, cells that were transferred to yeast extract/peptone/
dextrose medium (YPD) after five hours in SPM continued
through the second meiotic division also in YPD (Figure 1e).
As a more direct assay of commitment, we transferred cells
from SPM to a solution containing 4% glucose (see Materials
and methods). Glucose is a potent inhibitor of sporulation ini-
tiation, and indeed, cells that were transferred early (less than
five hours in SPM) abandoned the sporulation program and
arrested the cell cycle. In contrast, most cells transferred at a
later stage, after being more than five hours in SPM, contin-
ued the sporulation process and generated mature spores
(Figure 1f). Taken together, we conclude that commitment
occurs at around 5-6 hours in SPM. Significantly, mature
spores began to appear only at about 8 hours in SPM, reach-
ing the maximum percentage at about 12 hours in SPM (Fig-
ure 1d). Thus, the sporulation process continued in rich
medium for a considerable period of time before cells became
mature spores.
We used DNA microarrays representing the full yeast genome
to characterize the genome-wide expression profile at subse-
quent time points following the transfer of sporulating cells to
rich growth medium (YPD, Figure 1c). We examined also the
gene-expression profile before the transfer, during the sporu-
lation process itself, and compared it with the corresponding
transcription program characterized in two previous reports
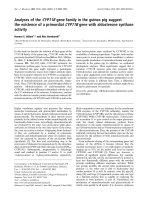
(Figure 2); Of the approximately 1,400 genes that were
induced more than twofold during sporulation in our experi-
ments, 576 were induced in both previous studies, and 484
additional genes were induced in just one of these studies.
Notably, the number of genes that were induced only in our
experiment (about 350) is comparable to the number of genes
identified uniquely by one of the studies (285) [7] and is sig-
nificantly lower then the number of genes identified uniquely
by the other (815) [8]. Moreover, the overall correlation
between all three experimental time courses is highly signifi-
cant, with the highest correlation found between our study
and the study of Chu et al. [7] (Figure 2a,b, and see Materials
and methods for calculation of these correlations).
The transfer of sporulating cells to YPD led to a large-scale
change in gene expression. Following the transfer, about
1,000 genes were induced by at least twofold. The identity of
the induced genes differed between early or late sporulating
cells (see below). The number of repressed genes varied
somewhat between early and late sporulating cells: around
1,200 genes were repressed over twofold in cells that were
transferred early, whereas only around 480 genes were
repressed when cells were transferred later in the sporulation
process. Evidently, sporulating cells sense and respond to the
growth medium at all stages of the sporulation process, even
after they have become committed to its completion.
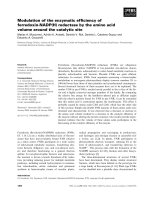
Comparison with previous studiesFigure 2
Comparison with previous studies. (a) Venn diagram comparing the genes
induced during sporulation in our experiment and in two previous
experiments [7,8]. A gene was defined as 'induced' at a particular time
point, if its expression level at that time point was at least twofold higher
than that of the pre-sporulation reference. All genes that were induced in
at least one of the sporulation time points were considered (the area in
the Venn diagram is proportional to the number of genes [63]). The
average correlations between pairs of experiments are indicated (see
Materials and methods for how correlations were calculated). (b)
Examples of expression profiles for specific genes obtained in the current
study (blue) and in the previous studies (red [7] and black [8]).
2468
-5
0
5
2468 2468
2468
-10
0
10
2468 2468
(a)
(b)
Current study
Primig et al. [8]
Chu et al. [7]
ZIP1 SPO16
SPS2 SPR28 DIT1
SPS100
Sporulation (hours)
Experiments
Average
correaltions
Current study -
Chu et al. [7]
Current study -
Primig et al. [8]
Chu et al. [7] -
Primig et al. [8]
0.57
0.55
0.46
353
172
192
576
292
285
815
10
101010
1010
Genome Biology 2006, Volume 7, Issue 3, Article R20 Friedlander et al. R20.5
comment reviews reports refereed researchdeposited research interactions information
Genome Biology 2006, 7:R20
The return to growth (RTG) transcription program
Cells that were exposed to growth medium during the early
stages of meiosis returned to mitotic growth. As expected,
these cells responded to YPD by immediately downregulating
virtually all genes that were induced as part of the early mei-
otic program (Figure 3a). Early meiotic genes are directly
induced by the transcription factor Ime1 [3], and their down-
regulation is probably a direct consequence of the glucose-
dependent repression of IME1 (Figure 3b) [1]. The reduction
in IME1 expression during sporulation from a peak at three
hours seems moderate compared with results from northern
analyses [1,19], but is consistent with previous microarray
experiments [7,8]. These differences may be due to the differ-
ent sensitivity of microarray versus northern analysis.
To try and infer the stage through which the cells re-enter the
mitotic cell cycle, we examined the response of genes known
to be regulated during different phases of the mitotic cell cycle
[20,21]. The G1 cyclin gene CLN3 was immediately induced
on the addition of YPD (Figure 3c). Indeed, Cln3 promotes
entry to the cell cycle [22] and serves as a negative regulator
of meiotic initiation [23,24]. Its induction during the return
to growth may thus assist in switching from meiosis to mitotic
growth. None of the other cyclins or cyclin-dependent kinases
was similarly induced. The overall pattern of gene induction,
however, was hard to interpret as it did not resemble any of
the mitotic cell-cycle phases. For example, although a signifi-
cant portion of the genes that are upregulated during either
G1 or the M phase of the mitotic cycle were induced also dur-
ing RTG, others, with similar expression patterns during the
mitotic cycle, were not (see Additional data file 3). A likely
explanation is that individual cells induce different cell-cycle
genes depending on which stage of meiosis they are coming
from, and this mixture of cell-cycle genes reflects the incom-
plete synchronization of our culture. In support of that inter-
pretation, genes that are induced during the S phase of the
mitotic cell cycle were induced during RTG only when the
transfer was done early enough (two hours in SPM) but not
later (see Additional data file 3).
In addition to reprogramming their gene expression, RTG
cells need to resolve meiosis-specific events and structures.
For example, the meiosis-specific alignment of homologous
chromosomes during the first meiotic division [25-27] does
not exist during mitosis. Indeed, the synaptonemal complex
(SC) structures, associated with meiotic pairing, disappear
rapidly upon RTG [13]. Moreover, meiosis is characterized by
a high level of post-replication double-strand breaks (DSBs),
which are required for initiating recombination events. Sin-
gle-gene studies indicated that in addition to the meiotic
repair pathways, additional mitotic DNA repair pathways are
used to resolve those breaks during RTG [13]. Not much is
known about the processes that are involved in the RTG pro-
gram, however.
To characterize RTG pathways we analyzed the expression
pattern of genes associated with DNA-related processes [28].
Interestingly, most such genes were induced either during
sporulation or during the return to the mitotic cell cycle, with
only a few induced during both processes (see, for example,
Figure 3d). It is likely that genes that are induced during RTG,
such as HAM1, RAD55, and MSH1, participate in this process.
A comprehensive classification of genes according to their
time of induction is provided in Additional data file 3. The
classification of homologous genes is also given in Additional
data file 3.
Downregulation of sporulation-specific genes in
committed cells
In contrast to early meiotic cells, which responded to YPD by
returning to mitotic growth, cells at later stages of sporulation
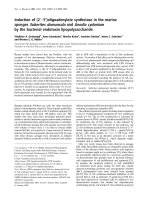
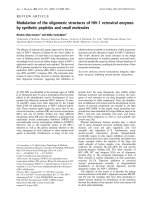
Transcriptional response of return to growth (RTG) cellsFigure 3
Transcriptional response of return to growth (RTG) cells. SPM,
sporulation medium; YPD, growth medium. (a) The expression pattern of
early sporulation (spo) genes (61 early I genes, as defined in [7]). Note the
immediate repression of these genes upon transfer to growth medium
(see Additional data file 3 for early genes defined according to the data
presented in the current study; see Additional data file 5 for a matlab
program that enables the reader to view the data in that format). (b)
Expression pattern of IME1, the regulator of early-sporulation genes. (c)
Expression pattern of the G1 cyclin gene, CLN3. In (a-c), expression
patterns are shown as log
2
ratios, and are color-coded for the log
2
fold
change according to the bar shown. (d) Polarized expression of genes
associated with DNA repair and DNA recombination. The matrix of
pairwise correlations between genes assigned to the GO groups 'DNA
recombination' and 'DNA repair' is plotted. The genes were clustered
according to similarity in their Pearson correlations, calculated on the
basis of their expression patterns in our experiment (see Materials and
methods). The average expression pattern of genes in each cluster is
shown on the right. The first cluster include genes expressed during early
sporulation, the second includes genes induced during middle sporulation,
the third shows genes induced during RTG, and the fourth genes that are
transiently induced on transfer to YPD and then repressed. The number of
genes in each cluster is indicated above the arrow. Some of the genes in
each cluster are indicated (for a full list of genes, and for a similar
representation of additional gene classes, see Additional data files 2 and 3).
Correlations are color-coded according to the bar shown.
40
CLN3
IME1
-1 0 1
RAD51, RFA2, PIF1, CAC2,
RFA1, UBC13, RFA3,
RAD54, REC104, RAD17,
RAD53, KIM3, REC107,
KIM2, MSH4, RAD52,
REC114, DMC1, HHO1…
RAD57, TFB1, IMP2',
MSH5, MFT1, DIN7,
REV7, SAE2, SPO11,
DHS1, TFB2, REV3,
HRR25, RAD7…
RAD3, RAD10, RAD16,
RAD27, RAD55, SNM1,
NUC1, CDC2, FOB1, HAM1,
PAN2, THI4, RFC2, RFC3,
RFC4, RFC5, SIR3, CCE1,
TOP3, MSH1, CTF4 , MSI1…
SOH1, RPH1, NSE1
0
1.5
0
1.5
0
1.5
-0.5
1.5
25 genes
14 genes
31 genes
3 genes
Genes
Genes
I. Early sporulation
II. Middle sporulation
III. RTG
IV. Transient
(a) (c)
(d)
(b)
2108746539
0
20
5
7
2108746539
0
20
5
0
1
-1
-4
0
1.5
Time in SPM (h)
Time in YPD (min)
Time in SPM (h)
Time in YPD (min)
Time in SPM (h)
Time in YPD (min)
210846539
0
20
5
40
40
Early spo genes
R20.6 Genome Biology 2006, Volume 7, Issue 3, Article R20 Friedlander et al. />Genome Biology 2006, 7:R20
continued to sporulate in rich medium (Figure 1e-f) [14,18].
Surprisingly, also in these committed cells, the exposure to
YPD led to a rapid downregulation of most sporulation-spe-
cific genes. For example, of the 269 genes that were induced
more than twofold during mid-sporulation, around 125 were
downregulated within the first 10 minutes of transfer to YPD,
and around 100 additional genes were downregulated within
the next 30 minutes (data not shown). Only 24 genes (9%),
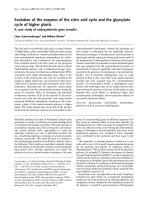
Transcriptional response of committed cellsFigure 4
Transcriptional response of committed cells. (a) Average expression of middle sporulation genes. The repressed group (245 genes) and the insulated
group (24 genes) are shown. Note that downregulation of the repressed group is specific to YPD, and is not observed on transfer to YPA (which contains
nitrogen and acetate) or glucose (4% solution). (b) Expression pattern of NDT80. Expression patterns in (a) and (b) are shown in log
2
ratios, as in Figure 3,
and log
2
fold change in expressionis color-coded according to the bar. (c) A summary of the behavior of all sporulation-induced genes. All genes induced
during sporulation were considered. A gene was defined as induced at a certain time point during sporulation if it was upregulated more than twofold in
that time as well as in the previous and following hours. The induced genes were classified into three categories, depending on their behavior on transfer
to YPD: repressed, induced, and insulated. The 'repressed' category included genes that were downregulated by at least 1.5-fold when transferred
compared with their level during sporulation. Similarly, the 'induced' category included genes whose expression was upregulated by at least 1.5-fold on
transfer. The 'insulated' group included the genes whose expression remained stable (did not change) upon the transfer (expression after transfer to YPD
was less than 1.3-fold relative to sporulation).
Time (h)
2
2345678910
0
100
200
300
400
500
600
Number of genes
2108
4
6
53
9
0
20
5
40
7
(a)
(b) (c)
Repressed
(245 genes)
Insulated
(24 genes)
2
10
846539
0
20
5
40
7
0
20
5
40
28465397
210846539
0
20
5
40
7
2
108
46539
0
20
5
40
7
0
20
5
40
2
0
3
0
0
6
4
0
0
6
0
3
NDT80 Sporulation-induced genes
210846
5
39
0
20
5
40
7
0
4
Repressed
Insulated
Induced
Time in SPM (h)
Time in YPD (min)
Time in SPM (h)
Time in YPD (min)
Time in SPM (h)
Time in YPA (min)
Time in SPM (h)
Time in YPA (min)
Time in SPM (h)
Time in Glucose (min)
Time in SPM (h)
Time in Glucose (min)
28465
3
97
Time in SPM (h)
Time in YPD (min)
Transfer to YPD Transfer to YPA Transfer to Glucose
Genome Biology 2006, Volume 7, Issue 3, Article R20 Friedlander et al. R20.7
comment reviews reports refereed researchdeposited research interactions information
Genome Biology 2006, 7:R20
most of which associated with spore-wall biogenesis, main-
tained stable expression for longer times (Figure 4a, and see
Additional data file 3).
Large-scale phenotypic studies have shown that only a por-
tion of the genes that are induced during sporulation are also
required for the process [9,29]. One possibility is that the
sporulation-induced genes that were repressed upon the
transfer to YPD are not in fact required for sporulation. To
test this possibility, we examined in detail the properties of
the repressed genes. This set included numerous cell-cycle
genes that are required for the two consecutive meiotic divi-
sions [30-32], such as genes coding for most components of
the anaphase-promoting complex (APC), its activator Cdc20,
the B-type cyclins Clb1,3-6, the polo-like kinase Cdc5, the
securin Pds1, the gene CDC15 and the kinesin-like coding
gene KAR3 (see Additional data file 3). Several genes involved
in spore-wall formation were also identified. Thus, many of
the genes that were immediately repressed upon the addition
of YPD have a well-established role in sporulation.
Moreover, the major meiotic regulator genes such as IME2
and SMK1, were also repressed upon transfer to rich medium
(see Additional data file 2). In particular, NDT80, the master
regulator of the mid-sporulation genes, was downregulated as
well (Figure 4b). This indicates that the capacity of Ndt80 to
autoactivate its gene expression is not sufficient for stabiliz-
ing its expression on exposure to rich growth medium. Inter-
estingly, neither glucose alone nor acetate- and nitrogen-
containing growth medium (yeast extract/peptone/potas-
sium acetate (YPA)) were sufficient to cause this
downregulation, indicating a combinatorial requirement for
both factors (Figure 4a).
Downregulation of sporulation-induced genes in
committed cells is independent of NDT80 or SUM1
The sporulation-specific expression of most mid-sporulation
genes is induced directly by the meiotic regulator Ndt80 [6],
and is inhibited by the meiotic repressor Sum1 (Figure 1b).
Ndt80 and Sum1 compete for the same DNA sequence [33].
During sporulation in SPM, Ndt80 is activated, whereas
Sum1 is targeted for degradation, leading to the induction of
mid-sporulation genes [34]. We asked whether the downreg-
ulation of mid-sporulation genes in YPD reflects a repression
of Ndt80 expression, or perhaps an accumulation of Sum1. To
examine this possibility, we constructed a strain that main-
tained stable expression of NDT80 on transfer to YPD. This
was done by replacing the endogenous NDT80 promoter with
a promoter of the gene SPS4 (Figure 5a,b). Maintaining stable
NDT80 expression did not eliminate the downregulation of
most mid-sporulation genes (Figure 5c). Moreover, downreg-
ulation was also observed in a strain deleted of the mid-
sporulation repressor gene SUM1 (Figure 5c). Those results
indicate that the observed repression does not depend on the
expression of the meiotic regulators, but may result from
post-transcriptional modification of Ndt80, or from more
direct effects of the growth medium.
The general response to glucose is dramatically
modified in committed cells
Taken together, our results indicated that the transfer of
sporulating cells to glucose-containing growth medium
altered the expression of most sporulation-specific genes,
even in committed cells that proceed to become viable spores
in rich medium. We next asked whether the transfer of sporu-
lating cells to YPD altered the expression of additional genes,
which are not part of the normal sporulation cascade. Such a
response could reflect general effects of the growth medium.
Alternatively, it could also indicate specific regulation that is
important for ensuring the continuation of meiotic progres-
sion in rich medium.
Response of mid-sporulation genes to YPD in pSPS4-NDT80 and ∆sum1 strainsFigure 5
Response of mid-sporulation genes to YPD in pSPS4-NDT80 and ∆sum1
strains. (a) Expression pattern of SPS4 in wild-type cells. (b) The
expression of NDT80 in pSPS4-NDT80 cells. Cells were incubated for 5.5
hours in SPM, and were then transferred to YPD. Gene expression is
shown at different time points following the transfer, as indicated. Note
that a high level of NDT80 mRNA is maintained (compare with Figure 4b,
note the different times). (c) The average expression of mid-sporulation
genes in pSPS4-NDT80 and in ∆sum1 strain. The repressed group (245
genes) and the insulated group (24 genes) are shown. Expression patterns
in (a-c) are shown in log
2
ratios, and are coded according to the colored
bars.
5
210846539
0
20
5
40
7
6
0
6
6
(b)
(c)
(a)
NDT80 (in
pSPS4-NDT80)
SPS4
5.5
5.5
5.5
0
20
40
0
20
5
40
0
20
5
40
0
20
5
40
0
20
40
0
4
0
4
3
2.2
2.2
3.2
5
0
pSPS4-NDT80
∆sum1
Repressed
(245 genes)
Insulated
(24 genes)
pSPS4-NDT80
∆sum1
Time in SPM (h)
Time in YPD (min)
Time in SPM (h)
Time in YPD (min)
Time in SPM (h)
Time in YPD (min)
Time in SPM (h)
Time in YPD (min)
Time in SPM (h)
Time in YPD (min)
Time in SPM (h)
Time in YPD (min)
R20.8 Genome Biology 2006, Volume 7, Issue 3, Article R20 Friedlander et al. />Genome Biology 2006, 7:R20
Glucose is also a potent regulator of gene expression in vege-
tative cells. The transcription response of yeast cells to glu-
cose was characterized in a recent study [35], showing a
dramatic modification of the transcription program. Altered
expression was observed for numerous genes involved in
metabolic processes, as well as in protein synthesis [35]. We
asked whether the addition of glucose-containing growth
medium to sporulating cells invokes a similar metabolic
response. To eliminate differences resulting from the
response of sporulation-specific genes, we focused on 936
genes whose expression was altered by the addition of glucose
to vegetative cells [35] and which showed a significant
response also in our experiment.
Clearly, pre-committed cells responded to rich medium in
essentially the same way as vegetative cells respond to glucose
(Figure 6a). In sharp contrast, cells that were transferred to
rich medium after commitment, but before the completion of
the sporulation process, displayed a strikingly different
response (Figure 6a). For example, a large number of genes
involved in rRNA processing, which are induced by glucose in
vegetative cells, were not induced in committed cells (Figure
6b). Similarly, genes that are normally repressed by growth
medium, such as those involved in gluconeogenesis, were not
repressed in committed cells (Figure 6c). An interesting
exception was the genes coding for ribosomal proteins, which
were induced by YPD in all cells irrespective of their stage of
sporulation (Figure 6d).
To examine whether this distinct transcription response to
glucose is a property of cells maturing in the sporulation proc-
ess, we also examined the response of fully developed spores,
which have been in sporulation medium for three days. In
those cells, the addition of rich medium initiates the process
of germination. Interestingly, spores responded to rich
medium in essentially the same manner as vegetative or pre-
committed cells (Figure 6a). We conclude that the modified
transcription response, observed in committed cells,
characterizes the sporulation process itself, and not the
mature spore state.
Gene expression during sporulation in YPD
Next we asked which genes are induced specifically in com-
mitted cells on transfer to YPD. Such genes could be classified
into two groups. First, a 'process-linked' group was defined.
Genes in this group were induced during late meiosis in SPM
(at around 8-9 hours), and were also induced in YPD, at vari-
able times that appeared to be linked to the progression of
sporulation (Figure 6e). Second, a 'commitment-specific'
group was defined, which included genes that were induced
by YPD specifically in committed cells (Figure 6f). Genes in
this group were not induced during normal meiosis in SPM,
and were also insensitive to YPD during early sporulation.
About 60 genes display a 'process-linked' expression pattern
(see Figure 6e and Additional data file 3). Among these we
identified two sporulation-specific genes, which are involved
in spore-wall formation (DIT1 and SPS100). Surprisingly,
however, most genes in this group are not in fact classified as
sporulation genes, and do not have a recognized role in the
process. Rather, most genes in this group are associated with
The general metabolic response to glucoseFigure 6
The general metabolic response to glucose. (a) The matrix of pairwise
correlations describing the similarity in the response of cells transferred to
YPD at different stages of the process is shown. We also compared these
responses with the response of vegetative cells and mature spores to
YPD. Correlations were calculated on the basis of 936 genes whose
expression is induced after the addition of glucose to vegetative cells (see
Materials and methods and Additional data file 3). A similar correlation
pattern was also observed on transfer to glucose solution (see Additional
data file 2). (b-g) Expression patterns in log
2
ratios of specific gene groups:
(b) rRNA processing genes [64] (see Additional data file 3); (c)
gluconeogenesis module [64] (see Additional data file 3); (d) ribosomal
proteins module [64] (see Additional data file 3); (e) 'process-specific'
group (see Additional data file 3). (f,g) A group of genes that is (f)
upregulated (see Additional data file 3) or (g) downregulated on transfer
to YPD specifically after commitment (see Additional data file 3). See
Materials and methods for the identification of groups shown in (e-g). Each
expression profile is accompanied by a colored bar indicating the log
2
fold
change.
0
0.5
1
Transfer Time (h)
Vegetative
growth
Transfer Time (h)
(a)
(g)(f)
(e)(d)
(c)(b)
2108465
3
9
0
20
5
40
7
210846539772
2
10
8
4
6
5
3
9
7
72
29 genes 25 genes
117 genes 60 genes
63 genes 50 genes
Time in SPM (h)
Time in YPD (min)
Time in SPM (h)
Time in YPD (min)
Time in SPM (h)
Time in YPD (min)
Time in SPM (h)
Time in YPD (min)
Time in SPM (h)
Time in YPD (min)
Time in SPM (h)
Time in YPD (min)
2
0
3
-2
0.5
-1
0
-1.5
1
-2
-1
-4
210846539
0
20
5
40
7210846539
0
20
5
40
7
2108465
3
9
0
20
5
40
7
210846539
0
20
5
40
7
210846539
0
20
5
40
7
Vegetative
Genome Biology 2006, Volume 7, Issue 3, Article R20 Friedlander et al. R20.9
comment reviews reports refereed researchdeposited research interactions information
Genome Biology 2006, 7:R20
the general environmental stress response (ESR), which is
invoked in response to a variety of different environmental
stresses [36,37]. Examples include genes coding for heat-
shock proteins (such as HSP12, GRE1, and SIP18), for the
stress-induced transcription factor Xbp1, and for the Tor1
kinase. Accordingly, the promoter regions of most of those
genes contained the stress-response element CCCCT. The
induction of this gene group may reflect some stress signal
associated with the progression of sporulation.
The 'commitment-specific' gene group included around 65
genes that were induced by YPD specifically after commit-
ment. In parallel, about 50 genes were repressed by YPD spe-
cifically after commitment (see Figure 6f-g and Additional
data file 3). Those genes may be part of a modified transcrip-
tion program that assists the continuation of the sporulation
process in rich medium. Interestingly, the repressed group
includes two genes that function in the pseudohyphal growth
pathway (MUC1 and MSB2). It is likely that repression of
these genes assists in the inhibition of this alternative devel-
opmental route.
In vegetative cells, much of the glucose effect is mediated
through cyclic AMP-dependent protein kinases (PKAs),
which are activated upon the addition of glucose [38,39] (Fig-
ure 7a). In particular, active PKAs block the onset of sporula-
tion [40]. Notably, BCY1, which codes for the negative
regulatory subunit of the PKAs, was specifically induced in
committed cells (Figure 7b). To gain further insight into the
regulation of the PKA pathway, we analyzed the expression
pattern of genes whose glucose-dependent induction in vege-
tative cells is mediated by the PKA pathway. Indeed, these
genes altered their expression upon the addition of YPD to
early meiotic cells, but not when YPD was added to cells that
have progressed beyond the commitment point (Figure 7c,d).
Taken together, it appears that the addition of glucose-con-
taining growth-medium to committed cells leads to the
repression, rather than activation, of the PKA pathway.
Discussion
Differentiation processes proceed through a sequence of
events involving coordinate modulations of morphology and
gene expression. In many cases, once the process has passed
a certain stage it becomes determined and loses its depend-
ence on environmental signals. This transition is termed
commitment. Mechanisms for achieving commitment can be
classified into two broad classes. First, a passive mechanism
might be imagined, whereby the process becomes effectively
insulated from the external signals. Alternatively, commit-
ment might require an active modulation of the signaling
apparatus, which senses the external signal, but interprets it
in a specific manner that optimizes the continuation of the
process in changing conditions.
Differentiating cells could be insulated from the environment
through the inhibition of essential sensory receptors, such as
the receptors for glucose or nitrogen in the case of yeast
sporulation. Effective insulation of the differentiation process
could also be achieved through positive feedback loops that
would render the process self-sustaining. Such positive feed-
backs are ubiquitous in differentiation cascades. In the case of
the Xenopus oocyte at least this positive feedback loop has
been shown to be important for commitment [41]. Also in the
case of yeast sporulation, the capacity of Ndt80 to autoacti-
vate its own gene expression could in principle implement
such a feedback.
Our gene-expression analysis ruled out the possibility that
commitment to sporulation is achieved through a passive
mechanism. Cells responded to nutrients at all stages of the
sporulation process (see Additional data file 5 for a matlab
program that enables the reader to view our data). In fact,
within 5 minutes of the addition of rich medium, we observed
a change in the expression pattern of over 1,000 genes
(around 15% of the yeast genome). Importantly, this large-
scale transcription response was dramatically different in
committed versus non-committed cells, and was highly spe-
cific to the type of medium added. In particular, the response
seen on addition of YPD (containing both glucose and nitro-
gen) was distinct from that observed on the addition of YPA
Regulation of PKA in committed cellsFigure 7
Regulation of PKA in committed cells. (a) The PKA pathway. The addition
of glucose to a non-fermenting yeast culture results in a rapid increase in
the cellular level of cyclic AMP (cAMP, red circle), which binds to the
regulatory subunit of PKA, thereby releasing and activating the catalytic
subunits. Arrows indicate activation and barred lines indicate inhibition.
(b) BCY1 expression. (c,d) The average expression of PKA-responsive
genes. The average is over (c) 161 PKA-induced and (d) 314 PKA-
repressed genes (identified by [35]). Each expression pattern is
accompanied by a colored bar indicating the log
2
fold change.
PKA induced
(161 genes)
PKA repressed
(314 genes)
BCY1
(a)
(d)
(c)
(b)
Glucose
cAMP
Bcy1 Bcy1
Bcy1 Bcy1
PKA PKA
PKA
PKA
Inactive
PKA
Active PKA
Growth and proliferation
Glycolisis
Stress response
Autophagy
Storage carbohydrates
Entry to sporulation
210846539
0
20
5
40
7
Time in SPM (h)
Time in YPD (min)
210846539
0
20
5
40
7
Time in SPM (h)
Time in YPD (min)
210846539
0
20
5
40
7
Time in SPM (h)
Time in YPD (min)
-2
1
0
1
-1
0
R20.10 Genome Biology 2006, Volume 7, Issue 3, Article R20 Friedlander et al. />Genome Biology 2006, 7:R20
(containing nitrogen and acetate, but not glucose) or on the
addition of glucose alone. This indicates that the reduction in
mRNA is a result of combinatorial regulation. The machinery
of committed cells responds to the combination of glucose
and nitrogen signals. This behavior suggests that active mod-
ulation of the response to external signals takes place. This
modulation may play a central role in enabling the continua-
tion of the sporulation process after the addition of nutrients.
How do the cells achieve commitment to meiosis? The contin-
uation of sporulation in rich media poses two complementary
challenges. First, cells need to overcome mitogenic signals,
which in vegetative cells facilitate the mitotic program. Sec-
ond, cells need to ensure the continuation of the sporulation
process itself. Our data suggest that these two aspects are
goverened by complementary molecular mechanisms.
The mitogenic effects of glucose are mediated to a large extent
by the PKA pathway [42,43]. This pathway represents a cen-
tral junction in the choice between the meiotic and the mitotic
programs: Entry into the mitotic cell cycle requires high activ-
ity of this pathway, whereas entry into meiosis requires low
PKA activity [40,44-48]. Interestingly, our data suggest that
committed cells respond to glucose not by activating the PKA
pathway, but rather by inhibiting it through the induction of
BCY1, the gene coding for the negative regulatory unit of the
PKAs. This inhibition is probably required in order to over-
come mitogenic signals, to ensure the continuation of the
meiotic program upon the addition of nutrients.
The addition of either YPD or glucose to committed cells
failed to induce the typical set of glucose-responsive genes. In
contrast, the addition of YPD (but not of glucose alone) had a
dramatic effect on the sporulation cascade itself. In fact, the
vast majority of genes that are induced during sporulation in
SPM were immediately repressed. This repression did not
reflect the lack of functional requirement, as many of the
repressed genes had a well defined role in the two meiotic
divisions or in the formation of the spore wall. It may be that
the proteins encoded by these genes are already synthesized
at the time of commitment in sufficient amounts to complete
the meiotic division. Alternatively, it is possible that the
downregulation of at least some of the mid-sporulation genes
is in fact required to prevent a shift back to the mitotic cell
cycle upon the addition of nutrients, thus augmenting the
cells' commitment. Further work is needed in order to better
understand the nature of this downregulation and its poten-
tial contribution to the commitment process.
Whereas the transcription program characterizing sporula-
tion in sporulation medium (SPM) was practically eliminated
in YPD, a group of around 60 late-sporulation genes was also
induced in YPD, in a temporal manner that appears to be
linked to the progression of the sporulation process. Surpris-
ingly, the vast majority of these genes do not have a known
role in sporulation. Rather, this group included a majority of
stress-related genes, which are also induced in response to a
variety of environmental stresses [36]. The timely induction
of these genes may indicate the generation of some stress-
related signal. Such stress could be initiated, for example, by
the onset of spore-wall deposition, similarly to the stress sig-
nal that ensues after the formation of a mating projection (a
shmoo) during the mating process [49]. In the case of mating,
this stress signal is propagated through the protein kinase C
(PKC) pathway to induce the second wave of gene expression.
It is tempting to propose that here also, an analogous stress
signal may be associated with the commitment, by marking
the initiation of a particular developmental stage (for exam-
ple, spore-wall formation) and triggering subsequent proc-
esses required for the completion of sporulation. It is of
interest that the formation of the pro-spore membrane is ini-
tiated on the SPBs that were implicated in commitment [15].
Such a proposal may also be consistent with a potential role
for SPO14 in both the formation of a spore membrane and the
commitment to sporulation [50]. This proposition awaits fur-
ther experimental validation.
In conclusion, previous theoretical and experimental work
has shown that bistability, generated through positive feed-
back loops, can render a process irreversible by effectively
isolating it from external signals [41,51-53]. In contrast,
sporulating cells modulate their transcription program in
response to changing conditions, proceeding through differ-
ent alternative paths. This alternative strategy is likely to be
beneficial when a differentiating cell is challenged not only
with the removal of the initiating signal but also with compet-
ing signals that could potentially interfere with structural or
morphological processes, or could signal alternative fates.
The experimental design presented here could be applied to
distinguish between these alternatives. Further studies are
required to examine which of the two strategies is more
prominent during cellular differentiation.
Materials and methods
Yeast strains and plasmids
All strains used for this study are of the SK1 genetic back-
ground and are listed in Additional data file 3. The pSPS4-
3HA-NDT80 strain (GF18) was constructed by a one-step
PCR-based replacement method [54] using the plasmid
pFA6a-pSPS4-3HA-KanMX6. The latter was constructed by
replacing the GAL1 promoter fragment in pFA6a-pGAL-3HA-
KanMX6 with a 1 kb PCR fragment of the SPS4 promoter.
Transformed haploids NKY1712 were mated with strain
NE30. Integration to the correct site was verified by PCR.
Diploids were selected on minimally supplemented yeast syn-
thetic dextrose (SD) plates and were checked for sporulation
efficiency on sporulation plates.
Genome Biology 2006, Volume 7, Issue 3, Article R20 Friedlander et al. R20.11
comment reviews reports refereed researchdeposited research interactions information
Genome Biology 2006, 7:R20
Sporulation, return to growth, and germination
experiments
The compositions of all media are given in Additional data file
3. Cells (NKY1551, JPY214, or GF18) were grown to saturation
in YPD for 24 hours, diluted into YPA and grown overnight.
The cells were then washed twice in sterile water and resus-
pended in SPM to initiate the sporulation process. At differ-
ent stages of the sporulation process, cells were centrifuged
and resuspended in rich medium. At each time point, 5 × 10
8
cells were frozen in liquid nitrogen. To monitor the meiotic
divisions, 2 ml of cells were kept for staining with 4,6-diamid-
ino-2-phenylindole (DAPI). To monitor recombination fre-
quencies at the HIS4 locus, cells were plated on both YPD and
-His plates, and colonies were counted after three days incu-
bation at 30°C. All liquid cultures were grown at 30°C with
constant shaking. Sporulation efficiency was determined by
counting asci in the overnight SPM culture. For germination
experiments, cells (DS1) were grown to saturation in YPD for
24 hours and plated on sporulation plates. Three-day-old asci
were harvested and suspended in YPD at 30°C to initiate
spore germination.
DAPI staining
Cells (2 ml) were centrifuged for 30 seconds, fixed in 0.25 mM
Tris, 70% ethanol and kept at 4°C. Before staining, cells were
washed in 1× PBS solution (137 mM NaCl, 2.7 mM KCl, 8 mM
Na
2
HPO
4
, 2 mM KH
2
PO
4
), sonicated for 5 seconds and cen-
trifuged. One microliter DAPI (at a concentration of 25 µg/
ml) was added to the pellet and incubated in the dark for 10
minutes at room temperature. The number of nuclei per cell
was counted using a fluorescence microscope. Around 300
cells were analyzed for each sample.
Defining the timing of commitment
To define the time of commitment, we transferred sporulat-
ing cells from SPM to a solution containing 4% glucose at
various times (Figure 1f). Glucose is a potent inhibitor of
sporulation initiation, but glucose alone does not support
growth or germination. For each time point, we calculated the
fraction of cells that became spores in over night glucose cul-
tures. We used glucose rather then YPD in this experiment
because glucose does not support growth of vegetative cells or
germination of mature spores. This allows for a precise quan-
tification of the fraction of spores after overnight incubation.
In contrast, on transfer to YPD, the uncommitted cells initiate
growth and cell division, and quickly take over the popula-
tion. Moreover, as the culture is not fully synchronized, some
spores may start to germinate early, while others have not yet
become spores. We normalized for this effect when looking at
the completion of meiotic division II among DAPI-stained
cells (Figure 1e), but such normalization is difficult for the
longer times corresponding to spore maturation. Thus,
although we clearly saw the formation of mature spores in
cells transferred to YPD after five hours in SPM, it was diffi-
cult to use this fraction as a quantitative measure for
commitment.
RNA extraction and labeling
Total RNA was extracted using the RNeasy Midi Kit (Qiagen,
Valencia, USA) and reverse transcribed using M-MLV reverse
transcriptase RNase H Minus (Promega, Madison, USA).
cDNA products were labeled with Cy3 and Cy5 by the indirect
amino-allyl method [55] with minor modifications. Total
RNA (20 µg) was combined with 8 µg of oligo(dT) 12- to 18-
mer (Amersham Pharmacia Biotech, Little Chalfont, UK) in a
final volume of 26 µl and heated to 70°C for 10 minutes to
denature RNA tertiary structures. The mixture was then
transferred to 45°C to anneal the primers. A preheated (50°C)
12 µl mixture containing reaction buffer (Promega), 2.5 mM
MgCl
2
, 0.5 mM dATP, dCTP and dGTP, 0.1 mM dTTP, 0.4
mM amino-allyl dUTP (Ambion, Austin, USA), RNase H
Minus and 40 Units RNasin (Promega) was added to the
RNA, and the reaction mixture was incubated for 2 hours at
45°C with 400 units of Superscript II (Gibco, Carlsbad, USA).
An additional 400 units of the enzyme was applied to the
reaction mixture, which was incubated for another 2 hours.
After incubation, RNA was hydrolyzed by adding 10 µl of 1 M
NaOH and incubating at 65°C for 30 minutes. The reaction
mixture was neutralized by titration with 1 M Tris-HCl pH
7.5, and DNA was precipitated with ethanol, resuspended in
10 µl 0.1 M sodium carbonate buffer pH 9.3. Cy3 and Cy5
(Amersham) were dissolved in 10 µl DMSO. Cy5 or Cy3 (1.25
µl) was added to the sample and incubated at 25°C for 1 hour.
Labeled cDNA was purified by Strataprep PCR purification
kit (Stratagene, La Jolla, USA) according to the manufac-
turer's instructions. Dye incorporation was measured using a
spectrophotometer. Reference RNA for all microarrays in this
work was from YPA-grown cells, just before the transfer to
SPM.
Microarray hybridization
For each hybridization, cDNA samples were labeled with Cy3
and Cy5 and combined with blockers: 5 µg herring sperm
(Promega), 5 µg tRNA (Gibco) and 17.5 µg poly(A) (poly(A)
oligonucleotides were synthesized at mixed lengths of 40, 50,
and 60 adenine residues). The labeled cDNAs were concen-
trated to 40 µl using Microcon (Millipore, Bedford, USA) and
40 µl of 2× hybridization solution (10× SSC, 50% formamide,
0.2% SDS) was added. Microarrays containing all yeast open
reading frames (ORFs) were prehybridized by incubating at
42°C for 45 minutes in a solution containing 1% BSA, 25% for-
mamide, 5× SSC and 0.1% SDS. The slides were washed in
sterile water and dried by centrifugation (3 minutes, 2,000
rpm). The labeled samples were boiled for 5 minutes, centri-
fuged for 1 minute, hybridized on the slide and placed in a
hybridization chamber (Corning, Corning, USA) for over-
night incubation at 42°C. The slides were then washed for 5
minutes at 42°C with a solution containing 2× SSC and 0.1%
SDS. An additional wash was performed at room temperature
with a solution containing 0.1× SSC and 0.1% SDS, followed
by three additional washes at room temperature in 0.1× SSC
solution. For most experiments, we used arrays purchased
from the University Health Network Microarray Center,
R20.12 Genome Biology 2006, Volume 7, Issue 3, Article R20 Friedlander et al. />Genome Biology 2006, 7:R20
Toronto, Canada, where PCR products are printed. For the
YPA experiment (35 arrays) we used slides obtained from F.
Holstege (UMC Utrecht, the Netherlands), where genes are
represented by 70-base oligonucleotides [56]. Control exper-
iments have been performed to check that differences in the
data were not caused by differences in the arrays (these data
have been deposited in the Gene Expression Omnibus (GEO)
database run by the National Center for Biotechnology Infor-
mation (NCBI) [57-59] and are accessible through GEO
Series accession number GSE3820).
Scanning and quantification
Images were obtained using ScanArray 4000 (Packard Bio-
Science, Meriden, USA). Image analysis was performed using
QuantArray version 3 software (PerkinElmer Life Sciences,
Boston, USA), with spots quantified using the adaptive
method. Low-quality spots were discarded following detailed
visual inspection. The data were then transformed into log
2
ratios, and normalized by subtracting the median. Values of
replicate spots on the slides were averaged (see Additional
data file 1 for MIAME data). The data discussed in this publi-
cation have been deposited in GEO [59] and are accessible
through GEO Series accession numbers: GSE3814, GSE3815,
GSE3816, GSE3817, GSE3818, GSE3819 and GSE3820
[57,58] (see also Additional data file 4).
Calculating the correlation coefficients with results of
previous experiments
To compare our sporulation time course with previous exper-
iments, the different time courses were first aligned such that
similar time points corresponded to each other (progression
into sporulation) [60,61]. In each pairwise comparison, one
experiment (A) was held constant and the other (B) was
transformed to best match the time points of A. The transfor-
mation was done in two steps: first, smoothing splines were
used to add intermediate time points to B (by creating a con-
tinuous representation of B, and re-sampling it at a higher
frequency) [60]; second, we searched for the time points of B
that maximizes the correlations between each time point in A
and the corresponding time point in B over all genes. We only
considered the time points of A, or transformations of the
kind T' = T*(1 + k1) + k2, where T are the time points of A, k1
is a 'stretching' parameter, and k2 is a 'shifting' parameter.
After transforming B, we calculated the average correlation
between corresponding time points in A and B, over all genes
(the same measure that was used to determine the optimal
transformation). For each pairwise comparison of A and B
this procedure was done twice, once when starting with A and
once when starting with B. The average correlation is given.
Comparison of the responses of sporulating cells,
vegetative cells and spores to glucose
We included in this analysis genes whose expression was
altered by the addition of glucose to vegetative cells. To
reduce noise, we filtered out genes whose expression was not
altered by YPD in our experiment (transfer of sporulating
cells to YPD). We ended with 936 genes (see Additional data
file 3). For the vegetative cell data, we calculated the average
expression profile over the three given time points (20, 40,
and 60 minutes), and considered a given gene to be down- or
upregulated if its average expression change exceeded two-
fold. For the sporulation data, we considered the YPD expres-
sion relative to that observed during sporulation, and
calculated the average expression change observed at 20 and
40 minutes after the transfer. For spores that completed the
sporulation process, we calculated the average expression
response observed at 15 and 30 minutes following the addi-
tion of YPD. Correlations were calculated between these aver-
age profiles. The correlation matrix of the sporulation data
was clustered [62] (separately for glucose-induced and glu-
cose-repressed genes). Only genes belonging to homogeneous
clusters were kept.
Identification of gene groups
A few genes with a common expression pattern were chosen
as template genes. To find more genes with the same expres-
sion pattern we calculated the correlation of each gene in the
genome with each of the template genes. The genes were
ordered according to their correlation with the template gene.
Genes with the highest correlation were defined as genes in
the group. For each template gene the threshold was deter-
mined by inspection of the expression pattern of the genes
obtained. The top genes with the same expression pattern
were chosen. The qualitative results of our study do not
depend on these thresholds.
Utilization of Gene Ontology annotations for
identification of polarized gene expression during
sporulation and RTG
For each of the chosen Gene Ontology (GO) [28] groups we
filtered out genes in the group which their expression did not
change (we kept only genes whose expression changed more
than twofold in one array at least). We then obtained a matrix
of the expression of the selected genes in the following condi-
tions: the sporulation time points and transfers to YPD at
early times (2, 3, and 4 hours). The correlation between any
two genes in this matrix was computed to give the gene-gene
correlation matrix. We then clustered [62] this gene-gene
correlation matrix and chose homogeneous clusters.
Additional data files
The following additional data files are included with this arti-
cle: Additional data file 1 includes minimum information
about a microarray experiment (MIAME). Additional data file
2 includes supplementary figures S1 to S3. Figure S1 shows
polarized expression during sporulation and RTG. Figure S2
shows the expression pattern of IME2 and SMK1. Figure S3
shows a matrix of pairwise correlations that exemplifies the
general metabolic response to glucose. Additional data file 3
includes supplemental tables S1 to S17. Table S1 includes a list
of early sporulation genes. Table S2 includes a complete list of
Genome Biology 2006, Volume 7, Issue 3, Article R20 Friedlander et al. R20.13
comment reviews reports refereed researchdeposited research interactions information
Genome Biology 2006, 7:R20
genes used in Figure 3d of the paper. Table S3 lists examples
of genes that according to their expression during RTG are
regulated by the mitotic cell cycle. Table S4 lists genes that are
induced during RTG (20 minutes after the transfer). Table S5
lists genes that are induced during RTG (immediately after
the transfer). Table S6 lists homologous genes which are
induced during sporulation or RTG. Table S7 lists middle
sporulation genes that are repressed upon transfer to YPD.
Table S8 lists insulated middle sporulation genes. Table S9
lists the 936 genes used for Figure 6a. Table S10 lists rRNA-
processing genes. Table S11 lists gluconeogenesis genes.
Table S12 lists genes that encode ribosomal proteins. Table
S13 lists genes induced in a time-dependent manner. Table
S14 lists genes that are induced in response to YPD in com-
mitted cells. Table S15 lists genes that are repressed in
response to YPD in committed cells. Table S16 includes a list
of the yeast strains used in the present study. Table S17
includes the composition of the media used in the present
study. Additional data file 4 includes the normalized data of
the present study (in log
2
ratios). Addtional file 5 is a zip file
containing a matlab program that enables to view the expres-
sion data discussed in this article. It contains also a help file.
Additional File 1MIAME checklistA checklist containing minimum information about a microarray experiment. (MIAME)Click here for fileAdditional File 2Supplementary Figures S1-S3.Figure S1 shows polarized expression during sporulation and RTG. Figure S2 shows the expression pattern of IME2 and SMK1. Figure S3 shows a matrix of pairwise correlations that exemplifies the gen-eral metabolic response to glucose.Click here for fileAdditional File 3Supplementary Tables S1-S17Table S1 includes a list of early sporulation genes. Table S2 includes a complete list of genes used in Figure 3d of the paper. Table S3 lists examples of genes that according to their expression during RTG are regulated by the mitotic cell cycle. Table S4 lists genes that are induced during RTG (20 min after the transfer). Table S5 lists genes that are induced during RTG (immediately after the trans-fer). Table S6 lists homologous genes which are induced during sporulation or RTG. Table S7 lists middle sporulation genes that are repressed upon transfer to YPD. Table S8 lists insulated middle sporulation genes. Table S9 lists the 936 genes used for Figure 6a. Table S10 lists rRNA-processing genes. Table S11 lists gluconeo-genesis genes. Table S12 lists genes that encode ribosomal proteins. Table S13 lists genes induced in a time-dependent manner. Table S14 lists genes that are induced in response to YPD in committed cells. Table S15 lists genes that are repressed in response to YPD in committed cells. Table S16 includes a list of the yeast strains used in the present study. Table S17 includes the composition of the media used in the present study.Click here for fileAdditional File 4Normalized data of the present study (in log
2
ratios)Normalized data of the present study (in log
2
ratios)Click here for fileAdditional File 5ViewModulesA matlab program that enables the expression data discussed in this article to be viewed. Also contains a help file: 'ViewModules help.pdf'Click here for file
Acknowledgements
We thank members of our groups for discussions. We are grateful to Itay
Tirosh for help in comparing experiments. This work was supported by the
NIH Grant No. A150562, and the Israel Ministry of Science and
Technology.
References
1. Kassir Y, Granot D, Simchen G: IME1, a positive regulator gene
of meiosis in S. cerevisiae. Cell 1988, 52:853-862.
2. Shefer-Vaida M, Sherman A, Ashkenazi T, Robzyk K, Kassir Y: Posi-
tive and negative feedback loops affect the transcription of
IME1, a positive regulator of meiosis in Saccharomyces
cerevisiae. Dev Genet 1995, 16:219-228.
3. Rubin-Bejerano I, Mandel S, Robzyk K, Kassir Y: Induction of mei-
osis in Saccharomyces cerevisiae depends on conversion of the
transcriptional represssor Ume6 to a positive regulator by
its regulated association with the transcriptional activator
Ime1. Mol Cell Biol 1996, 16:2518-2526.
4. Covitz PA, Mitchell AP: Repression by the yeast meiotic inhibi-
tor RME1. Genes Dev 1993, 7:1598-1608.
5. Sagee S, Sherman A, Shenhar G, Robzyk K, Ben-Doy N, Simchen G,
Kassir Y: Multiple and distinct activation and repression
sequences mediate the regulated transcription of IME1, a
transcriptional activator of meiosis-specific genes in Saccha-
romyces cerevisiae. Mol Cell Biol 1998, 18:1985-1995.
6. Chu S, Herskowitz I: Gametogenesis in yeast is regulated by a
transcriptional cascade dependent on Ndt80. Mol Cell 1998,
1:685-696.
7. Chu S, DeRisi J, Eisen M, Mulholland J, Botstein D, Brown PO, Her-
skowitz I: The transcriptional program of sporulation in bud-
ding yeast. Science 1998, 282:699-705.
8. Primig M, Williams RM, Winzeler EA, Tevzadze GG, Conway AR,
Hwang SY, Davis RW, Esposito RE: The core meiotic transcrip-
tome in budding yeasts. Nat Genet 2000, 26:415-423.
9. Enyenihi AH, Saunders WS: Large-scale functional genomic
analysis of sporulation and meiosis in Saccharomyces
cerevisiae. Genetics 2003, 163:47-54.
10. Deutschbauer AM, Williams RM, Chu AM, Davis RW: Parallel phe-
notypic analysis of sporulation and postgermination growth
in Saccharomyces cerevisiae. Proc Natl Acad Sci USA 2002,
99:15530-15535.
11. Briza P, Bogengruber E, Thur A, Rutzler M, Munsterkotter M, Dawes
IW, Breitenbach M: Systematic analysis of sporulation pheno-
types in 624 non-lethal homozygous deletion strains of Sac-
charomyces cerevisiae. Yeast 2002, 19:403-422.
12. Sherman F, Roman H: Evidence for two types of allelic recom-
bination in yeast. Genetics 1963, 48:255-261.
13. Zenvirth D, Loidl J, Klein S, Arbel A, Shemesh R, Simchen G: Switch-
ing yeast from meiosis to mitosis: double-strand break
repair, recombination and synaptonemal complex. Genes
Cells 1997, 2:487-498.
14. Simchen G, Pinon R, Salts Y: Sporulation in Saccharomyces cere-
visiae: premeiotic DNA synthesis, readiness and
commitment. Exp Cell Res 1972, 75:207-218.
15. Horesh O, Simchen G, Friedmann A: Morphogenesis of the syn-
apton during yeast meiosis. Chromosoma 1979, 75:101-115.
16. Hirschberg J, Simchen G: Commitment to the mitotic cell cycle
in yeast in relation to meiosis. Exp Cell Res 1977, 105:245-252.
17. Honigberg SM, Esposito RE: Reversal of cell determination in
yeast meiosis: postcommitment arrest allows return to
mitotic growth. Proc Natl Acad Sci USA 1994, 91:6559-6563.
18. Ganesan AT, Holter H, Roberts C: Some observations on sporu-
lation in saccharomyces. CR Trav Lab Carlsberg [Chim] 1958,
13:1-6.
19. Smith HE, Mitchell AP: A transcriptional cascade governs entry
into meiosis in Saccharomyces cerevisiae. Mol Cell Biol 1989,
9:2142-2152.
20. Spellman PT, Sherlock G, Zhang MQ, Iyer VR, Anders K, Eisen MB,
Brown PO, Botstein D, Futcher B: Comprehensive identification
of cell cycle-regulated genes of the yeast Saccharomyces cer-
evisiae by microarray hybridization. Mol Biol Cell 1998,
9:3273-3297.
21. Cho RJ, Campbell MJ, Winzeler EA, Steinmetz L, Conway A, Wodicka
L, Wolfsberg TG, Gabrielian AE, Landsman D, Lockhart DJ, et al.: A
genome-wide transcriptional analysis of the mitotic cell
cycle. Mol Cell 1998, 2:65-73.
22. Wijnen H, Landman A, Futcher B: The G(1) cyclin Cln3 promotes
cell cycle entry via the transcription factor Swi6. Mol Cell Biol
2002, 22:4402-4418.
23. Purnapatre K, Piccirillo S, Schneider BL, Honigberg SM: The CLN3/
SWI6/CLN2 pathway and SNF1 act sequentially to regulate
meiotic initiation in Saccharomyces cerevisiae. Genes Cells 2002,
7:675-691.
24. Colomina N, Gari E, Gallego C, Herrero E, Aldea M: G1 cyclins
block the Ime1 pathway to make mitosis and meiosis incom-
patible in budding yeast. EMBO J 1999, 18:320-329.
25. Martini E, Keeney S: Sex and the single (double-strand) break.
Mol Cell 2002, 9:700-702.
26. Kleckner N: Meiosis: how could it work? Proc Natl Acad Sci USA
1996, 93:8167-8174.
27. Roeder GS: Meiotic chromosomes: it takes two to tango.
Genes Dev 1997, 11:2600-2621.
28. Ashburner M, Ball CA, Blake JA, Botstein D, Butler H, Cherry JM,
Davis AP, Dolinski K, Dwight SS, Eppig JT, et al.: Gene ontology:
tool for the unification of biology. The Gene Ontology
Consortium. Nat Genet 2000, 25:25-29.
29. Rabitsch KP, Toth A, Galova M, Schleiffer A, Schaffner G, Aigner E,
Rupp C, Penkner AM, Moreno-Borchart AC, Primig M, et al.: A
screen for genes required for meiosis and spore formation
based on whole-genome expression. Curr Biol 2001,
11:1001-1009.
30. Shanks RM, Bascom-Slack C, Dawson DS: Analysis of the kar3
meiotic arrest in Saccharomyces cerevisiae. Cell Cycle 2004,
3:363-371.
31. Cohen-Fix O: Meiosis: polo, FEAR and the art of dividing
reductionally. Curr Biol 2003, 13:R603-R605.
32. Lee BH, Amon A: Role of Polo-like kinase CDC5 in program-
ming meiosis I chromosome segregation. Science 2003,
300:482-486.
33. Xie J, Pierce M, Gailus-Durner V, Wagner M, Winter E, Vershon AK:
Sum1 and Hst1 repress middle sporulation-specific gene
expression during mitosis in Saccharomyces cerevisiae. EMBO
J 1999, 18:6448-6454.
34. Pak J, Segall J: Regulation of the premiddle and middle phases
of expression of the NDT80 gene during sporulation of Sac-
charomyces cerevisiae. Mol Cell Biol 2002, 22:6417-6429.
35. Wang Y, Pierce M, Schneper L, Guldal CG, Zhang X, Tavazoie S,
Broach JR: Ras and gpa2 mediate one branch of a redundant
glucose signaling pathway in yeast. PLoS Biol 2004, 2:E128.
36. Gasch AP, Spellman PT, Kao CM, Carmel-Harel O, Eisen MB, Storz
R20.14 Genome Biology 2006, Volume 7, Issue 3, Article R20 Friedlander et al. />Genome Biology 2006, 7:R20
G, Botstein D, Brown PO: Genomic expression programs in the
response of yeast cells to environmental changes. Mol Biol Cell
2000, 11:4241-4257.
37. Causton HC, Ren B, Koh SS, Harbison CT, Kanin E, Jennings EG, Lee
TI, True HL, Lander ES, Young RA: Remodeling of yeast genome
expression in response to environmental changes. Mol Biol Cell
2001, 12:323-337.
38. Thevelein JM: Signal transduction in yeast. Yeast 1994,
10:1753-1790.
39. Broach JR, Deschenes RJ: The function of ras genes in Saccharo-
myces cerevisiae. Adv Cancer Res 1990, 54:79-139.
40. Matsumoto K, Uno I, Ishikawa T: Initiation of meiosis in yeast
mutants defective in adenylate cyclase and cyclic AMP-
dependent protein kinase. Cell 1983, 32:417-423.
41. Xiong W, Ferrell JE Jr: A positive-feedback-based bistable
'memory module' that governs a cell fate decision. Nature
2003, 426:460-465.
42. Thevelein JM, de Winde JH: Novel sensing mechanisms and tar-
gets for the cAMP-protein kinase A pathway in the yeast Sac-
charomyces cerevisiae. Mol Microbiol 1999, 33:904-918.
43. Broach JR: RAS genes in Saccharomyces cerevisiae: signal trans-
duction in search of a pathway. Trends Genet 1991, 7:28-33.
44. Gancedo JM: Control of pseudohyphae formation in Saccharo-
myces cerevisiae. FEMS Microbiol Rev 2001, 25:107-123.
45. Shenhar G, Kassir Y: A positive regulator of mitosis, Sok2, func-
tions as a negative regulator of meiosis in Saccharomyces
cerevisiae. Mol Cell Biol 2001, 21:1603-1612.
46. Matsuura A, Treinin M, Mitsuzawa H, Kassir Y, Uno I, Simchen G:
The adenylate cyclase/protein kinase cascade regulates
entry into meiosis in Saccharomyces cerevisiae through the
gene IME1. EMBO J 1990, 9:3225-3232.
47. Shilo V, Simchen G, Shilo B: Initiation of meiosis in cell cycle ini-
tiation mutants of Saccharomyces cerevisiae. Exp Cell Res 1978,
112:241-248.
48. Rubin-Bejerano I, Sagee S, Friedman O, Pnueli L, Kassir Y: The in vivo
activity of Ime1, the key transcriptional activator of meiosis-
specific genes in Saccharomyces cerevisiae, is inhibited by the
cyclic AMP/protein kinase A signal pathway through the gly-
cogen synthase kinase 3-beta homolog Rim11. Mol Cell Biol
2004, 24:6967-6979.
49. Roberts CJ, Nelson B, Marton MJ, Stoughton R, Meyer MR, Bennett
HA, He YD, Dai H, Walker WL, Hughes TR, et al.: Signaling and
circuitry of multiple MAPK pathways revealed by a matrix of
global gene expression profiles. Science 2000, 287:873-880.
50. Honigberg SM, Conicella C, Espositio RE: Commitment to meio-
sis in Saccharomyces cerevisiae: involvement of the SPO14
gene. Genetics 1992, 130:703-716.
51. Jacob F, Monod J: Genetic regulatory mechanisms in the syn-
thesis of proteins. J Mol Biol 1961, 3:318-356.
52. Lisman JE: A mechanism for memory storage insensitive to
molecular turnover: a bistable autophosphorylating kinase.
Proc Natl Acad Sci USA 1985, 82:3055-3057.
53. Hofer T, Nathansen H, Lohning M, Radbruch A, Heinrich R: GATA-
3 transcriptional imprinting in Th2 lymphocytes: a mathe-
matical model. Proc Natl Acad Sci USA 2002, 99:9364-9368.
54. Longtine MS, McKenzie A 3rd, Demarini DJ, Shah NG, Wach A, Bra-
chat A, Philippsen P, Pringle JR: Additional modules for versatile
and economical PCR-based gene deletion and modification
in Saccharomyces cerevisiae. Yeast 1998, 14:953-961.
55. Guterman I, Shalit M, Menda N, Piestun D, Dafny-Yelin M, Shalev G,
Bar E, Davydov O, Ovadis M, Emanuel M, et al.: Rose scent: genom-
ics approach to discovering novel floral fragrance-related
genes. Plant Cell 2002, 14:2325-2338.
56. van de Peppel J, Kemmeren P, van Bakel H, Radonjic M, van Leenen
D, Holstege FC: Monitoring global messenger RNA changes in
externally controlled microarray experiments. EMBO Rep
2003, 4:387-393.
57. Barrett T, Suzek TO, Troup DB, Wilhite SE, Ngau WC, Ledoux P,
Rudnev D, Lash AE, Fujibuchi W, Edgar R: NCBI GEO: mining mil-
lions of expression profiles - database and tools. Nucleic Acids
Res 2005:D562-D566.
58. Edgar R, Domrachev M, Lash AE: Gene Expression Omnibus:
NCBI gene expression and hybridization array data
repository. Nucleic Acids Res 2002, 30:207-210.
59. Gene Expression Omnibus (GEO) [http://
www.ncbi.nlm.nih.gov/geo/]
60. Bar-Joseph Z, Gerber GK, Gifford DK, Jaakkola TS, Simon I: Contin-
uous representations of time-series gene expression data. J
Comput Biol 2003, 10:341-356.
61. Aach J, Church GM: Aligning gene expression time series with
time warping algorithms. Bioinformatics 2001, 17:495-508.
62. Alon U, Barkai N, Notterman DA, Gish K, Ybarra S, Mack D, Levine
AJ: Broad patterns of gene expression revealed by clustering
analysis of tumor and normal colon tissues probed by oligo-
nucleotide arrays. Proc Natl Acad Sci USA 1999, 96:6745-6750.
63. Matlab Central, Proportional Venn Diagrams
[http:www.mathworks.comatlabcentrafileexchangloadFile.do?objec-
tId=6116&objectType=file]
64. Ihmels J, Bergmann S, Barkai N: Defining transcription modules
using large-scale gene expression data. Bioinformatics 2004,
20:1993-2003.