Báo cáo y học: "Inferring transcriptional modules from ChIP-chip, motif and microarray data" pptx
Bạn đang xem bản rút gọn của tài liệu. Xem và tải ngay bản đầy đủ của tài liệu tại đây (626.22 KB, 14 trang )
Genome Biology 2006, 7:R37
comment reviews reports deposited research refereed research interactions information
Open Access
2006Lemmenset al.Volume 7, Issue 5, Article R37
Method
Inferring transcriptional modules from ChIP-chip, motif and
microarray data
Karen Lemmens
*
, Thomas Dhollander
*
, Tijl De Bie
†
, Pieter Monsieurs
*
,
Kristof Engelen
*
, Bart Smets
‡
, Joris Winderickx
‡
, Bart De Moor
*
and
Kathleen Marchal
*§
Addresses:
*
BIOI@SCD, Department of Electrical Engineering, KU Leuven, Kasteelpark Arenberg, B-3001 Heverlee, Belgium.
†
Research Group
on Quantitative Psychology, Department of Psychology, KU Leuven, Tiensestraat, B-3000 Leuven, Belgium.
‡
Molecular Physiology of Plants
and Micro-organisms Section, Biology Department, KU Leuven, Kasteelpark Arenberg, B-3001 Heverlee, Belgium.
§
CMPG, Department of
Microbial and Molecular Systems, KU Leuven, Kasteelpark Arenberg, B-3001 Heverlee, Belgium.
Correspondence: Kathleen Marchal. Email:
© 2006 Lemmens et al.; licensee BioMed Central Ltd.
This is an open access article distributed under the terms of the Creative Commons Attribution License ( which
permits unrestricted use, distribution, and reproduction in any medium, provided the original work is properly cited.
Network module discovery<p>ReMoDiscovery, a module discovery algorithm and software that uses ChIP-chip data, motif information and gene-expression profiles, is presented.</p>
Abstract
'ReMoDiscovery' is an intuitive algorithm to correlate regulatory programs with regulators and
corresponding motifs to a set of co-expressed genes. It exploits in a concurrent way three
independent data sources: ChIP-chip data, motif information and gene expression profiles. When
compared to published module discovery algorithms, ReMoDiscovery is fast and easily tunable. We
evaluated our method on yeast data, where it was shown to generate biologically meaningful
findings and allowed the prediction of potential novel roles of transcriptional regulators.
Background
Complex cellular behavior is mediated by the action of regu-
latory networks. The reconstruction of these networks is one
of the foremost challenges of current bioinformatics research
[1,2] and requires combining different high throughput
'omics' data. With the current accuracy and availability of
these high throughput data, the problem of network recon-
struction remains highly underdetermined. The amount of
independent experimental data is not sufficient to unequivo-
cally estimate all parameters of the models. Previous studies,
however, have unveiled that regulatory networks are modular
and hierarchically organized [3]. Inferring modules instead of
full networks drastically reduces the complexity of the infer-
ence problem and shows great promise for systems biology
research [4]. A transcriptional network is reduced to a mod-
ule consisting of a regulatory program and a corresponding
set of co-expressed genes. The program, a set of regulators
and their corresponding motifs, is responsible for the condi-
tion-dependent expression of the module's genes.
Traditionally, module identification methods dealt with each
of the different 'omics' data sources separately (for example,
solely based on microarrays [4]). However, simultaneous
analysis of distinct data sources has a major advantage over
their separate analysis: their integration allows gaining holis-
tic insight into the network and a more refined definition of
transcriptional modules can be derived [5]. Therefore, the
more recent approaches for module inference combine sev-
eral data sources.
Harbison et al. [6] and Kato et al. [7] both describe pragmatic
approaches to analyze heterogeneous data. The approach by
Segal et al. [4] focused on the identification of regulatory
modules from microarray data with probabilistic models and
Published: 5 May 2006
Genome Biology 2006, 7:R37 (doi:10.1186/gb-2006-7-5-r37)
Received: 15 September 2005
Revised: 21 December 2005
Accepted: 10 April 2006
The electronic version of this article is the complete one and can be
found online at />R37.2 Genome Biology 2006, Volume 7, Issue 5, Article R37 Lemmens et al. />Genome Biology 2006, 7:R37
was extended by Xu et al. [8] to incorporate ChIP-chip data.
Tanay et al. [3] developed an advanced graph bicluster algo-
rithm to simultaneously integrate expression data, ChIP-
chip, protein interaction and phenotypic data. Bar-Joseph et
al. [9] developed a procedure that learns modules from
microarray and ChIP-chip data using a sequential analysis of
the data. In a first step, the ChIP-chip data is used to find a set
of genes whose upstream regions are likely to bind a common
set of transcriptional regulators. In a second step, the micro-
array data is used to find a subset of this gene set, containing
only those genes whose expression profiles are similar to each
other. Finally, the resulting core set is expanded with addi-
tional genes that have a small combined p value for the same
set of regulators in the ChIP-chip data.
In this paper, we present an alternative approach for module
discovery based on heterogeneous data. It is different in spirit
from previously suggested methods in that our algorithm
takes distinct data sources related to transcriptional regula-
tion, that is, microarray, ChIP-chip and motif data, into
account in a concurrent (non-iterative or sequential) way. In
contrast to previous methods, where motifs are mainly
defined in a downstream analysis step, we use motif data as
an independent information source. We demonstrate the per-
formance of our method on well characterized yeast datasets.
Results
We aim at identifying transcriptional modules by searching
microarray data for target genes with a common expression
profile that also share the same regulatory program, based on
evidence from ChIP-chip and motif data. Module detection by
'ReMoDiscovery' consists of two steps. In a first seed discov-
ery step, stringent seed modules are identified (Figure 1). This
seed discovery problem translates into finding gene sets (row
dimension in Figure 1) that are co-expressed in microarray
data (matrix M), that bind the same regulators (share the
same columns in the ChIP-chip matrix) and that have the
same motifs in their intergenic region (same columns in the
motif matrix (Figure 1)). In a second seed extension step, the
gene content of the module is extended using less stringent
criteria. In the following, we discuss the specifics of this two-
step procedure.
Seed discovery step
In the seed discovery step, we detect large modules with
tightly co-expressed genes (pairwise correlation of at least t
e
),
directed by a common regulatory program with a minimum
number of regulators (s
c
) and a minimum number of con-
served motifs (s
m
) in the upstream region of the genes
included in the module. Modules that meet these user-
defined stringent criteria are defined as valid seed modules.
We solely report 'maximal modules', defined as valid seed
modules that become invalid upon extending them with any
gene they do not yet contain.
An exhaustive search for all valid gene sets is not feasible, as
the number of possible sets is exponential in the number of
genes. However, by defining the constraints in such a way that
extensions of an invalid module are never valid (that is, as
hereditary constraints), we can adopt a fast Apriori-like algo-
rithm to solve the problem [10] (see Materials and methods
for details).
To determine the statistical significance of the obtained mod-
ules, we assigned a 'seed module' p value to each seed module
(see Materials and methods). As expected, seeds with a high
number of genes were highly significant. Modules with one
gene were only significant if they contained many regulators.
To test the sensitivity of the seed discovery step with respect
to the parameters, we compared results obtained at different
parameter settings using a normalized Jaccard similarity
score. The overall similarity in gene and regulator content
was examined separately. We varied the correlation threshold
on the expression profiles, the threshold on the ChIP-chip
data t
c
(required to convert the ChIP-chip data to a binary
matrix; see Materials and methods) and the minimum
number of regulators s
c
. Parameter settings that are more
similar generally resulted in more similar gene and regulator
module content. This consistency (monotonicity) eases
parameter tuning. Numerical results of the sensitivity analy-
sis can be found on our supplementary ReMoDiscovery web-
site [11].
Seed extension step
The stringent criteria for the valid modules in the seed discov-
ery step appear sufficient to reliably detect regulators and
motifs, but the reported maximal gene content of such mod-
ules is likely to be underestimated in size. For this reason,
ReMoDiscovery contains a second module extension step, in
which the gene content of statistically significant seed mod-
ules is extended. This extension is performed by computing
the module's mean expression profile, and ranking the
remainder of the genes in the dataset according to their cor-
relation with this seed profile. The genes at the top of the
ranking will most likely belong to the module. However, it is
not clear where to choose the cutoff on the correlation with
the seed profile that is minimally required for additional
genes to belong to the module. Therefore, 'module enrich-
ment' p values are computed according to the enrichment of
all regulators (motifs) in the extended modules as a function
of the correlation cutoff. If motifs and regulators identified in
the seed discovery step appear to be over-represented in the
extended sets, the correlation resulting in the largest enrich-
ment is considered optimal (Figure 1).
Application to biological datasets
We applied the algorithm described above to two well
described yeast datasets: the Spellman dataset (assessing
gene expression during cell cycle) [12] and the Gasch dataset
(assessing gene expression in stress related conditions) [13].
Genome Biology 2006, Volume 7, Issue 5, Article R37 Lemmens et al. R37.3
comment reviews reports refereed researchdeposited research interactions information
Genome Biology 2006, 7:R37
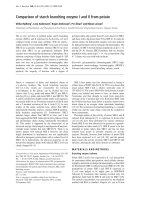
ReMoDiscovery analysis flowFigure 1
ReMoDiscovery analysis flow. ReMoDiscovery consists of a seed discovery step followed by a seed extension step. ChIP-chip data, motif data, and
expression data are used as input for the algorithm. These three datasets can be represented as matrices in which the rows represent the genes. For the
ChIP-chip data (R) the columns represent the regulators, for the motif data (M) they represent the motifs and for the expression data (A) the different
experiments. (a) The seed discovery step identifies sets of genes that are co-expressed, bind the same regulators, and have the same motifs in their
intergenic region. (b) The gene content of the seed modules can be extended during the seed extension step using less stringent criteria. The logarithms
of the module enrichment p values (y-axis) are plotted for all regulators (motifs) as a function of the correlation threshold (x-axis). Each line in the sample
plot shows the module enrichment p values for the enrichment of its corresponding regulator (motif) as a function of the gene expression correlation
threshold used.
0.925
0.654
0.958
0.864
0.756
0.924
0.992
0.999
0.594 0.998
0.456
0.743
0.994
0.996
0.997
0.999
0.993
0.451
0.863
0.995
.
.
.
.
.
.
.
.
.
.
.
.
.
.
.
0.923
0.743
0.906
0.934
0.861
0.654
0.951
0.987
0.991 0.998
0.857
0.943
0.594
0.717
0.654
0.999
0.384
0.967
0.365
0.695
.
.
.
.
.
.
.
.
.
.
.
.
.
.
.
1
0
.
.
.
.
.
.
0
11
0
.
.
.
.
.
.
.
.
.
0
1
.
.
.
0
0
.
.
.
0
0
.
.
.
1
0
.
.
.
0
0
.
.
.
Thresholding
t
c
t
m
R
1
R
2
R
3
R
n
M
1
M
2
M
3
M
m
Gene 1
Gene 2
Gene 3
Gene 4
Gene k
Gene expression data (A)
Motif data (M)ChIP-chip data (R)
(a) Seed discovery
Correlation threshold
0 0.1 0.2 0.3 0.4 0.5 0.6 0.7 0.8 0.9 1
Correlation threshold
(b) Seed extension
0
-20
-40
-60
-80
-100
-120
-140
-160
Log p
0
-5
-10
-15
-20
-25
-30
-35
-40
-45
Regulator enrichment Motif enrichment
0 1 0
1
11
0
01
1
11
1
1
1
1
0
00
1
1111
0 0.1 0.2 0.3 0.4 0.5 0.6 0.7 0.8 0.9 1
Log p
R37.4 Genome Biology 2006, Volume 7, Issue 5, Article R37 Lemmens et al. />Genome Biology 2006, 7:R37
Using the seed discovery step, we detected 20 seed modules
for the Spellman dataset [12] and 104 seed modules for the
Gasch dataset [13]. Detailed results can be found in Addi-
tional data files 1 and 2. Seed modules were all statistically
significant when using a cutoff of 0.05 for the seed module p
value. Significant seed modules that only contained one gene
were omitted. To assess the biological relevance of the seed
discovery step we compared our results with literature knowl-
edge. We consider a seed module as verified if all of its regu-
lators could be linked to the same biological process by the
literature. For the Spellman dataset [12] 15 out of 20, and for
the Gasch dataset [13] 53 out of 104 seed modules were sup-
ported by the literature. The seed modules for the Spellman
dataset [12] are displayed in Figure 2, and those for the Gasch
dataset [13] are presented in Additional data file 3. Part of the
seed modules (18 out of 20 for the Spellman dataset [12]; 63
out of 104 for the Gasch dataset [13]) could be extended by the
second step of the algorithm. The extended modules are
described in detail in Additional data files 4 and 5 and all of
their regulatory programs were found to be supported by the
literature.
In some cases, seed modules could not be extended, that is, no
additional correlated genes appeared to be present in the
dataset under study. This implies either that the true module
size was extremely small (only a few genes belong to the mod-
ule) or that the module's regulatory program, although being
biologically relevant, was not active in the conditions tested in
the expression data. Indeed, the identification of the regula-
tory program in the seed discovery step is to a large extent
determined by the ChIP-chip and motif data. However, motif
data are condition independent. Sharing a motif thus does not
necessarily imply co-expression in the tested microarray con-
ditions. Similarly, because of the discrepancies in experimen-
tal conditions between available ChIP-chip and expression
data, evidence from the ChIP-chip data does not
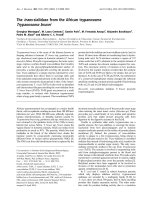
Overview of the seed modules identified in the Spellman dataset [12]Figure 2
Overview of the seed modules identified in the Spellman dataset [12]. For visualization purposes, seed modules with similar function are combined
(indicated in green). A regulator or motif that is part of a regulatory program of an extended module is indicated in the figure by a bold edge from the
regulator or motif to its module.
Nutrient deprivation
Galactose metabolism
Cell cycle
Ribosome biogenesis
RAP1_YPD
RAP1_SM
GAT3_YPD
FHL1_YPD
FHL1_RAPA
YAP5_YPD
FHL1_H2O2HI
FHL1_SM
PDR1_YPD SFP1_SM
SFP1_YPD
DAL81_SM
DAL81_YPD DAL81_RAPA GCN4_RAPA
MBP1_H2O2HI ROX1_H2O2HI
HAP5_SM GLN3_SM
GLN3_RAPA
UME6_H2O2HI
SWI5_YPD
REB1_YPD
STB1_YPD
HIR3_YPD
SMP1_YPD
SWI4_YPD
SWI6_YPD
NDD1_YPD
HIR2_YPD
HIR1_YPD
M_11 (SWI4)
M_67 (SWI4)
MCM1_ALPHA
M_18 (MCM1)
MCM1_YPD
M_12 (MCM1)
MBP1_H2O2LO
M_30 (MBP1)
RCS1_H2O2LO
SOK2_BUT14
TEC1_ALPHA
TBS1_YPD
ASH1_BUT14
STE12_ALPHA
FKH2_YPD
FKH2_H2O2HI
FKH1_YPD
PHO2_SM
PHO2_PI
MBP1_YPD
NRG1_H2O2HI
GAL80_YPD
GAL4_YPD
GAL4_RAFF
GAL4_GAL
M_8 (MBP1)
Genome Biology 2006, Volume 7, Issue 5, Article R37 Lemmens et al. R37.5
comment reviews reports refereed researchdeposited research interactions information
Genome Biology 2006, 7:R37
automatically imply support by all microarray data. As a
result, a module can only be extended with additional genes if
its regulatory program appears to be active in the conditions
underlying the used microarray study. Based on this observa-
tion, we subdivided modules into those involved in general
metabolism found active in both datasets (for example, ribos-
ome synthesis, galactose metabolism) and those related to
processes for which the activity was restricted to either one of
the datasets. To the latter group belong modules involved in
the cell cycle, which were extended in the Spellman dataset
[12], and modules related to nutrient deprivation, stress, res-
piration, amino acid metabolism, filamentous growth and
meiosis extended in the Gasch dataset [13]. A more detailed
description of the modules is given below.
Detailed description of the detected modules
To summarize results, modules were combined if their
respective regulatory programs were involved in the same
biological process.
Modules involved in ribosome biogenesis
Modules involved in ribosome biogenesis are active in both
the Spellman [12] and the Gasch [13] dataset. This could be
expected as ribosome biogenesis is known to be tightly cou-
pled to cell cycle progression as well as to environmental
changes that affect growth rate. Different regulators were
found to be associated with these ribosome related modules,
including Arg80, Dal81, Fhl1, Gat3, Gts1, Mbp1, Mth1, Ndd1,
Pdr1, Pho2/Bas2, Rap1, Rgm1, Rme1, Sfp1, Smp1, Swi4, and
Yap5. Of these, Fhl1 and Rap1 were found in most modules.
Consistently, both factors have been reported as main tran-
scriptional regulators of ribosomal gene expression [14,15].
Also, Sfp1 and Rgm1 have been implicated in ribosome bio-
genesis and most recent data indicate that the former could
act as a receiver of nutritional and stress derived signals
[14,16,17].
To our knowledge, no data are available that may confirm a
direct involvement of the other transcription factors in ribos-
omal gene expression. Nevertheless, the processes in which
these factors are known to be involved can be linked to ribos-
ome biogenesis. For instance, Arg80, Dal81 and Pho2/Bas2
all function in the sensing and metabolic control of essential
nutrients such as amino acids and phosphate, and it is well
established that ribosomal protein gene expression is directly
related to availability of essential nutrients [14,18-21].
Another example is the transcriptional regulator Gat3, an
uncharacterized member of the GATA family of transcription
factors that controls the expression of nitrogen catabolic
genes. The GATA factors are regulated by the Tor pathway, a
pathway that also regulates the expression of genes involved
in ribosome biogenesis [19].
Modules involved in galactose metabolism
Both the Spellman [12] and the Gasch [13] dataset revealed
active modules controlling so-called GAL genes (for example,
GAL3, GAL1, GAL7, GAL10), which encode proteins involved
in galactose metabolism. These modules comprise the tran-
scriptional regulators Gal4 and Gal80, which are key regula-
tors of the galactose metabolism [22-24] and the
transcriptional repressor Nrg1, which is known to mediate
glucose repression of the GAL genes [25].
Some transcriptional regulators that were retained only from
the Gasch [13] dataset point towards interactions between
this module for galactose metabolism and modules for other
processes, such as cell cycle control via Mbp1 (see also cell
cycle module) [26] and amino acid metabolism via Met32
(see also amino acid module) [27]. In addition, the module for
galactose metabolism contains the regulators Oaf1, Pip2 and
Ume6, which are involved in the induction of peroxisomal
genes participating in β-oxidation [28], potentially linking
galactose metabolism to this process.
Cell cycle
Nine modules involved in cell cycle control were found to be
active in the Spellman dataset [12]. The transcriptional regu-
lators connected to these cell cycle related modules include
components such as Swi4, Swi6, Mbp1 and Stb1, constituting
the transcriptional complexes SBF and MBF, which operate
during progression from G1 to S phase [29,30], as well as
components involved in G2/M-specific transcription, such as
Fkh1, Fkh2 and Ndd1 [31-33]. Further support for our analy-
sis comes from the observation that other factors with a role
in cell cycle regulation were also retrieved. These include the
transcriptional repressor Xbp1, the corepressors Hir1, Hir2
and Hir3, and the transcription factors Pho2, Reb1 and Rcs1.
Xbp1 is a repressor sharing homology with Swi4 and Mbp1
[34]. Pho2 is involved with the early G1 transcription factor
Swi5 in the control of the HO gene [35]. Hir1, Hir2 and Hir3
are involved in cell cycle regulated transcription of histone
genes [36,37]. The transcription factor Reb1 is known to bind
with high affinity to a sequence upstream of CLB2 [38], a gene
whose regulation is important for completion of the normal
vegetative cell cycle. The regulator Rcs1 is involved in timing
the budding event of the cell cycle [39]. Additional factors
identified are Ash1, Sok2, Ste12 and Tec1. Their presence in
our modules might link cell cycle to processes discussed
below, like mating type switching [40] and the filamentous
growth pathway (see also filamentous growth module) [41-
43].
Nutrient deprivation
Six modules with transcriptional regulators that mediate con-
trol of target genes under nutrient deprived conditions were
active in the Gasch dataset [13]. The regulators include Gat1,
Dal81, Dal82, and Gln3, which are all involved in nitrogen
catabolite repression [21,44,45], Gcn4, which is the main reg-
ulator in general amino acid control [46-48], Rtg3, which is a
transcription factor involved in regulation of genes required
for de novo biosynthesis of glutamine and glutamate [49],
Fhl1, the forkhead factor that regulates ribosome biosynthesis
R37.6 Genome Biology 2006, Volume 7, Issue 5, Article R37 Lemmens et al. />Genome Biology 2006, 7:R37
in response to nutrient availability [15], and Hap2, a tran-
scription factor of the tricarboxylic acid cycle [50]. The ChIP-
chip data obtained after treatment with rapamycin were espe-
cially informative for identifying the different modules com-
prising this nutrient deprivation module. Rapamycin is
known to inhibit Tor (target of rapamycin) protein kinases,
which function in a nutrient-sensing signal transduction
pathway. Consistently, the processes and regulators for this
module all show connections to the Tor-mediated nutrient-
sensing signal transduction pathway [49-52].
Stress related conditions
Twenty modules directing general and specific stress
responses were identified and extended in the Gasch dataset
[12]. These modules contain several transcriptional regula-
tors and subsets of them are known to help fine-tune stress
responses to particular conditions. The regulators Msn2 and
Msn4 present in our modules are known key regulators of
stress-responsive gene expression in yeast [53-55]. Several
regulators identified by our analysis can be related to trigger-
ing responses upon oxidative stress, such as Skn7, Yap1,
Hap5, Rox1, Hsf1, Nrg1, Pho2/Bas2 and Yap4/Cin5 [56-60].
A connection with oxidative stress may also exist for Sut1, a
factor that, according to the literature, relieves hypoxic genes
from repression by the Cyc8-Tup1 [61] co-repressor complex,
which is recruited to many promoters via regulatory proteins
such as Rox1 [62]. With regard to oxidative stress, links with
other stress responses could also be derived. Indeed, Cup9
mediates copper resistance [63] while Yap6 confers resist-
ance to cisplatin [64].
Some regulators present in the stress related module have
been reported to be operative in aspects indirectly related to
stress response, for instance, Ngr1, Rim101, Sok2 and Ume6
are linked by their roles in meiosis and sporulation (see also
module for filamentation and meiosis) [65-68] and Xbp1 is a
stress-induced transcriptional repressor of the cell cycle (see
also cell cycle module) [69].
Respiration
The Gasch dataset [13] enabled the identification of an
extendable module dedicated to respiration that includes the
heme-responsive factor Hap1 and the subunits Hap2, Hap4,
Hap5 of the heme-activated CCAAT-binding complex [70,71].
Two motifs, motif 7 (Esr2: GRRAAAWTTTTCACT) and 70
(CGCGnnnnnGGGS), of which the latter is defined as a 'new'
motif by Kellis et al. [72], could be associated with this
module.
Amino acid metabolism
The modules for amino acid metabolism were recovered upon
analysis of the Gasch dataset [13]. Support for the validity of
this module came from the presence of Dal81, a positive reg-
ulator of multiple nitrogen catabolite repression genes
[21,44,45] and from the presence of Gcn4, the main regulator
in the general amino acid control [46-48]. Also present was
Leu3, a transcriptional regulator of genes involved in nitro-
gen assimilation and in biosynthetic pathways of branched-
chain amino acids [73,74]. The regulators Cbf1, Met4 and Met
32 of our module have previously been shown to be required
for the coordinated expression of the structural genes from
the sulfur amino acid biosynthesis pathway [75,76].
Additional regulators present in this module may provide
links to other regulatory programs. The presence of Rox1 and
Skn7 can couple this network to the program for oxidative
stress response (see also stress related module) [56,57], while
Sfp1, Rap1, and Gcr2, a coactivator of Rap1 [77], reflect links
with ribosome biosynthesis (see also module for ribosome
biogenesis) [14,21,78].
Modules involved in filamentous growth
Five modules related to filamentous growth could be
retrieved from the Gasch dataset [13]. The filamentous
growth pathway induces a morphogenetic switch under
adverse growth, such as nutrient deprivation. This switch
induces the formation of pseudohyphae, which are believed to
facilitate foraging for scarce nutrients [41-43]. Consistent
with the literature, these modules included the regulators
Ste12 and its interacting partners Dig1 and Tec1, as well as
Sok2 and its downstream regulators Ash1 and Phd1 [41-43].
The regulator Nrg1, also present in our module, is known to
function as a negative regulator of filamentous growth and as
a repressor of FLO11, which encodes a cell surface glycopro-
tein required for filamentous growth [79] (see also galactose
metabolism module).
Filamentous growth is known to be intimately linked to
growth and cell cycle control. As such, it is not surprising that
our analysis also retrieved for this module factors involved in
cell cycle control, such as components of SBF and MBF, that
is, Swi4 and Mbp1 [29,30] or Fkh2 [80] (see also cell cycle
module). This close link to growth also explains the presence
in our modules of Fhl1 [14,15], Hap1 [70,71] and Sut1 [61] as
they all have important functions in determining the growth
potential of yeast cells. Our analysis additionally retrieved
Sko1, an important regulator allowing cells to cope with
osmotic stress. Osmotic stress can, under some conditions,
induce filamentous growth and as such the presence of Sko1
in our modules makes sense [81,82].
Modules involved in meiosis
Finally, we identified one extendable module in the Gasch
dataset [13] that is regulated by Ume6 and Rap1. We refer to
this module as being important for meiosis because the liter-
ature confirmed that Ume6 has a key regulator function in
this process [83,84] while Rap1 is believed to control Ume1, a
regulator that is required for the repression of early meiotic
genes [84].
Genome Biology 2006, Volume 7, Issue 5, Article R37 Lemmens et al. R37.7
comment reviews reports refereed researchdeposited research interactions information
Genome Biology 2006, 7:R37
Comparison with other module inference tools
To assess the differences between ReMoDiscovery and previ-
ously described algorithms for module detection, we applied
some of the well known module detection tools to which we
had access to a workable implementation (that is, SAMBA [3]
and GRAM [9]) along with ReMoDiscovery on the combined
Spellman (microarray) [12] and Harbison (ChIP-chip) [6]
dataset.
We analyzed running times on these datasets at distinct
parameter settings for each of the tested algorithms on an
Intel Pentium 2 GHz laptop with 512 Mb RAM. Independent
of the setting for the 'overlap prior factor', the SAMBA algo-
rithm [3] was rather quick, with running times around three
minutes. For parameter settings close to its defaults, ReMo-
Discovery performed slightly better. Running times were on
the order of one minute. In general, the speed of the Apriori
algorithm is roughly proportional to the number of modules
that satisfy the constraints. In contrast, running times of the
GRAM algorithm [9] were prohibitive if the data contained
genes with more than ten significant ChIP-chip interactions
due to the exponential increase in the number of candidate
core modules (see [9] for details). After filtering out those
genes, running times decreased to about 20 minutes at the
default parameter setting.
To compare the gene and regulator content between modules
obtained by GRAM [9], SAMBA [3] and ReMoDiscovery, we
used an unsupervised scoring scheme that considers gene
content and regulator content separately (that is, the
normalized Jaccard similarity score as defined in Materials
and methods). Since parameter settings influence the module
composition, we calculated normalized Jaccard similarity
scores on the results for a number of parameter settings (see
Materials and methods).
For all settings, we observed that both the overlap in gene and
regulator content between the GRAM [9] modules and the
seed modules of ReMoDiscovery was highly significant (nor-
malized Jaccard similarity scores around 15 and 25 standard
deviations, respectively). Since GRAM [9] generally returns
modules with less regulator content, the similarity in regula-
tory programs was best for the most stringent ReMoDiscov-
ery ChIP-chip threshold (Figure 3). Accordingly, gene content
was most similar if the ReMoDiscovery correlation threshold
was lowered. From these results, we conclude that the ReMo-
Discovery seed modules and the GRAM [9] modules repre-
sent similar patterns in the data, the former focusing on
modules with fewer genes and more regulators, the latter on
modules with more genes and less regulators. The regulatory
programs discovered by SAMBA [3], using the discretization
method suggested by the authors, did not significantly resem-
ble those of ReMoDiscovery or GRAM [9]. The gene content
on the other hand did show some overlap (Figure 3).
We performed a similar analysis, this time with the extended
seed modules of ReMoDiscovery. Extending the seeds gener-
ally results in a smaller number of statistically overrepre-
sented regulators in the modules (Table 1), but an increase in
gene content. Accordingly, the scores for overlap in gene con-
tent with GRAM [9] and SAMBA [3] improved. The normal-
ized Jaccard similarity score increased from 15 standard
deviations to about 100 standard deviations for GRAM [9]
and from 6 to about 21 standard deviations for SAMBA [3]
(data not shown). At the same time, the regulator overlap
with GRAM [9] increased to about 50 standard deviations. In
other words, increasing the number of genes in a module
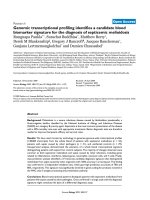
Representative examples from the module content similarity analysisFigure 3
Representative examples from the module content similarity analysis. The significance of the similarity in module content between ReMoDiscovery seed
modules and GRAM [9] and SAMBA [3] output is shown at different parameter settings. The color bar on the right indicates the normalized Jaccard
similarity score, that is, the number of standard deviations from the mean of the distribution of Jaccard similarity scores on randomized module
partitioning. (a) Regulator content similarity between ReMoDiscovery and GRAM, with varying GRAM module p value cutoff and ReMoDiscovery Chip-
chip threshold. (b) Gene content similarity between ReMoDiscovery and GRAM, with varying GRAM core profile p value cutoff and ReMoDiscovery
correlation threshold. (c) Gene content similarity between ReMoDiscovery and SAMBA, with varying SAMBA overlap prior factor and ReMoDiscovery
correlation threshold.
ReMoDiscovery versus GRAM (regulators) ReMoDiscovery versus GRAM (genes) ReMoDiscovery versus SAMBA (genes)
16
15
14
13
12
11
10
9
7
6
5
4
3
2
35
30
25
20
15
0.98 0.985 0.99 0.995 0.65 0.7 0.75 0.8 0.85 0.9 0.7 0.75 0.8 0.85 0.9
ReMoDiscovery ChIP-chip threshold ReMoDiscovery correlation threshold ReMoDiscovery correlation threshold
GRAM mo du le
p-value cutoff
0.05
0.045
0.04
0.035
0.03
0.025
0.02
0.015
0.01
0.005
GRAM co re pr ofil e
p -value cu to ff
-3
-4
-5
-6
-7
-8
-9
-10
-11
-12
(a) (b) (c)
0.65
SAMBA overl ap pr io r f ac to r
0.9
0.8
0.7
0.6
0.5
0.4
0.3
0.2
0.1
R37.8 Genome Biology 2006, Volume 7, Issue 5, Article R37 Lemmens et al. />Genome Biology 2006, 7:R37
(higher gene content) corresponded to decreasing the
number of regulators (lower regulator content), making the
results even more similar to those of GRAM [9].
All tools discussed in this study serve two purposes: they
simultaneously identify clusters of co-expressed genes and
the corresponding regulatory programs. To evaluate the first
aspect, we calculated the average functional overrepresenta-
tion of the modules detected by each of the tools on our
benchmark dataset (Table 1). We used default parameter set-
tings for GRAM [9], SAMBA [3] and ReMoDiscovery. From
these results it appears that, for all tools, regulatory modules
are well enriched for known functional classes. For ReMoDis-
covery, the enrichment score improved significantly upon
extension of the seeds.
To test the sensitivity of these tools in retrieving regulators
known to be involved in the cell cycle, we compiled a list of
known regulators (see Materials and methods) and tested
how many of these occurred in the regulatory programs of any
of the cell cycle related modules (Table 2). We also displayed
the ratios of the number of known cell cycle regulators over
the total number of regulators detected in a module's pro-
gram, averaged over all modules. These results show that
both ReMoDiscovery and GRAM [9] had a considerably
higher sensitivity than SAMBA [3] in retrieving cell cycle
related regulators.
Conclusions about specificity should be treated with care
because, in the absence of a golden standard (that is, a com-
pletely characterized network of interactions), the number of
false positive predictions can never be quantified. Although
the regulatory programs of GRAM [9] and ReMoDiscovery
seem to be more enriched in cell cycle related regulators
(larger ratio of known cell cycle related regulators over the
total number of regulators than SAMBA [3]), it is not possible
to distinguish between true and false positives without fur-
ther experimental validation.
Discussion
In this study, we present a two-step methodology to unravel
active modules based on the concurrent analysis of three
independently acquired data sources. The seed discovery step
predicts putative seed modules (consisting of genes,
regulators and corresponding motifs). The seed extension
Table 1
Summary of the results of the GRAM, SAMBA and ReMoDiscovery module discovery methods
Method No. Genes Regulatory program
Mean Min Max Mean functional
enrichment
Mean Min Max
ReMoDiscovery (seed modules) 20 2.05 2 3 0.05 6.15 3 12
ReMoDiscovery (extended modules) 18 67.72 6 200 2.00E-03 3.50 2 6
GRAM 274 6.80 5 33 0,02 2.35 1 8
SAMBA 205 57.53 5 265 1.10E-02 4.16 0 31
The number of modules (No.) and the mean (Mean), minimum (Min) and maximum (Max) number of genes and regulators in the identified modules
are displayed, as well as the average functional enrichment of the modules (Mean functional enrichment).
Table 2
Summary of the significantly cell cycle enriched modules, identified by the GRAM, SAMBA and ReMoDiscovery module discovery
methods
Method No. Genes Regulatory program
Mean Min Max Mean Min Max No. cell
cycle R/all R
No. non cell
cycle R/all R
No. cell
cycle R
ReMoDiscovery
(seed modules)
2 2 224350.80 0.20 6
ReMoDiscovery
(extended modules)
8 97.38 12 200 3.50 2 6 0.92 0.08 10
GRAM 33 6;47 5 11 2.66 1 6 0.74 0.26 17
SAMBA 14 58,;29 17 155 2.57 0 12 0.29 0.71 5
The number of cell cycle modules (No.) and the mean (Mean), minimum (Min) and maximum (Max) number of genes and regulators in these modules
are displayed. Additionally, the ratio of the number of cell cycle regulators over the total number of regulators in a module, averaged over all cell
cycle modules (No. cell cycle R/all R) is shown, as well as the ratio of the number of non-cell cycle regulators over the total number of regulators in
a module, averaged over all cell cycle modules (No. non-cell cycle R/all R). The last column contains the number of regulators from the compiled list
of 19 known cell cycle regulators (see Materials and methods) that were present in the regulatory program of at least one of the cell cycle modules
(No. cell cycle R).
Genome Biology 2006, Volume 7, Issue 5, Article R37 Lemmens et al. R37.9
comment reviews reports refereed researchdeposited research interactions information
Genome Biology 2006, 7:R37
step optimizes the gene content of the modules and indicates
whether the seed modules' regulatory program is active in the
microarray data.
The data integration problem is tackled in a very direct way:
using the Apriori algorithm, no iteration over the different
data sources is required. As regards the algorithmic
properties, a comparison of ReMoDiscovery with other mod-
ule detection tools revealed that speed is one of the major
advantages of the Apriori strategy. ReMoDiscovery's running
times and memory requirements are drastically smaller than
those of certain other module detection algorithms such as
the GRAM [9] algorithm. This is important as most module
discovery algorithms require repeated testing to find the opti-
mal parameter settings. Together with the straightforward
biological interpretation of the parameters, its speed turns
ReMoDiscovery into a user-friendly, readily tunable tool.
The biological relevance of our method was assessed by
applying it on the extensively studied Spellman [12] and
Gasch [13] datasets. Comparison of our results with the liter-
ature showed that experimental evidence existed for many of
our statistically significant seed modules. For modules for
which no direct evidence existed so far, a plausible explana-
tion for their composition could very often be inferred from
the literature and potential new links between the detected
pathways and modules could be derived. A seed module that
can be extended with more genes in the seed extension step
gives a clue to the regulatory program being active in the pre-
vailing conditions of the tested microarray experiment. Based
on this observation, a distinction could be made between
modules involved in general metabolism that were active in
both datasets (for instance, ribosome synthesis, galactose
metabolism) and the more specialized modules (for instance,
cell cycle, nutrient deprived conditions, stress related condi-
tions, amino acid metabolism, respiration, filamentous
growth or meiosis) for which the activity was restricted to
either one of the datasets.
In contrast to previous approaches in which motif informa-
tion results from downstream analysis of the inferred mod-
ules, our method used this information as an independent
input source. To avoid circular reasoning, we ensured that
motif information was derived from sequence information
only and did not rely on any other experimental data source
(for instance, as available in the motif compendium of Kellis
et al. [72]). Therefore, the compendium of motifs we used as
an input dataset is far from complete. This explains why we
detected less motifs for each module compared to, for
instance, Kato et al. [7] or Harbison et al. [6].
To assess to what extent ReMoDiscovery discovers modules
similar to those detected by other module identification tools,
we compared it with previously described tools on the same
benchmark set. Compared to GRAM [9], we found a signifi-
cant overlap in both gene and regulator content of the
detected modules over a sweep of different parameters. The
similarity between both algorithms was larger when compar-
ing the results of GRAM [9] with those of the extended seed
modules than with the original seed modules. This difference
reflects the trade-off between the number of regulators and
the number of genes in biological modules: modules compris-
ing a regulatory program with many regulators (such as our
seed modules) can be expected to contain few genes with a
potentially highly related function. In a module, the number
of genes will usually increase with a decreasing number of
regulators. Obviously, there will be more genes that only
share part of their regulatory program, that is, the part that is
active under the tested set of conditions. While our seed mod-
ules give a view on the complete regulatory program, our
extended modules highlight the program active in the micro-
array dataset. They contain more genes and are more similar
to the GRAM [9] output. Hence, with ReMoDiscovery we
offer an algorithm that can be used to focus on very specific
regulatory programs (seed modules) as well as on less specific
modules with more genes (extended seed modules). The most
appropriate choice depends on the specific research question
under study, so usually there is no single best solution for the
outcome of a module detection algorithm.
In our hands, the regulatory programs found with the SAMBA
algorithm [3] did not significantly resemble those of ReMo-
Discovery or GRAM [9]. The possibility might exist that
SAMBA [3] focuses on other aspects of the data and, there-
fore, detects fundamentally different modules. However,
based on our analysis we believe that the regulatory programs
recovered by SAMBA [3] are unlikely to be biologically mean-
ingful as the sensitivity in detecting cell cycle related regula-
tors was low. Most likely the available download of the
SAMBA-Expander application [3] is not yet fully adjusted to
the use of heterogeneous data sources.
Conclusion
We developed an intuitive algorithm for the automatic infer-
ence of transcriptional modules. It is fast, readily tunable and
flexible, in the sense that it can easily be extended to include
other information sources, as long as the constraints on the
gene sets are hereditary. Our method does not require large
microarray compendia but allows for an easy first screen of
transcriptional modules being active or present in one's own
'small' microarray dataset, using publicly available ChIP-chip
and motif data. In principle, our method is generic and appli-
cable for all organisms for which the three data sources are
available. However, its sensitivity will be largely determined
by the completeness of ChIP-chip and motif data, which are
expected to improve over time.
R37.10 Genome Biology 2006, Volume 7, Issue 5, Article R37 Lemmens et al. />Genome Biology 2006, 7:R37
Materials and methods
Microarray data
The Spellman [12] and Gasch [12] datasets were used as
microarray benchmark sets. The Spellman dataset [12] con-
tains 77 experiments describing the dynamic changes of yeast
genes during the cell cycle. The Gasch dataset [13] consists of
177 experiments, examining gene expression behavior during
various stress conditions. Expression profiles were normal-
ized (subtracting the mean of each profile and dividing by the
standard deviation across the time points) and stored in a
gene expression data matrix, denoted by A, with a row for
each gene expression profile and a column for each condition.
Location data
Genome-wide location data performed by Harbison et al. [6]
were downloaded from their website [85]. These contain
information regarding the binding of 204 regulators
(although Harbison et al. [6] only describe 203 regulators) to
their respective target genes in rich medium (the 106 regula-
tors initially profiled by Lee et al. [86] and 98 new regula-
tors). Besides rich medium, 84 regulators were profiled in at
least one environmental condition other than rich medium.
For ReMoDiscovery, the ChIP-chip data matrix (denoted by
R) consists of one minus the 'ChIP-chip p values' for each
gene, obtained from the combined ratios of immuno-precipi-
tated and control DNA using an error model (see Harbison et
al. [6]). Both GRAM [9] and SAMBA [3] use ChIP-chip p val-
ues and require some additional preprocessing. As the
authors of GRAM [9] suggested, genes that bind more than 10
regulators (ChIP-chip p value < 0.001) were omitted. For
SAMBA [3], we transformed all ChIP-chip data to a log10
scale, nullified all values above 0.02 and used a parametric
discretization setting in the Expander software tool according
to the authors' advice.
Motif data
The motif data used in this study were obtained from a com-
parative genome analysis between distinct yeast species (phy-
logenetic shadowing) performed by Kellis et al. [72]. These
motifs, available online as regular expressions, were trans-
formed into their corresponding weight matrices (see online
information for more details [11]). Out of the 71 putative
motifs described by Kellis et al. [72], the 53 most informative
ones were retained. The weight matrices corresponding to
these motifs was subsequently used to screen all intergenic
sequences of yeast using MotifLocator [87]. The higher the
score of a motif hit in a gene, the more likely it will be a true
instance. Results of the screening can thus be summarized in
a matrix M that contains for each gene-motif combination a
score that indicates how likely it is the gene contains an
instance of the respective motif.
Algorithm for seed discovery
The algorithmic details of our method are based on the obser-
vation that the particular choice of the constraints guarantees
that, given an invalid module, none of its extensions can ever
become valid. For this reason, we call the constraint set
'hereditary'. Such a hereditary constraint set has first been
deployed in the so-called Apriori algorithm, which is
described in a seminal paper by Agrawal and Imielensky [10].
In ReMoDiscovery, the constraints are the minimum number
of regulators (or regulator support constraint s
c
), the mini-
mum number of motifs (or motif support constraint s
m
), and
a minimal pairwise correlation between genes in a module t
e
.
We apply these constraints to find regulatory modules that
contain as many genes as possible. Since the regulator bind-
ing and motif data consist of non-binary score values, the sup-
port values are estimated by using thresholded regulator and
motif scores, equal to 1 if the score is larger than a threshold
t
c
or t
m
, respectively, and 0 otherwise. After thresholding, the
regulator and motif data are binary, and are represented in
the matrices R and M (Figure 1). Note also that the current
implementation uses correlation as a measure for co-expres-
sion. If required, however, other similarity measures could be
used in the Apriori framework.
Using the hereditary constraints results in a significant
speed-up with respect to a naïve exploration of the space of
possible modules, because we do not need to explicitly check
large gene sets for validity. Each subset of genes of a valid
module necessarily represents a valid module. This fact can
be exploited to reduce the number of times the constraints
need to be evaluated. Indeed, only gene sets for which all sub-
sets have been found to be valid modules need to be checked,
and they can be discarded a priori if one of their subsets turns
out to be invalid, even before checking the constraints. In
summary, a high level description of the algorithm is: first,
choose parameter values s
c
, s
m
, t
e
, t
m
and t
c
; second, threshold
the regulator and motif data using thresholds t
m
and t
c
, yield-
ing the binary tables R and M; third, find all maximal mod-
ules for which the support constraints specified by s
c
and s
m
are satisfied, and for which the correlation between the gene
expression profiles of any pair of genes in the module exceeds
the required threshold t
e
; and fourth, report maximal mod-
ules along with the motifs and regulators that support them.
To assess statistical significance, we assigned a seed module p
value to each module obtained at a specific parameter setting.
To this end, we randomly permuted the gene labels for each
dataset (ChIP-chip, motif data, gene expression) separately.
This randomization procedure was repeated 100 times. The
results of ReMoDiscovery seed discovery on these random
datasets were used to construct an empirical joint distribu-
tion on the number of regulators and genes from which we
calculated a seed module p value for each of the seeds found
in the real data sets.
Module extension: calculate enrichment of motifs and
regulators
To determine the module enrichment p value for the enrich-
ment of a particular motif (regulator) in an extended module
Genome Biology 2006, Volume 7, Issue 5, Article R37 Lemmens et al. R37.11
comment reviews reports refereed researchdeposited research interactions information
Genome Biology 2006, 7:R37
with n genes, we first calculated the mean score of that motif
in the module by averaging out the entries in the original
motif (regulator) data matrix in the column corresponding to
the motif (regulator) and the rows corresponding to genes in
the module. We then compared this mean score to the distri-
bution of scores obtained on a random selection of n genes,
for the same motif (regulator). Note that the mean score of a
module by random gene selection is approximately Gaus-
sianly distributed (central limit theorem), with mean equal to
the mean over all genes, and variance equal to the overall
variance divided by the size of the module. This Gaussian
approximation of the H
0
-hypothesis is used to calculate a
module enrichment p value for a particular motif or regulator.
Application of ReMoDiscovery to the yeast data
The total data matrix used consisted of 6,144 genes (that is,
the intersection of the number of rows of the motif, ChIP-chip
and microarray matrices). When applying our algorithm to
the yeast dataset, we used the default parameters, that is, the
motif threshold t
m
equaled 0.9, the ChIP-chip threshold t
c
was
0.99, and the correlation threshold t
e
was 0.75. The minimal
number of motifs s
m
was set to 1 such that we find seed mod-
ules that have at least 1 motif in their regulatory program. We
varied the minimal number of regulators s
c
over the values 3,
4, 6, 8 and 10 for the Spellman [12] dataset and over 4, 6, 8
and 10 for the Gasch [13] dataset. Resulting seed modules
with a seed module p value > 0.05 were evaluated during the
second seed extension step.
Comparison with other methods
We downloaded the java implementation of the SAMBA [3]
software package from [88]. The Matlab code of the GRAM
algorithm [9] was obtained from the authors upon request.
We used ReMoDiscovery with a ChIP-chip threshold (one
minus the ChIP-chip p value) equal to 0.99, a correlation
threshold of 0.75 and a minimum of one motif and four regu-
lators, respectively. When comparing regulator content from
ReMoDiscovery to SAMBA [3] and GRAM [9], we looked at
the ReMoDiscovery seed modules for a minimum number of
regulators equal to 3, 4, 6, 8 and 10. We also examined the
influence of a variation in ChIP-chip threshold, in the range
[0.98 to 0.999] (values below 0.98 were not tested as the
quality of the biological outcome started to decrease). The
SAMBA [3] 'overlap prior factor' was varied between 0 and 1,
in steps of 0.05. The latter parameter describes the extent of
overlap that is permitted between different modules in the
same solution. For the GRAM algorithm [9], we varied all
user defined parameters in a wide range: the base 10 loga-
rithm of the 'core profile p value cutoff' between minus 12 and
minus 3, the 'num in core cutoff' between 5 and 97 and 'mod-
ule p value cutoff' between 0.001 and 0.05. When comparing
gene content from ReMoDiscovery to SAMBA [3] and GRAM
[9], we considered ReMoDiscovery output for varying corre-
lation threshold, in the range (0.65 to 0.9).
Module comparison was based on the normalized Jaccard
similarity score [89]. For a specific parameter setting, we ver-
ify for each pair of genes (regulators) whether these two genes
(regulators) occur together in at least one module. Doing so
for all gene (regulator) pairs and for both methods, one can
define the number of true positives TP as the number of gene
pairs occurring together at least once in both methods. Anal-
ogously, the number of false positives FP, true negatives TN
and false negatives FN can be defined. As in [89], we used the
Jaccard similarity score TP/(TP + FP + FN) to score the over-
lap between two module compositions. In addition, randomi-
zations were used to determine the significance of a specific
score. This leads to the notion of normalized similarity scores,
expressed as the number of standard deviations from the
mean of the distribution of Jaccard similarity scores for ran-
domized module compositions. For a more detailed descrip-
tion of our module comparison approach, we refer to our
supplementary website [11].
Evaluating the statistical significance for functional
category enrichment of modules
The hypergeometric distribution was used to determine
which functional categories were statistically overrepre-
sented in the extended modules. For each module we com-
puted the fraction of genes associated with each functional
category in the MIPS database [90] and used the hypergeo-
metric distribution to calculate a corresponding 'functional
enrichment p value'. Modules with a functional enrichment p
value below 0.05 (no compensation for multiple testing) were
considered significantly enriched.
List of cell cycle regulators
We compiled a list containing every regulator that was
present in the regulatory program of at least one cell cycle
enriched module identified by ReMoDiscovery, GRAM [9] or
SAMBA [3]. The regulators in this list that are involved in cell
cycle according to the Saccharomyces Genome Database [91]
were considered 'cell cycle regulators': ACE2_YPD,
FKH1_YPD, FKH2_H2O2Hi, FKH2_H2O2Lo, FKH2_YPD,
MBF1_YPD, MBP1_H2O2Hi, MBP1_H2O2Lo, MBP1_YPD,
MCM1_Alpha, MCM1_YPD, NDD1_YPD, RFX1_YPD,
RPN4_YPD, STB1_YPD, SWI4_YPD, SWI5_YPD
SWI6_YPD, YOX1_YPD (nomenclature adopted from
Harbison et al. [6]). We used this list of 19 regulators to cal-
culate the method's sensitivities.
Other software
Networks were drawn using Cytoscape [92].
Additional data files
The following additional data are available with the online
version of the paper. Additional data file 1 and Additional
data file 2 contain the seed modules for the Spellman [12] and
Gasch [13] datasets, respectively. Additional data file 3 gives
a graphical overview of the seed modules identified in the
R37.12 Genome Biology 2006, Volume 7, Issue 5, Article R37 Lemmens et al. />Genome Biology 2006, 7:R37
Gasch [13] dataset. Additional data file 4 and Additional data
file 5 consist of the extended modules identified in the Spell-
man [12] and Gasch [13] datasets, respectively. Additional
data file 6 includes the stand-alone version of ReMoDiscovery
and a corresponding ReMoDiscovery help file.
Additional File 1The seed modules for the Spellman [12] datasetThe seed modules for the Spellman [12] datasetClick here for fileAdditional File 2The seed modules for the Gasch [13] datasetThe seed modules for the Gasch [13] datasetClick here for fileAdditional File 3Graphical overview of the seed modules identified in the Gasch [13] datasetGraphical overview of the seed modules identified in the Gasch [13] datasetClick here for fileAdditional File 4The extended modules identified in the Spellman [12] datasetThe extended modules identified in the Spellman [12] datasetClick here for fileAdditional File 5The extended modules identified in the Gasch [13] datasetThe extended modules identified in the Gasch [13] datasetClick here for fileAdditional File 6Stand-alone version of ReMoDiscovery and a corresponding ReMoDiscovery help fileStand-alone version of ReMoDiscovery and a corresponding ReMoDiscovery help fileClick here for file
Acknowledgements
T.D. is research assistant of the Fund for Scientific Research - Flanders
(FWO-Vlaanderen). This work is partially supported by: IWT projects,
GBOU-SQUAD-20160; Research Council KULeuven, GOA Mefisto-666,
GOA-Ambiorics, IDO genetic networks, CoE EF/05/007 SymBioSys; FWO
projects, G.0413.03, and G.0241.04; IUAP V-22 (2002-2006). We would
like to thank Dr Gerber and Dr Tanay for their useful advice regarding
GRAM and SAMBA.
References
1. Greenbaum D, Luscombe NM, Jansen R, Qian J, Gerstein M: Inter-
relating different types of genomic data, from proteome to
secretome: 'oming in on function. Genome Res 2001,
11:1463-1468.
2. Cavalieri D, De Filippo C: Bioinformatic methods for integrat-
ing whole-genome expression results into cellular networks.
Drug Discov Today 2005, 10:727-734.
3. Tanay A, Sharan R, Kupiec M, Shamir R: Revealing modularity and
organization in the yeast molecular network by integrated
analysis of highly heterogeneous genomewide data. Proc Natl
Acad Sci USA 2004, 101:2981-2986.
4. Segal E, Shapira M, Regev A, Pe'er D, Botstein D, Koller D, Friedman
N: Module networks: identifying regulatory modules and
their condition-specific regulators from gene expression
data. Nat Genet 2003, 34:166-176.
5. Van den Bulcke T, Lemmens K, Van de Peer Y, Marchal K: Inferring
transcriptional networks by mining 'omics' data. Current
Bioinformatics in press.
6. Harbison CT, Gordon DB, Lee TI, Rinaldi NJ, Macisaac KD, Danford
TW, Hannett NM, Tagne JB, Reynolds DB, Yoo J, et al.: Transcrip-
tional regulatory code of a eukaryotic genome. Nature 2004,
431:99-104.
7. Kato M, Hata N, Banerjee N, Futcher B, Zhang MQ: Identifying
combinatorial regulation of transcription factors and binding
motifs. Genome Biol 2004, 5:R56.
8. Xu X, Wang L, Ding D: Learning module networks from
genome-wide location and expression data. FEBS Lett 2004,
578:297-304.
9. Bar-Joseph Z, Gerber GK, Lee TI, Rinaldi NJ, Yoo JY, Robert F, Gor-
don DB, Fraenkel E, Jaakkola TS, Young RA, et al.: Computational
discovery of gene modules and regulatory networks. Nat
Biotechnol 2003, 21:1337-1342.
10. Agrawal R, Imielenski T: Mining association rules between sets
of items in large databases. In Proceedings of the 1993 ACM SIG-
MOD International Conference on Management of Data: May 26-28 1993
Edited by: Buneman P, Jajodia S. Washington, DC. New York: ACM
Press:207-216.
11. Supplementary website ReMoDiscovery [http://
homes.esat.kuleuven.be/~kmarchal/
Supplementary_Information_Lemmens_2006/Index.html]
12. Spellman PT, Sherlock G, Zhang MQ, Iyer VR, Anders K, Eisen MB,
Brown PO, Botstein D, Futcher B: Comprehensive identification
of cell cycle-regulated genes of the yeast Saccharomyces cer-
evisiae by microarray hybridization. Mol Biol Cell 1998,
9:3273-3297.
13. Gasch AP, Spellman PT, Kao CM, Carmel-Harel O, Eisen MB, Storz
G, Botstein D, Brown PO: Genomic expression programs in the
response of yeast cells to environmental changes. Mol Biol Cell
2000, 11:4241-4257.
14. Jorgensen P, Rupes I, Sharom JR, Schneper L, Broach JR, Tyers M: A
dynamic transcriptional network communicates growth
potential to ribosome synthesis and critical cell size. Genes
Dev 2004, 18:2491-2505.
15. Martin DE, Soulard A, Hall MN: TOR regulates ribosomal pro-
tein gene expression via PKA and the Forkhead transcrip-
tion factor FHL1. Cell 2004, 119:969-979.
16. Marion RM, Regev A, Segal E, Barash Y, Koller D, Friedman N, O'Shea
EK: Sfp1 is a stress- and nutrient-sensitive regulator of ribos-
omal protein gene expression. Proc Natl Acad Sci USA 2004,
101:14315-14322.
17. Cipollina C, Alberghina L, Porro D, Vai M: SFP1 is involved in cell
size modulation in respiro-fermentative growth conditions.
Yeast 2005, 22:385-399.
18. Klein C, Struhl K: Protein kinase A mediates growth-regulated
expression of yeast ribosomal protein genes by modulating
RAP1 transcriptional activity. Mol Cell Biol 1994, 14:1920-1928.
19. Powers T, Walter P: Regulation of ribosome biogenesis by the
rapamycin-sensitive TOR-signaling pathway in Saccharomy-
ces cerevisiae. Mol Biol Cell 1999, 10:987-1000.
20. Thevelein JM, Cauwenberg L, Colombo S, De Winde JH, Donation M,
Dumortier F, Kraakman L, Lemaire K, Ma P, Nauwelaers D, et al.:
Nutrient-induced signal transduction through the protein
kinase A pathway and its role in the control of metabolism,
stress resistance, and growth in yeast. Enzyme Microb Technol
2000, 26:819-825.
21. Winderickx J, Holsbeeks I, Lagatie O, Giots F, Thevelein J, de Winde
H: From feast to famine: adaptation to nutrient availability
inyeast. In Yeast Stress Responses Edited by: Hohmann S, Mager WH.
Berlin: Springer; 2003:306-386.
22. Timson DJ, Ross HC, Reece RJ: Gal3p and Gal1p interact with
the transcriptional repressor Gal80p to form a complex of
1:1 stoichiometry. Biochem J 2002, 363:515-520.
23. Diep CQ, Peng G, Bewley M, Pilauri V, Ropson I, Hopper JE: Intra-
genic suppression of Gal3C interaction with Gal80 in the Sac-
charomyces cerevisiae GAL gene switch. Genetics 2006,
172:77-87.
24. Pilauri V, Bewley M, Diep C, Hopper J: Gal80 dimerization and
the yeast GAL gene switch. Genetics 2005, 169:1903-1914.
25. Zhou H, Winston F: NRG1 is required for glucose repression of
the SUC2 and GAL genes of Saccharomyces cerevisiae. BMC
Genet 2001, 2:5.
26. Koch C, Moll T, Neuberg M, Ahorn H, Nasmyth K: A role for the
transcription factors Mbp1 and Swi4 in progression from G1
to S phase. Science 1993, 261:1551-1557.
27. Blaiseau PL, Isnard AD, Surdin-Kerjan Y, Thomas D: Met31p and
Met32p, two related zinc finger proteins, are involved in
transcriptional regulation of yeast sulfur amino acid
metabolism. Mol Cell Biol 1997, 17:3640-3648.
28. Schuller HJ: Transcriptional control of nonfermentative
metabolism in the yeast Saccharomyces cerevisiae. Curr Genet
2003, 43:139-160.
29. Costanzo M, Schub O, Andrews B: G1 transcription factors are
differentially regulated in Saccharomyces cerevisiae by the
Swi6-binding protein Stb1. Mol Cell Biol 2003, 23:5064-5077.
30. Ho Y, Costanzo M, Moore L, Kobayashi R, Andrews BJ: Regulation
of transcription at the Saccharomyces cerevisiae start transi-
tion by Stb1, a Swi6-binding protein. Mol Cell Biol 1999,
19:5267-5278.
31. Kumar R, Reynolds DM, Shevchenko A, Shevchenko A, Goldstone
SD, Dalton S: Forkhead transcription factors, Fkh1p and
Fkh2p, collaborate with Mcm1p to control transcription
required for M-phase. Curr Biol 2000, 10:896-906.
32. Wittenberg C, Reed SI: Cell cycle-dependent transcription in
yeast: promoters, transcription factors, and transcriptomes.
Oncogene 2005, 24:2746-2755.
33. Loy CJ, Lydall D, Surana U: NDD1, a high-dosage suppressor of
cdc28-1N, is essential for expression of a subset of late-S-
phase-specific genes in Saccharomyces cerevisiae. Mol Cell Biol
1999, 19:3312-3327.
34. Mai B, Breeden LL: Identification of target genes of a yeast
transcriptional repressor. Methods Mol Biol 2006, 317:267-277.
35. Bhoite LT, Yu Y, Stillman DJ: The Swi5 activator recruits the
Mediator complex to the HO promoter without RNA
polymerase II. Genes Dev 2001, 15:2457-2469.
36. Spector MS, Raff A, DeSilva H, Lee K, Osley MA: Hir1p and Hir2p
function as transcriptional corepressors to regulate histone
gene transcription in the Saccharomyces cerevisiae cell cycle.
Mol Cell Biol 1997, 17:545-552.
37. Prochasson P, Florens L, Swanson SK, Washburn MP, Workman JL:
The HIR corepressor complex binds to nucleosomes gener-
ating a distinct protein/DNA complex resistant to remode-
ling by SWI/SNF. Genes Dev 2005, 19:2534-2539.
38. Van Slyke C, Grayhack EJ: The essential transcription factor
Genome Biology 2006, Volume 7, Issue 5, Article R37 Lemmens et al. R37.13
comment reviews reports refereed researchdeposited research interactions information
Genome Biology 2006, 7:R37
Reb1p interacts with the CLB2 UAS outside of the G2/M
control region. Nucleic Acids Res 2003, 31:4597-4607.
39. Gil R, Zueco J, Sentandreu R, Herrero E: RCS1, a gene involved in
controlling cell size in Saccharomyces cerevisiae. Yeast 1991,
7:1-14.
40. Cosma MP: Daughter-specific repression of Saccharomyces
cerevisiae HO: Ash1 is the commander. EMBO Rep 2004,
5:953-957.
41. Pan X, Heitman J: Sok2 regulates yeast pseudohyphal differen-
tiation via a transcription factor cascade that regulates cell-
cell adhesion. Mol Cell Biol 2000, 20:8364-8372.
42. Gancedo JM: Control of pseudohyphae formation in Saccharo-
myces cerevisiae. FEMS Microbiol Rev 2001, 25:107-123.
43. Gagiano M, Bauer FF, Pretorius IS: The sensing of nutritional
status and the relationship to filamentous growth in Saccha-
romyces cerevisiae. FEMS Yeast Res 2002, 2:433-470.
44. Daugherty JR, Rai R, el Berry HM, Cooper TG: Regulatory circuit
for responses of nitrogen catabolic gene expression to the
GLN3 and DAL80 proteins and nitrogen catabolite repres-
sion in Saccharomyces cerevisiae. J Bacteriol 1993, 175:64-73.
45. Hofman-Bang J: Nitrogen catabolite repression in Saccharomy-
ces cerevisiae. Mol Biotechnol 1999, 12:35-73.
46. Albrecht G, Mosch HU, Hoffmann B, Reusser U, Braus GH: Monitor-
ing the Gcn4 protein-mediated response in the yeast Saccha-
romyces cerevisiae. J Biol Chem 1998, 273:12696-12702.
47. Natarajan K, Meyer MR, Jackson BM, Slade D, Roberts C, Hinnebusch
AG, Marton MJ: Transcriptional profiling shows that Gcn4p is
a master regulator of gene expression during amino acid
starvation in yeast. Mol Cell Biol 2001, 21:4347-4368.
48. Hinnebusch AG: Translational regulation of GCN4 and the
general amino acid control of yeast. Annu Rev Microbiol 2005,
59:407-450.
49. Dilova I, Aronova S, Chen JC, Powers T: Tor signaling and nutri-
ent-based signals converge on Mks1p phosphorylation to
regulate expression of Rtg1.Rtg3p-dependent target genes. J
Biol Chem 2004, 279:46527-46535.
50. Cutler NS, Pan X, Heitman J, Cardenas ME: The TOR signal trans-
duction cascade controls cellular differentiation in response
to nutrients. Mol Biol Cell 2001, 12:4103-4113.
51. Cooper TG: Transmitting the signal of excess nitrogen in Sac-
charomyces cerevisiae from the Tor proteins to the GATA
factors: connecting the dots. FEMS Microbiol Rev 2002,
26:223-238.
52. Valenzuela L, Aranda C, Gonzalez A: TOR modulates GCN4-
dependent expression of genes turned on by nitrogen
limitation. J Bacteriol 2001, 183:2331-2334.
53. Martinez-Pastor MT, Marchler G, Schuller C, Marchler-Bauer A, Ruis
H, Estruch F: The Saccharomyces cerevisiae zinc finger proteins
Msn2p and Msn4p are required for transcriptional induction
through the stress response element (STRE). EMBO J 1996,
15:2227-2235.
54. Schmitt AP, McEntee K: Msn2p, a zinc finger DNA-binding pro-
tein, is the transcriptional activator of the multistress
response in Saccharomyces cerevisiae. Proc Natl Acad Sci USA
1996, 93:5777-5782.
55. Gorner W, Durchschlag E, Martinez-Pastor MT, Estruch F, Ammerer
G, Hamilton B, Ruis H, Schuller C: Nuclear localization of the
C2H2 zinc finger protein Msn2p is regulated by stress and
protein kinase A activity. Genes Dev 1998, 12:586-597.
56. Wong CM, Ching YP, Zhou Y, Kung HF, Jin DY: Transcriptional
regulation of yeast peroxiredoxin gene TSA2 through
Hap1p, Rox1p, and Hap2/3/5p. Free Radic Biol Med 2003,
34:585-597.
57. Raitt DC, Johnson AL, Erkine AM, Makino K, Morgan B, Gross DS,
Johnston LH: The Skn7 response regulator of Saccharomyces
cerevisiae interacts with Hsf1 in vivo and is required for the
induction of heat shock genes by oxidative stress. Mol Biol Cell
2000, 11:2335-2347.
58. Pinson B, Gabrielsen OS, Daignan-Fornier B: Redox regulation of
AMP synthesis in yeast: a role of the Bas1p and Bas2p tran-
scription factors. Mol Microbiol 2000, 36:1460-1469.
59. Nevitt T, Pereira J, Rodrigues-Pousada C: YAP4 gene expression
is induced in response to several forms of stress in Saccharo-
myces cerevisiae. Yeast 2004, 21:1365-1374.
60. Vyas VK, Berkey CD, Miyao T, Carlson M: Repressors Nrg1 and
Nrg2 regulate a set of stress-responsive genes in Saccharo-
myces cerevisiae. Eukaryot Cell 2005, 4:1882-1891.
61. Regnacq M, Alimardani P, El Moudni B, Berges T: SUT1p interac-
tion with Cyc8p(Ssn6p) relieves hypoxic genes from Cyc8p-
Tup1p repression in Saccharomyces cerevisiae. Mol Microbiol
2001, 40:1085-1096.
62. Deckert J, Perini R, Balasubramanian B, Zitomer RS: Multiple ele-
ments and auto-repression regulate Rox1, a repressor of
hypoxic genes in Saccharomyces cerevisiae. Genetics 1995,
139:1149-1158.
63. Knight SA, Tamai KT, Kosman DJ, Thiele DJ: Identification and
analysis of a Saccharomyces cerevisiae copper homeostasis
gene encoding a homeodomain protein. Mol Cell Biol 1994,
14:7792-7804.
64. Furuchi T, Ishikawa H, Miura N, Ishizuka M, Kajiya K, Kuge S, Naga-
numa A: Two nuclear proteins, Cin5 and Ydr259c, confer
resistance to cisplatin in Saccharomyces cerevisiae. Mol
Pharmacol 2001, 59:470-474.
65. Steber CM, Esposito RE: UME6 is a central component of a
developmental regulatory switch controlling meiosis-spe-
cific gene expression. Proc Natl Acad Sci USA 1995,
92:12490-12494.
66. Bogengruber E, Eichberger T, Briza P, Dawes IW, Breitenbach M,
Schricker R: Sporulation-specific expression of the yeast DIT1/
DIT2 promoter is controlled by a newly identified repressor
element and the short form of Rim101p. Eur J Biochem 1998,
258:430-436.
67. Shenhar G, Kassir Y: A positive regulator of mitosis, Sok2, func-
tions as a negative regulator of meiosis in Saccharomyces
cerevisiae. Mol Cell Biol 2001, 21:1603-1612.
68. Rothfels K, Tanny JC, Molnar E, Friesen H, Commisso C, Segall J:
Components of the ESCRT pathway, DFG16, and YGR122w
are required for Rim101 to act as a corepressor with Nrg1 at
the negative regulatory element of the DIT1 gene of Saccha-
romyces cerevisiae. Mol Cell Biol 2005, 25:6772-6788.
69. Mai B, Breeden L: Xbp1, a stress-induced transcriptional
repressor of the Saccharomyces cerevisiae Swi4/Mbp1 family.
Mol Cell Biol 1997, 17:6491-6501.
70. Schneider JC, Guarente L: Regulation of the yeast CYT1 gene
encoding cytochrome c1 by HAP1 and HAP2/3/4. Mol Cell Biol
1991, 11:4934-4942.
71. Zitomer RS, Lowry CV: Regulation of gene expression by oxy-
gen in Saccharomyces cerevisiae. Microbiol Rev 1992, 56:1-11.
72. Kellis M, Patterson N, Endrizzi M, Birren B, Lander ES: Sequencing
and comparison of yeast species to identify genes and regu-
latory elements. Nature 2003, 423:241-254.
73. Hu Y, Cooper TG, Kohlhaw GB: The Saccharomyces cerevisiae
Leu3 protein activates expression of GDH1, a key gene in
nitrogen assimilation. Mol Cell Biol 1995, 15:52-57.
74. Kohlhaw GB: Leucine biosynthesis in fungi: entering metabo-
lism through the back door. Microbiol Mol Biol Rev 2003, 67:1-15.
75. Thomas D, Surdin-Kerjan Y: Metabolism of sulfur amino acids in
Saccharomyces cerevisiae. Microbiol Mol Biol Rev 1997, 61:503-532.
76. Blaiseau PL, Thomas D: Multiple transcriptional activation com-
plexes tether the yeast activator Met4 to DNA. EMBO J 1998,
17:6327-6336.
77. Menon BB, Sarma NJ, Pasula S, Deminoff SJ, Willis KA, Barbara KE,
Andrews B, Santangelo GM: Reverse recruitment: the Nup84
nuclear pore subcomplex mediates Rap1/Gcr1/Gcr2 tran-
scriptional activation. Proc Natl Acad Sci USA 2005,
102:5749-5754.
78. Devlin C, Tice-Baldwin K, Shore D, Arndt KT: RAP1 is required
for BAS1/BAS2- and GCN4-dependent transcription of the
yeast HIS4 gene. Mol Cell Biol 1991, 11:3642-3651.
79. Kuchin S, Vyas VK, Carlson M: Snf1 protein kinase and the
repressors Nrg1 and Nrg2 regulate FLO11, haploid invasive
growth, and diploid pseudohyphal differentiation. Mol Cell Biol
2002, 22:3994-4000.
80. Zhu G, Spellman PT, Volpe T, Brown PO, Botstein D, Davis TN,
Futcher B: Two yeast forkhead genes regulate the cell cycle
and pseudohyphal growth. Nature 2000, 406:90-94.
81. Zaragoza O, Gancedo JM: Pseudohyphal growth is induced in
Saccharomyces cerevisiae by a combination of stress and
cAMP signalling. Antonie Van Leeuwenhoek 2000, 78:187-194.
82. Pascual-Ahuir A, Posas F, Serrano R, Proft M: Multiple levels of
control regulate the yeast cAMP-response element-binding
protein repressor Sko1p in response to stress. J Biol Chem
2001, 276:37373-37378.
83. Mitchell AP: Control of meiotic gene expression in Saccharo-
myces cerevisiae. Microbiol Rev 1994, 58:56-70.
84. Mallory MJ, Strich R: Ume1p represses meiotic gene
R37.14 Genome Biology 2006, Volume 7, Issue 5, Article R37 Lemmens et al. />Genome Biology 2006, 7:R37
transcription in Saccharomyces cerevisiae through interaction
with the histone deacetylase Rpd3p. J Biol Chem 2003,
278:44727-44734.
85. Young Lab [ />86. Lee TI, Rinaldi NJ, Robert F, Odom DT, Bar-Joseph Z, Gerber GK,
Hannett NM, Harbison CT, Thompson CM, Simon I, et al.: Tran-
scriptional regulatory networks in Saccharomyces cerevisiae.
Science 2002, 298:799-804.
87. Marchal K, De Keersmaecker S, Monsieurs P, Van Boxel N, Lemmens
K, Thijs G, Vanderleyden J, De Moor B: In silico identification and
experimental validation of PmrAB targets in Salmonella
typhimurium by regulatory motif detection. Genome Biol 2004,
5:R9.
88. Expander [ />89. Shakhnovich BE, Reddy TE, Galinsky K, Mellor J, Delisi C: Compar-
isons of predicted genetic modules: identification of co-
expressed genes through module gene flow. Genome Inform Ser
Workshop Genome Inform 2004, 15:221-228.
90. Mewes HW, Amid C, Arnold R, Frishman D, Guldener U, Mannhaupt
G, Munsterkotter M, Pagel P, Strack N, Stumpflen V, et al.: MIPS:
analysis and annotation of proteins from whole genomes.
Nucleic Acids Res 2004:D41-D44.
91. Balakrishnan R, Christie KR, Costanzo MC, Dolinski K, Dwight SS,
Engel SR, Fisk DG, Hirschman JE, Hong EL, Nash R, et al.: Fungal
BLAST and Model Organism BLASTP Best Hits: new com-
parison resources at the Saccharomyces Genome Database
(SGD). Nucleic Acids Res 2005:D374-D377.
92. Shannon P, Markiel A, Ozier O, Baliga NS, Wang JT, Ramage D, Amin
N, Schwikowski B, Ideker T: Cytoscape: a software environment
for integrated models of biomolecular interaction networks.
Genome Res 2003, 13:2498-2504.