Báo cáo y học: "Slow, stochastic transgene repression with properties of a timer" potx
Bạn đang xem bản rút gọn của tài liệu. Xem và tải ngay bản đầy đủ của tài liệu tại đây (461.92 KB, 11 trang )
Genome Biology 2006, 7:R47
comment reviews reports deposited research refereed research interactions information
Open Access
2006Wanget al.Volume 7, Issue 6, Article R47
Research
Slow, stochastic transgene repression with properties of a timer
Clifford L Wang, Desirée C Yang and Matthias Wabl
Address: Department of Microbiology and Immunology, University of California, San Francisco, CA 94143-0414, USA.
Correspondence: Clifford L Wang. Email:
© 2006 Wang et al.; licensee BioMed Central Ltd.
This is an open access article distributed under the terms of the Creative Commons Attribution License ( which
permits unrestricted use, distribution, and reproduction in any medium, provided the original work is properly cited.
Stochastic transgene expression<p>The dynamics of retroviral transgene repression were analyzed in several clones; repression was found to be slow and different genomic positions showed different dynamics.</p>
Abstract
Background: When gene expression varies unpredictably between genetically identical
organisms, this is sometimes ascribed as stochastic. With the prevalence of retroviral vectors,
stochastic repression is often observed and can complicate the interpretation of outcomes. But it
may also faithfully reflect characteristics of sites in the genome.
Results: We created and identified several cell clones in which, within a given cell, retroviral
transcription of a transgene was repressed heritably and essentially irreversibly. This repression
was relatively slow; total repression in all cells took months. We observed the dynamics of
repression and found that they were ergodic, that is, tending with a probability to a final state
independent of previous conditions. Different positions of the transgene in the genome
demonstrated different dynamics. At a position on mouse chromosome 9, repression abided by
near perfect first-order kinetics and was highly reproducible, even under conditions where the
number of cell generations per day varied.
Conclusion: We propose that such a cell division independent 'off' mechanism could play a role
in endogenous gene expression, potentially providing an epigenetically based timer for extended
periods.
Background
When a single outcome is not a certainty, but instead chosen
seemingly randomly from two or more possible states, that
process is often termed 'stochastic'. Stochasticity is also used
to explain phenotypic differences between cells of a geneti-
cally identical population. Examples include how individual
cells of Escerichia coli [1] or yeast [2] in the same culture pro-
duce differing amounts of a protein; yeast express either the
a or α mating type locus [3]; olfactory neurons each express a
different odorant receptor [4]; mature T cells choose to
express either CD4 or CD8, but not both [5]; B cells express
one functional immunoglobulin allele while excluding the
other [6,7]. Ronai et al. have demonstrated that within a
clonal population of cells, epigenetic differences at the immu-
noglobulin locus can lead to distinct expression states that
can be inherited from generation to generation [8-10]. Also,
using transgenic reporter constructs, Walters et al. studied
the effect of enhancers on genetic variegation that results
from slow gene repression [11,12]. Weinberger et al. [11] have
shown that the fluctuations in amounts of the viral protein
Tat can lead to different expression states of green fluorescent
protein (GFP) expressed from an HIV-based vector [13]. They
demonstrated that Tat is a decisive component in a positive
feedback loop, and that stochastic and variable expression of
Tat affects whether GFP is expressed at a high or low state.
Published: 9 June 2006
Genome Biology 2006, 7:R47 (doi:10.1186/gb-2006-7-6-r47)
Received: 13 February 2006
Revised: 30 March 2006
Accepted: 8 May 2006
The electronic version of this article is the complete one and can be
found online at />R47.2 Genome Biology 2006, Volume 7, Issue 6, Article R47 Wang et al. />Genome Biology 2006, 7:R47
Such phenotypic bifurcation may also explain proviral latency
[13].
The assumption that a mechanism is stochastic can be rea-
sonable, and in biology many stochastic models abound
[2,14-18]. But in biology, final outcomes are also often
instructed and so the issue of stochasticity is not always clear.
While phenotypic outcomes might appear random, if one tal-
lies enough events, the ensemble of events should reveal that
outcomes are probabilistic. We describe a system to charac-
terize the repression of a transgene in a mammalian cell line.
Using this system, we demonstrate that slow repression can
abide by first-order decay kinetics over long time periods.
Here, we focus not on the fluctuation of expression due to sto-
chasticity, but describe how predictable dynamics of repres-
sion can be determined by a stochastic decision.
Results
First, using the pre-B cell line 18-81, we created transgenic
cell lines that expressed GFP. Cells were infected with a retro-
viral vector containing GFP (Figure 1a) or GFP followed by an
enhancer from the immunoglobulin (Ig) heavy chain. Two
days later, we isolated single, infected cells exhibiting fluores-
cence greater than 100 relative units. Clones were then
expanded from these single cells. The infection was at multi-
plicity of less than 5%. Thus, if one assumes a Poisson distri-
bution of infection, greater than 95% of all the clones are
likely to contain only one vector copy. For 10 clones we deter-
mined the sites of vector integration (Table 1). None of the 10
contained more than one copy of the vector.
Gene repression as a state function
Since our aim was to study gene inactivation, cultures were
not initially selected with antibiotics. Also, because we waited
two days before isolating fluorescent clones, we avoided those
clones where GFP inactivation was rapid (that is, occurring in
less than two days). This method facilitated the study of gene
repression that is observable over longer periods of time. By
using flow cytometry to measure GFP fluorescence, we were
able to track gene repression of a population on a cell-by-cell
basis. In total, we created and tracked 93 clones (Figure 1b;
Additional data file 4) that differed in GFP expression. Differ-
ences in integration sites likely account for these differences.
Of the 93 clones, 45 clones were transduced with GFP and 48
clones were transduced with GFP followed by the Ig
enhancer. Between those with and without the additional
enhancer, we observed little discernable difference in gene
inactivation. Nearly all of the GFP expression profiles had
multiple peaks (for example, bi- or tri- modal) and this meant
that fluorescence behaved as a state property, with decreases
in fluorescence corresponding to transition from a high to low
expression state (Figure 1b; Additional data file 4). Out of 93
clones, there were only three (clones 9, 11, and 13) in which
the decrease in fluorescence appeared continuous, and all
were decreases from an initially low level.
After 32 days in culture, 26 of 93 clones had repressed GFP
expression to the point that more than 90% of the cell popu-
lation produced a relative fluorescence less than 100 (Figure
1c). In contrast, 4 of 93 clones had populations where less
than 10% of the cells had fluorescence less than 100. In 38 of
the clones, 10% to 50% of the cells in the culture produced flu-
orescence less than 100.
We selected clones 5, 6 and 18 for further study. All had been
transduced with the vector encoding GFP (with no additional
Ig enhancer). GFP expression in clones 5 and 18 tended to be
an all-or-none phenomenon, with fluorescence being pro-
duced either highly or not at all (Figure 2a). In clone 6, most
Table 1
Vector integration sites in clones
Clone Chromosome Base number Orientation Closest gene Distance (bp)
2 4 119,028,655 + Hivep3 in intron
3 3 95,092,146 + Mllt11 347
5 16 76,364,060 - Nrip1 in intron
6 9 21,506,165 - Smarca4 5,878
7 10 62,465,169 + Slc25a16 in exon
12 11 75,541,573 - Serpinf2 20,524
13 11 118,056,600 + Socs3 18,534
18 5 141,941,240 + Actb 1,613
19 11 106,269,600 - Limd2 417
24 2 158,459,470 + Ppp1r16b in intron
Chromosome, base number, and orientation (+/-) correspond to positions defined by the University of California, Santa Cruz Genomics
Bioinformatics database for the mouse (August 2005 assembly). The closest known gene to the integration site and its distance to the site are also
given.
Genome Biology 2006, Volume 7, Issue 6, Article R47 Wang et al. R47.3
comment reviews reports refereed researchdeposited research interactions information
Genome Biology 2006, 7:R47
cells expressed GFP at either a high or a low, yet detectable,
state, with a small percentage of cells expressing no detecta-
ble GFP fluorescence. Since expression of GFP behaved as a
state function, we could tally outcomes as being high, low, or
no fluorescence (as gated on Figure 2a). When the absolute
data were recast in terms of states (Figure 2b; Additional data
files 1, 2, 3), one could clearly see how the decrease in cells
expressing high GFP coincided with the increase in cells with
repressed GFP, that is, those having either low or no
fluorescence.
Stochastic repression of gene transcription
After the first experiment (Figures 1b, and Figure 2b, top),
cells with high fluorescence were isolated by fluorescence-
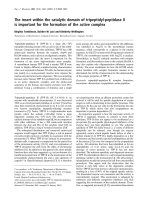
Expression of GFP fluorescence in clonesFigure 1
Expression of GFP fluorescence in clones. (a) Clones were transduced with a retroviral vector. LTR, long terminal repeat; ψ, retroviral packaging signal;
GFP, green fluorescent protein; IRES, internal ribosome entry site; Puro
R
, puromycin resistance gene. (b) Flow cytometry profiling GFP fluorescence of
untransduced cells (No GFP) and clones 1 to 24, which were transduced with the GFP vector (other clones in Additional data file 4). X-axis, relative
fluorescence, where that of untransduced cells was set to 3.0; Y-axis (from front to back), 13, 22, 32, and 42 days in culture; Z-axis, normalized cell
number; upper left corners show the clone identification number followed by the fraction of the population with fluorescence less than 100 after 32 days.
(c) Histogram summary of GFP repression in clones after 32 days. Bars represent number of clones transduced with GFP (gray) and clones transduced
with GFP plus an adjacent Ig enhancer (black).
(c)(a)
0
5
10
15
20
25
30
0.1 0.2 0.3 0.4 0.5 0.6 0.7 0.8 0.9 1
0 0.1 0.2 0.3
0.4 0.5 0.6
0.7
0.8 0.9 1.0
0
5
10
15
20
25
30
Fraction of cells with
GFP fluorescence <100
Number of Clones
Puro
R
LTR
LTR
ψ
IRE SGFP
(b)
10
0
10
1
10
2
10
3
10
4
10
0
10
1
10
2
10
3
10
4
10
0
10
1
10
2
10
3
10
4
10
0
10
1
10
2
10
3
10
4
10
0
10
1
10
2
10
3
10
4
10
0
10
1
10
2
10
3
10
4
10
0
10
1
10
2
10
3
10
4
10
0
10
1
10
2
10
3
10
4
10
0
10
1
10
2
10
3
10
4
10
0
10
1
10
2
10
3
10
4
10
0
10
1
10
2
10
3
10
4
10
0
10
1
10
2
10
3
10
4
10
0
10
1
10
2
10
3
10
4
10
0
10
1
10
2
10
3
10
4
10
0
10
1
10
2
10
3
10
4
10
0
10
1
10
2
10
3
10
4
10
0
10
1
10
2
10
3
10
4
10
0
10
1
10
2
10
3
10
4
10
0
10
1
10
2
10
3
10
4
10
0
10
1
10
2
10
3
10
4
10
0
10
1
10
2
10
3
10
4
10
0
10
1
10
2
10
3
10
4
No GFP (1) (2) (3) (4) (5)
(9) (11) (12) (13)
(14) (15) (16) (18) (19) (20)
(21) (22) (23) (24)
1.000 0.573 0.729 0.544 0.638 0.455
0.605 0.999 0.999 0.999 0.874 0.971
1.000 0.725 0.666 0.406 0.327 0.997
0.448 0.381 0.293 0.878
(6)
(7)
R47.4 Genome Biology 2006, Volume 7, Issue 6, Article R47 Wang et al. />Genome Biology 2006, 7:R47
activated cell sorting (FACS) and reintroduced to culture.
Again, GFP was similarly repressed (Figure 2b, middle).
From this second experiment, cells with high fluorescence
again were re-isolated and monitored (Figure 2b, bottom),
this time for a longer period. Again, the dynamics of repres-
sion were similar to the previous experiments. It appeared
that the re-isolated populations were not affected by time
spent in culture and had no memory of previous experiments.
This property was convenient from a practical standpoint -
for subsequent experiments, we could reset cultures to a com-
mon starting point where all cells expressed high, unre-
pressed GFP.
When the cells were re-sorted for high GFP expression and
cultivated in medium containing puromycin, less repression
occurred (Figure 3a). Selection with puromycin enriched for
cells expressing puromycin resistance. In our construct, GFP
and puromycin resistance are encoded on the same tran-
script. Thus, the puromycin-dependent enrichment for cells
with high fluorescence indicated that the repression observed
without puromycin was caused by a decrease in transcription.
Quantitative real time (RT)-PCR, using beta-actin as an inter-
nal standard, corroborated this finding. From cultures grown
without puromycin, we isolated cells that had or had not
repressed GFP expression. Cells from clone 6 producing low
GFP fluorescence and those from clone 18 producing unde-
tectable GFP fluorescence contained, respectively, 55 and 21
times less GFP mRNA than their high GFP counterparts (not
shown). Since the cell line used in this study undergoes
hypermutation [19], we considered the possibility that the
changes in transcription resulted from mutations in DNA. We
separated clone 6 cells producing high fluorescence from
those producing low fluorescence and sequenced the GFP
gene. Because the majority of GFP sequences (17 of 22) iso-
lated from cells producing low fluorescence contained no
mutations at any base within the coding region, we conclude
that mutations in the coding region could not account for all
cases of gene repression. The mutation frequency in cells pro-
ducing high fluorescence was comparable; 15 of 17 sequences
contained zero mutations. Though we cannot rule out muta-
tion occurring in the promoter, we think this is unlikely, since
such mutation in B cells (caused by endogenous activation-
induced cytidine deaminase) is only known to occur in tran-
scribed regions of DNA, at some distance from the promoter
[20]. Documented mutation rates [19,21] for this cell line are
three or more orders of magnitude lower than the rate of
repression observed.
Heritability and irreversibility of gene repression
For clones 6 and 18, we asked whether the repressed tran-
scription states were stably inherited. When we isolated cells
with repressed GFP levels (low or no observable fluorescence)
and put these cells back into culture, we saw no high GFP-
expressing cells reemerge (Figure 3b). Here we had passaged
the cells by splitting the cultures by a third daily (that is, for a
3 ml culture, 2 ml of fresh medium was combined with 1 ml of
the old culture) for 27 days. Because cultures reached a
steady-state number of cells (stationary phase) each day, the
amount that the culture was split corresponded to the
number of cell generations per day. By approximating the
average number of generations per day to be equal to -ln(split
fraction)/ln(2), we determined that repressed expression was
inherited through at least 43 generations. This meant that the
observed GFP dynamics were due to repression alone and not
a combination of repression and de-repression.
Kinetics of gene repression
We queried whether different proliferation conditions could
affect gene repression. Since we needed to maintain healthy
viable cells over months, inhibitors of cell cycle to control
growth rate were not an experimental option for us. Instead,
cultures were 'split' (that is, diluted) daily with different frac-
tions of new medium, ranging from a half to a sixth. For cul-
tures that reached steady-state cell concentrations each day
following medium replenishment, we calculated that splitting
by a half, a third, a quarter, a fifth, and a sixth corresponded
to an average of 1.0, 1.6, 2.0, 2.3, and 2.6 generations, respec-
tively, per day. In a previous study, by staining with carboxy-
fluorescein diacetate succinimidyl ester (CFSE) we have
established that these different culture conditions do vary the
number of cell generations per day [22]. In addition, the 18-
81 cell line was well suited for these experiments because they
are highly non-adherent and divide rapidly. In all conditions
we studied here, the cell medium never reached a pH under 7
(as observed by phenol red indicator), exhibited no visible
signs of cell stress - lack of vacuoles, consistent cell shape and
membrane integrity, and so on - and viable cell staining deter-
mined the presence of less than 2% dead cells. We also noted
that clone 5 cells could not divide fast enough to keep pace
with a culture dilution rate of one-fifth and clone 6 could not
do so when diluted by a sixth. Thus, here we have analyzed
only cultures where cell numbers were steadily maintained.
Although our method to vary the number of cell generations
worked well, it is indirect, and our results should be inter-
preted with this in mind.
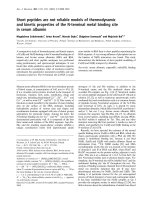
GFP fluorescence of clones 5, 6, and 18Figure 2 (see following page)
GFP fluorescence of clones 5, 6, and 18. (a) Levels of GFP fluorescence, high, low, and none, were defined by flow cytometry profiles of untransduced cells
(No GFP) and clones 5, 6, and 18. X-axis, relative fluorescence; Y-axis, number of cells. (b) GFP fluorescence: top, during initial expansion from a single
cell and subsequent passaging (no error bars because there was only one replicate, that is, n = 1); middle, fluorescence in cells isolated from the first
experiment (top) (clone 5 without error bars because n = 1); bottom, fluorescence in cells isolated from the second experiment (middle). Fraction of cells
are shown with high (diamonds), low (squares), or no (triangles) fluorescence.
Genome Biology 2006, Volume 7, Issue 6, Article R47 Wang et al. R47.5
comment reviews reports refereed researchdeposited research interactions information
Genome Biology 2006, 7:R47
Figure 2 (see legend on previous page)
No GFP Clone 6
Clone 5 Clone 18
(a)
10
0
10
1
10
2
10
3
10
4
0
200
400
600
800
10
0
10
1
10
2
10
3
10
4
0
200
400
600
10
0
10
1
10
2
10
3
10
4
0
200
400
600
800
10
0
10
1
10
2
10
3
10
4
0
200
400
600
800
GFP fluorescence
Number ofCells
None None
None
NoneLow
High
Low
High
Low
High
0.0
0.2
0.4
0.6
0.8
1.0
020406080
0.0
0.2
0.4
0.6
0.8
1.0
020406080
0.0
0.2
0.4
0.6
0.8
1.0
020406080
0.0
0.2
0.4
0.6
0.8
1.0
020406080
0.0
0.2
0.4
0.6
0.8
1.0
020406080
0.0
0.2
0.4
0.6
0.8
1.0
020406080
0.0
0.2
0.4
0.6
0.8
1.0
0 20406080100
0.0
0.2
0.4
0.6
0.8
1.0
0 20406080100
0.0
0.2
0.4
0.6
0.8
1.0
0 20406080100
Time (days)
Fraction of cells
Clone 5
Clone 6
Clone 18
(b)
R47.6 Genome Biology 2006, Volume 7, Issue 6, Article R47 Wang et al. />Genome Biology 2006, 7:R47
Although we grew all the clones at the same time and tried to
maintain identical experimental conditions, with clone 5 the
data varied substantially between experiments performed at
different times and between replicates performed simultane-
ously (Figures 2 and 3). This variability in the data precludes
statements about kinetics of repression by clone 5. For clones
6 and 18, repression dynamics were more reproducible. The
average standard deviations (error bars in Figure 4) between
replicate cultures (n = 4) for all conditions were 4% and 2%
for clones 6 and 18, respectively.
We evaluated the fit of the GFP repression dynamics (Figure
4a) to zero, first, and second-order decay kinetics (Table 2).
Here the fraction of cells (c) expressing an unrepressed level
of GFP was represented as a function of time (t) and a charac-
teristic rate (k), such that C = 1 - kt (zero order), C = e
-kt
(first
order), or C = (1 + kt)
-1
(second order).
Dynamics of zero order would suggest that gene repression
was instructed by some factor unrelated to the cells in the cul-
ture, or that there existed some intricate quorum-sensing
among cells, so as to maintain a constant repression rate
despite the fact that the pool of 'available' cells (that is, with
unrepressed GFP) was decreasing with time. As there was no
clear case where the gene repression was closer to zero order
than first order, we conclude that such active regulation of
repression was unlikely.
For clones 6 and 18, the decrease in cells producing fluores-
cence fit rather well to first-order kinetics (Figure 4b). Clone
6 in particular demonstrated a good fit to first-order kinetics
and its R-squared values (Table 2) were 0.996 or greater in all
experiments. However, clones 6 and 18 behaved differently
when passaged with different splitting regimens. For clone
18, the rate of fluorescence loss increased as the cultures were
replenished by greater fractions of medium (Figure 4c, right).
Since here greater passaging fractions necessitated a greater
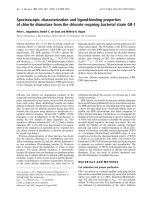
GFP fluorescence of clones 5, 6, and 18 with antibiotic selection or pre-sorted cells with repressed levels of GFPFigure 3
GFP fluorescence of clones 5, 6, and 18 with antibiotic selection or pre-sorted cells with repressed levels of GFP. Levels of GFP fluorescence by (a)
cultures grown with puromycin and (b) cultures started with cells producing low or no fluorescence (no error bars because n = 1). Fraction of cells are
shown with high (diamonds), low (squares), or no (triangles) fluorescence.
(a)
0.0
0.2
0.4
0.6
0.8
1.0
020406080
0.0
0.2
0.4
0.6
0.8
1.0
020406080
0.0
0.2
0.4
0.6
0.8
1.0
020406080
0.0
0.2
0.4
0.6
0.8
1.0
0 5 10 15 20 25
0.0
0.2
0.4
0.6
0.8
1.0
0 5 10 15 20 25
0.0
0.2
0.4
0.6
0.8
1.0
0 5 10 15 20 25
Clone 5 Clone 6
Clone 18
Clone 6 sorted for
low GFP fluorescence
Clone 18 sorted for
no GFP fluorescence
Clone 6 sorted for
no GFP fluorescence
Fraction of cells
(b)
Fraction of cells
Time (days)
Genome Biology 2006, Volume 7, Issue 6, Article R47 Wang et al. R47.7
comment reviews reports refereed researchdeposited research interactions information
Genome Biology 2006, 7:R47
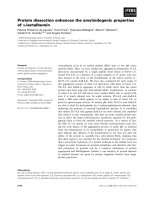
Repression of GFP by clones 5, 6, and 18 with varied culture passaging conditionsFigure 4
Repression of GFP by clones 5, 6, and 18 with varied culture passaging conditions. (a) Fraction of cells with high GFP fluorescence. (b) Natural log of the
fraction, where the dotted line is fit by linear regression. When passaging cultures daily, different fractions of culture were retained: one-half (diamonds),
one-third (squares), one-quarter (triangles), one-fifth (circles), or one-sixth (crosses). (c) Repression rates (slope of ln [cell fraction]).
-2.0
-1.5
-1.0
-0.5
0.0
020406080
-5
-4
-3
-2
-1
0
020406080
-2.0
-1.5
-1.0
-0.5
0.0
0 20406080100
0.0
0.2
0.4
0.6
0.8
1.0
020406080
0.0
0.2
0.4
0.6
0.8
1.0
020406080
0.0
0.2
0.4
0.6
0.8
1.0
0 20406080100
Time (days)
Clone 5 Clone 6
Clone 18
ln [Fraction of cells]
(a)
Fraction of cells
(b)
(c)
0.000
0.005
0.010
0.015
0.020
1/2 1/3 1/4
0.00
0.02
0.04
0.06
0.08
1/2 1/3 1/4 1/5
0.000
0.005
0.010
0.015
0.020
1/2 1/3 1/4 1/5 1/6
Culture passaging (fraction retained/day)
Rate (days
-1
)
R47.8 Genome Biology 2006, Volume 7, Issue 6, Article R47 Wang et al. />Genome Biology 2006, 7:R47
frequency of cell division, it is possible that clone 18 stochas-
tically represses GFP in a cell division-dependent manner.
Such a mechanism might be similar to the cell cycle-mediated
silencing that has been reported in yeast [23]. In contrast, for
clone 6 the repression rate of GFP was for the most part unaf-
fected by its splitting schedule and largely independent of
number of cell generations (Figure 4c, middle). Unlike clone
18, the loss of fluorescent cells appeared to depend on time
(days) alone. Because of its good fit to first-order kinetics, the
rate constant for clone 6 is a direct measurement of the prob-
ability of repression. With a rate of 0.04 days
-1
, this meant
that a cell highly expressing GFP had a 1 in 25 chance each day
to become a cell with repressed GFP.
Cis-acting site dependence of repression kinetics
Because the clones differ only by vector integration site (Table
1), it was the location in the genome that uniquely defined the
rate and stability of transgene repression. But were these dif-
ferences due to the local DNA environment? Or, did the inte-
gration event activate or deactivate some other trans-acting
factor that globally affected transgene repression? We re-
infected clones 6 and 18 with the same retroviral vector, but
with GFP replaced by yellow fluorescent protein (YFP) (Fig-
ure 5a). To minimize effects from a single YFP integration
site, we did not expand clones from a single cell; thus, from
one culture, cells expressed YFP from numerous locations
genome-wide. If the GFP integration affected a trans-acting
factor, then that factor would affect the gene repression of
YFP. But since clones 6 and 18 demonstrated little discerna-
ble difference in YFP repression (Figure 5b,c), it is likely that
differences in GFP repression are due to cis-acting factors at
the integration site. The repression of YFP was similar to that
of GFP in clone 18, and the rate of YFP repression for clones
6 and 18 increased as the culture splitting increased. This sug-
gests that it may be the norm for cell generation frequency to
affect the transgene repression and, apparently, the stable
kinetics of GFP repression in clone 6 is unique. Since its ret-
roviral vector was integrated just 6 kb away from Brg1, a chro-
matin remodeling factor that affects transcription [24,25], we
thought BRG1 expression could have been affected by the
nearby integration and thus affect GFP expression. Yet we
could discern no difference in expression of Brg1 protein after
western blotting cell extracts (data not shown; here we prob-
ably would not have been able to distinguish between one and
two alleles' worth of expression).
Methylation and histone deacetylation
Clones 6 and 18 were sorted for cells with repressed GFP - low
and non-detectable populations, respectively. These cells
were grown with two inhibitors of gene repression: azacyti-
dine, which inhibits DNA methylation, and trichostatin A,
which inhibits histone deacetylation. After two days of incu-
bation with azacytidine, in both clones cells emerged that
expressed a high level of GFP (Figure 6a), suggesting that
methylation played a role in the repression of GFP. The
reemergence of unrepressed clone 18 cells also occurred in
the presence of trichostatin A alone (Figure 6b) and in combi-
nation with 5 µM azacytidine (Figure 6c), suggesting that his-
tone deacetylation was also involved in GFP repression. In
contrast, addition of trichostatin A to clone 6 did not yield any
cells expressing a high level of GFP and it actually led to
increased repression when in the presence of 5 µM azacyti-
dine. These different responses of the clones to chemical
inhibitors suggest differences in the mechanism of repression
and further underscore how different mechanisms may be
affected by genomic position. However, because the chemical
inhibitors do not target only the transgene integration sites,
we cannot make conclusions about the exact mechanisms
that directly govern the observed gene repression.
Discussion
We sought and found evidence that gene repression, which
might appear sporadic, can lead to a highly reproducible
outcome. We could demonstrate that the stochastic repres-
sion that accumulates over long periods of time can be
described in terms of a probability. As much of our daily
research involves the practice of cell culturing, we were
Table 2
R-squared correlation coefficients for GFP repression data fit to zero-, first-, or second-order kinetics
Passaging Clone
5618
0th 1st 2nd 0th 1st 2nd 0th 1st 2nd
One-half 0.997 0.980 0.943 0.859 0.996 0.820 0.989 0.981 0.961
One-third 0.955 0.940 0.909 0.876 0.999 0.847 0.962 0.989 0.992
One-quarter 0.883 0.906 0.891 0.861 0.997 0.796 0.972 0.992 0.975
One-fifth 0.871 0.999 0.881 0.966 0.991 0.995
One-sixth 0.934 0.990 0.963
R-squared correlation coefficients for GFP repression data (Figure 4a) fit to zero, first (Figure 4b), or second-order kinetics. Values are shown for
clones 5, 6, and 18, passaged daily with different fractions of culture retained.
Genome Biology 2006, Volume 7, Issue 6, Article R47 Wang et al. R47.9
comment reviews reports refereed researchdeposited research interactions information
Genome Biology 2006, 7:R47
impressed by the fact that a dynamic read-out could be largely
independent of when and how cells were fed over a period of
80 days, and so we assign some importance to this observa-
tion. For a phenotype linked to the timed repression (or acti-
vation) of a single gene, an epigenetically based, stochastic
timer might be well suited to dose the production of secreted
factors, since the effective concentration of this factor
depends on the collective secretion from a population of cells.
Thus, it is possible that such a mechanism could schedule the
dosage of hormones and drive the development of an embryo
or child. Furthermore, because our study was performed
using retroviral constructs, our observations may be immedi-
ately relevant to applications involving transgene expression
with retroviruses, for example, retrovirus-mediated gene
therapy.
In biology, the term 'stochastic' has been used with varying
connotation and degrees of stringency; in all cases it means
that there is an element of probability that is involved in a
decision. If mice from a litter of congenic mice have different
phenotypes, one might say that there is stochastic gene
expression. Stochasticity has also been used to characterize
natural fluctuations (up and down) in gene expression and
this idea of stochasticity falls in line with the idea of an inher-
ent level of 'noise.' Here, we have not studied 'noise', though
no doubt this is also playing a role in our system. In an
attempt to distinguish ourselves terminology-wise, we have
tried to establish the idea of stochastic dynamics.
In conclusion, we investigated a system that behaves with
near perfect first-order decay and by the inherent properties
of a first-order system this strongly established that a sto-
chastic decision was made during the gene repression. We
showed that there can be locations in the genome where the
repression is considerably less sensitive to, and perhaps even
independent of, cell division frequency. We hope that our
study will bolster the idea that in any biological system, as
long as there is no instructional program, feed-back, or cellu-
lar quorum sensing, the observation of first-order gene
repression is indicative of a stochastic mechanism.
Repression of YFP by clones 6 and 18 with varied culture passaging conditionsFigure 5
Repression of YFP by clones 6 and 18 with varied culture passaging conditions. (a) Levels of YFP fluorescence, high, low, and none, were defined by flow
cytometry profiles of untransduced cells (No GFP, No YFP), cells transduced with GFP only, cells transduced with YFP only, and clones 6 and 18
transduced with YFP. (b) Fraction of cells with high YFP fluorescence. X-axis, time in days. When passaging cultures daily, different fractions of culture
were retained: one-half (diamonds), one-third (squares), one-quarter (triangles), one-fifth (circles). (c) Rates of YFP repression for clones 6 (gray) and 18
(white).
10
0
10
1
10
2
10
3
10
4
10
0
10
1
10
2
10
3
10
4
10
0
10
1
10
2
10
3
10
4
10
0
10
1
10
2
10
3
10
4
10
0
10
1
10
2
10
3
10
4
10
0
10
1
10
2
10
3
10
4
10
0
10
1
10
2
10
3
10
4
10
0
10
1
10
2
10
3
10
4
10
0
10
1
10
2
10
3
10
4
10
0
10
1
10
2
10
3
10
4
GFP Clone 6
Clone 18
No GFP
No YFP
(a)
YFP
YFP fluorescence
None
Low
High
None
Low
High
None
Low
High
None
Low
High
None
Low
High
GFP fluorescence
0.0
0.2
0.4
0.6
0.8
0 15304560
0.0
0.2
0.4
0.6
0.8
0 15304560
0.000
0.005
0.010
0.015
0.020
0.025
1/2 1/3 1/4 1/5
Culture passaging
(fraction retained/day)
Rate (days
-1
)
Time (days)
Fraction of cells
(b)
(c)
Clone 6
Clone 18
R47.10 Genome Biology 2006, Volume 7, Issue 6, Article R47 Wang et al. />Genome Biology 2006, 7:R47
Materials and methods
Vector construction
Constructs were based on the MoMLV retroviral vector con-
tained in p102.21 (kindly provided by JB Lorens, Rigel
Pharma, South San Francisco, USA). They contain enhanced
green fluorescent protein (EGFP; Clontech, Mountatin View,
CA, USA), or enhanced yellow fluorescence protein (EYFP;
Clontech), followed by an internal ribosome entry site (IRES)
and puromycin resistance gene. In plasmid pGFP-Eµ-IRES-
Puro, EGFP was followed by the mouse Ig µ intron sequence,
defined by a 1-kb Xba I fragment from the major intron. Plas-
mid pGFP-IRES-Puro contained no Ig enhancers.
Cell culture
Retroviral vectors were packaged using PhoenixEco cells
(ATCC SD 3444), and 18-81 mouse cells were infected with
the vectors. All cultures were grown at 37°C and 5% CO2 in
RPMI 1640 media with 10% fetal calf serum. Cells expressing
GFP were isolated by FACS and clones were expanded from
single cells. When used for expanding clones and monitoring
gene repression, culture medium contained no puromycin.
When selection was necessary, the medium contained 1.5 µg/
ml puromycin. To vary the number of cell generations per
day, cells were 'split' by different fractions. The passaging
fractions and volumes (ml) in terms of culture plus pre-
warmed fresh medium are: one-half, 1.5 + 1.5; one-third, 1.0
+ 2.0; one-quarter, 0.75 + 2.25; one-fifth, 0.6 + 2.4; one-
sixth, 0.5 + 2.5. In experiments where the fraction is not
noted, cells were split by one-third. Cultures were split at the
same time each day. Under these conditions, all cultures
attained a saturation concentration of approximately 3 × 10
6
cells/ml after one day. GFP expression was measured by flow
cytometry, and for all analyses the relative fluorescence of
cells without GFP was set to 3.0. Each flow cytometry meas-
urement consisted of data from at least 5 × 10
3
cells. The
inhibitors of gene repression, azacytidine and trichostatin A,
were added to the cultures in concentrations up to 100 µM
and 10 nM, respectively.
DNA sequencing
DNA from cells was isolated, and the GFP genes were PCR-
amplified using Pfu polymerase (Stratagene, La Jolla, CA,
USA). The PCR products were incubated with Taq polymer-
ase to add deoxyadenosine overhangs and then cloned into
pCR2.1-TOPO (Invitrogen, Carlsbad, CA, USA). The plasmids
were then amplified in E. coli and sequenced.
Quantitative RT-PCR
Expression of GFP and mouse beta-actin was measured using
quantitative RT-PCR. RNA was extracted from cells and
cDNA produced by standard application of reverse tran-
scriptase and random hexamer primers. PCR was performed
using the ABI PRISM
®
7700 machine (Applied Biosystems,
Foster City, CA, USA). GFP expression was normalized to the
amount of expressed mouse beta-actin. Primers and probes
were as follows: GFP, 5'-CCACATGAAGCAGCACGACT-3', 5'-
TGCGCTCCTGGACGTAGC-3', 5'- [6-FAM]-TTCAAGTC-
CGCCATGCCCGAA- [TAMRA]-3'; beta-actin, 5'-AGGTCAT-
CACTATTGGCAACGA-3', 5'-CACTTCATGATGGAATTGA-
ATGTAGTT-3', 5'- [6-FAM]-TGCCACAGGATTCCATAC-
CCAAGAAGG- [TAMRA]-3'.
Identification of reporter integration sites
Integration sites of the vectors were PCR-amplified using Taq
polymerase. The first amplification step of the PCR used a
biotinylated primer homologous to the vector and a non-spe-
Inhibition of repression by azacytidine (AzaC) and trichostatin A (TSA) in clones 6 and 18Figure 6
Inhibition of repression by azacytidine (AzaC) and trichostatin A (TSA) in clones 6 and 18. Fraction of clone 6 (filled diamonds) and clone 18 (open
diamonds) cells with high GFP fluorescence after two days in the presence of (a) azacytidine, (b) trichostatin A, and (c) 5 µM azacytidine plus trichostatin
A.
0.000
0.002
0.004
0.006
0.008
2
0 6
4 10
8
0.003
0.006
0.009
0.012
0.015
0.000
20
0 60
40 100
80
0.001
0.002
0.003
0.004
0.005
0.000
20
0
60
40
100
80
AzaC (µM)
Fraction ‘High’ GFP
TSA (nM) TSA (nM)
+5 µM AzaC
(a) (b) (c)
Genome Biology 2006, Volume 7, Issue 6, Article R47 Wang et al. R47.11
comment reviews reports refereed researchdeposited research interactions information
Genome Biology 2006, 7:R47
cific primer, degenerate at the 3' end and constant at the 5'
end. Biotinylated PCR product was recovered by use of
streptavidin-coupled magnetic beads (Invitrogen). The
genomic DNA flanking the 3' long terminal repeat (LTR) of
the provirus was then amplified from the biotinylated PCR
product. This secondary PCR utilized a nested LTR-specific
primer and a primer homologous to the constant section of
the non-specific primer of the first PCR. PCR products were
cloned into pCR2.1-TOPO, amplified in E. coli, and then
sequenced. The final PCR product contained the virus-
genome junction and the junction sequence was verified for
each integration site.
Additional data files
The following additional data are available with the online
version of this paper. Additional data file 1 is a movie of GFP
fluorescence of clone 5 over 84 days. Additional data file 2 is
a movie of GFP fluorescence of clone 6 over 84 days. Addi-
tional data file 3 is a movie of GFP fluorescence of clone 18
over 84 days. Additional data file 4 contains additional flow
cytometry data. Expression of GFP fluorescence as profiled by
flow cytometry in clones 25 to 96. Clones 25 to 48 and 73 to
96 were transduced with GFP plus an adjacent Ig enhancer.
Clones 1 to 24 (Figure 1b) and 49 to 72 were transduced with
GFP without an Ig enhancer (Figure 1a). X-axis, relative fluo-
rescence; Z-axis, normalized cell number; Y-axis, clones 25 to
39, (from front to back) after 13, 22, 32, and 42 days in cul-
ture; clones 40 to 48, after 22, 32, and 42 days; clones 49 to
96, after 13, 22, and 32 days; upper left corners show the clone
identification number followed by the fraction of the popula-
tion with fluorescence less than 100 after 32 days.
Additional File 1Movie of GFP fluorescence of clone 5 over 84 daysMovie of GFP fluorescence of clone 5 over 84 days.Click here for fileAdditional File 2Movie of GFP fluorescence of clone 6 over 84 daysMovie of GFP fluorescence of clone 6 over 84 days.Click here for fileAdditional File 3Movie of GFP fluorescence of clone 18 over 84 daysMovie of GFP fluorescence of clone 18 over 84 days.Click here for fileAdditional File 4Additional flow cytometry dataExpression of GFP fluorescence as profiled by flow cytometry in clones 25 to 96. Clones 25 to 48 and 73 to 96 were transduced with GFP plus an adjacent Ig enhancer. Clones 1 to 24 (Figure 1b) and 49 to 72 were transduced with GFP without an Ig enhancer (Figure 1a). X-axis, relative fluorescence; Z-axis, normalized cell number; Y-axis, clones 25 to 39, (from front to back) after 13, 22, 32, and 42 days in culture; clones 40 to 48, after 22, 32, and 42 days; clones 49 to 96, after 13, 22, and 32 days; upper left corners show the clone identification number followed by the fraction of the population with fluorescence less than 100 after 32 days.Click here for file
Acknowledgements
We thank Bruce Wang (Picobella Co.) for assistance in characterizing inte-
gration sites, and Frank Stahl, Dave Reichmuth and Sridharan Raghavan for
thoughtful discussion. This study was supported by a grant (AG20684) from
the National Institutes of Health. C.L.W. was supported by the NIH Immu-
nology Training Grant (NIH/NIAID T32 AI07334).
References
1. Elowitz MB, Levine AJ, Siggia ED, Swain PS: Stochastic gene
expression in a single cell. Science 2002, 297:1183-1186.
2. Raser JM, O'Shea EK: Control of stochasticity in eukaryotic
gene expression. Science 2004, 304:1811-1814.
3. Sussel L, Vannier D, Shore D: Epigenetic switching of transcrip-
tional states: cis- and trans-acting factors affecting establish-
ment of silencing at the HMR locus in Saccharomyces
cerevisiae. Mol Cell Biol 1993, 13:3919-3928.
4. Serizawa S, Miyamichi K, Nakatani H, Suzuki M, Saito M, Yoshihara Y,
Sakano H: Negative feedback regulation ensures the one
receptor-one olfactory neuron rule in mouse. Science 2003,
302:2088-2094.
5. Leung RK, Thomson K, Gallimore A, Jones E, Van den Broek M,
Sierro S, Alsheikhly AR, McMichael A, Rahemtulla A: Deletion of the
CD4 silencer element supports a stochastic mechanism of
thymocyte lineage commitment. Nat Immunol 2001,
2:1167-1173.
6. Nadel B, Cazenave PA, Sanchez P: Murine lambda gene rear-
rangements: the stochastic model prevails over the ordered
model. EMBO J 1990, 9:435-440.
7. Coleclough C, Perry RP, Karjalainen K, Weigert M: Aberrant rear-
rangements contribute significantly to the allelic exclusion of
immunoglobulin gene expression. Nature 1981, 290:372-378.
8. Ronai D, Berru M, Shulman MJ: The epigenetic stability of the
locus control region-deficient IgH locus in mouse hybridoma
cells is a clonally varying, heritable feature. Genetics 2004,
167:411-421.
9. Ronai D, Berru M, Shulman MJ: Positive and negative transcrip-
tional states of a variegating immunoglobulin heavy chain
(IgH) locus are maintained by a cis-acting epigenetic
mechanism. J Immunol 2002, 169:6919-6927.
10. Ronai D, Berru M, Shulman MJ: Variegated expression of the
endogenous immunoglobulin heavy-chain gene in the
absence of the intronic locus control region. Mol Cell Biol 1999,
19:7031-7040.
11. Walters MC, Fiering S, Eidemiller J, Magis W, Groudine M, Martin DI:
Enhancers increase the probability but not the level of gene
expression. Proc Natl Acad Sci USA 1995, 92:7125-7129.
12. Walters MC, Magis W, Fiering S, Eidemiller J, Scalzo D, Groudine M,
Martin DI: Transcriptional enhancers act in cis to suppress
position-effect variegation. Genes Dev 1996, 10:185-195.
13. Weinberger LS, Burnett JC, Toettcher JE, Arkin AP, Schaffer DV:
Stochastic gene expression in a lentiviral positive-feedback
loop: HIV-1 Tat fluctuations drive phenotypic diversity. Cell
2005, 122:169-182.
14. Arkin A, Ross J, McAdams HH: Stochastic kinetic analysis of
developmental pathway bifurcation in phage lambda-
infected Escherichia coli cells. Genetics 1998, 149:1633-1648.
15. McAdams HH, Arkin A: Stochastic mechanisms in gene
expression. Proc Natl Acad Sci USA 1997, 94:814-819.
16. Carrier TA, Keasling JD: Investigating autocatalytic gene
expression systems through mechanistic modeling. J Theor
Biol 1999, 201:25-36.
17. Kuznetsov VA, Knott GD, Bonner RF: General statistics of sto-
chastic process of gene expression in eukaryotic cells. Genet-
ics 2002, 161:1321-1332.
18. Cook DL, Gerber AN, Tapscott SJ: Modeling stochastic gene
expression: implications for haploinsufficiency. Proc Natl Acad
Sci USA 1998, 95:15641-15646.
19. Wabl M, Burrows PD, von Gabain A, Steinberg C: Hypermutation
at the immunoglobulin heavy chain locus in a pre-B-cell line.
Proc Natl Acad Sci USA 1985, 82:479-482.
20. Peters A, Storb U: Somatic hypermutation of immunoglobulin
genes is linked to transcription initiation. Immunity 1996,
4:57-65.
21. Wang CL, Harper RA, Wabl M: Genome-wide somatic
hypermutation. Proc Natl Acad Sci USA 2004, 101:7352-7356.
22. Wang CL, Wabl M: Hypermutation rate normalized by chron-
ological time. J Immunol 2005, 174:5650-5654.
23. Lau A, Blitzblau H, Bell SP: Cell-cycle control of the establish-
ment of mating-type silencing in S. cerevisiae. Genes Dev 2002,
16:2935-2945.
24. Fryer CJ, Archer TK: Chromatin remodelling by the glucocor-
ticoid receptor requires the BRG1 complex. Nature 1998,
393:88-91.
25. Huang M, Qian F, Hu Y, Ang C, Li Z, Wen Z: Chromatin-remod-
elling factor BRG1 selectively activates a subset of inter-
feron-alpha-inducible genes. Nat Cell Biol 2002, 4:774-781.