Báo cáo y học: "Signatures of human regulatory T cells: an encounter with old friends and new" pdf
Bạn đang xem bản rút gọn của tài liệu. Xem và tải ngay bản đầy đủ của tài liệu tại đây (980.87 KB, 18 trang )
Genome Biology 2006, 7:R54
comment reviews reports deposited research refereed research interactions information
Open Access
2006Pfoertneret al.Volume 7, Issue 7, Article R54
Research
Signatures of human regulatory T cells: an encounter with old
friends and new players
Susanne Pfoertner
*
, Andreas Jeron
*
, Michael Probst-Kepper
†
,
Carlos A Guzman
‡
, Wiebke Hansen
*
, Astrid M Westendorf
*
, Tanja Toepfer
*
,
Andres J Schrader
§
, Anke Franzke
¶
, Jan Buer
*¥
and Robert Geffers
*
Addresses:
*
Department of Mucosal Immunity, German Research Centre for Biotechnology, Braunschweig, Germany.
†
Volkswagen Foundation
Junior Research Group, Department of Visceral and Transplant Surgery, Hanover Medical School, Hanover, Germany.
‡
Department of
Vaccinology, German Research Centre for Biotechnology, Braunschweig, Germany.
§
Department of Urology, Philipps-University Medical
School, Marburg, Germany.
¶
Department of Hematology and Oncology, Hanover Medical School, Hanover, Germany.
¥
Institute of Medical
Microbiology, Hanover Medical School, Hanover, Germany.
Correspondence: Jan Buer. Email:
© 2006 Pfoertner et al.; licensee BioMed Central Ltd.
This is an open access article distributed under the terms of the Creative Commons Attribution License ( which
permits unrestricted use, distribution, and reproduction in any medium, provided the original work is properly cited.
T regulatory cell signatures<p>Comparison of the gene expression in human T regulatory cells and naïve cells using a T regulatory cell-specific microarray reveals cell-specific gene signatures.</p>
Abstract
Background: Naturally occurring CD4
+
CD25
+
regulatory T cells (T
Reg
) are involved in the
control of autoimmune diseases, transplantation tolerance, and anti-tumor immunity. Thus far,
genomic studies on T
Reg
cells were restricted to murine systems, and requirements for their
development, maintenance, and mode of action in humans are poorly defined.
Results: To improve characterization of human T
Reg
cells, we compiled a unique microarray
consisting of 350 T
Reg
cell associated genes (Human T
Reg
Chip) based on whole genome
transcription data from human and mouse T
Reg
cells. T
Reg
cell specific gene signatures were created
from 11 individual healthy donors. Statistical analysis identified 62 genes differentially expressed in
T
Reg
cells, emphasizing some cross-species differences between mice and humans. Among them,
several 'old friends' (including FOXP3, CTLA4, and CCR7) that are known to be involved in T
Reg
cell
function were recovered. Strikingly, the vast majority of genes identified had not previously been
associated with human T
Reg
cells (including LGALS3, TIAF1, and TRAF1). Most of these 'new players'
however, have been described in the pathogenesis of autoimmunity. Real-time RT-PCR of selected
genes validated our microarray results. Pathway analysis was applied to extract signaling modules
underlying human T
Reg
cell function.
Conclusion: The comprehensive set of genes reported here provides a defined starting point to
unravel the unique characteristics of human T
Reg
cells. The Human T
Reg
Chip constructed and
validated here is available to the scientific community and is a useful tool with which to study the
molecular mechanisms that orchestrate T
Reg
cells under physiologic and diseased conditions.
Published: 12 July 2006
Genome Biology 2006, 7:R54 (doi:10.1186/gb-2006-7-7-r54)
Received: 6 March 2006
Revised: 16 May 2006
Accepted: 2 June 2006
The electronic version of this article is the complete one and can be
found online at />R54.2 Genome Biology 2006, Volume 7, Issue 7, Article R54 Pfoertner et al. />Genome Biology 2006, 7:R54
Background
One of the most striking capacities of the immune system is
its ability to discriminate between self and non-self, thereby
avoiding autoimmune responses while allowing effective
immunity against infections. Several mechanisms to main-
tain tolerance and immune homeostasis have evolved. On the
one hand, self-reactive T cells are deleted during their devel-
opment in the thymus in a process known as central toler-
ance. However, because this negative selection is incomplete,
self-reactive T cells that have escaped from this clonal dele-
tion must be controlled in the periphery. T
Reg
cells actively
suppress activation and expansion of self-reactive escapees as
part of a process termed peripheral tolerance [1]. Thus, T
Reg
cells control the delicate balance between immunity and tol-
erance, explaining their important role in autoimmune dis-
eases, cancer, transplantation tolerance, and even allergy.
Several types of T
Reg
cells exist. Naturally occurring T
Reg
cells
express the cell surface molecule CD25 (IL2RA) [2] and the
transcriptional repressor FOXP3 (forkhead box P3), which is
central for their development and function. These cells
mature and migrate directly from the thymus and constitute
approximately 2-3% of total human CD4
+
T cells [3-5]. Apart
from these naturally occurring thymus-derived T
Reg
cells,
antigen presentation by immature dendritic cells, IL-10,
transforming growth factor-β, and possibly intrerferon-α
possess the capability to convert naïve CD4
+
CD25
-
or
CD8
+
CD25
-
T cells into regulatory T cells in the periphery [6-
9]. These CD4
+
derived adaptive regulatory T cells are subdi-
vided into T regulatory 1 (T
R
1) and T helper 3 (T
h
3) cells,
according to their distinct cytokine profiles [10,11].
However, isolation of regulatory T cells remains difficult
because the availability of specific marker molecules is still
limited. Apart from CD25, additional surface molecules have
been reported to be associated with T
Reg
cell function, such as
cytotoxic T lymphocyte associated antigen (CTLA)4 [12],
tumor necrosis factor receptor superfamily (TNFRSF) mem-
ber 18 (or GITR) [13], and selectin L (SELL or CD62L) [14].
However, all of these molecules are also expressed by naïve
CD4
+
CD25
-
T cells upon activation, thereby hampering dis-
crimination between regulatory and conventionally activated
CD4
+
T cells. Furthermore, CD25 as well as other T
Reg
cell
molecules (for instance, GITR and CTLA4) are not expressed
on all CD4
+
T cells with regulatory function [15]. Recently,
new genes such as neuropillin 1 (Nrp1) for mouse and CD27
coexpression with CD25 for human were suggested as useful
markers to distinguish regulatory from effector T cells [16,17].
Like murine cells, human CD4
+
CD25
+
T
Reg
cells express sig-
nificantly more FOXP3 mRNA and protein than do
CD4
+
CD25
-
T cells. However, in contrast to data obtained
from mouse models, overexpression of FOXP3 in human
CD4
+
CD25
-
T cells alone is insufficient to generate potent
suppressor T cells in vitro, suggesting that additional factors
are required for the development, differentiation, and func-
tion of human T
Reg
cells [18].
Microarrays have illustrated their potential to unravel gene
expression of various subsets of leukocytes. We and others
have successfully used this technology to create signatures of
murine regulatory T cells in different mouse models, contrib-
uting to a better understanding of the mechanisms underly-
ing T
Reg
cell mediated tolerance and autoimmunity
[16,19,20]. Thus far these genomic studies on T
Reg
cells have
been restricted to murine systems. However, differences
between humans and mice are highly suggestive and may
present obstacles in the transfer from mouse models to actual
human disease [21]. In this report we extend this approach to
the characterization of human T
Reg
cells by studying 350 T
Reg
cell associated genes selected on the basis of whole-genome
transcription data from human and mouse T
Reg
cells. Applica-
tion of our nonredundant Human T
Reg
Chip to the study of
highly purified CD4
+
CD25
+
T
Reg
cells and their naïve
CD4
+
CD25
-
counterparts isolated from peripheral blood of
individual healthy donors revealed the presence of T
Reg
cell
specific gene signatures. Combined with extensive pathway
analysis, we provide a comprehensive set of genes to unravel
the unique characteristics of human T
Reg
cells under physio-
logical and diseased conditions.
Results and discussion
Development and validation of the Human T
Reg
Chip
Whole-genome expression data from human and mouse
CD4
+
CD25
+
and CD4
+
CD25
-
T cells, obtained using Affyme-
trix GeneChips (Affymetrix, Santa Clara, CA, USA), at the
genomic scale were used to compile a primary list of genes
involved in T
Reg
cell function. CD4
+
T cell subsets were iso-
lated from either human peripheral blood or murine spleno-
cytes and separated using FACS (fluorescence-activated cell
sorting)-based cell sorting at purities consistently greater
than 98%. Differential gene expression was determined using
statistical parameters, as described under Material and meth-
ods, below. (For more detailed information, See Additional
data file 1).
This primary data set from human T
Reg
cells was extended for
genes that were affected by FOXP3 overexpression in cul-
tured human CD4
+
T
h
cell lines. To this end, different
CD4
+
CD25
-
derived T
h
cell lines were generated by infection
with retroviruses encoding for FOXP3 and GFP (green fluo-
rescence protein) under the control of an internal ribosomal
entry side (IRES) or with an empty control vector that con-
tained only GFP. In these cells only FOXP3 overexpression
could partially induce a T
Reg
phenotype in vitro (data not
shown). Using Affymetrix GeneChips, these genetically engi-
neered cells were compared with cells infected with T
h
GFP
control vector. In addition, we also analyzed a human T
Reg
cell
line derived from human CD4
+
CD25
+
T cells that maintained
a regulatory phenotype in vitro and compared its gene
expression profile with the control CD4
+
T
h
cell line. For the
development of the Human T
Reg
Chip we included those genes
in our primary data set that were differentially expressed in
Genome Biology 2006, Volume 7, Issue 7, Article R54 Pfoertner et al. R54.3
comment reviews reports refereed researchdeposited research interactions information
Genome Biology 2006, 7:R54
both experiments by more than twofold. (For more detailed
information, see Additional data file 2).
In additionally, T
Reg
cell associated genes identified by litera-
ture search were also included (Additional data file 3). In
summary, this resulted in the selection of 350 genes that were
arranged on an oligonucleotide microarray. Furthermore, 45
control genes were included in the primary microarray
design.
To obtain accurate and reliable transcription profiles, we val-
idated the Human T
Reg
Chip in terms of cross-platform com-
parability, sensitivity, and reproducibility of measurements.
Relative expression data gained from the experiments inves-
tigating FOXP3 affected gene expression on Affymetrix Gene-
Chips, as described above, were used as reference data in a
cross-platform evaluation. Therefore, identical samples,
obtained either from FOXP3 infected CD4
+
CD25
-
T cells or
GFP expressing controls, were also hybridized to the Human
T
Reg
Chip. Concordance of significantly regulated genes gen-
erated with the Human T
Reg
Chip and the reference data was
81% (29/36; Figure 1a). Opposite regulation was observed
only for a few marginally regulated genes (7/36). The Affyme-
trix GeneChip data for the 350 genes included in the Human
T
Reg
Chip is given in Additional data file 4). Furthermore, bac-
terial control genes at different concentrations were used to
monitor microarray system sensitivity and the spectrum of
linear signal measurement. A final concentration of 0.3
pmol/l was detectable, corresponding to approximately one
transcript in 500,000 or approximately one copy per cell.
Furthermore, we could demonstrate a linear regression
between signal intensity and concentration covering more
than three orders of magnitude (Figure 1b). To assess repro-
ducibility, identical samples were applied to different Human
T
Reg
Chips and signal intensities were compared among each
other (Figure 1c). The median correlation coefficient obtained
from 52 log-log-plots was 0.98, which is well in line with com-
mercially available microarray formats [22,23] Finally, we
determined the accuracy of measurements expressed as coef-
ficient of variance calculated across eight replicates per gene.
As depicted in Figure 1d, the vast majority of signal intensities
(73%) calculated for the entire data set varied by less than
30%, reflecting the robustness of the applied microarray
approach.
Gene regulation in CD4
+
CD25
+
T
Reg
cells
To obtain accurate and reliable individual transcription pro-
files we isolated CD4
+
CD25
+
regulatory and CD4
+
CD25
-
naïve
T cells from peripheral blood of 11 healthy donors using
MACS (Magnetic Cell Sorting) technology (Table 1). To esti-
mate the fraction of T
Reg
cells in the CD4
+
CD25
+
cell popula-
tion, we performed intracellular FOXP3 staining.
Approximately 80% of the CD4
+
CD25
+
T cells were FOXP3
positive and exhibited regulatory T cell function in vitro
(Additional data file 5). Each sample was measured in at least
two independent microarray experiments. Using Statistical
Analysis of Microarrays (SAM) analysis, we identified 62
genes significantly differentially expressed in regulatory com-
pared to naïve T cells. Based on Gene Ontology and references
in the literature, genes were classified into functional catego-
ries such as cytokines/chemokines and their receptors (12
genes), cell cycle and proliferation (11), apoptosis (7), signal
transduction (9), and transcriptional regulation (10). A
detailed description of these genes is summarized in Table 2.
Among them, LGALS3, CCR7, IL2RA (CD25), CTLA4,
TRAF1, SATB1, and GZMK were additionally found to be
affected by retroviral overexpression of FOXP3 in CD4
+
T
h
cells (Figure 1a).
Two-dimensional hierarchical clustering analysis was applied
to arrange coexpressed genes and replicated experiments
next to each other (Figure 2). The transcriptional pattern
clearly separated CD4
+
CD25
+
regulatory from CD4
+
CD25
-
naïve T cells and distinguished between 32 upregulated and
30 downregulated genes.
Twenty-one of these 62 genes have already been described in
the literature as being associated with T
Reg
cells of both mouse
and human origin, including FOXP3, CTLA4, IL2RA (CD25),
and ITGB2 (Figure 3). Recovery of these 'old friends' con-
firmed our nonredundant microarray approach, including
our cell separation strategy. Among the 62 genes, eight that
were previously only implicated in murine T
Reg
cell biology
were also detected as being differentially expressed in human
T
Reg
cells (LGALS1, IL7R, GATA3, SATB1, TNFRSF1B,
TNSF5, DGKA, and CCR5). Altogether, 15 genes were identi-
fied that were similarly regulated in mouse and human. Those
genes at the intersection of both organisms reflect high levels
of interspecies conservation during the evolutionary process,
thereby lending credibility to their important role in T
Reg
cell
development and function (Figure 3). In addition to FOXP3,
CTLA4 and IL2RA, we also found the chemokine receptor 7
(CCR7), the transferring receptor (TFRC) and integrin beta 2
(ITGB2) genes in this intersection group between mouse and
Table 1
Characteristics of healthy volunteers
Donor Age Sex
A58Male
B57Female
C27Female
D27Female
E36Male
F39Male
G39Male
H26Female
I62Female
J54Female
K26Male
R54.4 Genome Biology 2006, Volume 7, Issue 7, Article R54 Pfoertner et al. />Genome Biology 2006, 7:R54
human. Furthermore, six genes previously associated with
human T
Reg
cells were identified. Apart from the 'old friends',
we identified 41 'new players' that have not previously been
reported in the context of human T
Reg
cells (Figure 3).
To verify the accuracy of our microarray data in more detail,
real-time RT-PCR (reverse transcription polymerase chain
reaction) was performed using the original samples. Refer-
ring to well characterized T
Reg
cell genes (FOXP3, CTLA4, and
CCR7), we were able to confirm our approach (Figure 4). This
gave greater credence and reliability to the numerous addi-
tional genes that have not yet been reported in T
Reg
cells. We
selected three of these 'new players' (TNFRSF1B, TRAF1,
LGALS3) and confirmed their T
Reg
cell specific expression by
quantitative real-time RT-PCR (Figure 5). As shown, in gen-
eral PCR results correlated well with the differential gene
expression data obtained by application of the Human T
Reg
Chip. For a few donors variability in gene expression was
observed between microarray and quantitative RT-PCR data,
but the direction of change was consistent, lending confi-
dence to the reliability of the Human T
Reg
Chip results. Quan-
titative differences in fold changes have previously been
described; in particular, an underestimation of real expres-
sion changes by microarray approach versus quantitative RT-
PCR has been reported [24,25].
Signaling modules in T
Reg
cells
To elucidate potential pathway modules implicated in T
Reg
cell biology, we applied PathwayAssist, (Ariadne Genomics,
Rockville, MD, USA), software to our unique expression data-
set of human T
Reg
cells from individual healthy donors. Map-
ping the 62 T
Reg
cell specific genes yielded a network of 31
genes directly interacting with each other (data not shown).
These 31 genes provided a comprehensive framework for
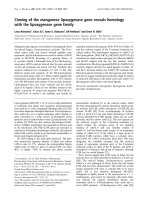
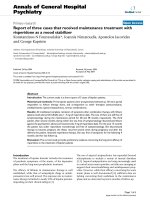
Performance of the Human T
Reg
ChipFigure 1
Performance of the Human T
Reg
Chip. (a) Comparability to Affymetrix. Splitted samples (FOXP3 or GFP transfected T cells) were hybridized to Affymetrix
HG_U133A microarrays and Human T
Reg
Chips, respectively. Differentially expressed genes on the Affymetrix platform (regulation of at least 1.5-fold
based on significant signal) were compared with those significant fold changes arising from the Human T
Reg
Chip platform. As demonstrated, 29 out of 36
genes exhibited similar regulation on the Human T
Reg
Chip compared with Affymetrix, resulting in a correlation of 81%. (b) Hybridization controls.
Normalized signal intensities versus concentration of used hybridization controls are plotted as means of 5 (1.5 pmol/l, 25 pmol/l and 100 pmol/l) and 59
experiments applying the Human T
Reg
Chip. Standard deviations are indicated by error bars. Linear regression yields a correlation coefficient of >0.96
demonstrating a linear hybridization process covering more than three orders of magnitude of concentrations. (c) Reproducibility of the Human T
Reg
Chip.
The same sample was hybridized to several Human T
Reg
Chips. A log-log plot of normalized signal intensities of two example selected slides is illustrated,
showing that 99.7% of all signals are located along the bisecting line within the twofold range, reflecting low measurement noise in the data, even for low
signal intensities. (d) Coefficients of variation (CV). The ratios of standard deviation and mean were calculated for each gene probed in eight replicates per
microarray. CVs of all 59 experiments applying the Human T
Reg
Chip contributing to the expression profile of human T
Reg
cells are presented as means. As
demonstrated, 73% of all signals have a CV below 0.3.
R
2
= 0.9649
0.1
1
10
100
0.1 1 10 100
concentration [pM]
normalized signal intensity [I]
-6
-4
-2
0
2
4
6
FOXP3
LTA
CCR7
CTSZ
LGALS3
CD7
HPGD
ICOS
VCAM1
IL2RA
MAN1C1
FHIT
TBX2
HSPA1B
TNFRSF1B
CCR4
GPR48
CTLA4
PIM2
TRAF1
RASA3
TOP2A
CST7
STOM
PRF1
SATB1
CXCR3
BUB1
GZMB
MYBL1
CCL4
TRGV9
SLC22A5
NELL2
IL7R
GZMK
fold changes (Foxp3 versus GFP)
Affymetrix' HG_U133A
Human TReg Chip
39%
24%
11%
26%
CV < 0.1
0.1 < CV < 0.2
0.2 < CV < 0.3
CV > 0.3
(a)
(b)
0.001
0.01
0.1
1
10
100
0.001 0.01 0.1 1 10 100
signal intensities [I] of Human T
Reg
Chip #1
signal intensities [I] of Human T
Reg
Chip #2
TReg cell specific genes
control genes
T
Reg
cell specific genes
R² = 0.9919
(c)
(d)
Genome Biology 2006, Volume 7, Issue 7, Article R54 Pfoertner et al. R54.5
comment reviews reports refereed researchdeposited research interactions information
Genome Biology 2006, 7:R54
Table 2
Genes differentially expressed in human CD4
+
CD25
+
regulatory vs CD4
+
CD25
-
naive T cells
Gene symbol Gene name Autoimmunity
NINJ2 Ninjurin 2
ACTN1 Actinin, alpha 1 SLE, CHA
NELL2 NEL-like 2
ITGB2 Integrin, β
2
UC, MC, COPD, T2D, AS, LAD-1, RA, ALPS, SLE
TIAF1 TGFB1-induced antiapoptotic factor 1
TP53INP1 Tumor protein p53 inducible nuclear protein 1
TRAF1
a
TNF receptor-associated factor 1
LGALS1 Galectin 1 JIA, RA, IBD
LGALS3
a
Galectin 3 RA, JIA
GZMA Granzyme A T1D, RA, SLE, IBD
GZMK Granzyme K
PTTG1 Pituitary tumor-transforming 1 Diabetes
TRIB1 Tribbles homolog 1
S100A10 S100 calcium binding protein A10
CEB1 Hect domain and RLD 5
SLAMF1 Signaling lymphocytic activation molecule family member 1 SLE, X-linked XLP, RA, MS
S100A4 S100 calcium binding protein A4 RA
PIM1 Pim-1 oncogene
ID2 Inhibitor of DNA binding 2 Diabetes
FHIT Fragile hisT1Dine triad gene
RBMS1 RNA binding motif, single stranded interacting protein 1
IFITM1 Interferon induced transmembrane protein 1
IL2RA
a
Interleukin 2 receptor, alpha T1D, profound cellular immunodefiency
TNFRSF1B
a
Tumor necrosis factor receptor superfamily, member 1B MC, UC, MS, SLE
CCR5 Chemokine (C-C motif) receptor 5 MS, Grave's disease, RA
GPR2 Chemokine (C-C motif) receptor 10 Autoimmune skin diseases
IL2RB Interleukin 2 receptor, beta ITP, RA, osteoarthritis, hemolytic anemia
G1P2 Interferon, alpha-inducible protein
IL1RL2 Interleukin 1 receptor-like 2
IL7R Interleukin 7 receptor SCID, RA, SLE
CCR7
a
Chemokine (C-C motif) receptor 7 Diabetes, SLE, MS, RA, JIA
TNFSF5 CD40 ligand (TNF superfamily, member 5, hyper-IgM syndrome) HIGM1, Alzheimer disease, T1D, SLE, MS, AS, ITP
CCL5 Chemokine (C-C motif) ligand 5 EAT, MS, diabetes, SLE, RA
TNFRSF10B Tumor necrosis factor receptor superfamily, member 10b MS, RA
SDC4 Syndecan 4
CTLA4
a
Cytotoxic T-lymphocyte-associated protein 4 T1D, Grave's disease, SLE
TFRC Transferrin receptor
AKAP2 A kinase (PRKA) anchor protein 2
DGKA Diacylglycerol kinase, alpha
PITPNC1 PhosphaT1Dylinositol transfer protein, cytoplasmic 1
TRGV9 T cell receptor gamma variable 9
CD81 CD81 antigen
PECAM1 Platelet/endothelial cell adhesion molecule ITP, diabetes, AS, RA, CIA, MS
FOXP3 Forkhead box P3 IPEX, T1D
GATA3 GATA binding protein 3 RA, HDR syndrome
BHLHB2 Basic helix-loop-helix domain containing, class B, 2 SLE
SATB1 Special AT-rich sequence binding protein 1
STAT4 Signal transducer and activator of transcription 4 MC, EAE, UC, diabetes, COPD, SLE, arthritis
R54.6 Genome Biology 2006, Volume 7, Issue 7, Article R54 Pfoertner et al. />Genome Biology 2006, 7:R54
further dissection into functional modules. These modules
point to mechanisms controlling diverse cellular processes
such as survival/apoptosis, T cell receptor signaling/activa-
tion/proliferation, and differentiation/maintenance of
human T
Reg
cells and are described in the following text.
Genes controlling survival/apoptosis of T
Reg
cells
Naturally occurring T
Reg
cells survive clonal deletion during
their development in the thymus by escape from activation-
induced cell death. This protective mechanism appears to be
maintained in T
Reg
cells encountered in the periphery because
we could identify a signaling module that counteracts apopto-
sis and mediates the release of survival factors (Figure 6a).
We found that FOXP3 induced upregulation of tumor necro-
sis factor receptor superfamily, member 1B (TNFRSF1B,
TNF-RII) upon retroviral overexpression in CD4
+
T
h
cells
(Figure 1a). TNFRSF1B was also upregulated in the ex vivo
isolated CD4
+
CD25
+
T
Reg
cells from individual healthy donors
(Figure 2). TNFRSF1B belongs to a group of transmembrane
TNF receptor molecules characterized by TNF receptor-asso-
ciated factor (TRAF)-interacting motifs (TIMs). Activation of
TIM-containing TNF receptors leads to the recruitment of
TRAF family members and subsequent activation of signal
transduction pathways such as nuclear factor (NF)-κB, JNK,
p38, ERK (extracellular signal-regulated kinase), and PI3K
(phosphoinositide 3-kinase), which in turn influence immune
responses and increase the expression of survival factors
[26,27]. In accordance, we also found a significant upregula-
tion of TRAF1 inboth FOXP3 transduced CD4
+
T
h
cells and ex
vivo isolated human CD4
+
CD25
+
T
Reg
cells.
This mechanism is linked to additional molecules that control
the nuclear translocation and, consequently, activity of TP53
(tumor protein p53), a tumor suppressor gene that induces
cell growth arrest or apoptosis [28]. Although TIAF1 (TGFB-
1 induced antiapoptotic factor 1) interacts with TP53 in the
cytosol and may participate in its nuclear translocation,
TP53INP1 (TP53 inducible nuclear protein 1) is engaged in
the regulation of TP53 activity in the nucleus [29,30]. Both
TP53INP1 and TIAF1 genes were found to be overexpressed
in the naturally occurring T
Reg
cells in our study. Apart from
this, TIAF1 is known to be upregulated in T
h
2 compared with
T
h
1 lymphocytes, and a functional role as an apoptosis protec-
tor has been discussed [31].
We also identified S100A4 as being upregulated in the natu-
rally occurring T
Reg
cells from our individual donors. S100A4
is a member of the S100 family of proteins containing two EF
hand calcium binding motifs. EF-hands are helix-loop-helix
motifs where the loop potentially binds Ca
2+
. Its expression is
TP53 dependent and S100A4 is involved in the regulation of
cell cycle progression and differentiation. Together with
S100B, S100A4 is hypothesized to control tetramerization of
TP53, leading to its nuclear translocation [32,33]. TP53 can
activate the extrinsic apoptotic pathway through the induc-
tion of TNF receptor family members such as FAS and
TNFRSF10B [28,34]. Both TNF receptors are characterized
by their cytoplasmic death domain, which is responsible for
STAT6 Signal transducer and activator of transcription 6 EAE, RA, autoimmune uveitis, diabetes
MYC v-myc Myelocytomatosis viral oncogene homolog Diabetes, RA, SLE
TCF7 Transcription factor 7 (T-cell specific, HMG-box) T1D
XBP1 X-box binding protein 1 T2D, RA
CNOT2 CCR4-NOT transcription complex, subunit 2
HLA-DMA Major histocompatibility complex, class II, DM alpha T1D, SLE, RA
HLA-DRB1 Major histocompatibility complex, class II, DR beta 1 RA, MS, sarcoidosis, Sjögren's syndrome, Grave's
disease, T1D
HLA-DRB3 Major histocompatibility complex, class II, DR beta 3 SLE, RA, MS, sarcoidosis, Sjögren's syndrome,
Grave's disease
GBP2 Guanylate binding protein 2, interferon-inducible
GBP5 Guanylate binding protein 5
SLC40A1 (a) Solute carrier family 40 (iron-regulated transporter), member 1
SHMT2 (b) Serine hydroxymethyltransferase 2 (mitochondrial)
EPSTI1 Epithelial stromal interaction 1
NOSIP Nitric oxide synthase interacting protein
a
Genes that were additionally found to be induced upon retroviral over-expression of FOXP3 in CD4
+
CD25
-
T cells. ALPS, autoimmune
lymphoproliferative syndrome; AS, atherosclerosis; CHA, autoimmune chronic active hepatitis; CIA, collagen-induced arthritis; COPD, chronic
obstructive pulmonary disease; EAE, experimental autoimmune encephalomyelitis; EAT, experimental autoimmune thyroiditis; HIGM1, hyper-IgM
immunodefiency syndrome type I; IPEX, immunodysregulation, polyendocrinopathy, and entheropathy, X-linked; JIA, juvenile idiopathic arthritis; IBD,
inflammatory bowel disease; ITP, idiopathic thrombocytopenic purpura; LAD-1, leukocyte adhesion deficiency-1; MC, Morbus Crohn; MS, multiple
sclerosis; RA, rheumatoid arthritis; SCID, severe combined immunodefiency; SLE, systemic lupus erythematosus; T1D, type I diabetes; T2D, type II
diabetes; UC, ulcerative colitis; XLP, X-linked lymphoproliferative syndrome.
Table 2 (Continued)
Genes differentially expressed in human CD4
+
CD25
+
regulatory vs CD4
+
CD25
-
naive T cells
Genome Biology 2006, Volume 7, Issue 7, Article R54 Pfoertner et al. R54.7
comment reviews reports refereed researchdeposited research interactions information
Genome Biology 2006, 7:R54
transmission of apoptotic signals. Activation of these recep-
tors leads to recruitment of intracellular death domain, con-
taining adaptors such as FAS-associated death domain
(FADD) and TNFR associated death domain (TRADD). These
molecules activate the caspase cascade and subsequently
induce apoptosis. The death domain clearly separates these
TNF receptors from TNFRSF1B [26]. As a potential conse-
quence of the assumed TP53 inactivation in T
Reg
cells,
TNFRSF10B expression could be impaired.
Further evidence supporting this assumption was provided
by another direct target of TP53. Expression of PTTG1 (pitui-
tary tumor-transforming 1), which we found to be upregu-
lated in our naturally occurring T
Reg
cells, can be directly
repressed by activated TP53 in colorectal cancer cells. RNAi
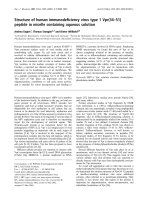
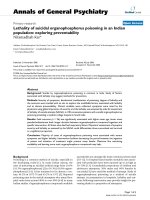
Transcriptional profiling of CD4
+
CD25
+
T
Reg
and CD4
+
CD25
-
naïve T cellsFigure 2
Transcriptional profiling of CD4
+
CD25
+
T
Reg
and CD4
+
CD25
-
naïve T cells. To identify molecular differences between regulatory and naïve human T cells,
differential expression of 350 genes was investigated by application of our Human T
Reg
Chip. Following data normalization, Statistical Analysis of
Microarrays (SAM) was applied as a data mining tool to ascertain gene expression changes, identifying 62 significantly altered genes between both T cell
subpopulations (delta = 2.46, median FDR [false discovery rate] = 0.48). After entering the generated data set into Genesis software, a two-dimensional
hierarchical clustering analysis yielded the displayed transcriptional pattern, which discriminates between human regulatory and naïve T cells, and consists
of 32 upregulated and 30 downregulated genes. Each row represents a gene probed on the Human T
Reg
Chip; each column shows expression of the 62
genes measured for each individual in the study. Red indicates genes that are expressed at higher levels compared with the mean signal intensities of all
experiments, whereas downregulated genes are colored in green and black indicates signal intensities near the mean expression level.
FOXP3
SDC4
NINJ2
PTTG1
TIAF1
TRIB1
S100A10
GBP2
GATA3
IL2RA
BHLHB2
CEB1
CTLA4
TFRC
HLA-DMA
AKAP2
TNFRSF1B
CCR5
GPR2
IL2RB
SHMT2
HLA-DRB1
HLA-DRB3
TP53INP1
GBP5
EPSTI1
LGALS3
SLAMF1
TRAF1
LGALS1
S100A4
G1P2
SATB1
PIM1
ACTN1
STAT4
ID2
NELL2
SLC40A1
IL1RL2
DGKA
ITGB2
STAT6
GZMA
MYC
FHIT
TCF7
IL7R
CCR7
PITPNC1
RBMS1
XBP1
GZMK
TNFSF5
TRGV9
CD81
CNOT2
CCL5
NOSIP
IFITM1
PECAM1
TNFRSF10B
CD4
+
CD25
+
T
Reg
cells CD4
+
CD25
-
naive T cells
donor C, slide 1
donor J, slide 1
donor G, slide 1
donor G, slide 2
donor G, slide 3
donor H, slide 1
donor H, slide 2
donor J, slide 2
donor J, slide 3
donor A, slide 1
donor A, slide 2
donor C, slide 2
donor C, sllide 3
donor F, slide 1
donor F, slide 2
donor F, slide 3
donor E, slide 1
donor E, slide 2
donor E, slide 3
donor I, slide 1
donor B, slide 1
donor B, slide 2
donor I, slide 2
donor I, slide 3
donor D, slide 1
donor D, slide 2
donor D, slide 3
donor K, slide 1
donor K, slide 2
donor H, slide 1
donor H, slide 2
donor G, slide 1
donor G, slide 2
donor G, slide 3
donor F, slide 1
donor F, slide 2
donor F, slide 3
donor D, slide 1
donor D, slide 2
donor D, slide 3
donor J, slide 1
donor J, slide 2
donor J, slide 3
donor A, slide 1
donor A, slide 2
donor C, slide 1
donor B, slide 1
donor B, slide 2
donor B, slide 3
donor I, slide 1
donor I, slide 2
donor I, slide 3
donor C, slide 2
donor C, slide 3
donor E, slide 1
donor E, slide 2
donor K, slide 1
donor K, slide 2
donor K, slide 3
NM_014009
NM_002999
NM_016533
NM_004219
NM_004740
NM_025195
NM_002966
NM_004120
NM_001002295
NM_000417
NM_003670
NM_016323
NM_005214
NM_003234
NM_006120
NM_001004065
NM_001066
NM_000579
NM_016602
NM_000878
NM_005412
NM_002124
NM_022555
NM_033285
NM_052942
NM_001002264
NM_002306
NM_003037
NM_005658
NM_002305
NM_002961
NM_005101
NM_002971
NM_002648
NM_001102
NM_003151
NM_002166
NM_006159
NM_014585
NM_003854
NM_001345
NM_000211
NM_003153
NM_006144
NM_002467
NM_002012
NM_003202
NM_002185
NM_001838
NM_012417
NM_002897
NM_005080
NM_002104
NM_000074
NG_001336
NM_004356
NM_014515
NM_002985
NM_015953
NM_003641
NM_000442
NM_003842
+2.1
+2.1
+2.3
+2.4
+1.4
+2.4
+1.5
+1.7
+1.4
+2.5
+2.4
+1.8
+5.1
+1.9
+1.8
+2.3
+2.5
+2.2
+3.2
+2.7
+2.2
+1.8
+1.8
+2.1
+1.8
+1.9
+3.9
+1.3
+1.7
+1.9
+1.8
+1.4
-1.6
-1.4
-2.1
-1.6
-1.8
-2.0
-1.6
-1.2
-1.3
-1.2
-1.2
-1.6
-1.7
-2.4
-2.4
-2.1
-2.1
-1.9
-2.1
-1.9
-2.9
-2.1
-2.2
-1.4
-1.2
-2.5
-2.5
-1.5
-1.4
-1.2
Gene
symbol
Accession
number
Fold change
CD25
+
/ CD25
-
R54.8 Genome Biology 2006, Volume 7, Issue 7, Article R54 Pfoertner et al. />Genome Biology 2006, 7:R54
mediated knockdown of PTTG1 was sufficient to induce apop-
tosis, suggesting that repression of novel antiapoptotic genes
by active TP53 can significantly contribute to apoptosis [34].
Controversially, it has been reported that PTTG1 can activate
TP53 and BAX to increase apoptotic function, but this seems
to be rather an indirect effect of PTTG1 and is dependent on
other factors, such as MYC, which we found to be downregu-
lated in the naturally occurring human T
Reg
cells [35]. Inter-
estingly, c-MYC is a direct downstream target of PTTG1,
which is part of the DNA-binding complex formed near the
transcription initiation site of the c-MYC promoter [36].
We have detected additional genes that are downregulated in
human T
Reg
cells, affecting the activation status of TP53. In
lung cancer cells, it was shown that FHIT (fragile histidine
triad gene) mediates MDM2 inactivation. The antiapoptotic
molecule MDM2 is activated through the PI3K-AKT pathway,
leading to inactivation of TP53 [37]. Thus, downregulation of
FHIT also contributes to the inactive status of TP53.
Based on our data, we suggest that destabilization and
thereby inactivation of TP53 provokes a shift in T
Reg
cells from
apoptotic sensitivity to protection and survival. It is tempting
to speculate that this mechanism allows T
Reg
cells to survive
upon reactivation, whereas effector T cells underlie activa-
tion-induced cell death. This apoptotic process eliminates the
expanded pool of effector lymphocytes during the contraction
phase of the immune response and maintains lymphocyte
homeostasis. In accordance with our findings, murine T
Reg
cells were reported to be more resistant to apoptosis when
treated with dexamethasone or anti-CD95 antibody than
CD4
+
total or CD4
+
CD25
-
effector T cells [38,39]. Moreover,
Fritzsching [40] and Wang [41] and their groups
demonstrated that human T
Reg
cells are less sensitive to acti-
vation-induced cell death than their naïve counterparts.
Galectin-3 (LGALS3) is one of the best characterized mem-
bers of the evolutionary conserved family of galectins and was
found to be strongly upregulated in our ex vivo isolated T
Reg
cells (Figure 2). In addition, LGALS3 was also induced upon
FOXP3 overexpression in CD4
+
T
h
cells (Figure 1a). This is of
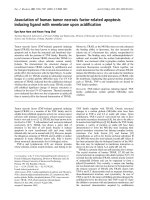
Old friends and new playersFigure 3
Old friends and new players. Genes differentially expressed in regulatory and naïve T cells, as identified by application of the Human T
Reg
Chip. The upper
half of the Venn diagram summarizes 'old friends'(namely, T
Reg
cell associated genes that have previously been described in literature for either mouse or
human). The lower half of the chart illustrates the new situation by showing all of the 'new players' of the T
Reg
cell fingerprint. As demonstrated by the
extended intersection, we identified eight genes, which formerly had only been implicated in mouse T
Reg
cell immunology, as playing an additional role in
human T
Reg
cell activity (red arrow). Furthermore, our results expanded our knowledge on the transcriptional pattern characterizing human T
Reg
cells by
adding 41 new candidate genes (indicated by the red '+').
STAT6
PECAM1
FHIT
TNFRSF10B
PITPNC1
RBMS1
XBP1
GZMK
TRGV9
SDC4
NINJ2
PTTG1
TIAF1
TRIB1
S100A10
GBP2
BHLHB2
CEB1
AK AP2
GPR2
PIM1
ACTN1
ID2
LGALS1
TNFRSF1B
CCR5
IL7R
TNFSF5
DGKA
GATA3
SATB1
ITGB2
GZMA
IL2RA
CCR7
TFRC
CTLA4
FOXP3
LGALS1
TNFRSF1B
CCR5
IL7R
TNFSF5
DGKA
GATA3
SATB1
LG
AL
S1
T
N
F
R
SF1
B
C
C
R
L
GALS
1
TN
F
R
S
F1
B
C
C
R
5
IL7R
TNF
S
F
5
D
G
K
A
G
ATA
3
S
AT
B
1
IT
G
B
2
G
ZMA
IL2RA
C
C
R
7
TFR
C
CTLA4
F
O
XP
3
5
IL7R
T
NF
S
F
5
D
G
K
A
G
ATA
3
S
ATB1
SLAMF1
STAT4
CNOT2
HLA-DMA
HLA-DRB1
HLA-DRB3
mouse
human
S
T
A
T
PE
C
A
F
H
IT
T
NF
R
P
ITP
N
RBMS
RB
P
1
GZ
GZ
M
K
T
R
G
V
IL2RB
SHMT2
TP53INP1
GBP5
EPSTI1
LGALS3
TRAF1
S100A4
G1P2
NELL2
SLC40A1
IL1RL2
CD81
BHL
BHL
C
E
B
A
K
A
G
P
R
PIM
A
C
T
ID2
CCL5
NOSIP
IFITM1
MYC
TCF7
new
p
la
y
ers old friends
Genome Biology 2006, Volume 7, Issue 7, Article R54 Pfoertner et al. R54.9
comment reviews reports refereed researchdeposited research interactions information
Genome Biology 2006, 7:R54
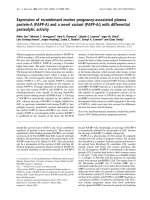
Old friends: confirmation of microarray resultsFigure 4
Old friends: confirmation of microarray results. Real-time RT-PCR was
performed for (a) FOXP3, (b) CTLA4, (c) CCR7, and RPS9 (data not
shown) expression in MACS separated human CD4
+
CD25
+
T
Reg
and
CD4
+
CD25
-
naïve T cells. Following normalization to RPS9, relative
mRNA amounts in CD4
+
CD25
+
T
Reg
cells were adjusted to corresponding
expression levels in CD4
+
CD25
-
naïve T cells and expressed as fold
changes. Real-time RT-PCR results, indicated by black bars, were
compared with fold changes arising from the Human T
Reg
Chip
(represented by grey bars). The healthy donors, randomly chosen, are
specified by letters (see Table 1). RT-PCR, reverse transcription
polymerase chain reaction.
23.5
13 .4
2.8
9.4
5.2
9.6
10 . 7
1. 9
3.1
2.2
3.1
1. 6
1. 2
2.2
1 6 11 16 21 26
A
B
C
D
E
F
mean
fold change for FOXP3 in CD4
+
CD25
+
ver sus CD4
+
CD25
-
T cells
(a)
15.5
8.7
7.0
9.5
5.9
7.3
9.0
2.2
5.2
4.0
5.1
4.1
2.6
3.9
1 6 11 16 21
A
B
C
D
E
F
mean
fold change for CTLA4 in CD4
+
CD25
+
versus CD4
+
CD25
-
T cells
(b)
-1.7
-1.5
-1.1
-2.5
-1.5
-1.1
-1.6
-2.6
-1.8
-1.8
-2.3
-2.1
-1.9
-2.1
-2.8 -2.6 -2.4 -2.2 -2.0 -1.8 -1.6 -1.4 -1.2 -1.0
B
D
E
F
I
K
mean
fold ch ang e fo r CCR7 i n CD4
+
CD25
+
versus CD4
+
CD25
-
T cells
(c)
New players: confirmation of microarray resultsFigure 5
New players: confirmation of microarray results. Real-time RT-PCR was
performed for (a) TNFRSF1B, (b) TRAF1, and (c) LGALS3 expression in
MACS isolated human CD4
+
CD25
+
T
Reg
and CD4
+
CD25
-
naïve T cells.
Fold changes were calculated as described for Figure 4. Real-time RT-PCR
results (black bars) were compared with fold changes arising from the
Human T
Reg
Chip (white bars). The healthy donors are specified by letters
(see Table 1). RT-PCR, reverse transcription polymerase chain reaction.
2.1
3.9
2.5
2.7
1.6
1.5
2.2
3.3
2.5
5.7
5.5
4.2
1.5
3.6
1.5
2.1
3.4
3.4
012345
A
B
C
D
E
F
I
K
mean
fold change of TNFRSF1B in CD4
+
CD25
+
versus CD4
+
CD25
-
T cells
(a)
6
1.4
1.8
1.1
1.9
2.1
1.2
2.5
2.1
1.8
3.4
4.4
1.1
2.6
2.2
2.6
2.2
7.1
3.2
012345678
A
B
C
D
E
F
I
K
mean
fold change of TRAF1 in CD4
+
CD25
+
versus CD4
+
CD25
-
T cell s
7
.
1
(b)
3.5
4.7
4.5
3.9
6.8
2.3
3.5
2.1
3.9
13.2
6.7
4.0
6.9
11.7
3.8
9.1
5.7
7.6
02468101214
A
B
C
D
E
F
I
K
mean
fold c hange for LGALS3 in C D4
+
CD25
+
versus CD4
+
CD25
-
T cells
(c)
R54.10 Genome Biology 2006, Volume 7, Issue 7, Article R54 Pfoertner et al. />Genome Biology 2006, 7:R54
Figure 6 (see legend on next page)
TCR
TNFRSF1B
TNFRSF10B
apoptosis
TRAF1
FADD
TP53
TP53 induced
growth arrest and apoptosis
S100A4
TIAF1
TP53INP1
FHIT
MDM2
PTTG1
PI3K-AKT signaling
FOXP3
NF-κB
NF-κB
NF-κB induced
survival genes
nucleus
+
TP53
LGALS3
TNFRSF10B
TCR
TNFRSF1B
TRAF1
PI3K-AKT signaling
STAT4
NF-κB
nucleus
CD28
CTLA-4
IL-12R/IL-13R
GATA3
MYC
TCF7
SATB1
FOXP3
STAT6
BHLHB2
ID2
TNFSF5
TCR clusterization
LGALS3
NFAT
APC activation
Ca
2+
signalingMAPK signaling
AP1
IL2Ra
LGALS1
JAK-STAT signaling
PIM-1
Proliferation
Differentiation
Immunoresponse
IL-2
IL-4
IL-5
IL-10
IL7R
IL7R
CCR5
Migration to
target tissue
IL2Rb
Genes controlling survival/apoptosis of human T
Reg
cells
Genes modulating TCR signaling/activation/proliferation and differentiation/maintenance of
human T
Reg
cells
(a)
(b)
Genome Biology 2006, Volume 7, Issue 7, Article R54 Pfoertner et al. R54.11
comment reviews reports refereed researchdeposited research interactions information
Genome Biology 2006, 7:R54
special interest because LGALS3 is known to participate in
apoptosis control. Whereas its secretion triggers apoptotic
signal cascades in T cells [42], intracellular expressed
LGALS3 acts as an antiapoptotic molecule [43-45]. The
underlying mechanism was revealed in macrophages, sug-
gesting that LGALS3 may prevent alterations of the mito-
chondrial membrane and formation of reactive oxygen
species. Moreover, it has been reported that LGALS3 phos-
phorylation is necessary for its antiapoptotic activity. The
increased expression level of LGALS3 further supports our
idea of a shifted balance toward survival and fitness of T
Reg
cells.
Genes controlling T cell receptor signaling, activation, and
proliferation of T
Reg
cells
The second module that was revealed in the present study
involves genes controlling T cell receptor signaling, activa-
tion, and proliferation of human T
Reg
cells (Figure 6b).
LGALS1 antagonizes T cell activation by partial
phosphorylation of the T cell receptor (TCR)-ζ chain [46], can
block secretion of proinflammatory cytokines such as IL-2,
and skews the balance towards a T
h
2-type cytokine profile
[47,48]. Dimeric LGALS1 triggers immunosuppressive IL-10
production in T cells, contributing to their immune regula-
tory function [49]. LGALS3 can potentially form complexes
on the TCR with N-glycans, thereby limiting the lateral mobil-
ity of the TCR and resulting in restricted TCR-mediated sign-
aling on T cells [42]. We therefore suggest that upregulation
of both galectins in T
Reg
cells results in a modulation of their
cytokine profile, thereby allowing appropriate regulation of
effector cells and immune cell homeostasis.
This module also identified a set of genes, including CTLA4,
TNFRSF1B, and PIM1, that controls proliferation (Figure 6b).
CTLA4 plays a major role in inhibiting proliferation of T
Reg
-
cells. It is an activation-induced homo-dimeric glycoprotein
receptor on T cells that interacts with the B7 ligands on the
surface of antigen-presenting cells (APCs). The mechanism of
T cell inactivation involves antagonism of CD28-dependent
costimulation and direct negative signaling through its cyto-
plasmic tail. When engaged by B7, CTLA4 plays a key role as
a negative regulator of T cell activation through down-regula-
tion of cytokine production by preventing the accumulation of
activator protein (AP)-1, NF-κB, and NFAT (nuclear factor of
activated T-cells) in the nucleus. CTLA4 was found to be
upregulated in our human T
Reg
cells. Its expression has been
linked to enhanced suppressor activity and higher expression
of FOXP3 in human T
Reg
cells. However, the blockade of
CTLA4 resulted in a significant but incomplete loss of sup-
pressor activity [50]. In addition to CTLA4, TNFRSF1B was
also found to be upregulated in the human T
Reg
cells.
TNFRSF1B is known to costimulate TCR-mediated activation
in human T cells, thereby inducing activation markers, such
as CD25. In contrast to CD28 costimulation, crosslinking of
TNFRSF1B triggers different signaling pathways resulting in
a modified cytokine profile. TNFRSF1B has the capacity to
downregulate early TCR/CD28 induced calcium mobilization
and inhibits T cell functions such as IL-2 and IL-10 produc-
tion [51]. Compared with activated naïve T cells, the prolifer-
ation of T
Reg
cells in response to IL-2 is quite low, although the
receptor for this cytokine is significantly upregulated. We
could identify a serine/threoninekinase called PIM1 that
directly transactivates NFAT at the end of the Ras signaling
cascade to facilitate IL-2 dependent proliferation and/or sur-
vival of lymphoid cells. Furthermore, PIM1 enhances NFAT-
dependent transactivation and IL-2 production in Jurkat T
cells [52]. Because PIM1 is downregulated in T
Reg
cells from
individual healthy donors, we propose a reduced signal trans-
mission to NFAT mediating less responsiveness to IL-2
resulting in lower proliferation of T
Reg
cells.
Genes controlling differentiation and maintenance of T
Reg
cells
A third module extracted by our pathway analysis involves
genes controlling T
Reg
cell differentiation and maintenance
upon maturation in the thymus (Figure 6b). The
differentiation of naïve T cells is induced by TCR activation
and either IL-12/STAT (signal transducer and activator of
transcription)4 or IL-4/STAT6 signaling pathways leading to
a T
h
1/T
h
2 lineage specification that is further directed by the
transcription factors T-bet and GATA3, respectively. STAT4
and STAT6 were both downregulated in the peripheral T
Reg
cells, indicating a potential inability to be transformed into T
h
cells upon restimulation via their TCR (Figure 2). Coexpres-
sion of GATA3 and FOXP3, but the lack of T-bet, suggests
similarities in the gene expression profiles of T
h
2 and T
Reg
cells in humans.
In a recent study, transcription profiles of T
h
1 and T
h
2 cells
isolated from human cord blood were analyzed. Although the
overall concordance to our T
Reg
cell data set is quite low, we
were able to detect a few genes similarly regulated in T
h
2 and
T
Reg
versus naïve T cells (TCF7, GZMA, S100 family mem-
bers). However, a few genes exhibited opposite expression
behavior in T
h
2 cells compared with the T
Reg
cells (SATB1 and
ACTN1 were upregulated in T
h
2 and down-regulated in T
Reg
cells). SATB1 and TCF7 are transcription factors that are
functionally similar to GATA3 and have important functions
in early thymocyte development [53,54]. For genes that were
Functional dissection of signaling modules in human T
Reg
cellsFigure 6 (see previous page)
Functional dissection of signaling modules in human T
Reg
cells. Schematic representation of potential signaling pathways involving genes that control (a)
survival/apoptosis, and (b) TCR signaling/activation/proliferation and differentiation/maintenance of human regulatory T cells, thereby mediating T
Reg
cell
functionality. Transcriptional upregulation of genes in T
Reg
versus naïve T cell is marked by red symbols, whereas green symbols represent downregulated
genes. Symbols filled with grey depict unaffected genes or summarize pathway modules.
R54.12 Genome Biology 2006, Volume 7, Issue 7, Article R54 Pfoertner et al. />Genome Biology 2006, 7:R54
differentially expressed in T
h
1 versus naïve T cells, we found
no similarities to our T
Reg
cell data set [55]. In summary, these
data underline the concept that, like their murine homologs,
human T
Reg
cells represent a separate lineage. They are
undergoing a unique differentiation pathway distinct from
those committing T
h
1 or T
h
2 cells, and are therefore equipped
with a tightly regulated set of transcription factors acting in
addition to FOXP3.
Another important question is how T
Reg
cell populations are
regulated and maintained in the periphery. There is growing
evidence favoring IL-7 as a master regulator of T cell homeos-
tasis, based on its essential role in the homeostatic expansion
of naïve T cells in response to low affinity antigens and its
capacity to enhance expansion of peripheral T cells dramati-
cally in response to high affinity antigens [56]. Analyzing a
clonal population of mouse CD4
+
CD25
+
T
Reg
cells, it was dem-
onstrated that these cells do not proliferate in response to
lymphopenia in the absence of the selecting self-peptide. This
was in contrast to the naïve T cell proliferation behavior
reflecting the lower IL-7 receptor (IL7R) expression levels in
regulatory compared with naïve T cells [57], which was also
supported by our data. Additionally, it was shown that
GATA3 blocks IL7R expression in early stages of T cell devel-
opment [58]. Because self-antigen presentation in combina-
tion with IL-7 expression promotes T
Reg
cell proliferation, we
assume that this mechanism contributes to the specific accu-
mulation of T
Reg
cells at sites where their self-antigen is
presented.
Apart from the 'old friends', our T
Reg
cell signature comprises
41 'new players' that have not yet been described in T
Reg
cells
at all. Because T
Reg
cells have a far-reaching effect on our
health by influencing the outcome of infection, autoimmu-
nity, transplantation, and cancer, we studied whether these
new candidates have been reported to participate in these
processes. Interestingly, the vast majority of the genes identi-
fied in our study (51 out of 62) have been implicated in at least
one of these disease scenarios (Table 2).
Genes involved in autoimmune diseases
Autoimmunity occurs as a consequence of self-tolerance
breakdown, presumably resulting from a combination of
inherited polymorphisms (or DNA variations), acquired envi-
ronmental triggers, and stochastic events [59]. Analyzing our
transcriptional pattern of human T
Reg
cells isolated from indi-
vidual healthy donors, we found that 32 of the genes identi-
fied are involved in the pathogenesis of diverse autoimmune
diseases (Table 2). We focus here on a few affected genes that
are central to the functional modules discussed above and
that might therefore influence disease pathogenesis.
We found TNFRSF1B to be 2.5-fold overexpressed in the nat-
urally occurring T
Reg
cells compared with their naïve
counterparts. A single nucleotide polymorphism (SNP) in this
gene was reported to influence susceptibility to multiple scle-
rosis, a severe inflammatory autoimmune disorder of the cen-
tral nervous system [60]. In addition, Sashio and coworkers
[61] linked two other polymorphisms to the TNFRSF1B gene-
locus that increase susceptibility to Crohn's disease and ulcer-
ative colitis, which are both chronic inflammatory diseases of
the gastrointestinal tract. In Japanese patients, Morita and
coworkers identified another SNP in the TNFRSF1B gene
associated with systemic lupus erythematosus (SLE).
Type I diabetes is a T cell mediated inflammatory autoim-
mune disease of the endocrine pancreas, resulting in lack of
insulin caused by β cell destruction. We found 18 genes in our
human T
Reg
cell signature that have been reported to contrib-
ute to pathogenesis of this disease, including granzyme A
(GZMA) [63], the CD40 ligand (TNFSF5) [64,65], CTLA4
[66], and the T-cell specific transcription factor 7 (TCF7) [67].
Furthermore, two polymorphisms in the HLA-DRB1 gene,
which we found to be overexpressed in T
Reg
cells, have been
described to confer high-risk susceptibility [68].
Rheumatoid arthritis (RA) is a chronic inflammatory disorder
that affects the joints and is probably caused by autoimmune
mechanisms. Twenty-one T
Reg
specific genes have been
described as susceptibility genes for RA. For example,
LGALS3 [69,70], GZMA [71], and the S100 calcium binding
protein A4 (S100A4) [72] have been described as highly
expressed in the synovial tissue and at sites of joint destruc-
tion contributing to the inflammatory process. The complex
genetic component of RA etiology was further demonstrated
by the discovery of multiple polymorphisms, for example in
genes of the chemokine receptor 5 (CCR5) [73] and of HLA-
DRB1 [74], conferring high risk susceptibility.
In mice deficient for STAT4, a gene we found to be downreg-
ulated in our human T
Reg
cells, RA is suppressed because of
reduced levels of IL-12 and interferon interferon (IFN)-γ [75].
Interestingly, STAT4
-/-
mice were additionally almost com-
pletely protected from diabetes [76] and induction of experi-
mental allergic encephalomyelitis [77], underlining the
importance of STAT4 downregulation in T
Reg
cells.
Because T
Reg
cells are essential for the maintenance of self-
tolerance, SNPs or mutations that affect genes expressed in
T
Reg
cells may result in the synthesis of aberrant mRNAs and
proteins, which in turn could impair T
Reg
cell function and/or
development, leading to higher risks for autoimmunity. Addi-
tionally, failures in gene regulation resulting in inadequate
protein amounts could disturb appropriate T
Reg
cell activity,
thereby probably contributing to the pathogenesis of autoim-
mune disorders.
Because most of the genes discussed here are central compo-
nents of the functional modules discussed above, it is conceiv-
able that the dysregulation of one or more of these genes
affect T
Reg
cell activity in terms of survival/apoptosis, differ-
entiation, proliferation, and suppressor function, thereby
Genome Biology 2006, Volume 7, Issue 7, Article R54 Pfoertner et al. R54.13
comment reviews reports refereed researchdeposited research interactions information
Genome Biology 2006, 7:R54
promoting breakdown of self-tolerance and eventually lead-
ing to autoimmunity.
Conclusion
This study provides new insight into gene expression charac-
terizing human regulatory versus naïve T cells from individ-
ual healthy donors. Based on our nonredundant microarray
approach, we identified a comprehensive set of 62 'old
friends' and 'new players' that are differentially expressed in
T
Reg
cells. Pathway analysis implicated most of these genes in
functional key modules of survival/apoptosis, TCR signaling/
activation/proliferation, and differentiation/maintenance of
T
Reg
cells and might therefore represent promising new tar-
gets for therapeutic intervention. This is underlined by the
fact that these genes have been widely associated with diverse
clinical setting of autoimmune diseases. Functional
dissection of the modules under pathophysiological condi-
tions should help to unravel the remaining mysteries of
human T
Reg
cells and is essential for future development of
new therapeutic approaches exploiting their potential in bal-
ancing peripheral tolerance.
Materials and methods
Blood samples from healthy donors
Blood samples were collected from 11 healthy donors after
informed consent had been obtained, in accordance with
institutional guidelines. The Ethics Committee of Hanover
Medical School approved the study protocol. Basic character-
istics of all donors are summarized in Table 1. None of the
donors suffered from allergies or autoimmune disease and all
were free from acute or chronic infections.
Purification of human CD4
+
T cells
CD4
+
T cells were prepared from peripheral blood of healthy
donors by centrifugation over Ficoll-Hypaque gradients (Bio-
chrom AG, Berlin, Germany) and MACS isolation using the
CD4
+
T cell isolation kit and AutoMACS technology (Miltenyi
Biotech, Bergisch Gladbach, Germany). Subsequently, cells
were separated into CD4
+
CD25
-
and CD4
+
CD25
+
T cells by
either using sorting on a MoFlo (DakoCytomation, Fort Col-
lins, CO, USA) to a purity in excess of 98% (for Affymetrix
studies) or an AutoMACS using the regulatory human T cell
isolation kit (Miltenyi Biotech). To increase purity of the
CD25
-
T cell fraction an additional separation step depleting
remaining CD25
+
T cells was added, if necessary. For studies
on the Human T
Reg
Chip purity of the enriched cell fractions
was above 90%, as determined by flow cytometry (the
remaining contaminating cells mainly represent CD16
+
/
CD56
+
natural killer cells and, at lower levels, CD8
+
T cells,
CD19
+
B cells and CD14
+
monocytes; Additional data file 6).
Isolated cells were either directly used for RNA purification or
pooled equivalently as indicated before RNA purification.
Purification of murine CD4
+
T cells
For Affymetrix GeneChip experiments, red blood cell
depleted splenocytes from BALB/c mice were labeled with
anti-CD4 and anti-CD25. Labeled cells were separated with a
MoFlo and purity was in excess of 98%. Isolated cells were
pooled equivalently (three independent individuals) and sub-
sequently used for RNA purification.
Propagation and stimulation of CD4
+
T cell lines
CD4
+
CD25
+
T
Reg
cells were stimulated once with plate-bound
anti-CD3 (TR66, 1 µg/ml), soluble anti-CD28 (CD28.2, 1 µg/
ml; BD Bioscience, San Jose, CA, USA), and 50 U/ml recom-
binant human IL-2 (Proleukin; provided by P Wagner, Chiron
Corporation, Emeryville, CA, USA), and thereafter weekly
with irradiated allogeneic EBV-transformed B cells (LG2-
EBV; provided by T Boon, LICR, Brussels, Belgium).
CD4
+
CD25
-
T cells were stimulated directly with irradiated
LG2-EBV cells. Culture medium was Iscove's modified
Dulbecco's medium, with 10% fetal calf serum,100 U/ml pen-
icillin/streptomycin, and nonessential amino acids (PAA
Laboratories, Linz, Austria). Human peripheral blood was
obtained after informed consent had been obtained, in
accordance with institutional guidelines. Antibodies for
immunostaining were PE-, FITC-, APC-, and CyChrom-con-
jugated antibodies against CD4 (RPA-T4), CD25 (M-A251; all
from BD Bioscience), and FOXP3 (PCH101; eBioscine Inc.,
San Diego, CA, USA) and respective isotype controls. Anti-
CD3ε (TR66, produced from hybridoma supernatants) and
anti-CD28 (CD28.2; BD Bioscience) were used for T cell
stimulation.
Retroviral transduction of human effector CD4
+
T cells
The cDNA encoding human FOXP3 was amplified from
cDNA of T
Reg
cells using high fidelity PFU polymerase
(Promega) and specific primers (FOXP3: 5'-GAC AAG GAC
CCG ATG CCC A-3' and 5'-TCA GGG GCC AGG TGT AGG GT-
3'). The PCR product was cloned into pCR4.1 TOPO (Invitro-
gen, Carlsbad, CA, USA), sequenced, and inserted into a
pMSCV-based retroviral vector encoding an enhanced GFP
under the control of an IRES sequence. The amphotropic
PT67 packaging cell line (provided by M. Wirth, GBF, Braun-
schweig, Germany) was used for transfection. Filtrated (0.45
µm) virus-containing supernatant supplemented with 8 mg/
ml sequabrene (Sigma-Aldrich, Munich, Germany) was
applied to T
h
cells at day 2 after allogeneic stimulation by cen-
trifugation at 5000 × g for 60 minutes at room temperature.
Cells were expanded thereafter with 50 U/ml IL-2, and GFP-
expressing cells were sorted 1-2 weeks later using a FACS-
Vantage (BD Bioscience).
Flow cytometric analysis
To confirm purity of the separated cell fractions, regulatory
and naïve T cells were analyzed by multicolor FACS using the
following antibodies: anti-CD4-FITC and anti-CD25-PE
(Miltenyi Biotec). Flow cytometry was done using a FACSCal-
ibur applying CellQuest software (BD Bioscience).
R54.14 Genome Biology 2006, Volume 7, Issue 7, Article R54 Pfoertner et al. />Genome Biology 2006, 7:R54
Real-time RT-PCR
CD4
+
CD25
+
regulatory and CD4
+
CD25
-
naïve T cells were iso-
lated by MACS technology as described above. After cell lysis,
RNA was extracted from both cell populations applying the
RNeasy kit (Qiagen, Hilden, Germany). cDNA was synthe-
sized using oligo(dT) primers and random hexamers by
SuperScript II Reverse Transcriptase (Invitrogen, Karlsruhe,
Germany). Quantitative real-time RT-PCR was performed in
an ABI PRISM cycler (Applied Biosystems, Foster City, CA,
USA) using a SYBR Green PCR kit from Stratagene (La Jolla,
CA, USA) and specific primers optimized to amplify 90-230
base pair fragments from the different genes analyzed. A
threshold was set in the linear part of the amplification curve,
and the number of cycles needed to reach it was calculated for
every gene. Relative mRNA levels were determined by using
included standard curves for each individual gene and further
normalization to RPS9 as a housekeeping gene. Melting
curves established the purity of the amplified band. Primer
sequences are summarized in Table 3.
Preparation of the Human T
Reg
Chip
A total of 395 oligonucleotides were deposited onto CodeLink
activated slides (Amersham Biosciences, Freiburg, Germany)
at a concentration of 25 µmol/l in 1.5× sodium phosphate
buffer in a contact-dependent manner using a MicroGrid TAS
II spotter (BioRobotics, Freiburg, Germany). All 50-mers
were amino-modified at the 5'-end enabling covalent linkage
to reactive ester groups provided by the glass surface. Cou-
pling of DNA was ensured by overnight incubation in a
saturated sodium chloride chamber, and blocking residual
reactive groups was done as recommended by the manufac-
turer [78]. Until used, slides were maintained in a desiccated
environment. To ensure complete spotting, SYBR-Green
staining of three randomly selected Human T
Reg
Chips of each
printing batch was performed as previously described [79].
Design of the Human T
Reg
Chip
Each probe in our microarray consists of a single 50 mer oli-
gonucleotide, because utility and performance of 50 mer oli-
gonucleotide microarrays was previously established [80].
The Human T
Reg
Chip consists of 350 oligonucleotides prob-
ing genes specific for T
Reg
cells and 31 oligonucleotides repre-
senting housekeeping genes consulted for normalization.
Furthermore, many control oligonucleotides are included:
two 5'-3' controls to ensure RNA integrity, four bacterial
hybridization controls to examine a linear hybridization
process, five spike-in controls to check sample preparation,
one positive control (Arabidopsis thaliana) for simpler grid
finding, and finally 32 negative controls to calculate the back-
ground level. Altogether, we immobilize eight replicates per
oligonucleotide, split into two separated arrays per slide, each
containing 1,600 spots. Genes probed on the Human T
Reg
Chip were selected by extensive analyses of literature and pre-
viously conducted Affymetrix microarray experiments.
Design and synthesis of the oligonucleotides were performed
by MWG using the Affymetrix probe sets as reference. Our
Human T
Reg
Chip will be made available to the scientific com-
munity on our website [81].
Sample preparation, hybridization, washing, staining
and scanning
Quality and integrity of the total RNA isolated from 1-2 × 10
5
CD4
+
CD25
+
and CD4
+
CD25
-
T cells was controlled by run-
ning all samples on an Agilent Technologies 2100 Bioanalyzer
(Agilent Technologies, Waldbronn, Germany). Samples were
prepared by applying a double-linear amplification method in
accordance with the Eberwine protocol[82] and modified by
Table 3
Primer sequences used in real-time RT-PCR
Gene Primers
FOXP3 5'-GAA CGC CAT CCG CCA CAA CCT GA-3'
5'-CCC TGC CCC CAC CAC CTC TGC-3'
CTLA4 5'-TGC AGC AGT TAG TTC GGG GTT GTT-3'
5'-CTG GCT CTG TTG GGG GCA TTT TC-3'
CCR7 5'-TGG CCT GCA GGA AAC ACC-3'
5'-GGG AGA CTT CTT GGC TTG GTG AG-3'
RPS9 5'-CGC AGG CGC AGA CGG TGG AAG C-3'
5'-CGA AGG GTC TCC GCG GGG TCA CAT-3'
TNFRSF1B 5'-GTA GCC TTG CCC GGA TTC TGG-3'
5'-ACC CTG CCC CTG CTC TGC TA-3'
TRAF1 5'-GGG GCA TAA ACT TTC CTC TTC C-3'
5'-TTT GGG GTT ATA CAT TGC TCA GTG-3'
LGALS3 5'-CCT TTG CCT GGG GGA GTG GTG-3'
5'-TGA AGC GTG GGT TAA AGT GGA AGG-3'
RT-PCR, reverse transcription polymerase chain reaction.
Genome Biology 2006, Volume 7, Issue 7, Article R54 Pfoertner et al. R54.15
comment reviews reports refereed researchdeposited research interactions information
Genome Biology 2006, 7:R54
Affymetrix. Briefly, the first round of RNA amplification was
performed without biotinylated nucleotides using the
Promega P1300 RiboMax Kit for T7 amplification (Promega,
Mannheim, Germany). After clean up of the precipitated
aRNA synthesis of second round, first-strand cDNA was done
using random hexamers (Pharmacia, Freiburg, Germany).
Subsequent second-strand cDNA was prepared as in the first
round but integrating an additional RNAse H incubation step
to digest the aRNA before annealing of the T7T23V primer.
The second round of RNA amplification was performed as an
in vitro transcription assay in the presence of biotinylated
UTP using the GeneChip
®
Expression 3'-Amplification Rea-
gents Kit for IVT Labeling (Affymetrix). The concentration of
the obtained biotin-labeled cRNA was determined by ultravi-
olet absorbance and its quality as means of product length
distribution was again checked using the Agilent Bioanalyzer.
In all cases, 15 µg of each biotinylated cRNA preparation was
fragmented and placed in a hybridization cocktail containing
four biotinylated hybridization controls (BioB, BioC, BioD,
and Cre). Samples were hybridized to individual Human T
Reg
Chips for 16 hours at 42°C using a Lucidea Slidepro (Amer-
sham Biosciences). After hybridization the microarrays were
washed as recommended in the manufacturer's instructions
(CodeLink Expression Bioarray System; Amersham Bio-
sciences), stained with Cy5-streptavidin (Amersham Bio-
sciences), and read using an arrayWorX
e
scanner (Applied
Precision, Issaquah, WA, USA).
Affymetrix GeneChip assay
Samples were amplified for GeneChip analysis according to
the recommended protocols by the manufacturer. In all cases,
10 µg of each biotinylated cRNA preparation was fragmented
and placed in a hybridization cocktail containing four bioti-
nylated hybridization controls (BioB, BioC, BioD, and Cre), as
recommended by the manufacturer. Samples were hybridized
to an identical lot of Affymetrix GeneChips for 16 hours. After
hybridization the GeneChips were washed, stained with SA-
PE, and read using an Affymetrix GeneChip fluidic station
and scanner.
Criteria for Human T
Reg
Chip gene collection
Differentially expressed genes between CD4
+
CD25
+
and
CD4
+
CD25
-
measured on Affymetrix GeneChips were
selected according to predefined categories deduced from
three parameters calculated by MAS 5 software: fold change
(FC), change p value (pValue), and signal intensity difference
(SID). Category A is defined as an FC above 2, pValue <0.001
(for increased) or >0.999 (for decreased), and SID above 200.
Category B is defined as FC above 2, pValue <0.01 (for
increased) and >0.99 (for decreased), and SID above100. Cat-
egory C is defined as FC above 1.5, pValue <0.001 (for
increased) and >0.999 (for decreased), and SID above 40.
The likelihood of a significant regulation decreases from cat-
egory A to C. Preferentially, most of the selected genes col-
lected for the Human T
Reg
Chip are categorized as A. Selection
was performed by collecting genes that were significantly reg-
ulated in human cells, genes that were similarly regulated
between mouse and human, genes that were found to be reg-
ulated only in mouse cells and referenced in the literature,
and genes that were significantly affected by FOXP3 overex-
pression in cultured T
h
cell lines. Also considered were genes
known for their impact in mouse and human regulatory T cell
development.
Data analysis Human T
Reg
Chip
Signal intensities were qualified and quantified by means of
Imagene software v5.5.2 (BioDiscovery, Los Angeles, CA,
USA). Spots of poor quality (flag = 3) were excluded from
further analysis. To adjust arrays from different experiments,
data normalization based on median signal intensities of the
housekeeping genes was carried out as proposed using the
following formula:
Where SI
normalized
is the normalized signal intensity, I
n
is the
mean signal intensity of gene n, B
n
is the mean background
intensity of gene n, and <ln house> is the median signal
intensity from housekeeping genes expressed as ln (logarithm
naturalis).
Differences in gene expression among CD4
+
CD25
+
regulatory
and CD4
+
CD25
-
naïve T cells were determined statistically by
corrected t test analysis using the SAM tool [83]. Differen-
tially expressed genes were defined using the following SAM
parameters: delta = 2.46 and median FDR (false discovery
rate) = 0.48. For two-dimensional hierarchic clustering anal-
ysis Genesis software v1.4.0 was applied [84].
Accession numbers
The entire data sets are deposited in a MIAME compliant for-
mat at Gene Expression Omnibus (GEO) [85]. Data derived
from the Human T
Reg
Chip are available under the series
accession number GSE3882 (platform ID, GPL3110).
Data derived from Affymetrix GeneChip system and used as
reference and selection data sets are published at GEO under
series accession number GSE4527 (FOXP3 and GFP trans-
duced CD4
+
T
h
cells) and GSE4571 (representing data from
CD4
+
CD25
+
and CD4
+
CD25
-
T cellsisolated by cell sorting
from human peripheral blood and CD4
+
CD25
+
and
CD4
+
CD25
-
T cells isolated by cell sorting from spleen pre-
pared from BALB/C mice).
Additional File 1Click here for fileAdditional File 2Click here for fileAdditional File 3Click here for fileAdditional File 4Click here for fileAdditional File 5Click here for fileAdditional File 6Click here for file
Additional data files
The following additional data are available with the online
version of this paper: An Excel spreadsheet containing lists of
differentially expressed genes in murine and human
CD4
+
CD25
+
T cells versus CD4
+
CD25
-
T cells obtained from
SI
IB
e
normalized
nn
ln house
=
−
<>
R54.16 Genome Biology 2006, Volume 7, Issue 7, Article R54 Pfoertner et al. />Genome Biology 2006, 7:R54
whole-genome Affymetrix GeneChips (Additional file 1); an
Excel spreadsheet containing a list of genes that were likewise
affected by Foxp3 overexpression in CD4
+
T
h
cell lines and
CD4
+
CD25
+
derived T
Reg
cell lines compared with their
appropriate controls (data obtained using whole-genome
Affymetrix GeneChip HG-U133A; Additional data file 2); an
Excel spreadsheet containing a list of known genes that were
previously discussed in the literature within the context of
human and murine regulatory T cells (Additional data file 3);
an Excel spreadsheet containing relative expression datafrom
Foxp3 overexpressing CD4
+
T
h
cell lines versus their GFP
tranduced CD4
+
T
h
controls obtained from whole genome
Affymetrix GeneChip HG-U133A (data are presented for
genes that are also accessible on the Human T
Reg
Chip; Addi-
tional data file 4); a Word file presenting data for the regula-
tory phenotype and the amount of Foxp3
+
cells within MACS
purified human CD4
+
CD25
+
T cells (Additional data file 5);
and a Word table describing the phenotype of contaminating
cells within MACS purified CD4
+
CD25
+
and CD4
+
CD25
-
T
cells (Additional data file 6).
Acknowledgements
This study was supported by grants from the Deutsche Forschungsgemein-
schaft (to JB) and the VolkswagenStifung (to MP-K). Additionally, we thank
all donors for their blood donation.
References
1. Sakaguchi S: Naturally arising Foxp3-expressing CD25+CD4+
regulatory T cells in immunological tolerance to self and
non-self. Nat Immunol 2005, 6:345-352.
2. Sakaguchi S, Sakaguchi N, Asano M, Itoh M, Toda M: Immunologic
self-tolerance maintained by activated T cells expressing IL-
2 receptor alpha-chains (CD25). Breakdown of a single
mechanism of self-tolerance causes various autoimmune
diseases. J Immunol 1995, 155:1151-1164.
3. Fontenot JD, Gavin MA, Rudensky AY: Foxp3 programs the
development and function of CD4+CD25+ regulatory T
cells. Nat Immunol 2003, 4:330-336.
4. Hori S, Nomura T, Sakaguchi S: Control of regulatory T cell
development by the transcription factor Foxp3. Science 2003,
299:1057-1061.
5. Khattri R, Cox T, Yasayko SA, Ramsdell F: An essential role for
Scurfin in CD4+CD25+ T regulatory cells. Nat Immunol 2003,
4:337-342.
6. Vigouroux S, Yvon E, Biagi E, Brenner MK: Antigen-induced
regulatory T cells. Blood 2004, 104:26-33.
7. Bluestone JA, Abbas AK: Natural versus adaptive regulatory T
cells. Nat Rev Immunol 2003, 3:253-257.
8. Shao L, Jacobs AR, Johnson VV, Mayer L: Activation of CD8+ reg-
ulatory T cells by human placental trophoblasts. J Immunol
2005, 174:7539-7547.
9. Wei S, Kryczek I, Zou L, Daniel B, Cheng P, Mottram P, Curiel T,
Lange A, Zou W: Plasmacytoid dendritic cells induce CD8+
regulatory T cells in human ovarian carcinoma. Cancer Res
2005, 65:5020-5026.
10. Barrat FJ, Cua DJ, Boonstra A, Richards DF, Crain C, Savelkoul HF,
de Waal-Malefyt R, Coffman RL, Hawrylowicz CM, O'Garra A: In
vitro generation of interleukin 10-producing regulatory
CD4(+) T cells is induced by immunosuppressive drugs and
inhibited by T helper type 1 (Th1)- and Th2-inducing
cytokines. J Exp Med 2002, 195:603-616.
11. Thorstenson KM, Khoruts A: Generation of anergic and poten-
tially immunoregulatory CD25+CD4 T cells in vivo after
induction of peripheral tolerance with intravenous or oral
antigen. J Immunol 2001, 167:188-195.
12. Read S, Malmstrom V, Powrie F: Cytotoxic T lymphocyte-associ-
ated antigen 4 plays an essential role in the function of
CD25(+)CD4(+) regulatory cells that control intestinal
inflammation. J Exp Med 2000, 192:295-302.
13. Shimizu J, Yamazaki S, Takahashi T, Ishida Y, Sakaguchi S: Stimula-
tion of CD25(+)CD4(+) regulatory T cells through GITR
breaks immunological self-tolerance. Nat Immunol 2002,
3:135-142.
14. Szanya V, Ermann J, Taylor C, Holness C, Fathman CG: The subpop-
ulation of CD4+CD25+ splenocytes that delays adoptive
transfer of diabetes expresses L-selectin and high levels of
CCR7. J Immunol 2002, 169:2461-2465.
15. Roncador G, Brown PJ, Maestre L, Hue S, Martinez-Torrecuadrada JL,
Ling KL, Pratap S, Toms C, Fox BC, Cerundolo V, et al.: Analysis of
FOXP3 protein expression in human CD4(+)CD25(+) regu-
latory T cells at the single-cell level. Eur J Immunol 2005,
35:1681-1691.
16. Bruder D, Probst-Kepper M, Westendorf AM, Geffers R, Beissert S,
Loser K, von Boehmer H, Buer J, Hansen W: Neuropilin-1: a
surface marker of regulatory T cells. Eur J Immunol 2004,
34:623-630.
17. Ruprecht CR, Gattorno M, Ferlito F, Gregorio A, Martini A, Lanza-
vecchia A, Sallusto F: Coexpression of CD25 and CD27 identi-
fies FoxP3+ regulatory T cells in inflamed synovia. J Exp Med
2005, 201:1793-1803.
18. Allan SE, Passerini L, Bacchetta R, Crellin N, Dai M, Orban PC, Ziegler
SF, Roncarolo MG, Levings MK: The role of 2 FOXP3 isoforms in
the generation of human CD4+ Tregs. J Clin Invest 2005,
115:3276-3284.
19. Lechner O, Lauber J, Franzke A, Sarukhan A, von BH, Buer J: Finger-
prints of anergic T cells. Curr Biol 2001, 11:587-595.
20. Gavin MA, Clarke SR, Negrou E, Gallegos A, Rudensky A: Homeos-
tasis and anergy of CD4(+)CD25(+) suppressor T cells in
vivo. Nat Immunol 2002, 3:33-41.
21. Ziegler SF: FOXP3: of mice and men. Annu Rev Immunol 2006,
24:209-26.
22. Bakay M, Chen YW, Borup R, Zhao P, Nagaraju K, Hoffman EP:
Sources of variability and effect of experimental approach on
expression profiling data interpretation. BMC Bioinformatics
2002, 3:4.
23. Unger MA, Rishi M, Clemmer VB, Hartman JL, Keiper EA, Greshock
JD, Chodosh LA, Liebman MN, Weber BL: Characterization of
adjacent breast tumors using oligonucleotide microarrays.
Breast Cancer Res 2001, 3:336-341.
24. Park PJ, Cao YA, Lee SY, Kim J, Chang MS, Hart R, Choi S: Current
issues for DNA microarrays: platform comparison, double
linear amplification, and universal RNA reference. J Biotechnol
2004, 112:225-245.
25. Yuen T, Wurmbach E, Pfeffer RL, Ebersole BJ, Sealfon SC: Accuracy
and calibration of commercial oligonucleotide and custom
cDNA microarrays. Nucleic Acids Res 2002, 30:e48.
26. Hehlgans T, Pfeffer K: The intriguing biology of the tumour
necrosis factor/tumour necrosis factor receptor superfamily:
players, rules and the games. Immunology 2005, 115:1-20.
27. Karin M, Greten FR: NF-kappaB: linking inflammation and
immunity to cancer development and progression. Nat Rev
Immunol 2005, 5:749-759.
28. Haupt S, Berger M, Goldberg Z, Haupt Y: Apoptosis: the p53
network. J Cell Sci 2003, 116:4077-4085.
29. Schultz L, Khera S, Sleve D, Heath J, Chang NS: TIAF1 and p53
functionally interact in mediating apoptosis and silencing of
TIAF1 abolishes nuclear translocation of serine 15-phospho-
rylated p53. DNA Cell Biol 2004, 23:67-74.
30. Tomasini R, Samir AA, Carrier A, Isnardon D, Cecchinelli B, Soddu S,
Malissen B, Dagorn JC, Iovanna JL, Dusetti NJ: TP53INP1s and
homeodomain-interacting protein kinase-2 (HIPK2) are
partners in regulating p53 activity. J Biol Chem 2003,
278:37722-37729.
31. van der Leij J, van den Berg A, Albrecht EW, Blokzijl T, Roozendaal R,
Gouw AS, de Jong KP, Stegeman CA, van Goor H, Chang NS, et al.:
High expression of TIAF-1 in chronic kidney and liver allo-
graft rejection and in activated T-helper cells. Transplantation
2003, 75:2076-2082.
32. Fernandez-Fernandez MR, Veprintsev DB, Fersht AR: Proteins of
the S100 family regulate the oligomerization of p53 tumor
suppressor. Proc Natl Acad Sci USA 2005, 102:4735-4740.
33. Daoud SS, Munson PJ, Reinhold W, Young L, Prabhu VV, Yu Q,
LaRose J, Kohn KW, Weinstein JN, Pommier Y: Impact of p53
knockout and topotecan treatment on gene expression pro-
Genome Biology 2006, Volume 7, Issue 7, Article R54 Pfoertner et al. R54.17
comment reviews reports refereed researchdeposited research interactions information
Genome Biology 2006, 7:R54
files in human colon carcinoma cells: a pharmacogenomic
study. Cancer Res 2003, 63:2782-2793.
34. Kho PS, Wang Z, Zhuang L, Li Y, Chew JL, Ng HH, Liu ET, Yu Q: p53-
regulated transcriptional program associated with genoto-
xic stress-induced apoptosis. J Biol Chem 2004, 279:21183-21192.
35. Hamid T, Kakar SS: PTTG/securin activates expression of p53
and modulates its function. Mol Cancer 2004, 3:18.
36. Pei L: Identification of c-myc as a down-stream target for
pituitary tumor-transforming gene. J Biol Chem 2001,
276:8484-8491.
37. Nishizaki M, Sasaki J, Fang B, Atkinson EN, Minna JD, Roth JA, Ji L:
Synergistic tumor suppression by coexpression of FHIT and
p53 coincides with FHIT-mediated MDM2 inactivation and
p53 stabilization in human non-small cell lung cancer cells.
Cancer Res 2004, 64:5745-5752.
38. Banz A, Pontoux C, Papiernik M: Modulation of Fas-dependent
apoptosis: a dynamic process controlling both the persist-
ence and death of CD4 regulatory T cells and effector T cells.
J Immunol 2002, 169:750-757.
39. Chen X, Murakami T, Oppenheim JJ, Howard OM: Differential
response of murine CD4+CD25+ and CD4+. Eur J Immunol
2004, 34:859-869.
40. Fritzsching B, Oberle N, Eberhardt N, Quick S, Haas J, Wildemann B,
Krammer PH, Suri-Payer E: In contrast to effector T cells,
CD4+CD25+FoxP3+ regulatory T cells are highly susceptible
to CD95 ligand- but not to TCR-mediated cell death. J
Immunol 2005, 175:32-36.
41. Wang X, Zheng J, Liu J, Yao J, He Y, Li X, Yu J, Yang J, Liu Z, Huang S:
Increased population of CD4(+)CD25(high), regulatory T
cells with their higher apoptotic and proliferating status in
peripheral blood of acute myeloid leukemia patients. Eur J
Haematol 2005, 75:468-476.
42. Demetriou M, Granovsky M, Quaggin S, Dennis JW: Negative reg-
ulation of T-cell activation and autoimmunity by Mgat5 N-
glycosylation. Nature 2001, 409:733-739.
43. Nakahara S, Oka N, Raz A: On the role of galectin-3 in cancer
apoptosis. Apoptosis 2005, 10:267-275.
44. Akahani S, Nangia-Makker P, Inohara H, Kim HR, Raz A: Galectin-3:
a novel antiapoptotic molecule with a functional BH1
(NWGR) domain of Bcl-2 family. Cancer Res 1997,
57:5272-5276.
45. Kim HR, Lin HM, Biliran H, Raz A: Cell cycle arrest and inhibition
of anoikis by galectin-3 in human breast epithelial cells. Can-
cer Res 1999, 59:4148-4154.
46. Chung CD, Patel VP, Moran M, Lewis LA, Miceli MC: Galectin-1
induces partial TCR zeta-chain phosphorylation and antago-
nizes processive TCR signal transduction. J Immunol 2000,
165:3722-3729.
47. Rabinovich GA, Gruppi A: Galectins as immunoregulators
during infectious processes: from microbial invasion to the
resolution of the disease. Parasite Immunol 2005, 27:103-114.
48. Rabinovich GA, Ariel A, Hershkoviz R, Hirabayashi J, Kasai KI, Lider
O: Specific inhibition of T-cell adhesion to extracellular
matrix and proinflammatory cytokine secretion by human
recombinant galectin-1. Immunology 1999, 97:100-106.
49. van der LJ, van den BA, Blokzijl T, Harms G, van GH, Zwiers P, van
Weeghel R, Poppema S, Visser L: Dimeric galectin-1 induces IL-
10 production in T-lymphocytes: an important tool in the
regulation of the immune response. J Pathol 2004, 204:511-518.
50. Birebent B, Lorho R, Lechartier H, de Guibert S, Alizadeh M, Vu N,
Vu N, Beauplet A, Robillard N, Semana G: Suppressive properties
of human CD4+CD25+ regulatory T cells are dependent on
CTLA-4 expression. Eur J Immunol 2004, 34:3485-3496.
51. Aspalter RM, Eibl MM, Wolf HM: Regulation of TCR-mediated T
cell activation by TNF-RII. J Leukoc Biol 2003, 74:572-582.
52. Rainio EM, Sandholm J, Koskinen PJ: Cutting edge:Transcriptional
activity of NFATc1 is enhanced by the Pim-1 kinase. J
Immunol 2002, 168:1524-1527.
53. Alvarez JD, Yasui DH, Niida H, Joh T, Loh DY, Kohwi-Shigematsu T:
The MAR-binding protein SATB1 orchestrates temporal
and spatial expression of multiple genes during T-cell
development. Genes Dev 2000, 14:521-535.
54. Ting CN, Olson MC, Barton KP, Leiden JM: Transcription factor
GATA-3 is required for development of the T-cell lineage.
Nature 1996, 384:474-478.
55. Lund R, Ahlfors H, Kainonen E, Lahesmaa AM, Dixon C, Lahesmaa R:
Identification of genes involved in the initiation of human
Th1 or Th2 cell commitment. Eur J Immunol 2005, 35:3307-3319.
56. Fry TJ, Mackall CL: Interleukin-7: master regulator of periph-
eral T-cell homeostasis? Trends Immunol 2001, 22:564-571.
57. Cozzo C, Larkin J III, Caton AJ: Cutting edge: self-peptides drive
the peripheral expansion of CD4+CD25+ regulatory T cells.
J Immunol 2003, 171:5678-5682.
58. Anderson MK, Hernandez-Hoyos G, Dionne CJ, Arias AM, Chen D,
Rothenberg EV: Definition of regulatory network elements for
T cell development by perturbation analysis with PU.1 and
GATA-3. Dev Biol 2002, 246:103-121.
59. Rioux JD, Abbas AK: Paths to understanding the genetic basis
of autoimmune disease. Nature 2005, 435:584-589.
60. Ehling R, Gassner C, Lutterotti A, Strasser-Fuchs S, Kollegger H,
Kristoferitsch W, Reindl M, Berger T: Genetic variants in the
tumor necrosis factor receptor II gene in patients with mul-
tiple sclerosis. Tissue Antigens 2004, 63:28-33.
61. Sashio H, Tamura K, Ito R, Yamamoto Y, Bamba H, Kosaka T, Fukui
S, Sawada K, Fukuda Y, Tamura K, et al.: Polymorphisms of
theTNF gene and the TNF receptor superfamily member 1B
gene are associated with susceptibility to ulcerative colitis
and Crohn's disease, respectively. Immunogenetics 2002,
53:1020-1027.
62. Morita C, Horiuchi T, Tsukamoto H, Hatta N, Kikuchi Y, Arinobu Y,
Otsuka T, Sawabe T, Harashima S, Nagasawa K, et al.: Association
of tumor necrosis factor receptor type II polymorphism
196R with systemic lupus erythematosus in the Japanese:
molecular and functional analysis. Arthritis Rheum 2001,
44:2819-2827.
63. Held W, MacDonald HR, Weissman IL, Hess MW, Mueller C: Genes
encoding tumor necrosis factor alpha and granzyme A are
expressed during development of autoimmune diabetes.
Proc Natl Acad Sci USA 1990, 87:2239-2243.
64. Jinchuan Y, Zonggui W, Jinming C, Li L, Xiantao K: Upregulation of
CD40-CD40 ligand system in patients with diabetes mellitus.
Clin Chim Acta 2004, 339:85-90.
65. Xu Y, Song G: The role of CD40-CD154 interaction in cell
immunoregulation. J Biomed Sci 2004, 11:426-438.
66. Zalloua PA, Abchee A, Shbaklo H, Zreik TG, Terwedow H, Halaby G,
Azar ST: Patients with early onset of type 1 diabetes have sig-
nificantly higher GG genotype at position 49 of the CTLA4
gene. Hum Immunol 2004, 65:719-724.
67. Noble JA, White AM, Lazzeroni LC, Valdes AM, Mirel DB, Reynolds
R, Grupe A, Aud D, Peltz G, Erlich HA: A polymorphism in the
TCF7 gene, C883A, is associated with type 1 diabetes. Diabe-
tes 2003, 52:1579-1582.
68. Todd JA, Wicker LS: Genetic protection from the inflamma-
tory disease type 1 diabetes in humans and animal models.
Immunity 2001, 15:387-395.
69. Harjacek M, az-Cano S, De MM, Wolfe H, Maldonado CA, Rabinovich
GA: Expression of galectins-1 and -3 correlates with defective
mononuclear cell apoptosis in patients with juvenile idio-
pathic arthritis. J Rheumatol 2001, 28:1914-1922.
70. Ohshima S, Kuchen S, Seemayer CA, Kyburz D, Hirt A, Klinzing S,
Michel BA, Gay RE, Liu FT, Gay S, et al.: Galectin 3 and its binding
protein in rheumatoid arthritis. Arthritis Rheum 2003,
48:2788-2795.
71. Tak PP, Spaeny-Dekking L, Kraan MC, Breedveld FC, Froelich CJ,
Hack CE: The levels of soluble granzyme A and B are elevated
in plasma and synovial fluid of patients with rheumatoid
arthritis (RA). Clin Exp Immunol 1999, 116:366-370.
72. Masuda K, Masuda R, Neidhart M, Simmen BR, Michel BA, Muller-Lad-
ner U, Gay RE, Gay S: Molecular profile of synovial fibroblasts
in rheumatoid arthritis depends on the stage of proliferation.
Arthritis Res 2002, 4:R8.
73. Garred P, Madsen HO, Petersen J, Marquart H, Hansen TM, Freiesle-
ben Sorensen S, Volck B, Svejgaard A, Andersen V: CC chemokine
receptor 5 polymorphism in rheumatoid arthritis. J Rheumatol
1998, 25:1462-1465.
74. Jawaheer D, Li W, Graham RR, Chen W, Damle A, Xiao X, Monteiro
J, Khalili H, Lee A, Lundsten R, et al.: Dissecting the genetic com-
plexity of the association between human leukocyte antigens
and rheumatoid arthritis. Am J Hum Genet 2002, 71:585-594.
75. Finnegan A, Grusby MJ, Kaplan CD, O'Neill SK, Eibel H, Koreny T,
Czipri M, Mikecz K, Zhang J: IL-4 and IL-12 regulate proteogly-
can-induced arthritis through Stat-dependent mechanisms.
J Immunol 2002, 169:3345-3352.
76. Boyton RJ, Davies S, Marden C, Fantino C, Reynolds C, Portugal K,
Dewchand H, Altmann DM: Stat4-null non-obese diabetic mice:
protection from diabetes and experimental allergic enceph-
R54.18 Genome Biology 2006, Volume 7, Issue 7, Article R54 Pfoertner et al. />Genome Biology 2006, 7:R54
alomyelitis, but with concomitant epitope spread. Int Immunol
2005, 17:1157-1165.
77. Chitnis T, Najafian N, Benou C, Salama AD, Grusby MJ, Sayegh MH,
Khoury SJ: Effect of targeted disruption of STAT4 and STAT6
on the induction of experimental autoimmune
encephalomyelitis. J Clin Invest 2001, 108:739-747.
78. Amersham Biosciences: CodeLink Activated Slides: User Guide Amer-
sham Biosciences, Freiburg, Germany; 2003.
79. Battaglia C, Salani G, Consolandi C, Bernardi LR, De BG: Analysis of
DNA microarrays by non-destructive fluorescent staining
using SYBR green II. Biotechniques 2000, 29:78-81.
80. Kane MD, Jatkoe TA, Stumpf CR, Lu J, Thomas JD, Madore SJ:
Assessment of the sensitivity and specificity of oligonucle-
otide (50 mer) microarrays. Nucleic Acids Res 2000,
28:4552-4557.
81. GBF array website [ />82. Eberwine J, Yeh H, Miyashiro K, Cao Y, Nair S, Finnell R, Zettel M,
Coleman P: Analysis of gene expression in single live neurons.
Proc Natl Acad Sci USA 1992, 89:3010-3014.
83. Tusher VG, Tibshirani R, Chu G: Significance analysis of micro-
arrays applied to the ionizing radiation response. Proc Natl
Acad Sci USA 2001, 98:5116-5121.
84. Zelenika D, Adams E, Humm S, Graca L, Thompson S, Cobbold SP,
Waldmann H: Regulatory T cells overexpress a subset of Th2
gene transcripts. J Immunol 2002, 168:1069-1079.
85. Sturn A, Quackenbush J, Trajanoski Z: Genesis: cluster analysis of
microarray data. Bioinformatics 2002, 18:207-208.
86. Pati N, Schowinsky V, Kokanovic O, Magnuson V, Ghosh S: A com-
parison between SNaPshot, pyrosequencing, and biplex
invader SNP genotyping methods: accuracy, cost, and
throughput. J Biochem Biophys Methods 2004, 60:1-12.
87. Browning MB, Woodliff JE, Konkol MC, Pati NT, Ghosh S, Truitt RL,
Johnson BD: The T cell activation marker CD150 can be used
to identify alloantigen-activated CD4(+)25+ regulatory T
cells. Cell Immunol 2004, 227:129-139.
88. Baecher-Allan C, Viglietta V, Hafler DA: Human CD4+CD25+ reg-
ulatory T cells. Semin Immunol 2004, 16:89-98.
89. Kohm AP, Williams JS, Miller SD: Cutting edge: ligation of the
glucocorticoid-induced TNF receptor enhances autoreac-
tive CD4+ T cell activation and experimental autoimmune
encephalomyelitis. J Immunol 2004, 172:4686-4690.
90. Huehn J, Siegmund K, Lehmann JC, Siewert C, Haubold U, Feuerer M,
Debes GF, Lauber J, Frey O, Przybylski GK, et al.: Developmental
stage, phenotype, and migration distinguish naive- and effec-
tor/memory-likeCD4+ regulatory T cells. J Exp Med 2004,
199:303-313.
91. Walker LS: CD4+ CD25+ Treg: divide and rule? Immunology
2004, 111:129-137.
92. Piccirillo CA, Thornton AM: Cornerstone of peripheral
tolerance: naturally occurring CD4+CD25+ regulatory T
cells. Trends Immunol 2004, 25:374-380.
93. Fantini MC, Becker C, Monteleone G, Pallone F, Galle PR, Neurath
MF: Cutting edge: TGF-beta induces a regulatory phenotype
in CD4+. J Immunol 2004, 172:5149-5153.
94. Kasow KA, Chen X, Knowles J, Wichlan D, Handgretinger R, Riberdy
JM: Human CD4+CD25+ regulatory T cells share equally
complex and comparable repertoires with CD4+. J Immunol
2004, 172:6123-6128.
95. Buer J, Lanoue A, Franzke A, Garcia C, von BH, Sarukhan A: Inter-
leukin 10 secretion and impaired effector function of major
histocompatibility complex class II-restricted T cells aner-
gized in vivo. J Exp Med 1998, 187:177-183.
96. McHugh RS, Whitters MJ, Piccirillo CA, Young DA, Shevach EM, Col-
lins M, Byrne MC: CD4(+)CD25(+) immunoregulatory T cells:
gene expression analysis reveals a functional role for the glu-
cocorticoid-induced TNF receptor. Immunity 2002, 16:311-323.
97. Sakaguchi S: Control of immune responses by naturally arising
CD4+ regulatory T cells that express toll-like receptors. J Exp
Med 2003, 197:397-401.
98. Sakaguchi S, Sakaguchi N, Shimizu J, Yamazaki S, Sakihama T, Itoh M,
Kuniyasu Y, Nomura T, Toda M, Takahashi T: Immunologic toler-
ance maintained by CD25+ CD4+ regulatory T cells: their
common role in controlling autoimmunity, tumor immu-
nity, and transplantation tolerance. Immunol Rev 2001,
182:18-32.
99. Shevach EM: CD4+ CD25+ suppressor T cells: more questions
than answers. Nat Rev Immunol 2002, 2:389-400.
100. Stassen M, Fondel S, Bopp T, Richter C, Muller C, Kubach J, Becker
C, Knop J, Enk AH, Schmitt S, et al.: Human CD25+ regulatory T
cells: two subsets defined by the integrins alpha 4 beta 7 or
alpha 4 beta 1 confer distinct suppressive properties upon
CD4+ T helper cells. Eur J Immunol 2004, 34:1303-1311.
101. Cobbold SP, Nolan KF, Graca L, Castejon R, Le MA, Frewin M, Humm
S, Adams E, Thompson S, Zelenika D, et al.: Regulatory T cells and
dendritic cells in transplantation tolerance: molecular mark-
ers and mechanisms. Immunol Rev 2003, 196:109-124.
102. Kingsley CI, Karim M, Bushell AR, Wood KJ: CD25+CD4+ regula-
tory T cells prevent graft rejection: CTLA-4- and IL-10-
dependent immunoregulation of alloresponses. J Immunol
2002, 168:1080-1086.
103. Gene Expression Omnibus [ />projects/geo/]