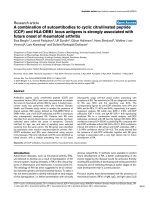
Báo cáo y học: "Design principles of molecular networks revealed by global comparisons and composite motifs" pdf
Bạn đang xem bản rút gọn của tài liệu. Xem và tải ngay bản đầy đủ của tài liệu tại đây (341.63 KB, 11 trang )
Genome Biology 2006, 7:R55
comment reviews reports deposited research refereed research interactions information
Open Access
2006Yuet al.Volume 7, Issue 7, Article R55
Research
Design principles of molecular networks revealed by global
comparisons and composite motifs
Haiyuan Yu
¤
, Yu Xia
¤
, Valery Trifonov and Mark Gerstein
Address: Department of Molecular Biophysics and Biochemistry, Whitney Avenue, Yale University, New Haven, CT 06520, USA.
¤ These authors contributed equally to this work.
Correspondence: Mark Gerstein. Email:
© 2006 Yu et al.; licensee BioMed Central Ltd.
This is an open access article distributed under the terms of the Creative Commons Attribution License ( which
permits unrestricted use, distribution, and reproduction in any medium, provided the original work is properly cited.
Molecular network principles<p>A global comparison of the four basic molecular networks in yeast - regulatory, co-expression, interaction and metabolic - reveals gen-eral design principles.</p>
Abstract
Background: Molecular networks are of current interest, particularly with the publication of
many large-scale datasets. Previous analyses have focused on topologic structures of individual
networks.
Results: Here, we present a global comparison of four basic molecular networks: regulatory, co-
expression, interaction, and metabolic. In terms of overall topologic correlation - whether nearby
proteins in one network are close in another - we find that the four are quite similar. However,
focusing on the occurrence of local features, we introduce the concept of composite hubs, namely
hubs shared by more than one network. We find that the three 'action' networks (metabolic, co-
expression, and interaction) share the same scaffolding of hubs, whereas the regulatory network
uses distinctly different regulator hubs. Finally, we examine the inter-relationship between the
regulatory network and the three action networks, focusing on three composite motifs - triangles,
trusses, and bridges - involving different degrees of regulation of gene pairs. Our analysis shows
that interaction and co-expression networks have short-range relationships, with directly
interacting and co-expressed proteins sharing regulators. However, the metabolic network
contains many long-distance relationships: far-away enzymes in a pathway often have time-delayed
expression relationships, which are well coordinated by bridges connecting their regulators.
Conclusion: We demonstrate how basic molecular networks are distinct yet connected and well
coordinated. Many of our conclusions can be mapped onto structured social networks, providing
intuitive comparisons. In particular, the long-distance regulation in metabolic networks agrees with
its counterpart in social networks (namely, assembly lines). Conversely, the segregation of
regulator hubs from other hubs diverges from social intuitions (as managers often are centers of
interactions).
Published: 19 July 2006
Genome Biology 2006, 7:R55 (doi:10.1186/gb-2006-7-7-r55)
Received: 16 March 2006
Revised: 19 May 2006
Accepted: 20 June 2006
The electronic version of this article is the complete one and can be
found online at />R55.2 Genome Biology 2006, Volume 7, Issue 7, Article R55 Yu et al. />Genome Biology 2006, 7:R55
Background
Traditionally, each protein has been studied individually as a
fundamental functioning element within the cell. In the post-
genomic era, however, proteins are often viewed and studied
as interoperating components within larger cooperative net-
works [1]. Biological networks are topics of great current
interest. With the publication of a number of large genome-
wide expression, interaction, regulatory and metabolic data-
sets, especially in yeast [2-9], we can now construct four net-
works representing these four processes (see Materials and
methods; Figure 1a).
Importance of the four networks
We chose these four networks because they are the most com-
monly studied networks in yeast and because they can be eas-
ily related to the central dogma of molecular biology, which
describes the basic (genetic) information flow in a cell. There
are also other types of biological networks, such as synthetic
lethal networks and chromosomal order networks [10,11];
however, these networks do not overlap with the central
dogma and are, therefore, not the focus of this paper. Further-
more, most of these networks are not suitable for large-scale
topological analysis because we do not have enough informa-
tion on them.
Another important reason for us to choose these four net-
works is that there are many appealing analogies between
these biological networks and corresponding social networks
[12-14]. Because people have clear intuition for social net-
works, based on daily experiences, these analogies can make
molecular networks easier to comprehend. For example,
social hierarchy networks resemble the regulatory networks
in that they define who has to obey orders from whom. Social
acquaintance networks describe who is known to whom in the
society and are, therefore, similar to interaction networks in
biology [13,14]. Finally, enzymes at different steps of the met-
abolic network can be considered as workers at different steps
of the assembly line in a factory.
Composite features in combined networks
Individual networks have been globally characterized by a
variety of graph-theoretic statistics (Additional data file 1),
such as degree distribution, clustering coefficient (C), charac-
teristic path length (L) and diameter (D) [12,15,16]. Barabási
and Albert [12] proposed a 'scale-free' model in which most of
the nodes have very few links, with only a few of them (hubs)
being highly connected. In addition to topological statistics
and hubs, network motifs provide another important sum-
mary of networks. These are over-represented sub-graph pat-
terns in networks, and they are considered as basic building
blocks of large-scale network structures [17]. Recently, Yeger-
Lotem et al. [18] combined the interaction and regulatory
networks in yeast and searched for patterns in the combined
network.
Here, we build on previous network studies and extend them
in novel directions by combining all four networks in our
analysis. Our goal is to examine the topological features of our
combined network. We call these 'composite features' to dis-
tinguish them from those in single networks (see Materials
and methods). By analyzing these in all four networks, we
were able to find some basic principles characterizing biolog-
ical networks. For example, previous studies have shown
most biological networks are scale-free, having only a few
hubs as the most important and vulnerable points [12,15]. It
is quite reasonable to assume that our four networks will
share the same set of hubs as explained in detail below. How-
ever, we analyzed the composite hubs among the four net-
works and showed that the regulatory network tends to use a
distinctly different set of hubs compared to the other three
networks. Furthermore, one fundamental question in biology
is how the cell uses transcription factors (TFs) to regulate and
coordinate the expression of thousands of genes in response
to internal and external stimuli [8,19-21]. Through examining
composite motifs, we could potentially shed some light on
this question. In particular, we show that the expression of
enzymes at different steps of the same pathway tends to have
time-delayed relationships mediated by inter-regulating TFs.
Results and discussion
Overall comparisons of all four networks
We calculated many topological statistics in all four networks,
which are summarized in Figure 1a. All four networks display
'scale-free' and 'small-world' properties. However, the regula-
tory network is different from other networks in that its clus-
tering coefficient is exceptionally small. This is because most
of the target genes are not TFs. Therefore, the target genes of
the same regulator tend not to inter-regulate one another.
Moreover, since the regulatory network is directed, it is
divided into regulator and target sub-networks when calcu-
lating the degree distribution. It has been shown that the reg-
ulator network is a scale-free network. But, the target network
might have an exponential degree distribution, instead [22].
This means that there are no hubs in the target network.
Therefore, when we examined the hubs and composite hubs
in the regulatory network, we focused only on the regulator
population. This also makes sense biologically, because we
are more interested in how a gene's expression is regulated in
different networks; the regulators (that is, TFs) are the ones
that carry out the regulatory functions.
Furthermore, we analyzed the relationships between differ-
ent networks. Since the relative position of nodes in a network
is one of the most important features of the network, we
examined the relationships between networks using their dis-
tance matrices, that is, distances between all protein pairs.
We divided all pairs of proteins in a network into three
groups: connected pairs; close pairs (distance = 2); and dis-
tant pairs (distance ≥3). We used Cramer's V, a measurement
derived from χ
2
statistics, to examine the association between
Genome Biology 2006, Volume 7, Issue 7, Article R55 Yu et al. R55.3
comment reviews reports refereed researchdeposited research interactions information
Genome Biology 2006, 7:R55
networks, that is, whether pairs of proteins in one group of a
network tend to be in the same group of another network. Our
calculations confirm that all networks are indeed significantly
related to each other (Figure 1b). We also tried many other
metrics of relatedness - for example, Pearson correlation
coefficient, mutual information, contingency coefficient, and
association score. They all show similar results (see Supple-
mentary Table 1 in Additional data file 1).
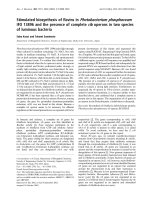
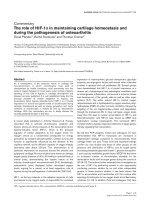
Global comparison of all four networksFigure 1
Global comparison of all four networks. (a) Topological statistics of all four networks. Because the degrees in the metabolic network are not divided into
outward and inward degrees, we treated the metabolic network as an undirected network when calculating the average degree. (b) Association diagram
between all four networks. The association between networks is measured by Cramer's V. The thickness of the line between two networks is
proportional to the corresponding V. P values are calculated using standard χ
2
tests.
Interaction
Regulation
Metabolism
Expression
P < 10
-118
0.293
P < 10
-118
0.051
P < 10
-118
0.080
P < 10
-117
0.064
P < 10
-108
0.049
P < 10
-118
0.059
(a)
(b)
α Y
5,205 70,201 2,542 1.358 26.97 0.3585 5.518 19
4,743 23,294 2,601 1.588 9.822 0.2321 4.358 11
852 5,933 486.6 1.341 13.93 0.434 4.659 20
Regulator
248 16.01 0.5835 29.14
Target
902.2 ,2713
Power-law distribution
N
= α K
-γ
7,231
Network
Type
undirected
directed
Average
degree
(K )
Clustering
coefficient
(C )
Characteristic
path length ( L )
Diameter
(D )
9
Number of
proteins
(N )
Number
of links
Metabolism
Regulation 0.1087 3.766
Network name
Expression
Interaction
R55.4 Genome Biology 2006, Volume 7, Issue 7, Article R55 Yu et al. />Genome Biology 2006, 7:R55
Composite hubs tend to be more essential than hubs in
single networks
Previous studies have shown that hubs are the scaffolding of
scale-free networks with great importance for their stability
[12]. In particular, hubs in interaction networks tend to be
essential [15], and they tend to be more conserved through
evolution than non-hubs [23]. Therefore, we next examined
the fraction of essential genes among hubs and non-hubs in
different networks. Not surprisingly, hubs in all networks
tend to be essential (Figure 2a; here we only consider the reg-
ulator population within the regulatory network). The results
agree well with previous studies [15,24]. Furthermore, we
analyzed the essentiality of composite hubs. Figure 2b clearly
shows that, while hubs in single networks (that is, normal
hubs) tend to be essential compared with non-hubs, compos-
ite hubs have an even higher tendency to be essential than
normal hubs. Due to the essentiality of normal hubs, compos-
ite hubs should be more essential (Additional data file 1),
which agrees well with our observation. Because of the lim-
ited statistics, we cannot determine whether there are addi-
tional reasons for the increased tendency of composite hubs
to be essential (Supplementary Figure 1 in Additional data file
1).
In our analysis, composite hubs can be either bi-hubs (hubs in
two of the four networks) or tri-hubs (hubs in three of the four
networks). We identified hubs and composite hubs in all four
networks (Figure 3a). Considering only the regulator popula-
tion of the regulatory network, we were able to identify 334
bi-hubs and 23 tri-hubs. For example, GCN4 is a tri-hub
involving interaction, co-expression, and regulatory net-
works. Gcn4p is a master regulator of amino acid biosynthetic
genes in response to starvation and stress, with 111 known
targets [25]. It is known to interact specifically with RNA
polymerase II holoenzymes, Adap-Gcn5p co-activator com-
plex, and many other proteins (16 in total) [26]. GCN4 was
also co-expressed with 134 other genes in the cell-cycle exper-
iments of Cho et al. [6]. No proteins are hubs in all four net-
works, because most enzymes are not TFs. Finally, we can
show that the structure of biological networks in yeast is very
different from the most obviously corresponding structures
in social networks.
Scaffolding of the regulatory network is different from
other networks
Because all four biological networks are scale-free (Figure 1a;
here we only consider the regulator population within the reg-
ulatory network), it can be shown that they should share the
same hubs by chance alone due to hubs' essentiality (Addi-
tional data file 1). It is interesting to see whether this is indeed
the case for biological networks, that is, whether they are built
on the same scaffolding.
Our calculation shows that the scaffolding of three networks
(metabolic, interaction and co-expression) tends to be the
same, that is, hubs in one network tend to overlap with those
in another when compared to random expectation (Figure
3b). The results agree with previous studies showing that
interacting proteins tend to be co-expressed [27-30]. Further-
more, we calculated the random expectation by taking into
consideration the fact that hubs tend to be essential [15,24].
We found that the hub overlap between networks could not be
explained by simply considering the essentiality of hubs (Sup-
plementary Figure 2 in Additional data file 1).
Surprisingly, hubs in the regulator network do not have the
tendency to be hubs in other networks. Though counter-intu-
itive, this observation is reasonable in that most TFs and their
targets do not tend to be co-expressed [31], and most TFs are
unlikely to interact with their targets. Therefore, we divided
the four networks into two classes: regulation and action. The
action networks include the interaction, co-expression and
metabolic networks. It is clear that the cell separates the
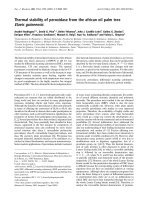
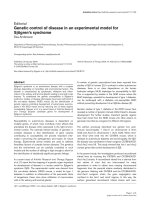
Analysis of the essentiality of hubs and composite hubsFigure 2
Analysis of the essentiality of hubs and composite hubs. (a) Comparison of
the percentages of essential genes in hubs and non-hubs in different
networks. P values measure the significance of differences between the
percentages for hubs and non-hubs. (b) Comparison of the percentages of
essential genes in non-hubs, hubs and composite hubs. In this figure, we
excluded all composite hubs when calculating the percentage for hubs.
Due to the limited number of tri-hubs, we combined them with bi-hubs. P
values measure the significance of the differences between neighboring
bars. Met, the metabolic network; Int, the interaction network; Exp, the
co-expression network; and Reg, the regulatory network (in Figures 2 and
3, we only consider the regulator population in the regulatory network).
0%
5%
10%
15%
20%
25%
30%
35%
Non-hubs Hubs Composite hubs
Percentage of essential genes
P ~ 0
(b)
P < 0.05
0%
10%
20%
30%
40%
50%
60%
70%
80%
90%
Exp Int Met Reg
Percentage of essential genes
Hubs
Non-hubs
P < 0.02
P < 10
-20
P < 10
-11
P < 0.04
(a)
Genome Biology 2006, Volume 7, Issue 7, Article R55 Yu et al. R55.5
comment reviews reports refereed researchdeposited research interactions information
Genome Biology 2006, 7:R55
regulatory network from the action networks. Since all action
networks are governed by the regulatory network as dis-
cussed below, the separation potentially could provide stabil-
ity to the cell (Supplementary Figure 5 in Additional data file
1).
Here we have excluded the comparison between regulator
and metabolic networks because the two networks only share
one common protein. It is possible to argue that our defini-
tion of hubs is somewhat arbitrary. But all results remain the
same even when we used different cutoffs to define hubs. We
further tested the functional composition of the overlapping
proteins among networks, which is similar to that of each
individual network and random expectation (Supplementary
Figures 3 and 4 in Additional data file 1).
Neighboring pairs in all action networks are co-
regulated
Above, we separated the regulatory network from the others;
now we show that the three action networks can be further
subdivided into two groups (that is, short-range and long-
range) based on how the genes in them are regulated by TFs.
We investigated this through looking at composite motifs
within the combined regulatory-action network. We focused
on a few key motifs, which we call triangles, trusses, and
bridges (see Materials and methods).
In a triangle, two genes (P1 and P2) are co-regulated by the
same regulator (TF). Therefore, triangles should tend to occur
between co-expressed gene pairs (Figure 4a). Since interact-
ing proteins and co-enzymes are known to be co-expressed
[20,30], we expected to see that triangles are enriched
between the connected pairs in all three combined networks.
Our results confirmed this expectation in that the percentage
of triangles between connected pairs in all three networks are
significantly higher than random, while the percentage
between disconnected pairs is equal to or even lower than
random (Figure 4a). In other words, connected pairs in all
three networks tend to be co-regulated, which is in agreement
with our expectation and with previous studies [20,30,31].
In a truss, two proteins share the same feed-forward loop
(FFL; Figure 4b). FFLs are robust against noise [32]. Previous
work has also shown that genes co-regulated by more than
one regulator tend to be tightly co-expressed [31]. Therefore,
trusses are designed to maintain stable co-expression
between gene pairs. Their biological function is similar to that
of triangles.
We examined the distributions of the enrichment of trusses in
all three combined networks. As expected, the three distribu-
tions share similar patterns with that of triangles (Figures
4a,b). In all distributions, only connected pairs show enrich-
ment of trusses, which further confirms the biological func-
tion of trusses. Given the fact that the regulatory network in
yeast is far from complete, we believe that many actual
Analysis of hub overlapsFigure 3
Analysis of hub overlaps. (a) Venn diagram describing hub overlaps
between networks. Shaded areas represent composite hubs. (b) Fold
enrichments of hub overlaps (O) between two networks relative to
random expectation. The bars above the line (where O = 1) show that
overlapping hubs between the two networks are more than expected. The
schematic above the first three bars shows that action networks tend to
share the same hubs. One of the tri-hubs is Idh1p, an isocitrate
dehydrogenase involved in the tricarboxylic acid cycle connecting a
number of different pathways [7]. It is also involved in a number of
complexes, and is thus co-expressed with many other genes [5,6,40,49]. In
this schematic, the solid circle represents the composite hub; open circles
represent different proteins; black solid lines represent interaction
relationships; red dashed lines represent co-expression relationships;
green dashed arrows represent metabolic reactions. The schematic above
the last two bars shows that the regulatory network uses a distinct set of
hubs. For example, Swi4p is a major TF regulating the yeast cell cycle [50].
However, it is not a hub in any of the action networks. In this schematic,
the solid circle represents the regulatory hub; open circles represent
different proteins; black solid arrows represent regulatory relationships. P
values measure the significance of the differences between the observed
overlaps and the random expectation. The random expectation was
calculated as described in Materials and methods. P values in this figure and
all following figures were calculated using the cumulative binomial
distribution (Additional data file 1). Met, the metabolic network; Int, the
interaction network; Exp, the co-expression network; and Reg, the
regulatory network (in Figures 2 and 3, we only consider the regulator
population in the regulatory network).
0
0.5
1
1.5
2
2.5
3
Met-Int Exp-Int Exp-Met Exp-Reg Int-Reg
O
P < 10
-9
P < 10
-12
P < 0.02
P = 0.62 P = 0.42
663
Int
Exp
1
741
511
33
249
22
43
26
84
Met
Reg
(a)
(b)
IDH1
SWI4
R55.6 Genome Biology 2006, Volume 7, Issue 7, Article R55 Yu et al. />Genome Biology 2006, 7:R55
Figure 4 (see following page)
0%
1%
2%
3%
4%
1 10 100
Distance ( k )
F
0%
20%
40%
60%
1 10 100
Distance ( k )
F
IntReg
MetReg
ExpReg
(a)
0%
5%
10%
15%
1 10 100
Distance ( k )
F
(c)
TF
P1
P2
k
T2
T1
P1
P2
k
T2
T1
P1
P2
k
(BAS1)
(ADE5,7)
(ADE8)
(MBP1)
(SWI4)
(CLN1)
(CLN2)
(RAP1)
(BDF1)
(RPL3)
(RPL9A)
(b)
Genome Biology 2006, Volume 7, Issue 7, Article R55 Yu et al. R55.7
comment reviews reports refereed researchdeposited research interactions information
Genome Biology 2006, 7:R55
trusses are missed by our analysis because some of the edges
are missing in our dataset. To confirm this, we also looked at
semi-trusses. A semi-truss is a truss with only one FFL (Fig-
ure 4c). We believe that many of these semi-trusses are actu-
ally full trusses given the incomplete nature of our dataset.
Figure 4c shows highly similar results to those in Figure 4b,
thus providing support for our conclusion.
Interestingly, it has been shown experimentally that triangles
and trusses can also generate temporal programs of expres-
sion by having serial activation coefficients with different tar-
gets, which is quite intuitive and reasonable [33,34]. It should
also be noted that some FFLs ('incoherent FFLs') could pro-
vide pulses and speeding responses, although the majority of
FFLs are coherent, acting as 'persistence detectors' [35,36].
Distant enzymes in the same pathway tend to have
delayed expressions mediated by regulator bridges
In a bridge, protein P1 and regulator T2 are co-regulated by T1
and, thus, should be co-expressed. Only after the gene of T2 is
expressed (transcribed) and translated can the protein prod-
uct of T2 then bind to P2 and activate its expression. There-
fore, the expressions of P1 and P2 should not be
simultaneous, but rather have a time delay (Supplementary
Figure 9 in Additional data file 1). We expected that bridges
would tend to occur between gene pairs that are closely func-
tionally related, but not necessarily co-expressed. We calcu-
lated the distributions of the occurrence of bridges between
gene pairs with different distances in all three combined net-
works, (Figure 5a). The results are rather surprising, since, in
interaction and co-expression networks, the tendency of
forming bridges between protein pairs decreases as their
distance increases. However, the tendency of forming bridges
remains the same for enzymes with different distances in the
same metabolic pathways. The tendency stays significantly
higher than random even for far-away pairs (Supplementary
Table 3 in Additional data file 1). Clearly, genes in the interac-
tion and co-expression networks only have short-range regu-
latory relationships, whereas genes in the metabolic networks
have long-range ones. (Another unlikely but possible hypoth-
esis for this result is that there is a subtle bias in the metabolic
network since it was mapped mostly based on small-scale
experiments, unlike interaction and co-expression networks.)
We then analyzed the composite motifs in the combined
metabolism-co-expression network. Figure 5b shows that co-
enzymes tend to be co-expressed, and the tendency of co-
expression decreases as the distance between the enzymes
increases. On the other hand, enzymes in different steps of
the same pathway tend to have expression relationships other
than co-expression, typically time-delayed relationships
(Supplementary Figure 7c in Additional data file 1). This ten-
dency increases as the distance increases. The likelihood for
far-away enzymes in the same pathway to have other expres-
sion relationships is significantly higher than random
expectation. This observation shows that enzymes in the
same pathway are not necessarily co-expressed; nevertheless,
their expression needs to be well-coordinated for the whole
pathway to function normally. This is the reason why bridges
are enriched in disconnected enzyme pairs in the metabolic
network (Figure 5a). Similar results were also found in other
time-course expression experiments [37], but not in the inter-
action network (Additional data file 1). This conclusion is fur-
ther supported by a specific case study in Escherichia coli
amino acid biosynthesis pathways [33]. As we mentioned
above, metabolic pathways in the cell are very similar to
assembly lines in a factory. It is reasonable to assume that,
without decreasing the efficiency of the whole assembly line,
workers at downstream steps of the line do not have to show
up for work until those at upstream steps have finished their
job. Similarly, in terms of metabolic pathways, we observed
that enzymes at downstream steps tend to be expressed after
those at earlier steps. The bridge motifs are designed to man-
age such expression relationships between enzymes, and,
therefore, to maintain normally functioning metabolic path-
ways in the cell.
Conclusion
Here we examine the four most commonly studied networks
in yeast. Previous work has shown that social networks share
common characteristics with biological networks [12-14]. Our
results further confirm this. In particular, many common
social networks are related. We also found that biological net-
works, even though seemingly quite different, are clearly
related to each other. In social networks, people under the
same supervisor normally know each other, and, as such, may
Fraction (F) of all P1-P2 pairs at distance k in a given combined network in a particular composite motifFigure 4
Fraction (F) of all P1-P2 pairs at distance k in a given combined network in a particular composite motif. Horizontal dashed lines indicate the random
expectation. Vertical dashed lines indicate connected pairs in combined networks. (a) Triangles. The schematic shows that a triangle consists of three
proteins: the common regulator TF regulates both P1 and P2. In all schematics, circles represent TFs, and rectangles represent non-TF genes. For example,
ADE5, 7 and ADE8 are two subsequent enzymes in the purine biosynthesis pathway [7]. They are co-regulated by BAS1 [51]. (b) Trusses. The schematic
shows that a truss consists of four proteins: T1 regulates T2, P1 and P2; T2 regulates P1 and P2. For example, Cln1p and Cln2p are two subunits of the
CDC28-associated complex [4]. They are co-regulated by Mbp1p and Swi4p [52]. Mbp1p also regulates SWI4 [8,53]. (c) Semi-trusses. A semi-truss is an
incomplete truss: either T2 does not regulate P1, or T1 does not regulate P2. For example, RPL3 and RPL9A, components of the ribosome large subunit,
are co-expressed [6]. They are co-regulated by Bdf1p [54]. Rap1p regulates both RPL3 and BDF1 [8,55]. We also examined the occurrence of triangles and
trusses between protein pairs connected in more than one network, termed highly combined networks. We only considered semi-trusses to get better
statistics, since the number of full trusses in highly combined networks is too small to be used. In all highly combined networks, triangles and semi-trusses
are enriched between protein pairs connected in more than one network (Figure 8 in Additional data file 1). Met, the metabolic network; Int, the
interaction network; Exp, the co-expression network; and Reg, the regulatory network.
R55.8 Genome Biology 2006, Volume 7, Issue 7, Article R55 Yu et al. />Genome Biology 2006, 7:R55
be said to be connected in acquaintance networks. Accord-
ingly, in the biological networks, we observed that connected
pairs in action networks tend to be co-regulated. More inter-
estingly, distant enzymes in the same pathway show a sur-
prising tendency to have delayed expression coordinated by
regulator bridges. Although this phenomenon is readily
understandable through an analogy to assembly lines, it is
still striking to see it so strongly manifest in real biological
networks. However, the structure of biological networks obvi-
ously has some differences from that of social networks. In a
normal social context, it is reasonable to assume that a super-
visor knows his or her staff. Therefore, supervisors with large
staffs (that is, hubs in the social hierarchy) tend to be hubs in
acquaintance networks. This is not the case for biological net-
works: the regulatory network uses a different set of hubs
than the action networks.
Recently, Mazurie et al. [38] also analyzed the composite net-
work motifs in the combined regulatory and interaction net-
work. They used a similar approach to Yeger-Lotem et al. [18]
and examined the composite motifs that are over-represented
in a strictly mathematical sense. However, they found that the
overabundance of these network motifs "does not have any
immediate functional or evolutionary counterpart" [38].
These findings confirm that we should not only look at the
most mathematically over-represented motifs, but that we
should also focus on key, obviously functionally relevant
ones, further highlighting the importance of our approach. In
our analysis, we first identified composite motifs that could
potentially have biological functions and examined the
enrichment of these motifs in the combined network. Our
results have clearly shown that the enrichment of some com-
posite motifs is closely related with their function. For exam-
ple, bridges are only enriched between far-away enzymes in
the same pathway because the expression of these enzymes
needs to be well coordinated.
Materials and methods
Biological networks
The regulatory network was created by combining five differ-
ent datasets [8,9,22,31,39,40]. A link in the network is
defined as a TF-target pair. We excluded DNA-binding
enzymes (for example, PolIII) and general TFs (for example,
TATA-box-binding protein) from the regulatory network.
The co-expression network was created using the microarray
dataset of Cho et al. [6]. A link here is defined as a co-
expressed gene pair with a correlation coefficient larger than
or equal to 0.8. It is possible to argue that the cutoff (0.8) here
is somewhat arbitrary. We repeated all relevant calculations
using different cutoffs ranging from 0.5 to 0.9. All results
remained the same (Additional data file 1).
The interaction network was created by combining various
databases and large-scale experiments [2-5,41-43]. Because
large-scale experiments are known to be error-prone [44], we
only considered high-confidence protein pairs as true inter-
acting pairs (likelihood ratios ≥300, P value < 10
-200
as esti-
mated by the hypergeometric distribution; likelihood ratios
measure the enrichment of interacting protein pairs with cer-
tain genomic features [45]; see Additional data file 1 for a
detailed discussion).
Fraction (F) of all P1-P2 pairs at distance k in a given combined network in a particular composite motifFigure 5
Fraction (F) of all P1-P2 pairs at distance k in a given combined network in
a particular composite motif. Horizontal dashed lines indicate the random
expectation. (a) Bridges. The schematic shows that a bridge consists of
four proteins: T1 regulates T2 and P1; T2 regulates P2. For example, Fol2p
and Pho8p are two subsequent enzymes involved in the folate biosynthesis
pathway [7]. FOL2 is regulated by Yox1p [9]. PHO8 is regulated by Pho4p
[56]. Yox1p also regulates PHO4 [9]. The P value in the figure indicates the
significance of the different between the fraction of bridges between all
disconnected enzyme pairs and the random expectation (Table 3 in
Additional data file 1). The regression equation for Met-Reg: F = 0.003k +
0.18; R = 0.56; P < 0.01. The regression equation for Int-Reg: F = -0.01k +
0.19; R = 0.74; P < 10
-3
. The regression equation for Exp-Reg: F = -0.01k +
0.24; R = 0.93; P < 10
-9
. P values here measure the significance of the
correlation (R) in regression. (b) Composite motifs in the combined
network of Met-Exp (that is co-expression motifs and shifted motifs). The
schematic shows that composite motifs in Met-Exp consist of two
proteins: P1 and P2. P1 and P2 have a distance of k in the metabolic
network. They also have an expression relationship (co-expressed or
others) in the co-expression network. The P value indicates that the
fraction of protein pairs in shifted motifs in Met-Exp is significantly higher
than expected. The regression equation for Met-Exp: F = 0.002k + 0.0037;
R = 0.92; P < 10
-8
. Met, the metabolic network; Int, the interaction
network; Exp, the co-expression network; and Reg, the regulatory
network.
0%
2%
4%
6%
8%
10%
024681012
Distance ( k )
F
P < 10
-3
0%
20%
40%
60%
02468101214161
8
Distance ( k )
F
Int-Reg
Met-Reg
Exp-Reg
Co-expressed
Other relationships
P1
P2
k
Expression relationships
P < 10
-13
T2
T1
P1
P2
k
(PHO4)
(YOX1 )
(FOL2)
(PHO8)
(b)
(a)
Genome Biology 2006, Volume 7, Issue 7, Article R55 Yu et al. R55.9
comment reviews reports refereed researchdeposited research interactions information
Genome Biology 2006, 7:R55
The metabolic network was downloaded from the KEGG
database [7]. However, the metabolic network is different
from the other networks in that the nodes in the network are
small molecules and they are connected by the enzymatic
steps between them. To compare the metabolic network to
others, we transformed the network in the following way:
each enzyme was considered a node in the network, and
enzymes working on adjacent steps were considered 'con-
nected'. Whenever there is more than one enzyme in the same
enzymatic step (that is, co-enzymes), we also consider all co-
enzymes as 'connected'. Only main substrates and products
were used to perform the transformation. Most co-factors and
carriers (for example, ATP and H
2
O) were removed from all
reactions.
All four networks are available through our supplementary
website [46].
Composite topological features
Composite hubs
We define hubs in a single network as the top 20% of the
nodes with the highest degrees [19,24]. Accordingly, compos-
ite hubs are defined as the nodes that are hubs in more than
one network.
Composite motifs
Yeger-Lotem et al. [18] defined composite motifs operation-
ally as over-represented patterns in the combined network as
compared to a randomized control. Using this criterion, they
exhaustively searched through the combined network and
were able to detect 1 two-node, 5 three-node and 63 four-node
composite motifs. A similar study has also been performed by
Zhang et al. [47]. Instead of automated detection of new com-
posite motifs, we manually selected five basic composite
motifs for further analysis because, as discussed below, these
composite motifs summarize the most basic biological rela-
tionships between protein pairs within the four networks.
Our analysis covered all four biological networks. We ana-
lyzed not only nearest neighbors, but also protein pairs that
are further apart in each network. Most importantly, we were
able to gain significant insights into the biological functions of
the five composite motifs by comparing their patterns of
occurrence in the combined networks.
Definition of five composite motifs
We first examined the regulatory relationships between pro-
tein pairs in action networks and created three combined net-
works by combining the regulatory network with each of the
other three networks. We defined three biologically
meaningful composite motifs in all three combined networks,
based on the fact that co-regulation (that is, that two proteins
share the same regulator) and inter-regulation (that is, that
the regulator of one protein regulates the regulator of another
protein) are the two most basic regulatory relationships
between a pair of proteins. The three basic composite motifs
that we defined are: co-regulation motifs (triangles); inte-
grated FFLs (trusses); and bridging motifs (bridges) (Supple-
mentary Figure 6 in Additional data file 1). Yeger-Letem et al.
[18] determined that triangles and trusses are significantly
overrepresented motifs, but bridges are not. However, we are
able to show the biological importance of bridges in the main
discussion (see above).
We also created another combined network by combining the
co-expression and metabolic networks. Qian et al. [48] devel-
oped a local clustering method to detect four expression rela-
tionships between gene pairs: co-expressed, time-shifted,
inverted, and inverted time-shifted. Using the local clustering
method, we defined two composite motifs in this combined
network (Supplementary Figure 7 in Additional data file 1):
the co-expression motif, a pair of enzymes at distance k in the
metabolic network that are co-expressed; and the shifted
motif, a pair of enzymes at distance k in the metabolic net-
work that have expression relationships other than co-
expression. Most of these pairs have time-shifted
relationships.
For each of the above composite motifs, we determined its
degree of enrichment at different distances in different action
networks in the following way. We first counted the number
of protein pairs at a certain distance k in each of the three
action networks. Then, we calculated the fraction of pairs that
are within a certain composite motif.
Calculations of the random expectation of hub
overlaps
To calculate random expectation of hub overlaps, we first cre-
ated randomized networks for each biological network by
randomly shuffling node degrees among proteins throughout
the whole network. In this manner, the degree distributions
of the original networks are conserved in randomized net-
works. Then, we calculated the overlap of hubs between the
randomized networks of the two original networks. The pro-
cedure was repeated 1,000 times. The average overlap is con-
sidered as the random expectation.
An observed enrichment in hub overlap can be partly
explained by the fact that hubs tend to be essential. In order
to take into consideration hub essentiality, we created rand-
omized networks by shuffling degrees only among genes that
are either essential or non-essential. In this manner, the ten-
dency for hubs to be essential is conserved in randomized net-
works. Other steps are the same as above.
Similarly, an observed enrichment in essentiality of compos-
ite-hubs compared to hubs in a single network can be at least
partly explained by the fact that hubs generally tend to be
essential. To prove this, we again created randomized net-
works where the tendency for hubs to be essential is con-
served. We then compared observed essentiality enrichment
in composite-hubs with calculations based on the rand-
omized networks.
R55.10 Genome Biology 2006, Volume 7, Issue 7, Article R55 Yu et al. />Genome Biology 2006, 7:R55
Additional data files
The following additional data are available with the online
version of this paper. Additional data file 1 is a PDF file con-
taining the supplementary materials to the main manuscript,
in which we introduce the details of many calculations per-
formed in the main text and discuss many additional results
supporting the conclusions in the main text.
Additional data file 1Supplementary figures and tables and discussionSupplementary figures and tables that introduce details of many calculations performed in the main text, and discussion of many additional results supporting the conclusions in the main text.Click here for file
Acknowledgements
This work is supported by a grant from NIH/NIGMS (P50 GM62413-01).
References
1. Hartwell LH, Hopfield JJ, Leibler S, Murray AW: From molecular
to modular cell biology. Nature 1999, 402(6761 Suppl):C47-52.
2. Ito T, Tashiro K, Muta S, Ozawa R, Chiba T, Nishizawa M, Yamamoto
K, Kuhara S, Sakaki Y: Toward a protein-protein interaction
map of the budding yeast: A comprehensive system to
examine two-hybrid interactions in all possible combinations
between the yeast proteins. Proc Natl Acad Sci USA 2000,
97:1143-1147.
3. Uetz P, Giot L, Cagney G, Mansfield TA, Judson RS, Knight JR, Lock-
shon D, Narayan V, Srinivasan M, Pochart P, et al.: A comprehen-
sive analysis of protein-protein interactions in Saccharomyces
cerevisiae. Nature 2000, 403:623-627.
4. Gavin AC, Bosche M, Krause R, Grandi P, Marzioch M, Bauer A,
Schultz J, Rick JM, Michon AM, Cruciat CM, et al.: Functional organ-
ization of the yeast proteome by systematic analysis of pro-
tein complexes. Nature 2002, 415:141-147.
5. Ho Y, Gruhler A, Heilbut A, Bader GD, Moore L, Adams SL, Millar A,
Taylor P, Bennett K, Boutilier K, et al.: Systematic identification
of protein complexes in Saccharomyces cerevisiae by mass
spectrometry. Nature 2002, 415:180-183.
6. Cho RJ, Campbell MJ, Winzeler EA, Steinmetz L, Conway A, Wodicka
L, Wolfsberg TG, Gabrielian AE, Landsman D, Lockhart DJ, et al.: A
genome-wide transcriptional analysis of the mitotic cell
cycle. Molecular Cell 1998, 2:65-73.
7. Kanehisa M, Goto S, Kawashima S, Okuno Y, Hattori M: The KEGG
resource for deciphering the genome. Nucleic Acids Res
2004:D277-280.
8. Lee TI, Rinaldi NJ, Robert F, Odom DT, Bar-Joseph Z, Gerber GK,
Hannett NM, Harbison CT, Thompson CM, Simon I, et al.: Tran-
scriptional regulatory networks in Saccharomyces cerevisiae.
Science 2002, 298:799-804.
9. Horak CE, Luscombe NM, Qian J, Bertone P, Piccirrillo S, Gerstein M,
Snyder M: Complex transcriptional circuitry at the G1/S tran-
sition in Saccharomyces cerevisiae. Genes Dev 2002,
16:3017-3033.
10. Tong AH, Evangelista M, Parsons AB, Xu H, Bader GD, Page N, Rob-
inson M, Raghibizadeh S, Hogue CW, Bussey H, et al.: Systematic
genetic analysis with ordered arrays of yeast deletion
mutants. Science 2001, 294:2364-2368.
11. Nakaya A, Goto S, Kanehisa M: Extraction of correlated gene
clusters by multiple graph comparison. Genome Inform Ser
2001, 12:44-53.
12. Albert R, Barabasi AL: Statistical mechanics of complex
networks. Rev Modern Phys 2002, 74:47-97.
13. Amaral LA, Scala A, Barthelemy M, Stanley HE: Classes of small-
world networks. Proc Natl Acad Sci USA 2000, 97:11149-11152.
14. Girvan M, Newman ME: Community structure in social and bio-
logical networks. Proc Natl Acad Sci USA 2002, 99:7821-7826.
15. Jeong H, Mason SP, Barabasi AL, Oltvai ZN: Lethality and central-
ity in protein networks. Nature 2001, 411:41-42.
16. Yu H, Zhu X, Greenbaum D, Karro J, Gerstein M: TopNet: a tool
for comparing biological sub-networks, correlating protein
properties with topological statistics. Nucleic Acids Res 2004,
32:328-337.
17. Milo R, Shen-Orr S, Itzkovitz S, Kashtan N, Chklovskii D, Alon U:
Network motifs: simple building blocks of complex
networks. Science 2002, 298:824-827.
18. Yeger-Lotem E, Sattath S, Kashtan N, Itzkovitz S, Milo R, Pinter RY,
Alon U, Margalit H: Network motifs in integrated cellular
networks of transcription-regulation and protein-protein
interaction. Proc Natl Acad Sci USA 2004, 101:5934-5939.
19. Luscombe NM, Babu MM, Yu H, Snyder M, Teichmann SA, Gerstein
M: Genomic analysis of regulatory network dynamics reveals
large topological changes. Nature 2004, 431:308-312.
20. Ihmels J, Levy R, Barkai N: Principles of transcriptional control
in the metabolic network of Saccharomyces cerevisiae. Nat
Biotechnol 2004, 22:86-92.
21. Balazsi G, Barabasi AL, Oltvai ZN: Topological units of environ-
mental signal processing in the transcriptional regulatory
network of Escherichia coli. Proc Natl Acad Sci USA 2005,
102:7841-7846.
22. Guelzim N, Bottani S, Bourgine P, Kepes F: Topological and causal
structure of the yeast transcriptional regulatory network.
Nat Genet 2002, 31:60-63.
23. Fraser HB, Hirsh AE, Steinmetz LM, Scharfe C, Feldman MW: Evolu-
tionary rate in the protein interaction network. Science 2002,
296:750-752.
24. Yu H, Greenbaum D, Xin Lu H, Zhu X, Gerstein M: Genomic anal-
ysis of essentiality within protein networks. Trends Genet 2004,
20:227-231.
25. Hinnebusch AG, Natarajan K: Gcn4p, a master regulator of gene
expression, is controlled at multiple levels by diverse signals
of starvation and stress. Eukaryot Cell 2002, 1:22-32.
26. Drysdale CM, Duenas E, Jackson BM, Reusser U, Braus GH, Hinneb-
usch AG: The transcriptional activator GCN4 contains multi-
ple activation domains that are critically dependent on
hydrophobic amino acids. Mol Cell Biol 1995, 15:1220-1233.
27. Ge H, Liu Z, Church GM, Vidal M: Correlation between tran-
scriptome and interactome mapping data from Saccharomy-
ces cerevisiae. Nat Genet 2001, 29:482-486.
28. Grigoriev A: A relationship between gene expression and pro-
tein interactions on the proteome scale: analysis of the bac-
teriophage T7 and the yeast Saccharomyces cerevisiae. Nucleic
Acids Res 2001, 29:3513-3519.
29. Kemmeren P, van Berkum NL, Vilo J, Bijma T, Donders R, Brazma A,
Holstege FC: Protein interaction verification and functional
annotation by integrated analysis of genome-scale data. Mol
Cell 2002, 9:1133-1143.
30. Jansen R, Greenbaum D, Gerstein M: Relating whole-genome
expression data with protein-protein interactions. Genome
Res 2002, 12:37-46.
31. Yu H, Luscombe NM, Qian J, Gerstein M: Genomic analysis of
gene expression relationships in transcriptional regulatory
networks. Trends Genet 2003, 19:422-427.
32. Shen-Orr SS, Milo R, Mangan S, Alon U: Network motifs in the
transcriptional regulation network of Escherichia coli. Nature
Genetics 2002, 31:64-68.
33. Zaslaver A, Mayo AE, Rosenberg R, Bashkin P, Sberro H, Tsalyuk M,
Surette MG, Alon U: Just-in-time transcription program in
metabolic pathways. Nat Genet 2004, 36:486-491.
34. Kalir S, Alon U: Using a quantitative blueprint to reprogram
the dynamics of the flagella gene network. Cell 2004,
117:713-720.
35. Basu S, Mehreja R, Thiberge S, Chen MT, Weiss R: Spatiotemporal
control of gene expression with pulse-generating networks.
Proc Natl Acad Sci USA 2004, 101:6355-6360.
36. Mangan S, Alon U: Structure and function of the feed-forward
loop network motif. Proc Natl Acad Sci USA 2003,
100:11980-11985.
37. Spellman P, Sherlock G, Zhang M, Iyer V, Anders K, Eisen M, Brown
P, Botstein D, Futcher B: Comprehensive identification of cell
cycle-regulated genes of the yeast Saccharomyces cerevisiae
by microarray hybridization. Mol Biol Cell 1998, 9:3273-3297.
38. Mazurie A, Bottani S, Vergassola M: An evolutionary and func-
tional assessment of regulatory network motifs. Genome Biol
2005, 6:R35.
39. Wingender E, Chen X, Fricke E, Geffers R, Hehl R, Liebich I, Krull M,
Matys V, Michael H, Ohnhauser R, et al.: The TRANSFAC system
on gene expression regulation. Nucleic Acids Res 2001,
29:281-283.
40. Hodges PE, McKee AH, Davis BP, Payne WE, Garrels JI: The Yeast
Proteome Database (YPD): a model for the organization
and presentation of genome-wide functional data. Nucleic
Acids Res 1999, 27:69-73.
41. Bader GD, Betel D, Hogue CW: BIND: the Biomolecular Inter-
action Network Database. Nucleic Acids Res 2003, 31:248-250.
42. Mewes HW, Frishman D, Guldener U, Mannhaupt G, Mayer K,
Genome Biology 2006, Volume 7, Issue 7, Article R55 Yu et al. R55.11
comment reviews reports refereed researchdeposited research interactions information
Genome Biology 2006, 7:R55
Mokrejs M, Morgenstern B, Munsterkotter M, Rudd S, Weil B: MIPS:
a database for genomes and protein sequences. Nucleic Acids
Res 2002, 30:31-34.
43. Xenarios I, Salwinski L, Duan XJ, Higney P, Kim SM, Eisenberg D: DIP,
the Database of Interacting Proteins: a research tool for
studying cellular networks of protein interactions. Nucleic
Acids Res 2002, 30:303-305.
44. von Mering C, Krause R, Snel B, Cornell M, Oliver SG, Fields S, Bork
P: Comparative assessment of large-scale data sets of pro-
tein-protein interactions. Nature 2002, 417:399-403.
45. Jansen R, Yu H, Greenbaum D, Kluger Y, Krogan NJ, Chung S, Emili
A, Snyder M, Greenblatt JF, Gerstein M: A Bayesian networks
approach for predicting protein-protein interactions from
genomic data. Science 2003, 302:449-453.
46. Supplementary Data Website [ />network/netcomp/]
47. Zhang LV, King OD, Wong SL, Goldberg DS, Tong AH, Lesage G,
Andrews B, Bussey H, Boone C, Roth FP: Motifs, themes and the-
matic maps of an integrated Saccharomyces cerevisiae inter-
action network. J Biol 2005, 4:6.
48. Qian J, Dolled-Filhart M, Lin J, Yu H, Gerstein M: Beyond synex-
pression relationships: local clustering of time-shifted and
inverted gene expression profiles identifies new, biologically
relevant interactions. J Mol Biol 2001, 314:1053-1066.
49. Cupp JR, McAlister-Henn L: Kinetic analysis of NAD(+)-isoci-
trate dehydrogenase with altered isocitrate binding sites:
contribution of IDH1 and IDH2 subunits to regulation and
catalysis. Biochemistry 1993, 32:9323-9328.
50. Iyer VR, Horak CE, Scafe CS, Botstein D, Snyder M, Brown PO:
Genomic binding sites of the yeast cell-cycle transcription
factors SBF and MBF. Nature 2001, 409:533-538.
51. Daignan-Fornier B, Fink GR: Coregulation of purine and histi-
dine biosynthesis by the transcriptional activators BAS1 and
BAS2. Proc Natl Acad Sci USA 1992, 89:6746-6750.
52. Dirick L, Bohm T, Nasmyth K: Roles and regulation of Cln-Cdc28
kinases at the start of the cell cycle of Saccharomyces
cerevisiae. EMBO J 1995, 14:4803-4813.
53. Machado AK, Morgan BA, Merrill GF: Thioredoxin reductase-
dependent inhibition of MCB cell cycle box activity in Sac-
charomyces cerevisiae. J Biol Chem 1997, 272:17045-17054.
54. Matangkasombut O, Buratowski S: Different sensitivities of bro-
modomain factors 1 and 2 to histone H4 acetylation. Mol Cell
2003, 11:353-363.
55. Miyoshi K, Shirai C, Mizuta K: Transcription of genes encoding
trans-acting factors required for rRNA maturation/ribos-
omal subunit assembly is coordinately regulated with ribos-
omal protein genes and involves Rap1 in Saccharomyces
cerevisiae. Nucleic Acids Res 2003, 31:1969-1973.
56. Ogawa N, Noguchi K, Sawai H, Yamashita Y, Yompakdee C, Oshima
Y: Functional domains of Pho81p, an inhibitor of Pho85p pro-
tein kinase, in the transduction pathway of Pi signals in Sac-
charomyces cerevisiae. Mol Cell Biol 1995, 15:997-1004.