Báo cáo y học: "Shuffling of cis-regulatory elements is a pervasive feature of the vertebrate lineage" ppsx
Bạn đang xem bản rút gọn của tài liệu. Xem và tải ngay bản đầy đủ của tài liệu tại đây (1.07 MB, 19 trang )
Genome Biology 2006, 7:R56
comment reviews reports deposited research refereed research interactions information
Open Access
2006Sangeset al.Volume 7, Issue 7, Article R56
Research
Shuffling of cis-regulatory elements is a pervasive feature of the
vertebrate lineage
Remo Sanges
*
, Eva Kalmar
†
, Pamela Claudiani
*
, Maria D'Amato
*
,
Ferenc Muller
†
and Elia Stupka
*
Addresses:
*
Telethon Institute of Genetics and Medicine, Via P. Castellino, 80131 Napoli, Italy.
†
Institute of Toxicology and Genetics,
Forschungzenbrum, Karlsruhe, Postfach 3640, D-76021 Karlsruhe, Germany.
Correspondence: Ferenc Muller. Email: Elia Stupka. Email:
© 2006 Sanges et al.; licensee BioMed Central Ltd.
This is an open access article distributed under the terms of the Creative Commons Attribution License ( which
permits unrestricted use, distribution, and reproduction in any medium, provided the original work is properly cited.
Regulatory element shuffling in evolution<p>Alignment of orthologous vertebrate loci reveals that a significant proportion of conserved <it>cis</it>-regulatory elements have undergone shuffling during evolution.</p>
Abstract
Background: All vertebrates share a remarkable degree of similarity in their development as well
as in the basic functions of their cells. Despite this, attempts at unearthing genome-wide regulatory
elements conserved throughout the vertebrate lineage using BLAST-like approaches have thus far
detected noncoding conservation in only a few hundred genes, mostly associated with regulation
of transcription and development.
Results: We used a unique combination of tools to obtain regional global-local alignments of
orthologous loci. This approach takes into account shuffling of regulatory regions that are likely to
occur over evolutionary distances greater than those separating mammalian genomes. This
approach revealed one order of magnitude more vertebrate conserved elements than was
previously reported in over 2,000 genes, including a high number of genes found in the membrane
and extracellular regions. Our analysis revealed that 72% of the elements identified have undergone
shuffling. We tested the ability of the elements identified to enhance transcription in zebrafish
embryos and compared their activity with a set of control fragments. We found that more than
80% of the elements tested were able to enhance transcription significantly, prevalently in a tissue-
restricted manner corresponding to the expression domain of the neighboring gene.
Conclusion: Our work elucidates the importance of shuffling in the detection of cis-regulatory
elements. It also elucidates how similarities across the vertebrate lineage, which go well beyond
development, can be explained not only within the realm of coding genes but also in that of the
sequences that ultimately govern their expression.
Background
Enhancers are cis-acting sequences that increase the utiliza-
tion and/or specificity of eukaryotic promoters, can function
in either orientation, and often act in a distance and position
independent manner [1]. The regulatory logic of enhancers is
often conserved throughout vertebrates, and their activity
relies on sequence modules containing binding sites that are
crucial for transcriptional activation. However, recent studies
on the cis-regulatory logic of Otx in ascidians pointed out that
there can be great plasticity in the arrangement of binding
Published: 19 July 2006
Genome Biology 2006, 7:R56 (doi:10.1186/gb-2006-7-7-r56)
Received: 27 March 2006
Revised: 5 April 2006
Accepted: 27 June 2006
The electronic version of this article is the complete one and can be
found online at />R56.2 Genome Biology 2006, Volume 7, Issue 7, Article R56 Sanges et al. />Genome Biology 2006, 7:R56
sites within individual functional modules. This degeneracy,
combined with the involvement of a few crucial binding sites,
is sufficient to explain how the regulatory logic of an enhancer
can be retained in the absence of detectable sequence conser-
vation [2]. These observations together with the fact that we
are still far from understanding fully the grammar of tran-
scription factor binding sites and their conservation [3] make
it difficult to assess the extent of conservation in vertebrate
cis-regulatory elements.
Very little is known about the evolutionary mobility of
enhancer and promoter elements within the genome as well
as within a specific locus. Sporadic studies of selected gene
families have addressed questions related to the mobility of
regulatory sequences involving promoter shuffling [4] and
enhancer shuffling [5]; these describe the gain or loss of indi-
vidual regulatory elements exchanged between specific genes
in a cassette manner [6]. These studies suggested that a wide
variety of different regulatory motifs and mutational mecha-
nisms have operated upon noncoding regions over time.
These studies, however, were conducted before the advent of
large-scale genome sequencing, and thus they were per-
formed on a scale that would not allow the authors to derive
more general conclusions on the mobility and shuffling of
regulatory elements.
The basic tenet of comparative genomics is that constraint on
functional genomic elements has kept their sequence con-
served throughout evolution. The completion of the draft
sequence of several mammalian genomes has been an impor-
tant milestone in the search for conserved sequence elements
in noncoding DNA. It has been estimated that the proportion
of small segments in the mammalian genome that is under
purifying selection within intergenic regions is about 5% and
that this proportion is much greater than can be explained by
protein-coding sequences alone, implying that the genome
contains many additional features (such as untranslated
regions, regulatory elements, non-protein-coding genes, and
structural elements) that are under selection for biological
functions [7-11]. In order to address this issue, sequence com-
parisons across longer evolutionary distances and, in particu-
lar, with the compact Fugu rubripes genome have been
shown to be useful in dissecting the regulatory grammar of
genes long before the advent of genome sequencing [12].
More recently, the completion of the draft sequence of several
fish genomes has allowed larger scale approaches for the
detection of several regulatory conserved noncoding features.
Several studies have addressed the issue of conserved non-
coding sequences on a larger scale. A first study on chromo-
some 21 [13] revealed conserved nongenic sequences (CNGs);
these were identified using local sequence alignments
between the human and mouse genome of high similarity,
which were shown to be untranscribed. A separate study
focusing on sequences with 100% identity [14] revealed the
presence of ultraconserved elements (UCEs) on a genome-
wide scale, and finally conserved noncoding elements (CNEs)
[15] were found by performing local sequence comparisons
between the human and fugu genomes showing enhancer
activity in zebrafish co-injection assays. Although the CNG
study yielded a very large number of elements dispersed
across the genome, and bearing no clear relationship to the
genes surrounding them, the latter studies (UCEs and CNEs)
were almost exclusively associated with genes that have been
termed 'trans-dev' (that is, they are involved in developmen-
tal processes and/or regulation of transcription).
One of the major drawbacks of current genome-wide studies
is that they rely on methods for local alignment, such as
BLAST (basic local alignment search tool) [16] and FASTA
[17], which were developed when the bulk of available
sequences to be aligned were coding. It has been shown that
such algorithms are not as efficient in aligning noncoding
sequences [18]. To tackle this issue new algorithms and strat-
egies have been developed in order to search for conserved
and/or over-represented motifs from sequence alignments,
such as the motif conservation score [19], the threaded block-
set aligner program [20] and the regulatory potential score
[21], as well as phastCons elements and scores [22]. However,
all of these rely on a BLAST-like algorithm to produce the ini-
tial sequence alignment and are thus subject to some of the
sensitivity limitations of this algorithm and do not constitute
a major shift in alignment strategy that would model more
closely the evolution of regulatory sequences.
Two approaches were recently reported which provide novel
alignment strategies: the promoter-wise algorithm coupled
with 'evolutionary selex' [23] and the CHAOS (CHAins Of
Scores) alignment program [24]. Whereas the former has
been used to validate a set of short motifs, which have been
shown to be of functional importance, the latter has not been
coupled to experimental verification to estimate its potential
for the discovery of conserved regulatory sequences. Unlike
other fast algorithms for genomic alignment, CHAOS does
not depend on long exact matches, it does not require exten-
sive ungapped homology, and it does allow for mismatches
within alignment seeds, all of which are important when com-
paring noncoding regions across distantly related organisms.
Thus, CHAOS could be a suitable method for the identifica-
tion of short conserved regions that have remained functional
despite their location having changed during vertebrate evo-
lution. The only method available that attempts to tackle the
question of shuffled elements and that makes use of CHAOS
is Shuffle-Lagan [25]; however, it has not been used on a
genome-wide scale and its ability to detect enhancers has not
been verified experimentally.
Until recently our ability to verify the function of sequence
elements on a large scale within an in vivo context was
strongly limited. This task was eased significantly using co-
injection experiments in zebrafish embryos [26], which
allows significant scale-up in the quantity of regulatory ele-
Genome Biology 2006, Volume 7, Issue 7, Article R56 Sanges et al. R56.3
comment reviews reports refereed researchdeposited research interactions information
Genome Biology 2006, 7:R56
ments tested; this is fundamental when one is trying to eluci-
date general principles regarding regulatory elements, the
grammar of which still eludes us. The co-injection technique
used to test shuffled conserved regions (SCEs) for enhancer
activity was previously shown to be a simple way to test cis-
acting regulatory elements [15,27,28] and was shown to be an
efficient way to test many elements in a relatively short period
of time [15].
The analysis described herein attempts to tackle the issue of
the extent, mobility, and function of conserved noncoding
elements across vertebrate orthologous loci using a unique
combination of tools aimed at identifying global-local region-
ally conserved elements. We first used orthologous loci from
four mammalian genomes to extract 'regionally conserved
elements' (rCNEs) using MLAGAN [29], and then used
CHAOS to verity the extent of conservation of those rCNEs
within their orthologous loci within fish genomes. The analy-
sis was conducted annotating the extent of shuffling under-
gone by the elements identified. Finally, we investigated the
activity of rearranged and shuffled elements as enhancer ele-
ments in vivo. We found that the inclusion of additional
genomes, the use of a combined global-local strategy, and the
deployment of a sensitive alignment algorithm such as
CHAOS yields an increase of one order of magnitude in the
number of potentially functional noncoding elements
detected as being conserved across vertebrates. We also
found that the majority of these have undergone shuffling and
are likely to act as enhancers in vivo, based on the more than
80% rate of functional and tissue-restricted enhancers
detected in our zebrafish co-injection study.
Results
The dataset described in this analysis is available on the inter-
net [30] for full download, as well as the searchable to identify
SCEs belonging to individual genes.
Identification of mammalian regionally conserved
elements
For each group of orthologous genes global multiple align-
ments among the human, mouse, rat, and dog loci were per-
formed using MLAGAN [25]. We took into consideration all
genes for which there were predicted othologs within
Ensembl [31] in the mouse genome, human genome, and any
third mammalian species, which led us to analyze 9,749
groups of orthologous genes (36% of the annotated mouse
genes). Most genes (about 88%) were found to be conserved
in all four species considered, with only about 12% found in
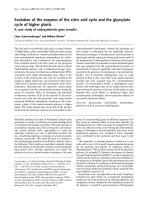
three out of four species (about 6% in each triplet; Figure 1).
For each locus we took into account the whole genomic
repeat-masked sequence containing the transcriptional unit
as well as the complete flanking sequences up to the preced-
ing and following gene. This lead us to analyze 37% of the
murine genome sequence overall. The alignments were
parsed using VISTA (visualizing global DNA sequence align-
ments of arbitrary length) [32] searching for segments of
minimum 100 base pairs (bp) length and 70% identity. We
further selected these regions by only taking into account
those regions that were found at least in mouse, human, and
a third mammalian species and which overlapped by at least
50 bp, which resulted in a set of 364,358 rCNEs (Table 1).
These were then filtered stringently to distinguish 'genic'
from 'nongenic' (see Materials and methods, below). This
analysis classified 22.7% of the resulting rCNEs as 'genic',
Table 1
Transcription potential, localization, and number of mammalian
rCNEs
rCNE type
a
Total
b
Coding
c
Noncoding
d
Total
e
364,358 82,714 281,644
Pre-gene
f
120,001 23,832 96,169
Intronic
g
158,722 29,002 129,720
Post-gene
h
85,521 29,766 55,755
a
Type of conserved non-coding sequence (rCNE).
b
Total number of
rCNEs, including genic and nongenic.
c
Number of genic rCNEs:
overlapping EMBL proteins, ESTs, GenScan predictions, and Ensembl
genes.
d
Number of nongenic rCNEs: not overlapping EMBL proteins,
ESTs, GenScan, and Ensembl genes.
e
Total number of rCNEs, including
pre-gene, intronic and post-gene.
f
Number of pre-gene rCNEs: rCNEs
localized before the translation start of the reference gene.
g
Number
of intronic rCNEs: rCNEs localized within the introns of the reference
gene.
h
Number of post-gene rCNEs: rCNEs localized after the
translation end of the reference gene. EST, expressed sequence tag;
rCNE, regionally conserved non-coding element.
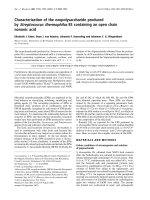
Number of conserved gene loci versus number of rCNEs identified in the mouse, rat, human, and dog genomesFigure 1
Number of conserved gene loci versus number of rCNEs identified in the
mouse, rat, human, and dog genomes. Graph showing the number of
rCNEs found conserved in the dog, rat, mouse and human genomes versus
the number of genes found conserved across the same genomes. Although
almost 90% of the genes can be found in all four genomes, most rCNEs
can be found only in three out of four genomes. rCNE, regionally
conserved element.
0
10
20
30
40
50
60
70
80
90
100
HUM/MUS/RAT HUM/MUS/DOG/RAT HUM/MUS/DOG
Species coverage
rCNEs
Genes
Percentage
R56.4 Genome Biology 2006, Volume 7, Issue 7, Article R56 Sanges et al. />Genome Biology 2006, 7:R56
while 281,644 nongenic elements account for about 46 mega-
bases, or 1.77%, of the murine genome.
We further annotated mammalian rCNEs based on their posi-
tion in the mouse genome with respect to the gene locus in
order to define whether they were located before the anno-
tated transcription start site (TSS; 'pre-gene'), within the
intronic portion of the gene, or posterior to the transcrip-
tional unit ('post-gene'). Approximately 54% of rCNEs were
found to fall within intergenic regions, of which 37% were
post-gene and 63% pre-gene (Table 1).
Shuffling of conserved elements is a widespread
phenomenon
We searched for conservation of rCNEs in teleost genomes
using CHAOS [24], selecting regions that presented at least
60% identity over a minimum length of 40 bp as compared
with the mouse sequence of the rCNEs. This method allowed
us to identify regions that are reversed or moved in the fish
locus with respect to the corresponding mammalian locus.
For each locus in every species analyzed we took into account
the whole genomic repeat-masked sequence containing the
transcriptional unit as well as the complete flanking
sequences up to the preceding and following gene. We
defined as SCEs those regions of the mouse genome that were
conserved at least in the fugu orthologous locus and filtered
out any sequence shorter than 20 bp as a result of the overlap
analysis with zebrafish and tetraodon (see Materials and
methods, below, for details). Our analysis identified 21,427
nonredundant nongenic SCEs, which were found in about
30% of the genes analyzed (2,911; Table 2). The distribution
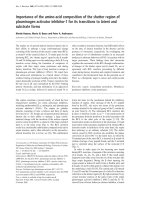
of their length and percentage identity is shown in Figure 2e,f.
The median length and percentage identity (45 bp and 67%,
respectively) reflect closely the cut offs provided to CHAOS in
the alignment (40 bp and 60% identity), although there is a
significant number of outliers whose length is equal to or
greater than 200 bp (223 elements whose maximum length is
669 bp) and whose median percentage identity is 74%. No
elements were identified that were completely identical to
their mouse counterpart (the maximum percentage identity
found was 97%).
We decided to investigate further the extent to which the ele-
ments identified, which are still retained within the locus ana-
lyzed, have shuffled in terms of relative position and
orientation relative to the transcriptional unit, and would
thus be missed by a simple regional global alignment (such as
MLAGAN). The results of this revealed that only 28% of ele-
ments identified have retained the same orientation and the
same position with respect to the transcriptional unit taken
into account (that is to say, have remained pre-gene, intronic,
or post-gene. Labeled as 'collinear'; Figure 2a), whereas oth-
ers have shifted in terms of orientation ('reversed'; Figure 2b),
position ('moved'; Figure 2c), or both ('moved-reversed'; Fig-
ure 2d). Thus, almost two-thirds of the SCEs identified would
have been missed by a global, albeit regional, alignment
approach.
A possible explanation for the large number of noncollinear
elements is that they could appear shuffled owing to assembly
artifacts. In order to assess whether the large number of ele-
ments identified as noncollinear were merely due to assembly
artifacts, we analyzed the number of SCEs containing a single
hit in fugu and not classified as collinear that also had a match
in tetraodon. If the shuffling were merely due to assembly
artifacts, then we would expect approximately half of the non-
collinear hits in fugu also to be noncollinear in tetraodon. The
results, however, were significantly different, because more
than 80% of the elements were not collinear in both species
(P < 2.2 × e
-16
obtained by performing a χ
2
comparison
between the proportion obtained and the expected 0.5/0.5
proportion). These findings emphasize that shuffling is a
mechanism of particular relevance when searching for short,
well conserved elements across long evolutionary distances
and that its true extent can only be detected by using a sensi-
tive global-local alignment approach, as opposed to a fast
genome-wide approach [25].
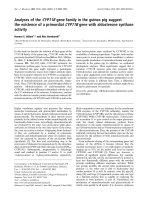
Two examples of SCEs that were identified in our study are
shown in Figure 3. Example A shows the locus of Sema6d, a
semaphorin gene that is located in the plasma membrane and
is involved in cardiac morphogenesis. This locus represents a
conserved element that is found after the transcriptional unit
at the 3' end of the gene in all mammals analyzed, whereas it
is located upstream in fish genomes and reversed in orienta-
tion in the fugu and tetraodon genomes. Example B shows the
locus of the tyrosine phosphatase receptor type G protein, a
candidate tumor suppressor gene, which has a conserved ele-
ment in the first intron of all mammalian loci analyzed, which
is found in reversed orientation in all fish genomes, down-
stream of the gene in the fugu and tetraodon genomes, and in
the second intron in the zebrafish genome.
Table 2
Transcription potential, localization, and number of vertebrate
SCE type
a
Total
b
Coding
c
Noncoding
d
Total
e
27,196 5,769 21,427
Pre-gene
f
8,387 1,363 7,024
Intron
g
11,657 1,838 9,819
Post-gene
h
7,152 2,568 4,584
a
Type of SCE.
b
Total number of SCEs, including genic and nongenic.
c
Number of genic SCEs: overlapping EMBL proteins, ESTs, GenScan
predictions, and Ensembl genes.
d
Number of nongenic SCEs: not
overlapping EMBL proteins, ESTs, GenScan, and Ensembl genes.
e
Total
number of SCEs, including pre-gene, intronic, and post-gene.
f
Number
of pre-gene SCEs: SCEs localized before the translation start of the
reference gene.
g
Number of intronic SCEs: SCEs localized within the
introns of the reference gene.
h
Number of post-gene SCEs: SCEs
localized after the translation end of the reference gene. EST,
expressed sequence tag; SCE, shuffled conserved element.
Genome Biology 2006, Volume 7, Issue 7, Article R56 Sanges et al. R56.5
comment reviews reports refereed researchdeposited research interactions information
Genome Biology 2006, 7:R56
Shuffled conserved regions cast a wider net of nongenic
conservation across the genome
We analyzed the type of genes that are associated with SCEs
by assessing the distribution of Gene Ontology (GO) terms
[33] using GOstat [34] (see Materials and methods, below).
Although the results indicate significant over-representation
of gene classes typical of genes harboring noncoding conser-
vation ('trans-dev' enrichment) as reported previously (Addi-
tional data file 1), the number of genes within our analysis
containing nongenic SCEs (2,911) is approximately an order
of magnitude greater than that of the number of genes con-
taining CNEs (330). The overlap between the two datasets is
291 genes, and so almost all (>88%) genes containing SCEs
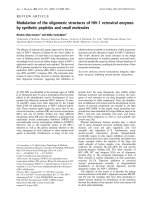
also contain CNEs. A GO analysis comparing genes contain-
ing CNEs and those containing SCEs (Figure 4) revealed that
there are several GO categories that are significantly under-
represented in the CNE dataset as compared with ours. These
categories were not seen in the previous analysis (Additional
data file 1) because they are not over-represented in our data-
set as compared with the entire genome.
The most striking difference is found in the analysis by cellu-
lar components; there is an approximate 54-fold enrichment
in genes belonging to the extracellular regions that contain
SCEs as compared with genes in the same class that contain
CNEs. In fact SCEs are present in more than 50% of the genes
we were able to classify as belonging to the extracellular
matrix and in 35% of those belonging to the extracellular
space, whereas CNEs are only found in six and two such
genes, respectively. These gene sets differ significantly in both
extracellular regions and membrane GO cellular component
categories (P < 0.001; Additional data file 1). Enrichments in
the order of 10-fold to 13-fold are seen when comparing genes
involved in physiological and cellular processes, respectively.
For both of these categories our analysis was able to identify
SCEs in more than 30% of the genes belonging to this class.
The differences, although substantial (about sevenfold) are
not as extreme when comparing 'trans-dev' genes (genes cat-
egorized as belonging to the 'regulation of biological process'
and 'development' using GO) because the CNE dataset has a
stronger bias for those genes (P < 0.001; Additional data file
1). Finally, although we identified SCEs in 40% of genes
assigned to the 'behavior' class, none of the genes in this class
has CNEs. The data thus suggest that there are both quantita-
tive and qualitative differences between the two datasets.
The proximal promoter region is a shuffling 'oasis'
Because a large proportion of our dataset undergoes shuf-
fling, we decided to investigate whether shuffling is a property
that is dependent on proximity to the transcriptional unit. To
address this question we divided our dataset of nongenic
SCEs between collinear (as discussed above) and noncol-
linear (all other categories discussed above taken together)
elements, and analyzed the distribution of their distances
from the TSS (pre-gene set), the intron start (intron start), the
intron end (intron-end set) and the 3' end of the transcript
(post-gene). This analysis demonstrated that collinear ele-
ments were distributed significantly closer to the start and the
end of the transcriptional unit compared with noncollinear
elements, whereas no differences were observed in terms of
proximity to the intron start and intron end (Additional data
file 2).
In order to investigate this phenomenon at higher resolution,
we subdivided all loci analyzed in our dataset into 1,000 bp
windows within the areas, and verified whether the propor-
tion of collinear versus noncollinear elements deviated signif-
icantly from the expected proportions in any of these
windows (see Materials and methods, below, for details). The
results of the analysis are shown in Figure 5. The only window
that exhibited a high χ
2
result with significantly less shuffled
elements than collinear ones (P = e
-08
), was the 1,000 bp win-
dow immediately upstream of the TSS. No similar results
were found in any other 1,000 bp windows across the gene
loci analyzed. Similar results were obtained when deploying
other window sizes (data not shown). To ascertain whether
the result observed was due to annotation problems, we
inspected the GO classification of the genes that presented
nongenic collinear elements in the 1,000 bp window dis-
cussed above and observed significant enrichment (P <
0.001) for 'trans-dev' genes, whereas the same test conducted
on genic collinear elements in the same window revealed no
significant GO enrichment (Additional data file 3).
Shuffled conserved regions are able to predict
vertebrate enhancers
In order to verify the ability of SCEs to predict functional
enhancer elements, we conducted an overlap analysis (see
Materials and methods, below) of SCEs with 98 mouse
enhancer elements deposited in Genbank. We compared the
overlap of SCEs with that of two other datasets that present
conservation in fish genomes, namely CNEs and UCEs. The
results presented in Figure 6 show that although CNEs and
UCEs are able to detect only one and two known enhancers
from our dataset, respectively, SCEs detect 18 of them suc-
cessfully.
Shuffled conserved regions act as enhancers in vivo
In order to validate the cis-regulatory activity of SCEs we
chose a subset of SCEs to be tested for in vivo enhancer activ-
ity by amplifying them from the fugu genome and co-injecting
them in zebrafish embryos with a minimal promoter-reporter
construct yielding transient transgenic zebrafish embryos.
Twenty-seven SCEs were tested, of which four overlapped
known mouse enhancers for which activity had not previously
been reported in fish, and the remaining 23 (from 12 genes, of
which four were not trans-dev genes, for a total of eight frag-
ments not associated with trans-dev genes) did not overlap
any known feature. Detailed information on each SCE tested,
including diagrams of their localization in mammalian and
fish genomes as well as multiple alignments, is shown in
Additional data file 4. As a control set 12 noncoding, non-
R56.6 Genome Biology 2006, Volume 7, Issue 7, Article R56 Sanges et al. />Genome Biology 2006, 7:R56
repeated, and nonconserved fragments were also chosen for
co-injection assays, of which nine were from the same genes
from which SCEs had been picked and three were from ran-
dom genes (see Materials and methods, below, for details).
Owing to the mosaic expression patterns that are obtained
with this technique, results were recorded in two ways: by
counting the number of cells stained for X-Gal and recording,
where possible, the tissue in which the LacZ-positive cells
were found; and by plotting LacZ-positive cells on expression
maps that represent a composite overview of the LacZ-posi-
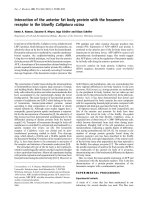
Distribution of length, percentage identity and shuffling categories of SCEsFigure 2
Distribution of length, percentage identity and shuffling categories of SCEs. SCEs were categorized based on their change in location and orientation in
Fugu rubripes with respect to their location and orientation in the mouse locus. The entire locus, comprising the entire flanking sequence up to the next
upstream and downstream gene was taken into consideration. Definitions of specific classes: (a) collinear SCEs (elements that have not undergone any
change in location or orientation within the entire gene locus); (b) reversed SCEs (elements that have changed their orientation in the fish locus with
respect to the mouse locus, but have remained in the same portion of the locus); (c) moved SCEs (elements that have moved between the pre-gene, post-
gene and intronic portions of the locus); (d) Moved-reversed (elements that have undergone both of the above changes). (e) Frequency distribution of
SCE length in base pairs. (f) Frequency distribution of percentage identity of SCE hits in fugu. SCE, shuffled conserved region.
25%
28%
27%
20%
(a)
(d)
(b)
(c)
Mammalian
5‘
5‘
3‘
3‘
Fish
Mammalian
5‘
5‘
3‘
3‘
Fish
5‘
5‘
3‘
3‘
Mammalian
Fish
5‘
5‘
3‘
3‘
Mammalian
Fish
SCE length
bp
Number of SCEs
0 50 100 150 200 250 300
0 2000 6000 10000
Percentage identity of hits in fugu
Percentage
Number of hits
60 70 80 90 100
0 1000 3000
(e)
(f)
Moved-reversed
Collinear
Reversed
Moved
translated exon
SCE
intron
flanking
Genome Biology 2006, Volume 7, Issue 7, Article R56 Sanges et al. R56.7
comment reviews reports refereed researchdeposited research interactions information
Genome Biology 2006, 7:R56
tive cells of all the embryos tested. Results of the cell counts
are shown in Table 3 (For greater details, see Additional data
file 3) and the expression maps are shown in Figure 7. The cell
counts were used to define statistically which fragments
exhibited tissue-restricted enhancer activity or generalized
enhancer activity (see Materials and methods, below).
As a positive control a published regulatory element from the
shh locus, ar-C [27], was coinjected with the HSP:lacZ frag-
ment. From a total of 27 SCEs, 22 (about 81%) were able to
enhance significantly the activity of the HSP:lacZ construct in
comparison with the embryos injected with HSP:lacZ only
(see Materials and methods, below, for details). Of these,
three out of the four tested known mouse enhancers that were
Examples of loci containing shuffled conserved elementsFigure 3
Examples of loci containing shuffled conserved elements. (a) The Sema6d (sema domain, transmembrane domain, and cytoplasmic domain, semaphorin
6D; MGI:2387661) locus contains a post-genic moved-reversed conserved element. The SCE is found downstream from the gene in mammalian loci and
upstream of the gene in fish genomes, and in reverse orientation only in the genomes of fugu and tetraodon. (b) the Ptprg (protein tyrosine phosphatase,
receptor type G; MGI:97814) locus contains an intronic moved-reversed conserved element. The SCE is found in the first intron of the Ptprg gene in
mammalian genomes, downstream of the gene in reverse orientation in fugu and tetraodon, and in the second intron in reverse orientation in zebrafish.
Boxes represent the multiple alignments of the SCEs identified. SCE, shuffled conserved region.
Mouse
Human
Rat
Dog
fugu
Zebrafish
tetraodon
3‘
5‘
3‘
5‘
human
danio
dog
tetr
fugu
mouse
rat
TGGTTCAGCCAGACTCTCTGGCTCAGATACACTAACTGCT
TGGTTCAGC-AGACACTCTGGGTGATCTTTATTGAGTGAT
TGGCTCAGCCAGACTCTCTGGCTCACATACACTAACTGGT
TGACACAGACAGACTGTCTGTCTCTGCTGCACTAAGGAGT
TGACACAGACAGACTGTCTGTCTCTGCTGCACTAAGGAGT
TGGTTCAGCCAGACTCTCTGGCTCAGATACACTAAGGGGT
TGGTTCAGCCAGACTCTCTGACTCAGATACACTAAGGGGT
Mouse
Human
Rat
Dog
fugu
Zebrafish
tetraodon
human
danio
dog
tetr
fugu
mouse
rat
3‘
5‘
3‘
5‘
T-AGCCATGTGCTGTCTGAAGGATGGCAG-GCTTAAAAAAT
TTAATCTGGTGCTTTGTGCAGTAAAACAG-TTCTACAGAAT
T-AGCCGTGTGCTATGTGAAAGATGGCAG-GCTTAAAAAAT
TTAGCTGTGT CATGATAAAGATAGCAC-CTATATTTGAT
TTAGCCATGT CATGATAAAGATAGCAC-CTATATTTGAT
TCAGCCATGTGCTATGTGAAAGATGGCAGGCTTAAAAAAAT
TCAGCCATGTGCTGTGTGAAAGATGGCAGGCT-TAAAAAAT
(a)
(b)
untranslated exon
translated exon
SCE
intron
flanking
3‘
3‘
3‘
5‘
5‘
5‘
3‘
3‘
5‘
5‘
3‘
3‘
3‘
3‘
5‘
5‘
5‘
5‘
5‘
3‘
Sema6d
Ptprg
R56.8 Genome Biology 2006, Volume 7, Issue 7, Article R56 Sanges et al. />Genome Biology 2006, 7:R56
found to be conserved in fish were confirmed to act as
enhancers in fish. A similar percentage of positive results
(82.6%) was obtained excluding these enhancers in the count.
The enhancer effect in 20 out of the 22 positive SCEs was not
generalized but observed in a tissue-restricted manner.
The expression patterns obtained in our experiments were
compared with expression data retrieved from the Zebrafish
Information Network [35,36]. Multiple SCEs found within a
single gene locus gave similar tissue-restricted enhancer
activity. For example, all four SCEs tested from the ets-1 locus
gave expression that was highly specific to the blood precur-
sors (SCE 1646 in Figure 7c). This result is in accordance with
reported data, which showed ets-1 expression in the arterial
system and venous system. Moreover, both elements tested
from the zfpm2 (also described as fog2 [37]) gene gave central
nervous system (CNS) specific enhancer activity, which is in
accordance with a recent report showing that the expression
of both fog2 paralogs is restricted to the brain [37]. Similarly,
elements tested from the mab-21-like genes gave CNS and eye
specific enhancer activity (SCE 4939; Figure 7f). This pattern
of expression corresponds with the patterns reported in the
brain, neurons, and eye [38,39]. The SCEs that were found in
the pax6a and hmx3 genes were shown to give CNS specific
enhancement, which is in accordance with the reported
expression of these genes in the CNS [35]. Finally, SCE 3121
from the gene jag1b gave specific expression in the CNS and
in the eye (Figure 7d), which is in partial agreement with
GO Classification of genes harboring CNEs versus genes harboring SCEsFigure 4
GO Classification of genes harboring CNEs versus genes harboring SCEs. All genes containing CNEs and/or SCEs were analyzed for GO term
classification. Genes containing CNEs are shown in red and genes containing SCEs are shown in gray. Plots show differences in absolute numbers as well as
relative percentages. Classification is shown for (a) cellular component and (b) biological process categories. CNE, conserved noncoding element; GO,
Gene Ontology; SCE, shuffled conserved region.
Cellular component level 2 term
0 10203040506070
Other
Extracellular matrix
Extracellular space
Membrane
Intracellular
Percentage of genes
0 200 400 600 800 1000
Other
Extracellular matrix
Extracellular space
Membrane
Intracellular
Number of genes
Biological process level 1 term
0 1020304050607080
Other
Development
Regulation of
biological process
Cellular
process
Physiological
process
Percentage of genes
0 200 400 600 800 1000 1200 1400 1600
Other
Development
Regulation of
biological process
Cellular
process
Physiological
process
Number of genes
CNE
SCE
(a)
(b)
Genome Biology 2006, Volume 7, Issue 7, Article R56 Sanges et al. R56.9
comment reviews reports refereed researchdeposited research interactions information
Genome Biology 2006, 7:R56
Analysis of SCE shuffling in 1000 bp windowsFigure 5
Analysis of SCE shuffling in 1000 bp windows. Each column in the figure shows the analysis of a locus portion (pre-gene, intron-start, intron-end and post-
gene) divided into 1000 bp windows. In each column the first graph indicates the number of collinear SCEs identified, the second graph the number of
noncollinear SCEs identified, and the third graph the χ
2
test used to identify windows that show a significant deviation from the expected proportion of
collinear to noncollinear SCEs. The P value is shown for the only window (1000 bp upstream of the transcription start site) that exhibits significant
deviation from the expected proportion. bp, base pairs; SCE, shuffled conserved region.
Collinear
Frequency of elements
0
0 1020304050
Noncollinear
Frequency of elements
0
0 1020304050
0
0 1020304050
Position
Chi square
Intron start
Collinear
0 5000 15000
0 1020304050
Noncollinear
0 5000 15000
0 1020304050
0 5000 15000
0 1020304050
Position
Intron end
Collinear
0 5000 15000
0 1020304050
Noncollinear
0 5000 15000
0 1020304050
0 5000 15000
0 1020304050
Position
Collinear
0
0 1020304050
Noncollinear
0
0 1020304050
0
0 1020304050
Position
p
Pre-gene Post-gene
R56.10 Genome Biology 2006, Volume 7, Issue 7, Article R56 Sanges et al. />Genome Biology 2006, 7:R56
reported expression of this gene (expressed in the rostral end
of the pronephric duct, nephron primordia, and the region
extending from the otic vesicle to the eye [40]).
Novel enhancer functions were also detected for SCEs neigh-
boring lmx1b1, which showed CNS specific activity, and SCEs
neighboring four genes not belonging to the trans-dev cate-
gory, such as mapkap1 (Figure 7e), tmeff2 and
3110004L20Rik (producing proteins integral to the mem-
brane), and elmo1 (associated with the cytoskeleton), which
exhibited strong generalized and/or tissue specific activity.
No endogenous expression data are available for these genes
for comparison. In contrast to the results with SCE elements,
only two out of 12 (about 17%) of the genomic control frag-
ment set derived from the same loci of the SCEs exhibited sig-
nificant enhancement of LacZ activity (Table 3).
Taken together, these data demonstrate that SCEs act as bona
fide enhancers that can drive tissue-restricted as well as gen-
eralized expression during embryo development.
Discussion
Widespread shuffling of cis-regulatory elements in
vertebrates
In this study we demonstrate, using a unique combination of
tools aimed at obtaining regional, global-local sensitive align-
ments applied at the genome level, that the number of con-
served non-coding sequences shared between mammalian
and fish genomes is at least an order of magnitude higher
than was previously proposed and is spread across thousands
of genes. In fact, approximately 30% of the genes analyzed
presented at least one SCE. Our GO analysis results indicate a
'trans-dev' bias similar to those described in previous studies
addressing genes exhibiting noncoding conservation [14,15].
On the other hand, the significant increase in the sheer
number of elements identified and in the number of genes
exhibiting SCEs enabled us to detect conserved nongenic ele-
ments in a third of the genes studied, indicating that conser-
vation of cis-regulatory modules is a widespread
phenomenon in vertebrates, and is not limited to a few hun-
dred genes, as suggested by previous studies. The GO analysis
also revealed that certain classes of genes, such as those
located in the extracellular space and extracellular matrix,
exhibit conserved non-coding sequences, which were not
identified with previous approaches and indicate that non-
coding elements conserved across vertebrates are present in a
larger and more diverse set of genes than was previously
thought. Although we also observed a larger number of genes
involved in cellular and physiological processes, many of
them are also assigned to 'trans-dev' categories, and so their
involvement in development and regulation of transcription
cannot be excluded. Indeed, it is important to note that eight
out of the 23 randomly selected fragments were not associ-
ated with trans-dev genes by GO classification, and that six of
these fragments exhibited significant enhancer activity in our
co-injection assays (Table 3). This confirms that conservation
is not an exclusive characteristic of regulatory regions associ-
ated with trans-dev genes.
That shuffling plays an important role in the identification of
conserved non-coding sequences is illustrated by the fact that
72% of our dataset was observed to be either inverted or
moved, or both, in the fish locus with respect to the mouse
locus. Assembly artifacts are unlikely to be an important fac-
tor in the elements identified as shuffled because they would
also affect gene structures and therefore correct gene predic-
tion and ortholog detection, which is at the basis of our data-
set. We were reassured about this by our tetraodon-fugu
comparison, which indicated that most elements found to be
shuffled in one species were also shuffled in the other. A nota-
ble exception to the general shuffling bias in the elements
found was a 1,000 bp window immediately upstream of the
TSS. Taking into account that the proximal promoter region
is considered to be approximately -250 bp to +100 bp from
the TSS [41], and assuming that TSS annotations in the
mouse genes analyzed are precise, this finding suggests that
there is a class of enhancer elements that are more con-
strained in both position and orientation, perhaps working in
tight connection to the promoter complex. The fact that the
genes containing nongenic collinear elements in this window
show the 'trans-dev' bias associated with our overall SCE
dataset, as well as with previous analyses of noncoding con-
servation, reassures us that this result is not a mere product
of bad annotation of the first exon in these genes. It is partic-
Overlap of known mouse enhancers with conserved elementsFigure 6
Overlap of known mouse enhancers with conserved elements. All mouse
enhancers deposited in GenBank (94) were mapped to the genome and
compared with previously published conserved elements (UCEs and
CNEs) as well as our own dataset of SCEs to verify their overlap. Only
one known mouse enhancer is overlapped by a CNE and two by a UCE,
whereas our dataset of SCEs identifies 18 known mouse enhancers as
being conserved within fish genomes. CNE, conserved noncoding element;
SCE, shuffled conserved region; UCE, ultraconserved element.
0
2
4
6
8
10
12
14
16
18
20
CNE UCE SCE
Number of elements overlapping known enhancers
Element
Genome Biology 2006, Volume 7, Issue 7, Article R56 Sanges et al. R56.11
comment reviews reports refereed researchdeposited research interactions information
Genome Biology 2006, 7:R56
Table 3
Analysis of X-Gal staining in zebrafish embryos co-injected with the HSP promoter and SCEs or control fragments
Gene Trans dev Name SCE bp SCE Class ENH Embryo Cell ce/emb P value
Muscle Notochord CNS Eye Ear Vessels Other
No NA lacZ Neg
control
161 40 0.25
Shh YArC Pos
control
96 242 2.52 8.48E-07
Shh Y 12058 45 Rev Y 139 69 0.5 6.86E-09
Otx2 Y 13988 51 Mov Y 111 93 0.84 0.6444 0.006269 0.5536 0.3155
Gata3 Y 15402 40 Mre Y 107 103 0.96 0.398 0.5764 0.1906 1
Ets Y 8744 40 Mov Y 105 180 1.57 0.002593 4.78E-09
Ets Y 8745 46 Mov Y 133 210 1.58 0.1558 0.6015 0.3619 2.15E-06
Ets Y 8726 41 Mre Y 159 345 2.17 0.05534 0.6136 0.1485 2.08E-06
Ets Y 8728 48 Mre Y 149 176 1.18 0.0444 0.129 0.07924 1.31E-05
Pax2b Y 31027 39 Col Y 149 105 0.7 0.002374 0.06327 0.1902
Pax6a Y 15696 33 Mov Y 133 122 0.92 8.21E-06 0.3343 0.01268
Pax3 Y 24781 42 Mov N 124 67 0.54 0.02982 0.5287 1
Zfpm2 Y 23818 48 Col Y 140 119 0.85 1.49E-06 0.01296 1
Zfpm2 Y 23838 48 Mre Y 131 148 0.98 0.0003576 0.04369 0.1231
Tmeff2 N 26014 48 Mov N 164 125 0.76 0.7654 0.02301 0.3371 0.2801
Tmeff2 N 26015 38 Mov Y 120 159 1.33 0.001035 0.303 0.2088
Tmeff2 N 26016 51 Mre Y 109 148 1.36 0.0006309 0.0149 0.5862
Jag1b Y 16407 37 Col N 136 98 0.72 1 0.1849 1 1
Jag1b Y 16408 55 Col Y 142 109 0.86 5.45E-08 0.006524 0.3245
Jag1b Y 16409 44 Rev N 106 54 0.51 1 0.5088 1 0.5058
Mapkap1 N 17058 37 Mov Y 143 295 2.06 0.6825 0.05292 0.3788 0.6065 1
Mapkap1 N 17059 39 Mov Y 136 171 1.26 0.6686 0.004037 0.5973 0.077 0.5197
Mab21l2 Y 23001 42 Col Y 142 317 2.23 1.24E-07 0.004985 0.2339
Mab21l2 Y 23002 37 Mre Y 155 122 0.79 7.85E-08 0.004138
Hmx3 Y 11669 150 Col Y 165 136 0.82 0.001029 0.07062 0.01423
Lmx1b Y 17027 300 Col Y 116 105 0.91 0.00762 0.1876 1
3110004L20Rik N 5803 45 Mre N 65 16 0.25 0.2929 1
3110004L20Rik N 5802 39 Mov Y 122 320 2.62 0.1874 0.01209
Elmo1 N 6026 45 Rev Y 103 76 0.74 0.007132 0.6848
Ets Y 11216 NA Ctrl N 104 74 0.71 1 0.6954
Gata3 Y 3255 NA Ctrl N 174 110 0.63 0.04481 0.281 0.5739 0.02163
1300007F04Rik N 2797 NA Ctrl N 157 115 0.73
Tmeff2 N 198 NA Ctrl N 145 23 0.16 0.7448 0.6597 0.3651
Mab21l2 Y 909 NA Ctrl N 165 92 0.56 0.06359 1 1 1
3110004L20Rik N 410 NA Ctrl N 107 23 0.21 0.01984
Elmo1 N 10157 NA Ctrl N 146 38 0.26 0.287 0.8126
Shh Y 11271 NA Ctrl Y 165 83 0.5 3.34E-07 111
Impact Y 5990 NA Ctrl N 150 101 0.67 0.6496 0.2754 0.0622
Ubl7 N 268 NA Ctrl Y 117 644 5.5 0.0003325 7.15E-11 0.02555 0.6197
Lmx1b Y 11767 NA Ctrl N 116 15 0.13 0.2743 0.0707 1
Irx3 Y 5945 NA Ctrl N 93 15 0.16 0.03938
For each DNA fragment tested the following information is given, from left to right: the gene locus in which the DNA fragment is found; indication
about the GO classification of the gene in the 'trans-dev' class (Y = yes, N = no); the identifier given to the SCE or control fragment; the size of the
SCE; the class (rev = reversed, mov = moved, mre = moved and reversed, col = collinear, Ctrl = control); summary about the potentially enhancer
function of the element (Y = yes, N = no); the number of embryos injected; the total number of cells X-gal-stained; the ratio of stained cells divided
by the number of embryos observed (with bold highlighting those with significant generalized enhancer activity); the P values for the significance of the
number of cells observed in the fragment tested versus the lacZ:HSP control for each tissue (bold for P values < 0.01; see Materials and methods). See
Additional data file 3 for further info on the fragments tested. CNS, central nervous system; SCE, shuffled conserved element.
R56.12 Genome Biology 2006, Volume 7, Issue 7, Article R56 Sanges et al. />Genome Biology 2006, 7:R56
ularly reassuring that performing the same analysis on SCEs
found in the same window but classified as 'genic' (and thus
more likely to be real evidence of annotation problems) did
not exhibit this bias.
Lack of conservation can also be due to the fact that the evo-
lution of regulatory motifs involves constant de novo creation
and destruction of them over time because of their short
sequences and plastic nature [42] (for review [43]). The dis-
section of cis-regulatory elements from different species,
however, indicates clearly that there are cases in which
although the same transcription factors are involved in the
regulation of a gene, all sequences that are not responsible
directly for the binding of transcription factors are not pre-
served and so overall sequence conservation is very poor [2].
Thus, the quest to identify regulatory conservation must be
complemented by a more thorough understanding of the
inherent grammar of regulatory sequences, which would lead
to improved alignment models specifically tailored to regula-
tory sequences [23].
Conservation versus function
During the past few years several strategies have been
deployed to perform genome-wide sequence comparisons,
which in turn identified several novel functional elements in
vertebrate genomes. However, they have not yet defined how
far conservation of noncoding elements can be pushed to
identify functional elements efficiently. The approach used to
build our dataset is significantly different from previous
approaches, because on the one hand it is stringent by focus-
ing on fish-mammal comparisons and on the other hand it is
more sensitive than previous approaches because of its
CHAOS-based alignments and lower length cut offs. The
requirement for conservation in fish genomes in the SCE
dataset would thus lead to the loss of mammalian-specific
enhancers, but on the other hand it is likely to act as a strin-
gent filter for slowly evolving DNA that may be free from any
functional constraints. The differences between the SCE data-
set and previously reported datasets became evident by per-
forming an overlap analysis among them (see Materials and
methods, below, for details; also see Additional data file 5).
The partial overlap between the analyzed datasets once again
emphasizes that the approach used to determine conserved
nongenic elements has a notable impact on the elements
identified. Approximately 50% of SCEs do not overlap any
known feature, suggesting that the use of nonexact seeds for
the initial local alignments has a significant impact on the
analysis of noncoding DNA harboring short, well conserved
elements, and that our dataset is substantially different from
previous datasets both quantitatively, and qualitatively.
UCEs were detected using a whole-genome local alignment
strategy between human and mouse (although they are often
conserved in fish genomes as well) and selected for being
100% identical over at least 200 bp [14]. They were shown to
be often located in clusters in the proximity of 'trans-dev'
genes. Poulin and coworkers [44] showed that the ultracon-
served Dc2 element is necessary and sufficient for brain tissue
enhancer activity, and an ongoing systematic study using
transgenic mice has shown enhancer activity for more than
60% of the elements tested so far (Pennachio and coworkers,
unpublished data). Our dataset overlaps only 45% of the UCE
elements because of its 'regional approach', which will miss
any elements that are conserved across nonorthologous loci
or that are found beyond the region we took into considera-
tion (namely, beyond the previous or next gene). Nonethe-
less, the results of our study indicate that the enhancer
function that has so far been associated with them does not
explain fully their level of conservation, because our dataset,
although rich in enhancers, has much lower levels of
sequence identity and length as compared with UCEs. Only
one of the fragments that we tested (SCE 1973 from the
mapkap1 gene) overlaps with a UCE element. The overlap is
only 33 bp, and there is no further identity with the UCE in
fugu, but the element nonetheless acted as a tissue-restricted
enhancer in vivo. A region adjacent to the UCE in mouse (SCE
1973), although not ultraconserved, is also conserved in fish
and acted as a generic enhancer in our assays, highlighting
the complexity of these regions and adding to the ongoing
debate regarding their function and evolution [45].
A large set of sequences, defined as CNGs, was constructed by
using pair-wise local sequence comparison between the
human and mouse genome on chromosome 21 (identity =
70%, length = 100 bp), and it was shown that two-thirds of
them lacked transcriptional evidence in vivo [13]. The conser-
vation of these regions in other mammalian genomes was
later also confirmed [8]; however, thus far they have not been
shown to represent functional regulatory elements to a satis-
factory scale, and so the specificity of this method in the iden-
tification of enhancers is not known. A recent genome-wide
study of functional noncoding elements conserved in fish
genomes used pair-wise local sequence comparison between
the human and fugu genomes to define 1,400 highly con-
served noncoding elements (length = 100) and found that
these were principally associated with developmental genes
[15]. The overlap analysis highlights that although CNGs are
three orders of magnitude larger than UCEs and CNEs and
they contain the former fully and 96% of the latter, they only
overlap approximately half of the SCE dataset. This suggests
that there are qualitative differences between CNGs and our
dataset. Interestingly, it has been shown that megabase dele-
tions of two-gene deserts containing thousands of CNGs in
mice had no phenotypic effects [46]. The authors stated that
none of the CNGs contained are conserved in fish, and when
we inspected these regions we discovered only a single SCE,
very close to the boundary of the deletion.
Our dataset overlaps only 51% of the CNEs within the loci
analyzed, probably because of the regional approach taken,
which disregards elements conserved across nonorthologous
loci. On the other hand more than 88% of the genes that con-
Genome Biology 2006, Volume 7, Issue 7, Article R56 Sanges et al. R56.13
comment reviews reports refereed researchdeposited research interactions information
Genome Biology 2006, 7:R56
tain CNEs also present SCEs, thus identifying regulatory ele-
ments in the majority of those genes nonetheless. A group of
CNEs were shown to act as enhancers when tested in vivo in
zebrafish by co-injecting them with promoter/reporter con-
structs. Our data, compared with the CNE dataset, is a radical
extension (of an order of magnitude) of similar conserved ele-
ments, indicating a significant quantitative difference. There
is also a qualitative difference, however, because we identified
elements in a very broad range of genes, including genes from
the extracellular regions and membrane and many genes par-
ticipating in physiological and cellular processes, which are
not transcription factors. The quantitative and qualitative dif-
ferences in our dataset constitute a major departure from pre-
viously published datasets, which show conservation across
vertebrates and clear evidence of involvement in enhancing
gene expression, namely CNEs and UCEs.
Thus, the lack of overlap between the datasets taken into con-
sideration is probably a compounded effect of methodological
differences (for example, CNEs versus SCEs), real biological
differences (CNGs versus others) and a compound effect of
the two differences (UCEs versus CNEs and SCEs). Our
results suggest that a large portion of the noncoding genome
is composed of enhancers. Although it is certain that con-
served noncoding regions play other roles that we were una-
ble to verify, either they constitute a minority or they are able
to perform several functions besides that of enhancers.
Comparative genomics has been applied successfully to the
study of regulatory elements in the past, using approaches
based on motif libraries. Xie and coworkers [19] aligned the
promoter and 3'-untranslated region sequences from four
mammalian genomes by using BlastZ with a regional
Expression profiles of X-Gal stained embryosFigure 7
Expression profiles of X-Gal stained embryos. (a-f) Expression profiles of 1-day-old X-Gal stained zebrafish embryos. Each expression map represents a
composite overview of the LacZ-positive cells of 65-175 embryos. Gene names and fragment/SCE id are shown. Detailed distribution of X-Gal stained cells
in different tissues as well as data for all other fragments are shown in Table 3. Side view of head region of LacZ-stained embryos are shown with anterior
to the left. (panel a) HSP-lacZ injected embryo. (d) Embryo co-injected with SCE 3121 associated with Jag1b gene. (f) Embryo co-injected with SCE 4939
associated with Mab21l2 gene. SCE, shuffled conserved region.
Ets1 control
fragment 11216
Ets1
SCE 1646
Mab21l2 control
fragment 909
Mab21l2
SCE 4939
Mapkap1
SCE 1972
Jag1b
SCE 3121
Hsp - LacZ
Shh-ArC
(a)
(d)
(f)
(b)
(e)
(c)
R56.14 Genome Biology 2006, Volume 7, Issue 7, Article R56 Sanges et al. />Genome Biology 2006, 7:R56
approach and were able to identify motifs that were over-rep-
resented in conserved regions around genes. They showed
that these motifs are nonrandomly distributed with respect to
gene expression data but they did not identify specific
instances of the motif as active copies in the genome. Thus,
this study, apart from using a different methodology, focused
on mammalian genomes only (as compared with our verte-
brate-wide approach) and focused on proximal 5'- and 3'-
untranslated region sequences, discarding introns as a nega-
tive control set based on the assumption that they contain few
regulatory elements. Our study was based on sequence align-
ment, focused on a broader dataset comprising several verte-
brate genomes and made use of the full intergenic and
intronic sequence for each locus taken into consideration.
Ettwiller and coworkers [23] proposed a novel computational
method that also makes use of comparative genomics. First,
they developed a novel alignment routine, called promoter-
wise, that models promoter evolution more closely. Then,
they used an efficient method to allow direct enumeration of
all possible motifs up to 12-mers, including motifs with wild-
cards. Finally, active instances of the motif set thus generated
were confirmed by searching them in regions that were found
to be conserved in the alignment routine. This work was
aimed at comparing distantly related genomes, by searching
for over-representation in related orthologs across mamma-
lian and fish genomes to identify specific instances of these
motifs. Moreover, they proved using experiments in Medaka
that these active motifs are necessary to drive expression in
vivo. This study resembles our strategy more closely because
it involves a vertebrate-wide comparison, although it focused
only on 5 kb promoter sequences.
Motif library based approaches are complementary to our
alignment focused approach. One important difference
between these approaches is that the computational require-
ments of motif-based approaches are very high, and so it is
not feasible to execute a motif library approach over a third of
the genome sequence, as was done in this work. On the other
hand motif library approaches are able to pinpoint specific
motifs that are at the core of the regulatory grammar, whereas
our approach uncovers a dataset that is likely to contain a
redundant set of regulatory motifs. It would be a natural
extension of our work to compare these datasets in order to
elucidate shuffling and determine the extent to which
enhancers can be represented as clusters of simpler motifs as
well as to investigate shuffling of enhancers in relation to the
shuffling of single motifs.
Toward improved detection of cis-regulatory elements
The fact that, despite an increase of an order of magnitude in
our dataset, a similar ratio of elements was found to act as
enhancers as compared with the CNE dataset suggests that
the extent of sequence conservation of regulatory elements is
a moving target that reflects the technique used to identify
them. There is a clear need for novel methodologies to detect
thus far hidden conserved elements. The algorithm Shuffle-
LAGAN is an alignment program that resembles our
approach, although it only aligns shuffled elements within
pair-wise alignments and therefore it would have not helped
to bypass the initial step of selecting rCNEs found conserved
in at least three mammalian genomes. A desirable extension
of Shuffle-Lagan would be to add the ability to process orthol-
ogous loci from several genomes at once. More knowledge
about the evolution of noncoding DNA will be needed in order
to obtain better scoring schemes and thus yield not only sen-
sitive alignments but more reliable predictions of enhancers
and other regulators of gene expression [25].
An important aspect that differentiates our approach from
previous BLAST-based approaches is the use of CHAOS for
the alignment of mammalian loci to fish loci. In order to verify
the extent to which CHAOS differs from BLAST in this partic-
ular type of search, we performed the search for SCEs from
our set of rCNEs in the fugu genome, comparing NCBI BLAST
and CHAOS at different word sizes and identical length and
identity cut offs. The results indicate that although CHAOS
scales exponentially as word size decreases, the number of
hits obtained with BLAST is almost unaltered by the differ-
ence in word size. Moreover, there is a qualitative difference
in the hits obtained because the increase in number of ele-
ments identified at small word sizes using CHAOS is due in
large part to shuffled elements that BLAST is unable to iden-
tify (Additional data file 6). This qualitative difference is most
notable using word size 10, for which only about 4% of BLAST
results are shuffled elements as compared with 72% of the
elements identified by CHAOS.
This significant difference reiterates quite clearly that looking
for sequence similarity across long stretches of identical
words is not a valid approach to identifying conserved regula-
tory elements. At the same time, if we were to decrease word
sizes to what would be biologically sensible (that is to say,
word size 5-8, similar to the size of transcription factor bind-
ing sites) it would be difficult to assess whether the elements
identified as conserved were the result of convergent tran-
scription factor binding site architecture generated de novo,
rather than truly conserved across vertebrate evolution. Thus,
novel methodologies need to be developed that would make
use of small word sizes but include other constraints and scor-
ing systems that would help to distinguish biological features
preserved through evolution from neutrally evolving short
fragments in the genome. To this extent, a well curated
resource collecting known enhancers (deposited in GenBank,
for example) as well as a large set of systematically validated
enhancers (such as Enhancer Browser [47]; Pennacchio LA,
unpublished data) would help in building valid scoring sys-
tems and improve current methods.
In vivo transient assays
Our in vivo assays by co-injection revealed interestingly that
most enhancers identified using this method were restricted
Genome Biology 2006, Volume 7, Issue 7, Article R56 Sanges et al. R56.15
comment reviews reports refereed researchdeposited research interactions information
Genome Biology 2006, 7:R56
in their activity to one or two tissues. Reassuringly, the
expression profile of 24-hour-old embryos co-injected with
the ArC positive control exhibited clear notochord enhance-
ment (Figure 7b), as described previously [27]. The relative
evolutionary closeness of fugu and zebrafish implies that
expression and regulation of expression of developmentally
regulated genes is probably well conserved [15,48]. Very little
is known about Fugu gene expression patterns, but the avail-
ability of gene expression pattern information for many
zebrafish genes provides a reliable assessment for the tissue
specificity of the Fugu SCEs tested in our transient transgenic
embryo assays. The functional analysis of SCEs by enhancer
essays carried out in the transient transgenic zebrafish iden-
tified several new tissue restricted enhancer functions for
genes where the endogenous expression pattern is not
known. Future work will be required to analyze the role of
these enhancers in relation to the detailed analysis of expres-
sion patterns of the genes they are associated with. In several
cases the SCEs found within a locus provided tissue specificity
reminiscent of the gene expression pattern of the flanking
gene, arguing strongly for a direct role of these SCEs in regu-
lating the expression of the flanking gene. It will, however,
only be possible to prove unequivocally that there is a need for
these enhancers to drive the expression of the candidate gene
by site-specific mutation of the SCEs in the genomic context.
Two of the control fragments that do not contain detectable
conservation were also shown to have significant enhancer
effect, and in particular one of the two exhibited activity that
was greater than that of most SCEs tested.
Mechanisms for genome-wide shuffling
Genomic rearrangements have already been reported on a
large scale in a study examining gene order in regions of syn-
teny between human and Takifugu rubripes [49]. Similar
rearrangements should be seen when analyzing smaller regu-
latory regions that could harbor enhancers, which have
strong evolutionary constraints on their sequence but fre-
quently not on their specific localization with respect to the
gene they act upon. We found that shuffling and rearrange-
ments are not only applicable to nongenic sequences but also
are a widespread phenomenon that involves 30% of the genes
we analyzed.
Recently, there has been discussion on the role of cis-regula-
tory elements in the spatial organization of the genome and
their possible role in restricting chromosomal rearrange-
ments (see Liu and Garrard [50] and the review by Pederson
[51]). The most well known examples of this are the hox clus-
ters, although they do exhibit wider plasticity in fish genomes
than in other genomes. Our work shows clearly that shuffling
of cis-regulatory elements is a widespread phenomenon
within orthologous loci. It would be interesting to investigate
further the extent to which shuffling occurs on a genome-
wide scale. Further analysis is required to determine the real
extent of this phenomenon outside orthologous loci. This is
the first genome-wide study to show that regulatory elements
are mobile across species; this finding should be taken into
consideration when using comparative evolutionary methods
to locate potential regulatory elements.
It would be useful to assess the extent of shuffling on a
genome-wide basis to develop a thresholding statistic. We
investigated this by searching for SCEs in fugu nonortholo-
gous loci. Although this results in a significantly lower
number of hits (23,100 hits in orthologous analysis, 9,884 in
nonorthologous analysis; P < 2.2 × e
-16
), the result shows that
shuffling does occur outside of the orthologous locus. It is dif-
ficult to interpret this result without taking into account other
data (for example, expression data and sequence similarity
for genes considered nonorthologous or, indeed, in vivo
assays on hits in nonorthologous loci) that would allow us to
establish the extent to which hits in nonorthologous loci are
noise and to which they represent regulatory elements in
genes with similar expression patterns. Finally, we must
emphasize that the fact that our mammalian rCNE dataset is
built using a global alignment approach will limit the search
space and will not allow us to investigate the extent of regula-
tory element shuffling within mammals. This data reduction
step has been used in the past [52], and it was used in the
present analysis based on the assumption that shuffling of
regulatory elements is more likely to occur over longer evolu-
tionary distances. Widespread shuffling of elements could act
as a potential mechanism for providing new expression sites
to genes that are placed in the vicinity of a translocated
enhancer. These issues can only be tackled appropriately by
performing further analysis of the extent to which conserved
elements shuffle beyond their locus of origin on both small
and large evolutionary distances.
Conclusion
Our work shows that shuffling of cis-regulatory regions is a
widespread phenomenon across the vertebrate lineage that
affects approximately 70% of the conserved noncoding ele-
ments identified. The approach used allowed us to demon-
strate that there is an order of magnitude more conserved
elements in the vertebrate lineage than has previously been
shown. Moreover, conservation of regulatory elements occurs
over thousands, rather than hundreds, of genes. By casting a
wider net over vertebrate noncoding conservation, we were
able to demonstrate that there are hundreds of genes that do
not belong to the 'trans-dev' category, such as genes found in
the membrane and extracellular regions, which also contain
conserved noncoding elements. Finally, our in vivo assays
prove that although we cast a wider net, the catch was just as
rich; more than 80% of the elements tested acted as enhanc-
ers, and the majority of them showed tissue-restricted pat-
terns of expression in line with the neighboring gene.
R56.16 Genome Biology 2006, Volume 7, Issue 7, Article R56 Sanges et al. />Genome Biology 2006, 7:R56
Materials and methods
Selection of genes and sequences
Groups of homologous genes from the genomes of Mus mus-
culus, Homo sapiens, Canis familiaris, Rattus norvegicus,
Takifugu rubripes, Tetraodon nigroviridis, and Danio rerio
were selected from the Ensembl-compara database [13] and
their sequences were obtained from Ensembl database
release 32 [14]. Genes were considered homologous if they
were classified as best reciprocal hits in Ensembl-compara.
We analyzed all of the genes that were conserved in at least
four species, of which three had to be human, mouse and
fugu, and one could be either dog or rat. This selection led to
9,749 groups of homologous genes. For each gene we ana-
lyzed the whole genomic repeat-masked sequence containing
the transcriptional unit as well as the complete flanking
sequences up to the next gene upstream and the next gene
downstream. The region was extracted from Ensembl and the
5'-3' sequence of the locus was stored in a custom database
(all mouse genes were stored as being in forward strand on
the sequences stored). In cases in which the Ensembl gene
contained multiple transcripts, the longest transcript was
taken into consideration for the pre-gene, post-gene, and
intron assignments of SCEs, but all exons (including those of
other transcripts) were used to mask the sequence from cod-
ing regions. Similarly, if there were nested genes present in
the locus, they were not taken into consideration to determine
the extent of sequence to analyze, but they were taken into
consideration to mask coding sequences in the region.
Identification of mammalian regionally conserved
elements
Global multiple alignments among human, mouse, rat, and
dog were performed on each group of homologous genes
using MLAGAN [25] with default parameters. The multiple
alignments thus obtained were parsed using VISTA [32] with
a window of 50 bases searching for conserved segments of at
least 100 bp having a percentage identity of at least 70%.
From these regions we selected as rCNEs only those regions
that were shared and overlapped in at least mouse, human,
and a third mammalian genome (either dog or rat) with a
minimum length of 50 bp. In cases in which the upstream
region of an analyzed gene coincided with the downstream
region of another analyzed gene, rCNEs were counted only
once.
Identification of shuffled conserved regions
Mouse rCNEs were used as query sequences against the
respective fugu, zebrafish, and tetraodon homologous
sequences using CHAOS [24] on both strands with the follow-
ing parameters: word length 10, score cut off 10, rescoring cut
off 1,000, and BLAST-like extension on. Other parameters
were left as set by default including the degeneracy tolerance
of 1 (allowing a single mismatch in the seed of the alignment).
The hits thus obtained were filtered to retain only those with
at least 60% identity and 40 bp length. Although three
genomes were queried, a hit in Fugu was required to consider
the result an SCE. All other hits (if any) were used to select the
region of overlap as the final SCE, but only SCEs greater than
20 bp after the overlap analysis were taken into considera-
tion.
Gene Ontology analysis
Ensembl gene IDs were converted into the corresponding
RefSeq IDs before the analysis. The GOstat program [34] was
used to find statistically over-represented GO IDs in the
groups of genes, using the 'goa_mouse' GO gene association
database as a reference. The false discovery rate and the P
value cut off of 0.001 options were used. Raw output was con-
verted in supplementary tables using a custom Perl script.
The simple association of genes to GO classes presented in
Figure 4 were produced using DAVID version 2 [53].
Mapping of conserved elements
rCNEs and SCEs were classified as 'genic' if they overlapped
any Ensembl genes, Ensembl expressed sequence tag (EST)
genes [31], ESTs [54], EMBL proteins [55], or Genscan pre-
dictions [56] from the Ensembl Mus musculus genome build
release 32. Furthermore, each rCNE and SCE was classified
with respect to the gene structure as 'pre-gene', 'intronic', and
'post-gene' based on its location within these three portions of
the locus. According to this 'gene-centric' classification, as
well as the strand of the fugu CHAOS hits (because all genes
were stored in forward strand), SCEs were classified as 'col-
linear' (that is to say not changed in orientation and not
shifted between gene portions), 'moved' (shifted between
gene portions), 'reversed' (changed in orientation, but
retained in the same gene portion), and 'moved-reversed'
(changed in orientation as well as shifted in gene portion).
BLAST versus CHAOS comparison
A subset of about 50% of the mammalian rCNEs were used as
query sequences against the corresponding fugu homologous
sequences using CHAOS [24] and BLAST2 [16], using a gap
penalty of 2 as was used in the CNE analysis and e-value set
at infinity to ensure that no hits would be filtered because of
their statistical significance, analyzing both strands. The
analysis was conducted three times varying only the word
length used between 20, 15, and 10. The hits thus obtained
were filtered in order to take only those sharing an identity of
at least 60% and a length of at least 40 bp.
Overlap analysis
Overlaps among different classes of conserved noncoding
regions were defined using their genomic coordinates after
having mapped all elements on the mouse loci used in this
analysis. Because there is no downloadable dataset for CNGs,
they were obtained by querying the GALA database [57] for
conserved regions shared between human an mouse of at
least 100 bp and 70% identity. CNEs [15], UCEs [14], and
known enhancers were downloaded from Genbank. Enhanc-
ers were downloaded by searching for enhancer features in
mouse Genbank records and then checking them manually to
Genome Biology 2006, Volume 7, Issue 7, Article R56 Sanges et al. R56.17
comment reviews reports refereed researchdeposited research interactions information
Genome Biology 2006, 7:R56
eliminate mis-annotated entries. All the sequences thus
downloaded were then mapped on the mouse loci used in our
analysis by using Megablast [58] with default parameters for
CNGs, UCEs and known enhancers, and with a gap penalty of
2 for mapping CNEs, in accordance with the parameters used
by Woolfe and coworkers [15] in their analysis. Elements
were considered mapped with 75% coverage and 75% per-
centage identity. Only elements that did not map to exons
were taken into consideration.
Identification of control fragments
A set of control fragments to be tested in vivo was built from
the same gene loci in which the tested SCEs were found, by
selecting regions that were not conserved and did not present
repeats, of the same length and number as the elements
tested.
Zebrafish embryo injections
The enhancer activity was assayed in conjunction with the
minimal promoter mHSP68, which was previously shown to
have low activity in zebrafish embryos and which has allowed
the detection of enhancer function from several heterologous
gene elements [28,59]. HSP68lacZ-pBS DNA plasmids con-
taining the mouse HSP68 promoter [59] and lacZ were pre-
pared using the Promega PureYield Plasmid Midiprep System
plasmid preparation kit, digested by Promega BamHI
enzyme, and DNA fragments were gel purified using the
Promega Wizard SV Gel and PCR Clean-Up System kit
(Promega, Madison, WI, USA). HSP:lacZ DNA fragments
were resuspended in 1% phenol red containing nuclease-free
water at a concentration of 25 ng/µl, as described previously
[60], and were injected into the cytoplasm of zebrafish
embryos at one cell stage. Wild-type embryos (Tubingen AB)
were collected after fertilization and dechorionated by pro-
nase, as described previously [61]. Fugu DNA was used for
production of SCE fragments. Fragments were amplified by
polymerase chain reaction, then isolated and purified using
the Qiagen Qiex DNA purification kit (Qiagen, Valencia, CA,
USA), and finally eluted in sterile water. For injection, phenol
red was added to yield a final concentration of 50 ng/µl. Coin-
jection of polymerase chain reaction fragments at a concen-
tration of 50 ng/µl reaching a range of 5 to 1 molar ratio with
the HSP:lacZ fragment. Embryos were maintained at 28°C
and collected at prim 6 stage [62], fixed and lacZ stained as
described previously [27].
Analysis of transgene expression
LacZ stained embryos were analyzed by plotting the mosaic
expression activity on expression maps, as described previ-
ously [63,64]. The co-injection experiments were repeated
three times. Data from approximately 100-120 embryos were
collected on a single expression map providing an expression
profile. For each embryo expressing lacZ the number of
expressing cells was counted and classified in muscle, noto-
chord, CNS, eye, ear, and vessels. These tissues were selected
because they are well defined at the time of inspection [27].
Other tissues that were either difficult to determine or might
have represented abnormalities (ectopic tissue growth, apop-
totic mismigrating cells) were counted as 'other'. Twenty-
three SCEs, four SCEs overlapping known mouse enhancers,
12 control fragments, one negative control consisting only of
the HSP:lacZ fragment, and the positive control ArC [65]
were analyzed.
We verified the significance of the enhancement of expression
over the general low level improvement of expression of co-
injected fragments probably caused by carrier DNA effect
(see, for example, [65]) in two ways. First, we aimed to detect
tissue-restricted enhancers; second, we aimed to identify
generic enhancers. To identify tissue-restricted enhancers we
compared, for each fragment co-injected and for each tissue,
the number of expressing cells with respect to the number of
expressing cells from the embryos injected with the negative
control in the respective tissues, only when the average of
cells expressing lacZ in injected embryos was higher than in
the control. Fisher exact tests were then used on the compar-
isons and a P value cut off of 0.01 was used to classify a frag-
ment as a tissue-restricted enhancer. The identification of
generic enhancers was performed by establishing the average
and standard deviation of the number of expressing cells per
expressing embryo in the control fragments and then classify-
ing as enhancers fragments in which the number of express-
ing cells per embryo was higher than the average plus twice
the standard deviation of the control fragments. In the calcu-
lation of the average and standard deviation we excluded the
UBL7 control fragment because it was a clear outlier that
exhibited activity that was higher than any of the enhancers
tested, including the positive control. All fragments classified
as enhancers by either of the two tests were considered posi-
tive.
Additional data files
The following additional data are included with the online
version of this article: A table showing GO analysis of genes
associated with CNEs and genes associated with SCEs (Addi-
tional data file 1); a figure showing boxplots comparing the
distribution of the distance of collinear versus noncollinear
nongenic SCEs from the transcriptional unit (Additional data
file 2); a table providing further information on all fragments
tested (Additional data file 3); a document providing supple-
mentary information about tested fragments containing SCEs
(Additional data file 4); a figure showing a Venn diagram that
illustrates the overlap analysis of four datasets (CNGs, UCEs,
CNEs and SCEs; Additional data file 5); a figure showing the
number and type of conserved elements identified by CHAOS
and BLAST2 in our dataset as a function of the word size
used; and a table providing GO analysis results for genes
associated with collinear nongenic SCEs located 1,000 bp
upstream of the TSS (Additional data file 7).
Additional data file 1A table showing GO analysis of genes associated with CNEs and genes associated with SCEsA table showing GO analysis of genes associated with CNEs and genes associated with SCEsClick here for fileAdditional data file 2A figure showing boxplots comparing the distribution of the dis-tance of collinear versus noncollinear nongenic SCEs from the tran-scriptional unitA figure showing boxplots comparing the distribution of the dis-tance of collinear versus noncollinear nongenic SCEs from the tran-scriptional unitClick here for fileAdditional data file 3A table providing further information on all fragments testedA table providing further information on all fragments testedClick here for fileAdditional data file 4A document providing supplementary information about tested fragments containing SCEsA document providing supplementary information about tested fragments containing SCEsClick here for fileAdditional data file 5A figure showing a Venn diagram that illustrates the overlap anal-ysis of four datasets (CNGs, UCEs, CNEs and SCEs)A figure showing a Venn diagram that illustrates the overlap anal-ysis of four datasets (CNGs, UCEs, CNEs and SCEs)Click here for fileAdditional data file 6A figure showing the number and type of conserved elements iden-tified by CHAOS and BLAST2 in our dataset as a function of the word size usedA figure showing the number and type of conserved elements iden-tified by CHAOS and BLAST2 in our dataset as a function of the word size usedClick here for fileAdditional data file 7A table providing GO analysis results for genes associated with col-linear nongenic SCEs located 1,000 bp upstream of the TSSA table providing GO analysis results for genes associated with col-linear nongenic SCEs located 1,000 bp upstream of the TSSClick here for file
R56.18 Genome Biology 2006, Volume 7, Issue 7, Article R56 Sanges et al. />Genome Biology 2006, 7:R56
Acknowledgements
We appreciate the useful input from two anonymous referees and we
should like to acknowledge helpful discussions with Michael Brudno, Cate-
rina Missero, Diego Di Bernardo, Marco Sardiello, Maria Luisa Chiusano,
Giovanni Colonna and Roberto di Lauro. We would also like to thank for
their technical support Marco De Simone, Mario Traditi and Alessandro
Davassi. A special acknowledgement also goes to the late Parvesh Mahtani,
who shared our enthusiasm for this project. This work was supported by
the Fondazione Telethon and the Sixth Framework Program of the Euro-
pean Commission (LSH-2003-1.1.0-1).
References
1. Blackwood EM, Kadonaga JT: Going the distance: a current view
of enhancer action. Science 1998, 281:60-63.
2. Oda-Ishii I, Bertrand V, Matsuo I, Lemaire P, Saiga H: Making very
similar embryos with divergent genomes: conservation of
regulatory mechanisms of Otx between the ascidians Halo-
cynthia roretzi and Ciona intestinalis. Development 2005,
132:1663-1674.
3. Dickmeis T, Muller F: The identification and functional charac-
terisation of conserved regulatory elements in developmen-
tal genes. Brief Funct Genomic Proteomic 2005, 3:332-350.
4. Chuzhanova NA, Krawczak M, Nemytikova LA, Gusev VD, Cooper
DN: Promoter shuffling has occurred during the evolution of
the vertebrate growth hormone gene. Gene 2000, 254:9-18.
5. Kermekchiev M, Pettersson M, Matthias P, Schaffner W: Every
enhancer works with every promoter for all the combina-
tions tested: could new regulatory pathways evolve by
enhancer shuffling? Gene Expr 1991, 1:71-81.
6. Surguchov A: Migration of promoter elements between genes:
a role in transcriptional regulation and evolution. Biomed Sci
1991, 2:22-28.
7. Boffelli D, Nobrega MA, Rubin EM: Comparative genomics at the
vertebrate extremes. Nat Rev Genet 2004, 5:456-465.
8. Dermitzakis ET, Reymond A, Antonarakis SE: Conserved non-
genic sequences: an unexpected feature of mammalian
genomes. Nat Rev Genet 2005, 6:151-157.
9. Glazko GV, Koonin EV, Rogozin IB, Shabalina SA: A significant frac-
tion of conserved noncoding DNA in human and mouse con-
sists of predicted matrix attachment regions. Trends Genet
2003, 19:119-124.
10. Sorek R, Ast G: Intronic sequences flanking alternatively
spliced exons are conserved between human and mouse.
Genome Res 2003, 13:1631-1637.
11. Weber MJ: New human and mouse microRNA genes found by
homology search. Febs J 2005, 272:59-73.
12. Aparicio S, Morrison A, Gould A, Gilthorpe J, Chaudhuri C, Rigby P,
Krumlauf R, Brenner S: Detecting conserved regulatory ele-
ments with the model genome of the Japanese puffer fish,
Fugu rubripes. Proc Natl Acad Sci USA 1995, 92:1684-1688.
13. Dermitzakis ET, Reymond A, Lyle R, Scamuffa N, Ucla C, Deutsch S,
Stevenson BJ, Flegel V, Bucher P, Jongeneel CV, Antonarakis SE:
Numerous potentially functional but non-genic conserved
sequences on human chromosome 21. Nature 2002,
420:578-582.
14. Bejerano G, Pheasant M, Makunin I, Stephen S, Kent WJ, Mattick JS,
Haussler D: Ultraconserved elements in the human genome.
Science 2004, 304:1321-1325.
15. Woolfe A, Goodson M, Goode DK, Snell P, McEwen GK, Vavouri T,
Smith SF, North P, Callaway H, Kelly K, et al.: Highly conserved
non-coding sequences are associated with vertebrate devel-
opment. PLoS Biol 2005, 3:e7.
16. Altschul SF, Gish W, Miller W, Myers EW, Lipman DJ: Basic local
alignment search tool. J Mol Biol 1990, 215:403-410.
17. Pearson WR, Lipman DJ: Improved tools for biological sequence
comparison. Proc Natl Acad Sci USA 1988, 85:2444-2448.
18. Bergman CM, Kreitman M: Analysis of conserved noncoding
DNA in Drosophila reveals similar constraints in intergenic
and intronic sequences. Genome Res 2001, 11:1335-1345.
19. Xie X, Lu J, Kulbokas EJ, Golub TR, Mootha V, Lindblad-Toh K,
Lander ES, Kellis M: Systematic discovery of regulatory motifs
in human promoters and 3' UTRs by comparison of several
mammals. Nature 2005, 434:338-345.
20. Blanchette M, Kent WJ, Riemer C, Elnitski L, Smit AF, Roskin KM,
Baertsch R, Rosenbloom K, Clawson H, Green ED, et al.: Aligning
multiple genomic sequences with the threaded blockset
aligner. Genome Res 2004, 14:708-715.
21. King DC, Taylor J, Elnitski L, Chiaromonte F, Miller W, Hardison RC:
Evaluation of regulatory potential and conservation scores
for detecting cis-regulatory modules in aligned mammalian
genome sequences. Genome Res 2005, 15:1051-1060.
22. Siepel A, Bejerano G, Pedersen JS, Hinrichs AS, Hou M, Rosenbloom
K, Clawson H, Spieth J, Hillier LW, Richards S, et al.: Evolutionarily
conserved elements in vertebrate, insect, worm, and yeast
genomes. Genome Res 2005, 15:1034-1050.
23. Ettwiller L, Paten B, Souren M, Loosli F, Wittbrodt J, Birney E: The
discovery, positioning and verification of a set of transcrip-
tion-associated motifs in vertebrates. Genome Biol 2005,
6:R104.
24. Brudno M, Chapman M, Gottgens B, Batzoglou S, Morgenstern B:
Fast and sensitive multiple alignment of large genomic
sequences. BMC Bioinformatics 2003, 4:66.
25. Brudno M, Malde S, Poliakov A, Do CB, Couronne O, Dubchak I, Bat-
zoglou S: Glocal alignment: finding rearrangements during
alignment. Bioinformatics 2003:i54-62.
26. Muller F, Blader P, Strahle U: Search for enhancers: teleost mod-
els in comparative genomic and transgenic analysis of cis reg-
ulatory elements. Bioessays 2002, 24:564-572.
27. Muller F, Chang B, Albert S, Fischer N, Tora L, Strahle U: Intronic
enhancers control expression of zebrafish sonic hedgehog in
floor plate and notochord. Development 1999, 126:2103-2116.
28. Rastegar S, Albert S, Le Roux I, Fischer N, Blader P, Muller F, Strahle
U: A floor plate enhancer of the zebrafish netrin1 gene
requires Cyclops (Nodal) signalling and the winged helix
transcription factor FoxA2. Dev Biol 2002, 252:1-14.
29. Brudno M, Do CB, Cooper GM, Kim MF, Davydov E, Green ED,
Sidow A, Batzoglou S: LAGAN and Multi-LAGAN: efficient
tools for large-scale multiple alignment of genomic DNA.
Genome Res 2003, 13:721-731.
30. Appendix to paper by Sanges .R et al. [ />sce.html]
31. Birney E, Andrews D, Caccamo M, Chen Y, Clarke L, Coates G, Cox
T, Cunningham F, Curwen V, Cutts T, et al.: Ensembl 2006. Nucleic
Acids Res 2006, 34:D556-D561.
32. Mayor C, Brudno M, Schwartz JR, Poliakov A, Rubin EM, Frazer KA,
Pachter LS, Dubchak I: VISTA: visualizing global DNA sequence
alignments of arbitrary length. Bioinformatics 2000,
16:1046-1047.
33. Ashburner M, Ball CA, Blake JA, Botstein D, Butler H, Cherry JM,
Davis AP, Dolinski K, Dwight SS, Eppig JT, et al.: Gene ontology:
tool for the unification of biology. The Gene Ontology Con-
sortium. Nat Genet 2000, 25:25-29.
34. Beissbarth T, Speed TP: GOstat: find statistically overrepre-
sented Gene Ontologies within a group of genes. Bioinformatics
2004, 20:1464-1465.
35. Sprague J, Clements D, Conlin T, Edwards P, Frazer K, Schaper K,
Segerdell E, Song P, Sprunger B, Westerfield M: The Zebrafish
Information Network (ZFIN): the zebrafish model organism
database. Nucleic Acids Res 2003, 31:241-243.
36. The Zebrafish Information Network [ />37. Walton RZ, Bruce AE, Olivey HE, Najib K, Johnson V, Earley JU, Ho
RK, Svensson EC: Fog1 is required for cardiac looping in
zebrafish. Dev Biol 2006, 289:482-493.
38. Kudoh T, Tsang M, Hukriede NA, Chen X, Dedekian M, Clarke CJ,
Kiang A, Schultz S, Epstein JA, Toyama R, Dawid IB: A gene expres-
sion screen in zebrafish embryogenesis. Genome Res 2001,
11:1979-1987.
39. Kudoh T, Dawid IB: Zebrafish mab21l2 is specifically expressed
in the presumptive eye and tectum from early somitogenesis
onwards. Mech Dev 2001, 109:95-98.
40. Zecchin E, Conigliaro A, Tiso N, Argenton F, Bortolussi M: Expres-
sion analysis of jagged genes in zebrafish embryos. Dev Dyn
2005, 233:638-645.
41. Smale ST, Kadonaga JT: The RNA polymerase II core promoter.
Annu Rev Biochem 2003, 72:449-479.
42. Ludwig MZ, Bergman C, Patel NH, Kreitman M: Evidence for sta-
bilizing selection in a eukaryotic enhancer element. Nature
2000, 403:564-567.
43. Tautz D: Evolution of transcriptional regulation. Curr Opin
Genet Dev 2000, 10:575-579.
44. Poulin F, Nobrega MA, Plajzer-Frick I, Holt A, Afzal V, Rubin EM, Pen-
nacchio LA: In vivo characterization of a vertebrate ultracon-
served enhancer. Genomics 2005, 85:774-781.
Genome Biology 2006, Volume 7, Issue 7, Article R56 Sanges et al. R56.19
comment reviews reports refereed researchdeposited research interactions information
Genome Biology 2006, 7:R56
45. Adams MD: Conserved sequences and the evolution of gene
regulatory signals. Curr Opin Genet Dev 2005, 15:628-633.
46. Nobrega MA, Zhu Y, Plajzer-Frick I, Afzal V, Rubin EM: Megabase
deletions of gene deserts result in viable mice. Nature 2004,
431:988-993.
47. Enhancer Browser [ />48. Miles CG, Rankin L, Smith SI, Niksic M, Elgar G, Hastie ND: Faithful
expression of a tagged Fugu WT1 protein from a genomic
transgene in zebrafish: efficient splicing of pufferfish genes in
zebrafish but not mice. Nucleic Acids Res 2003, 31:2795-2802.
49. Aparicio S, Chapman J, Stupka E, Putnam N, Chia JM, Dehal P, Christ-
offels A, Rash S, Hoon S, Smit A, et al.: Whole-genome shotgun
assembly and analysis of the genome of Fugu rubripes. Science
2002, 297:1301-1310.
50. Liu Z, Garrard WT: Long-range interactions between three
transcriptional enhancers, active Vkappa gene promoters,
and a 3' boundary sequence spanning 46 kilobases. Mol Cell
Biol 2005, 25:3220-3231.
51. Pederson T: The spatial organization of the genome in mam-
malian cells. Curr Opin Genet Dev 2004, 14:203-209.
52. Van Hellemont R, Monsieurs P, Thijs G, de Moor B, Van de Peer Y,
Marchal K: A novel approach to identifying regulatory motifs
in distantly related genomes. Genome Biol 2005, 6:R113.
53. Dennis G Jr, Sherman BT, Hosack DA, Yang J, Gao W, Lane HC, Lem-
picki RA: DAVID: Database for Annotation, Visualization, and
Integrated Discovery. Genome Biol 2003, 4:P3.
54. Boguski MS, Lowe TM, Tolstoshev CM: dbEST: database for
'expressed sequence tags'. Nat Genet 1993, 4:332-333.
55. Cochrane G, Aldebert P, Althorpe N, Andersson M, Baker W, Bald-
win A, Bates K, Bhattacharyya S, Browne P, van den Broek A, et al.:
EMBL Nucleotide Sequence Database: developments in
2005. Nucleic Acids Res 2006, 34:D10-D15.
56. Burge C, Karlin S: Prediction of complete gene structures in
human genomic DNA. J Mol Biol 1997, 268:78-94.
57. Giardine B, Elnitski L, Riemer C, Makalowska I, Schwartz S, Miller W,
Hardison RC: GALA, a database for genomic sequence align-
ments and annotations. Genome Res 2003, 13:732-741.
58. Zhang Z, Schwartz S, Wagner L, Miller W: A greedy algorithm for
aligning DNA sequences. J Comput Biol 2000, 7:203-214.
59. Kothary R, Clapoff S, Darling S, Perry MD, Moran LA, Rossant J:
Inducible expression of an hsp68-lacZ hybrid gene in trans-
genic mice. Development 1989, 105:707-714.
60. Muller F, Lakatos L, Dantonel J, Strahle U, Tora L: TBP is not uni-
versally required for zygotic RNA polymerase II transcrip-
tion in zebrafish. Curr Biol 2001, 11:282-287.
61. Akimenko MA, Johnson SL, Westerfield M, Ekker M: Differential
induction of four msx homeobox genes during fin develop-
ment and regeneration in zebrafish. Development 1995,
121:347-357.
62. Kimmel CB, Ballard WW, Kimmel SR, Ullmann B, Schilling TF: Stages
of embryonic development of the zebrafish. Dev Dyn 1995,
203:253-310.
63. Müller F, Williams DW, Kobolak J, Gauvry L, Goldspink G, Orban L,
Maclean N: Activator effect of coinjected enhancers on the
muscle-specific expression of promoters in zebrafish
embryos. Mol Reprod Dev 1997, 47:404-412.
64. Müller F, Chang B, Albert S, Fischer N, Tora L, Strahle U: Intronic
enhancers control expression of zebrafish sonic hedgehog in
floor plate and notochord. Development 1999, 126:2103-2116.
65. Parks RJ, Bramson JL, Wan Y, Addison CL, Graham FL: Effects of
stuffer DNA on transgene expression from helper-depend-
ent adenovirus vectors. J Virol 1999, 73:8027-8034.