Báo cáo y học: " Yale University School of Medicine, 333 Cedar Street, PO Box 208005, New Haven" pps
Bạn đang xem bản rút gọn của tài liệu. Xem và tải ngay bản đầy đủ của tài liệu tại đây (451.82 KB, 10 trang )
Genome Biology 2006, 7:R59
comment reviews reports deposited research refereed research interactions information
Open Access
2006Halaszet al.Volume 7, Issue 7, Article R59
Method
Detecting transcriptionally active regions using genomic tiling
arrays
Gabor Halasz
*†
, Marinus F van Batenburg
*‡
, Joelle Perusse
§
, Sujun Hua
§
,
Xiang-Jun Lu
*
, Kevin P White
§¶
and Harmen J Bussemaker
*¥
Addresses:
*
Department of Biological Sciences, Columbia University, 1212 Amsterdam Avenue, New York, NY, 10027 USA.
†
Integrated Program
in Cellular, Molecular and Biophysical Studies, Columbia University, 630 w. 168th Street, New York, NY, 10032 USA.
‡
Bioinformatics
Laboratory, Academic Medical Center, University of Amsterdam, Meibergdreef 15, 1105 AZ Amsterdam, The Netherlands.
§
Department of
Genetics, Yale University School of Medicine, 333 Cedar Street, PO Box 208005, New Haven, CT, 06520-8005, USA.
¶
Department of Ecology
and Evolutionary Biology, Yale University, 165 Prospect Street, PO Box 208106, New Haven, CT, 06250-8106, USA.
¥
Center for Computational
Biology and Bioinformatics, Columbia University, 1130 St. Nicholas Avenue, New York, NY, USA.
Correspondence: Harmen J Bussemaker. Email:
© 2006 Halasz et al.; licensee BioMed Central Ltd.
This is an open access article distributed under the terms of the Creative Commons Attribution License ( which
permits unrestricted use, distribution, and reproduction in any medium, provided the original work is properly cited.
Detecting transcription with tiling arrays<p>A new method for designing and integrating genomic tiling array data is described and applied to Anopheles and human arrays.</p>
Abstract
We have developed a method for interpreting genomic tiling array data, implemented as the
program TranscriptionDetector. Probed loci expressed above background are identified by
combining replicates in a way that makes minimal assumptions about the data. We performed
medium-resolution Anopheles gambiae tiling array experiments and found extensive transcription of
both coding and non-coding regions. Our method also showed improved detection of
transcriptional units when applied to high-density tiling array data for ten human chromosomes.
Background
A complete understanding of an organism's biology requires
identification of the complete set of RNA transcripts it
expresses. Elucidating this 'transcriptome' has proven chal-
lenging for two reasons. First, even when a complete genome
sequence is available, it has proven difficult to define the
exact location and number of protein-coding genes [1]. Sec-
ond, many transcripts are non-coding RNAs, which are
thought to play a largely regulatory role, and are often active
at relatively low levels, or in a tissue-specific manner.
Expressed sequence tag (EST) sequencing and similar tech-
niques will, therefore, often fail to detect them.
To fully catalog transcripts, several groups have used genomic
microarrays, which assay expression with probes spaced
more or less evenly along the genome [2-15]. These tools have
higher sensitivity than EST sequencing, and provide a high-
throughput way of measuring RNAs from different samples
and cellular contexts. Whole-genome array studies of Arabi-
dopsis thaliana [12,14], Drosophila melanogaster [13], Sac-
charomyces cerevisiae [4,10], Oryza sativa [8], Mus
musculus [5] and Homo sapiens [2,3,6,7,9,11,15] all detect a
great deal of transcription outside known protein-coding
regions.
Despite the usefulness and recent popularity of whole-
genome arrays, to date there is no standard way to perform
such experiments or analyze their data [16]. Existing studies
vary, among others, in their method of finding a threshold
above which transcripts are considered to be expressed, in
their choice of negative controls (if any) to obtain this thresh-
old, and in their manner of combining information from mul-
Published: 19 July 2006
Genome Biology 2006, 7:R59 (doi:10.1186/gb-2006-7-7-r59)
Received: 26 September 2005
Revised: 5 January 2006
Accepted: 5 July 2006
The electronic version of this article is the complete one and can be
found online at />R59.2 Genome Biology 2006, Volume 7, Issue 7, Article R59 Halasz et al. />Genome Biology 2006, 7:R59
tiple arrays. One feature that is usually shared, however, is the
inference of transcriptional activity based on the signal inten-
sities of multiple adjacent probes [2-9,11,15,17].
Various approaches are also used to account for background
intensity (cross-hybridization to probes by partially comple-
mentary transcripts), probe sequence features that systemat-
ically bias signal measurements, and variability in the range
of intensities between different arrays. Several studies have
explicitly modeled signal intensities to distinguish signal
from background noise. These models incorporate parame-
ters for transcript concentration and probe-specific affinities
[18,19] and array- and dye-associated variability in signal
intensity [20], or explain signal intensity for a probe as a func-
tion of its sequence using statistical and thermodynamic
models [21-25]. They usually differentiate between signal
arising from hybridization of cognate transcript to the probe
(specific hybridization) and signal arising from cross-hybrid-
ization. Finally, normalization procedures have been devel-
oped to remove non-biological variability between replicate
microarray experiments [26].
In this paper, we introduce a strategy for designing and inter-
preting genome-wide tiling experiments, the final result of
our analysis being a list of probed loci that are putatively
expressed. Like some other methods [3,6,7,10,14], we make
use of negative control probes that represent non-specific
background hybridization to evaluate the significance of
expression of individual probed loci. However, we combine
information from replicates in a way that makes minimal
assumptions about the distribution of signal intensities and
avoids putting a threshold on individual replicates. In addi-
tion, we model the dependence of non-specific hybridization
on probe sequence; subtracting the systematic bias explained
by these models greatly improves our ability to detect tran-
scripts. For high-density arrays, the signal of neighboring
probes can be combined to take advantage of the fact that the
same transcript will contribute to the intensity of multiple
probes, but this is not essential to our approach, which can,
therefore, be successfully applied to low-density tiling array
data as well.
Results
Correcting for the effect of probe sequence on non-
specific hybridization
Each of our arrays contained 76,782 probes interrogating
annotated exons of Anopheles gambiae (exon probes (EPs)),
94,469 non-exon probes (NEPs), and 1,000 negative control
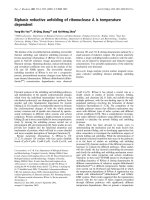
probes (NCPs). As expected, the signal intensity distribution
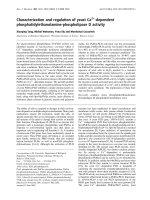
of EPs is shifted to the right of the NCP distribution (Figure
1). NEPs exhibit a similar albeit less pronounced shift, indi-
cating that a substantial fraction of the non-coding regions
are expressed above background. However, these differences
may be partly explained by differences in probe sequence
composition between the populations. Several studies have
addressed the effect of probe sequence on signal intensity and
developed tools to infer underlying transcript abundances
using this information [21-25]. We also use a sequence-based
model that reduces this non-biological variability in signal.
However, since our goal is to infer which probed loci are tran-
scribed at all (and not, for example, to determine which of two
transcripts is more abundant), a relatively simple model deal-
ing exclusively with background suffices for our purposes. If
the null hypothesis that the signal intensity for a given probe
can be fully explained by cross-hybridization and random
noise is rejected, we conclude that this is due to hybridization
of cognate transcript.
Since NCPs were designed as concatenations of 12-mers not
found anywhere in the A. gambiae genome (see Materials and
methods), their signal intensities can be considered as back-
ground only. This enables us to search for a relationship
between probe sequence and background intensity. One such
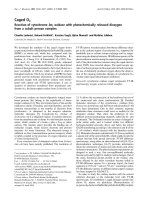
feature that needs to be accounted for if the signal intensities
are to faithfully reflect transcript abundance is GC content.
High GC content is associated with strong hydrogen bonding
and an increased propensity to 'catch' cross-hybridizing RNA
transcripts, which tend to be GC rich as well. This leads to a
positive correlation between the signal intensity of a probe
and its GC content (Figure 2), as had been previously
observed for Affymetrix arrays [25,27].
To determine the best way to correct for probe sequence bias,
we tested a number of different sequence models, ranging
from a simple GC content model to a fully position-specific
sequence model, which is an adaptation of [23,25,27]. Nega-
tive control probe intensities were fit independently for each
Signal intensity distributions of probes measuring annotated A. gambiae exons (EPs), non-exon regions (NEPs) and negative controls (NCPs)Figure 1
Signal intensity distributions of probes measuring annotated A. gambiae
exons (EPs), non-exon regions (NEPs) and negative controls (NCPs).
Cumulative distribution functions of signal intensities for these probe
populations are shown for a representative channel.
5
10
15
log
2
signal intensity
0
0.2
0.4
0.6
0.8
1
Fraction of probes
Exon Probes (EP)
Non-exon Probes (NEP)
Negative Control Probes (NCP)
Genome Biology 2006, Volume 7, Issue 7, Article R59 Halasz et al. R59.3
comment reviews reports refereed researchdeposited research interactions information
Genome Biology 2006, 7:R59
'channel' (that is, each unique combination of array and dye).
The fraction of the NCP intensity variance that can be
explained in terms of probe sequence ranges from 3% for the
GC content model to 17% for the position-specific model
(Table 1). We observed considerable variation in the model
parameters between channels (data not shown), presumably
due to channel-specific differences in labeling or synthesis.
Each model fit was used to normalize the intensity of all
probes to that of a reference probe in which all four bases are
equally likely at any position (see Materials and methods).
Correcting probe intensities by accounting for sequence bias
did not substantially change the distribution of the three
probe populations (supplementary Figure 1 in Additional
data file 6). However, as discussed below and shown in the
last column of Table 1, even the relatively modest reduction in
variance of the NCP probe intensities achieved by the model-
based probe sequence correction has a profound effect on the
number of probed regions found to be transcribed. We
decided to use the 'Full Position-specific' model for all our
subsequent analysis.
Dealing with variation in signal intensity across
channels
Each probe has 10 signal intensity measurements associated
with it (five labelings of each sex). Clearly, all of these values
must be used in our determination of significance, but it is not
obvious how to combine the 10 values in a parametric way.
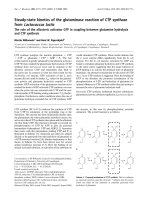
There is considerable variability in the distribution of intensi-
ties between microarrays, even when duplicate measure-
ments (RNA samples from the same sex, labeled with the
same dye) are considered (Figure 3; supplementary Figure 2
in Additional data file 6). In addition, there is considerable
variation between different dye labelings on the same
microarray, regardless of whether or not a probe sequence
based signal correction has been applied to the data (supple-
mentary Figure 3 in Additional data file 6). Because of these
pronounced channel-specific effects, averaging of intensities
across different experiments is not well justified.
Our approach solves this problem by pooling data from differ-
ent channels in a fully non-parametric way, thereby avoiding
any assumptions about how the different channels relate to
each other. The only assumption we make is that of a
monotonic relationship between signal intensity and tran-
script abundance for a given channel once the intensities have
been corrected for probe sequence bias, as described above.
The first step in this process assigns a channel-specific 'sin-
gle-channel' p value to each probe, defined as the fraction of
NCPs with signal intensity larger than that of the probe within
the same channel. The second step combines the single-chan-
Linear dependence of signal intensity on GC content for negative control probesFigure 2
Linear dependence of signal intensity on GC content for negative control
probes. Average log
2
signal intensity of NCPs with indicated GC content,
for six channels.
15
20
25
30
GC content
6
7
8
9
10
Average log
2
Intensity
Array 1
male (Cy3)
Array 3
male (Cy5)
Array 4
male (Cy5)
Array 1
female (Cy5)
Array 3
female (Cy3)
Array 4
female (Cy3)
Table 1
Summary of sequence correction models
Model Formalism Number of
parameters
Average R
2
Average adjusted R
2
Number of
transcriptionally active
regions
Uncorrected NA NA NA NA 47,463
GC log I =
β
0
+
β
GC
(N
C
+ N
G
) 2 0.0293 0.0284 52,384
Nucleotide-specific log I =
β
0
+
β
A
N
A
+
β
C
N
C
+
β
G
N
G
4 0.0412 0.0373 53,982
Bilinear
log I =
β
0
+
41 = 36 + 4 + 1 0.0980 0.0604 61,731
Full Position-specific
log I =
β
0
+
109 = 36 × 3 + 1 0.1709 0.0703 71,400
Overview of the models used to relate probe sequence to signal intensity. The Full Position-specific model has the highest R
2
and also the highest
adjusted R
2
, indicating that overfitting is not a concern. The rightmost column shows the number of probed loci classified as transcriptionally active,
which varies greatly with the sequence model used. NA, not applicable.
δβ
i
i
bi
=
∑
1
36
()
δ
ibi
i
,()
=
∑
1
36
R59.4 Genome Biology 2006, Volume 7, Issue 7, Article R59 Halasz et al. />Genome Biology 2006, 7:R59
nel p values for each probe into a single 'multi-channel p
value' (MCPV), reflecting the likelihood that the set of inten-
sities observed for that probe can be interpreted as back-
ground signal. This approach obviates the need to explicitly
model dye- and array-specific effects [20].
Residual bias of negative control probes after sequence
correction
In a classic approach to combining the result from multiple,
independent statistical tests performed for the same feature,
the product of individual p values is interpreted as a new test
statistic, and transformed to a variable that is uniformly dis-
tributed between zero and one under the null assumption of
independent tests for that feature, using a property of the
χ
2
distribution [28] or an equivalent geometric approach [29].
We will refer to the resulting p value as a 'Fisher p value'.
The single-channel p values for NCPs are by construction uni-
formly distributed. However, it is not clear that the model-
based correction for probe sequence bias is capable of com-
pletely removing any probe-specific bias in NCP intensity
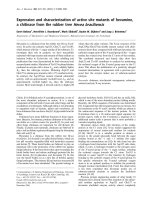
across channels. As Figure 4a shows, the Fisher p values
obtained by integrating the single-channel p values for each
NCP across channels are far from uniformly distributed. The
peak near zero (one) corresponds to negative control probes
that consistently have a bias towards higher (lower) signal
intensity. This probe-specific bias in signal intensity remains
even after sequence correction. A plausible explanation of this
residual bias is that each probe will receive cross-hybridiza-
tion contributions to its background signal intensity from a
highly specific subset of transcripts that is unique to each
probe. The probe-specific intensity correlations across chan-
nels created in this way lead directly to the distribution
observed in Figure 4a. Indeed, if we artificially create such
correlations by simulating NCP signal intensities as a probe-
specific random normal variate to which a probe and channel
specific random variate with the same standard deviation is
added, and then calculate Fisher p values, we obtain a curve
that strikingly resembles Figure 4a (data not shown). The
shape of Figure 4a also remains unchanged when we repeat
our analysis after removing the top and bottom 10% of NCPs
as ranked by Fisher p value, indicating that the bias is not lim-
ited to a small subset of outlier probes. Explicit modeling of
cross-hybridization between a probe and all possible tran-
scripts is possible [30], but beyond the scope of this paper. It
is interesting that while our sequence model only takes into
account the probe sequence and is, therefore, not able to
parameterize this probe-specific contribution to the back-
ground signal, the Fisher p values nevertheless reveal the
existence of a probe-specific bias in the residual NCP
intensities.
Multi-channel p values: integrating evidence for
transcription across channels
The existence of a subtle correlation between channels, pre-
sumably due to specific off-target hybridization, makes it
impossible to use Fisher p values to integrate single-channel
p values across multiple channels. However, we do want to
integrate weak evidence for transcription from individual
channels for the EP and NEP probes. This goal can be
achieved by first computing the product of single-channel p
values (derived from the NCP intensity distribution) for both
NCP and EP/NEP probes. Multi-channel p values (MCPV) for
EP/NEP are then defined as the fraction of NCPs with a p
value product smaller than that for the probe in question (see
Materials and methods). Comparison of Figure 1 with Figure
4b shows the increased separation between NCP, NEP, and
EP distributions when evidence for transcription is integrated
across channels.
Application to low-density genomic array data for
mosquito
The MCPVs defined above are by construction uniformly dis-
tributed between zero and one for NCPs. They can, therefore,
be considered to be bona fide p values that can be used as the
basis for a false discovery rate procedure to obtain a list of
putatively transcribed probed loci. To this end, we created a
computer program called TranscriptionDetector that
implements the pipeline detailed in Figure 5. It is available for
download [31]. Given probe sequences and signal intensities
for a set of identically designed arrays, TranscriptionDetector
returns a list of probed loci expressed above background.
Running it on the A. gambiae data set described above, we
found that 26% of NEP and 51% of EP probes detect tran-
scriptionally active loci.
Variation between channels in the distribution of signal intensities for NCPsFigure 3
Variation between channels in the distribution of signal intensities for
NCPs. Cumulative distribution functions of signal intensities for NCPs for
different channels are shown.
5
6
7
8 9 10 11
log
2
intensity
0
0.2
0.4
0.6
0.8
1
Fraction of probes
Array 1
male (Cy3)
Array 3
male (Cy5)
Array 4
male (Cy5)
Array 1
female (Cy5)
Array 3
female (Cy3)
Array 4
female (Cy3)
Genome Biology 2006, Volume 7, Issue 7, Article R59 Halasz et al. R59.5
comment reviews reports refereed researchdeposited research interactions information
Genome Biology 2006, 7:R59
Application to high-density human tiling array data
On high-resolution tiling arrays, where probes are spaced
closely together, a given transcript will contribute to the sig-
nal intensity of multiple consecutive probes. The more probes
with a low MCPV we encounter in a given genomic region, the
more confident we are that the region is transcribed. This rea-
soning is in direct analogy with that used to derive MCPVs in
the first place: instead of integrating evidence across chan-
nels, we now wish to integrate evidence across adjacent
probes. We achieved this by adding a 'smoothing' step, in
which the MCPV of each probe is replaced by the Fisher p
value obtained by combining its MCPV with that of its nearby
neighbors. It is crucial that only non-overlapping neighboring
probes be included in this neighborhood set, to guarantee the
statistical independence of the various MCPVs that are being
combined.
We compared the results of our method to that obtained by
Cheng et al. [3] in their analysis of 10 human chromosomes
using 25 base-pair (bp) probes at 5 bp resolution. This study
lacked NCPs specifically designed not to match any genomic
region, so we used a set of 2,634 non-spiked-in bacterial
probe pairs instead. When smoothing using n probes on
either side of the central probe (that is, combining 2n + 1
MCPVs), we found that performance increased up to n = 5
and then stabilized, so we settled on that value, which
corresponds to a region of approximately 275 bp. Applying a
threshold to the resulting smoothed MCPVs classifies each
probe as 'expressed' or 'not expressed'. Optionally, we applied
the 'minrun' and 'maxgap' criteria used by Cheng et al. [3]
(see Materials and methods).
Figure 6 shows receiver operating characteristic (ROC)
curves quantifying the sensitivity and specificity of our
method at varying threshold value, using the genomic coordi-
nates of 'known genes', mRNAs, and ESTs from the UCSC
genome annotation database as a 'gold standard' (see Materi-
als and methods). The point marked by the '+' symbol corre-
sponds to the 'transfrags' reported by Cheng et al. [3], who
applied a parametric smoothing procedure to their signal
intensities, classified probes whose intensity exceeded a sig-
nificance threshold in at least one of the replicates as
'expressed', and joined these positive probes into 'transfrags'
using the minrun/maxgap procedure. The effectiveness of
our non-parametric evidence integration across replicates is
demonstrated by the fact that simply applying the minrun/
maxgap criterion of Cheng et al. [3] after setting a MCPV
threshold without the benefit of neighborhood smoothing
already gives a similar performance (Figure 6, green line).
When neighborhood smoothing (n = 5) is applied to the
MCPVs (Figure 6, blue line) our method outperforms that of
Cheng et al. [3], and the difference becomes even more pro-
nounced when minrun/maxgap post-processing is applied: at
the same false positive rate, the sensitivity for detecting the
combined UCSC annotations is improved by 17%; at the same
false negative rate, the specificity is improved by 37%. It is
interesting to note that most of the improvement comes from
the detection of ESTs (supplementary Figure 4 in Additional
data file 6), which tend to be expressed at a lower level.
Discussion
We have described a method for designing and interpreting
genomic tiling array data that makes minimal assumptions
about intensity distribution and variation between replicates.
Combining the results from any number of hybridizations to
a microarray whose design includes a set of NCPs, our algo-
rithm assigns one MCPV to each probe, which can be used to
determine which probed loci are transcriptionally active.
Applying a signal intensity threshold only after the evidence
Combining information from replicate experimentsFigure 4
Combining information from replicate experiments. (a) Distribution of
Fisher p values for NCPs, obtained by taking the product of channel-
specific p values and comparing it to the product of random numbers
drawn from a uniform distribution (see [28]). The solid line corresponds
to probe signal intensities that were first corrected for probe sequence
bias using the Full Position-specific model (see Materials and methods); the
dashed line corresponds to uncorrected intensities. (b) Distribution of the
negative log of products of single-channel p values for different probe
populations.
0
5
10
15
20
25
30
Negative log
10
of product of channel-specific p values
0
0.2
0.4
0.6
0.8
1
Fraction of probes
Exon Probes (EP)
Non-exon Probes (NEP)
Negative Control Probes (NCP)
0 0.2 0.4
0.6
0.8 1
Fisher p value
0
50
100
150
200
250
300
Number of NCP probes
No sequence correction
"Full model" sequence correction
(a)
(b)
R59.6 Genome Biology 2006, Volume 7, Issue 7, Article R59 Halasz et al. />Genome Biology 2006, 7:R59
Schematic overview of the TranscriptionDetector data processing pipelineFigure 5
Schematic overview of the TranscriptionDetector data processing pipeline. First, a model accounting for the effect of probe sequence on non-specific
binding is fit to the (log-transformed) NCP signal intensities ('step 1') and used to correct the intensity for all probes ('step 2'); a separate model is fit for
each channel. For each probe, we then derive a p value reflecting the likelihood that its signal intensity belongs to the background distribution represented
by the NCPs ('step 3'); these p values are calculated separately for each channel, and each channel-specific p value is treated as the outcome of an
independent experiment. A multi-channel statistic equal to the product of p values across all channels is computed for each probe ('step 4'). In analogy with
step 3, the distribution of this statistic for the NCPs only is then used to assign a MCPV to the other probes ('step 5'). To control for multiple hypothesis
testing, a FDR procedure is used, and each probed locus is designated as transcribed or not transcribed ('step 6').
Transcription detector pipeline
Channel 1 Channel N
EPs &
NEPs
EPs &
NEPs
NCPs
NCPs
Sequence
model
Sequence
model
Sequence correction
Sequence correction
Corrected
EPs &
NEPs
Corrected
EPs &
NEPs
Corrected
NCPs
Negative
Control
Disrbution
Corrected
NCPs
Negative
Control
Disrbution
P values P values
Product of single-channel
P values for EPs & NEPs
Product of single-channel
P values for NCPs
Negative
Control
Disrbution
Multi-channel P values (MCPVs)
FDR procedure
Probes measuring transcriptionally
active regions
1
2
3
4
5
6
Genome Biology 2006, Volume 7, Issue 7, Article R59 Halasz et al. R59.7
comment reviews reports refereed researchdeposited research interactions information
Genome Biology 2006, 7:R59
from multiple channels has been combined enhances the sen-
sitivity of our method. Including NCPs in the design of our
microarray allowed us to quantitatively model the depend-
ence of background signal intensity on probe sequence, with-
out the need to simultaneously parameterize specific and
non-specific contributions to signal intensity [21-24]. Reduc-
ing the variance of the NCP probe intensities by accounting
for sequence bias using this model greatly increased the
number of transcripts detected. More sophisticated sequence
models could further improve our method's sensitivity.
The probe sequence correction (and for high-density tiling
arrays the size of the smoothing neighborhood) is the only
parametric component of our method. Beyond that, our algo-
rithm uses a completely non-parametric approach to the
problem of signal variability across channels; no assumptions
are made about the distribution of signal intensities in each
channel. Of course, there is the risk of decreased statistical
power when using non-parametric methods when a paramet-
ric one would be justified. To address this issue explicitly, we
calculated channel-specific Z-scores for each probe based on
the mean and standard deviation of NCP intensity for each
channel, and averaged these across channels for each probe.
Alternatively, we performed quantile normalization [26], and
then averaged intensities across channels for each probe. In
both cases, the normalized and averaged intensities were sub-
sequently used to derive a multi-channel p value for each
probe. These parametric variants of our method gave results
very similar to the approach defined in Figure 4. The Z-score-
based approach identifies 96% to 99% of the probes reported
in Table 1, while reporting 1% to 10% novel probes, depending
on the sequence correction used; the corresponding ranges
for the normalization-based scheme are 94% to 97% and 1%
to 2%, respectively. In summary, this comparison shows that
we are not sacrificing statistical power for the sake of
simplicity.
Our initial attempt at integrating evidence across channels
using Fisher p values uncovered a systematic probe-specific
bias in NCP signal that persists across channels even after
sequence correction (compare Figure 4a). It is interesting to
note that this bias also manifests itself in the Z-score repre-
sentation: if we compute the mean Z-score for each NCP
probe across channels, the standard deviation of these means
(0.638) is about twice as large as the inverse square root of 10,
that is, the value that would be expected for 10 independent
channels. Presumably, this effect is due to the sequence-spe-
cific partial hybridization between each control probe and a
subset of the RNA transcripts present in the cell. This under-
scores the fact that, despite being designed to have at least
three mismatches, NCPs are subject to substantial cross-
hybridization. While it cannot be excluded that tiling probes
experience a somewhat different spectrum of cross-hybridi-
zation contributions due to internal similarities within the
genome, it seems reasonable to use the NCP intensities to
estimate their variance.
The fraction of significantly expressed probed loci found for
A. gambiae is considerably lower than the figure we reported
for D. melanogaster in [13]. We attribute this discrepancy to
an improvement in our analysis, specifically: a change in the
definition of negative control probes; and our more stringent
way of computing MCPVs. Repeating our analysis of A. gam-
biae using Fisher p values caused 43% of probed non-exonic
loci and 75% of exonic loci to be classified as transcriptionally
active, numbers that are very similar to those reported in [13].
Given the relatively sparse placement of probes on the A.
gambiae arrays, and to avoid making assumptions about the
structure or size of transcribed regions, we determined the
significance of each probed locus independently of its neigh-
bors. As we demonstrate using a high-density human data set,
our method can be readily extended to take advantage of the
fact that, at higher probe densities, a single transcript can
contribute to the signal intensity of multiple adjacent probes.
It is, therefore, useful for interpreting both high-density tiling
arrays, where spatial dependencies can be exploited, and low-
density arrays, where adjacent probes are too far apart to
yield such information.
Materials and methods
Array design
The NASA Oligonucleotide Probe Selection Algorithm
(NOPSA) was used to select optimal 36-mer probes measur-
ing expression from EPs and NEPs. Coding and non-coding
regions were identified based on annotations from the
Ensembl database (file anopheles_gambiae_core_15_2). As
a control for non-specific EP and NEP hybridization, 4,000
ROC curves showing true positive rate versus false positive rate relative to transcripts annotated in the UCSC databaseFigure 6
ROC curves showing true positive rate versus false positive rate relative
to transcripts annotated in the UCSC database. The '+' symbol
corresponds to the transfrags as defined by Cheng et al. [3]. Lines
correspond to our algorithm as applied with/without neighborhood
smoothing and with/without minrun/maxgap post-processing.
0 0.2 0.4
0.6
0.8 1
False positive rate
0
0.2
0.4
0.6
0.8
1
True positive rate
No Smoothing
No Smoothing + Minrun/Maxgap
Smoothing
Smoothing + Minrun/Maxgap
Cheng et al. (2005) [3]
R59.8 Genome Biology 2006, Volume 7, Issue 7, Article R59 Halasz et al. />Genome Biology 2006, 7:R59
dodecanucleotides absent from the A. gambiae genome were
identified computationally. NCPs were then formed by ran-
dom concatenation of three such 12-mers, guaranteeing that
each NCP had at least three mismatches relative to any 36
nucleotide stretch of the Anopheles genome. Five microar-
rays, each containing an identical set of 76,782 EPs, 94,469
NEPs and 1,000 NCPs were synthesized using Maskless array
synthesizer (MAS) technology [32].
Samples and hybridization
Three to five day old A. gambiae adults (G3 strain) were
sorted by sex and homogenized in Trizol. Total RNA was iso-
lated using Heavy phase lock gel columns (Invitrogen,
Carlsbad, CA, USA) and polyadenylated RNA was extracted
using oligodT chromatography columns (BioRad, Hercules,
CA, USA). We labeled 3 µg of each experimental sample by
chemical coupling of Cy3 or Cy5 dyes (Amersham, Piscata-
way, NJ, USA) to the aminoallyl nucleotide introduced during
cDNA synthesis (Powerscript reverse transcriptase, BD Bio-
sciences, Franklin Lakes, NJ, USA). Labeled samples were
purified using RNeasy columns (Qiagen, Valencia, CA, USA)
and hybridized overnight at 52°C to high density oligonucle-
otide microarrays. The arrays were scanned using an Axon
scanner (Molecular Devices Corporation, Sunnyvale, CA,
USA). Males were labeled twice with Cy3 and three times with
Cy5; the reverse was done for females. Each array measured
RNA from both sexes.
Probe sequence bias correction
Five different models were used to relate NCP sequence to
signal intensity (Table 1). The most basic is the 'GC model',
which assumes a linear relationship between signal log-inten-
sity and GC content. The 'Nucleotide-specific model' is
slightly more complex, explaining the signal in terms of the
representation of each base, not just G and C. The remaining
two models take position dependencies into account by allow-
ing different segments of the probe to make independent con-
tributions to binding, and are described below.
The 'Bilinear model' derives both base- and position-specific
parameters, under the assumption that these two variable
types are independent. The signal intensity of each probe is
then given by:
where
γ
i
is the weight for position i along the probe,
β
b
is the
weight for base b, b(i) is the base at position i, and n is the
length of the probe. The values for the two sets of model
parameters were determined by iterating between regression
of
γ
and
β
until convergence.
The 'Full Position-specific model' combines the base and
position weights into a single parameter
δ
i,b,
reflecting the
weight associated with having base b at position i. The signal
log-intensity is then simply given by:
This last model is essentially that of [23], who explained most
of the variance in signal intensity with weights associated
with a particular base at a particular position, and found that
terms modeling features of secondary structure were less
important. Other studies have used very similar models, but
parameterize the positional dependence for each base as a
polynomial [27] or using a spline [25].
Computing Fisher P values for putatively independent
channels
For each probe k, we first computed a test statistic
τ
k
equal to
the product of all single-channel p values P
kc
:
where c labels the channel and n is the total number of chan-
nels. Fisher p values were then computed as the probability
that uniformly distributed independent random variables
would yield a product of p values as high as that observed for
a given probe. This probability is given by:
See [29] for details.
Multi-channel p values and false discovery rate
procedure
Since cross-hybridizing transcripts invalidate the independ-
ence assumption, MCPVs were ultimately used in our proce-
dure. These were obtained by comparing the
τ
statistic (as
defined above) for each probe to a null distribution composed
of the
τ
-values for the NCPs. A significance threshold was
derived using a false discovery rate (FDR) procedure [33],
using an FDR of 5%. Briefly, MCPVs were ranked in strictly
increasing order: P
1
≤ P
2
≤ P
n
. The largest i for which:
where
α
= 0.05, represents the largest MCPV that is still sig-
nificant. Probes with MCPV less than or equal to P
i
are, there-
fore, considered to detect loci expressed above background.
Evidence integration for adjacent probes on high-
density tiling arrays
For each probe, Fisher p values were calculated over its
MCPVs and those of up to n upstream and n downstream
probes. If there were fewer than 2n probes within 30 × (n)
log( ) *
()
I
i
i
n
bi
=
=
∑
γβ
1
δ
ibi
i
n
,()
=
∑
1
τ
kkc
c
n
P=
=
∏
1
F
i
n
i
i
n
()
(ln)
!
ττ
τ
=
−
=
−
∑
0
1
P
i
n
i
≤
α
Genome Biology 2006, Volume 7, Issue 7, Article R59 Halasz et al. R59.9
comment reviews reports refereed researchdeposited research interactions information
Genome Biology 2006, 7:R59
nucleotides of the central probe, only these were used in the
calculation. Because overlapping probes are not independent,
only completely non-overlapping probes were used. The
Fisher p value itself was calculated in exactly the same way as
for putatively independent channels - the test statistic is now:
where k labels the central probe being evaluated and P
i
is the
MCPV for probe i.
Analyisis of Affymetrix high-density human tiling array
data
Affymetrix CEL expression files, CDF probe annotatation
files, and negative control probe data were downloaded from
[34]. An array-specific p value was computed for each tiling
path probe by comparing its log(PM/MM) value to a negative
control distribution of non-spiked-in bacterial probe pairs. P
values for different replicates were combined into a single
MCPV, which in turn were smoothed as described in the pre-
vious section, using n = 5. To keep our comparison with
Cheng et al. [3] focused, we did not sequence correct probe
intensities and applied the same minrun (50 bp) and maxgap
(30 bp) criteria as described in that study (probes above a cer-
tain smoothed MCPV threshold were considered positive; if
two such positive probes were within maxgap bases of each
other, all probes between them were also considered positive;
a contiguous stretch of positive probes must be at least min-
run bases in length, otherwise the probes in the 'failed' run are
considered negative).
ROC curve analysis
Transcribed regions ('transfrags') predicted by Cheng et al.
[3] (cytosolic/polyA+ samples only) were downloaded from
[34], and a union was taken across all cell lines. UCSC
genome annotation files for ESTs, mRNAs, and annotated
('known') genes were downloaded from [35]. Probes overlap-
ping any part of these UCSC regions were taken to be our gold
standard, relative to which sensitivity and specificity were
calculated. For Cheng et al. [3], the predicted probes were
considered to be those overlapping their predicted transfrags.
For our analysis, predicted probes were obtained as described
in the previous section, using a range of MCPV thresholds.
Data deposition
Raw expression data for the present study has been submitted
to the NCBI Gene Expression Omnibus as series GSE5196.
Additional data files
The following additional data are available with the online
version of this paper. Additional data file 1 contains probe
sequence and raw signal intensities for exon probes. Addi-
tional data file 2 contains probe sequence and raw signal
intensities for non-exon probes. Additional data file 3 con-
tains probe sequence and raw signal intensities for negative
control probes. Additional data file 4 contains genomic
coordinates for regions measured by exon probes. Additional
data file 5 contains genomic coordinates for regions meas-
ured by non-exon probes. Additional data file 6 contains four
supplementary figures: supplementary Figure 1 demon-
strates that signal variability between different probe popula-
tions on the same channel is not explained by probe sequence
composition; supplementary Figure 2 shows Q-Q plots for
NCP signal intensities in different channels, showing that
these have heterogeneous and non-normal distributions;
supplementary Figure 3 demonstrates that signal variability
between negative control probes on different channels is not
explained by probe sequence composition; supplementary
Figure 4 has two ROC curves showing true positive rate ver-
sus false positive rate relative to (a) mRNA and (b) EST tran-
scripts annotated in the UCSC database (the '+' symbol
corresponds to the transfrags as defined by Cheng et al. [3];
and lines correspond to our algorithm as applied with/with-
out neighborhood smoothing and with/without minrun/
maxgap post-processing).
Additional date file 1Probe sequence and raw signal intensities for exon probesProbe sequence and raw signal intensities for exon probesClick here for fileAdditional date file 2Probe sequence and raw signal intensities for non-exon probesProbe sequence and raw signal intensities for non-exon probesClick here for fileAdditional date file 3Probe sequence and raw signal intensities for negative control probesProbe sequence and raw signal intensities for negative control probesClick here for fileAdditional date file 4Genomic coordinates for regions measured by exon probesGenomic coordinates for regions measured by exon probesClick here for fileAdditional date file 5Genomic coordinates for regions measured by non-exon probesGenomic coordinates for regions measured by non-exon probesClick here for fileAdditional date file 6Four supplementary figuresSupplementary Figure 1 demonstrates that signal variability between different probe populations on the same channel is not explained by probe sequence composition; supplementary Figure 2 shows Q-Q plots for NCP signal intensities in different channels, showing that these have heterogeneous and non-normal distribu-tions; supplementary Figure 3 demonstrates that signal variability between negative control probes on different channels is not explained by probe sequence composition; supplementary Figure 4 has two ROC curves showing true positive rate versus false positive rate relative to (a) mRNA and (b) EST transcripts annotated in the UCSC database (the '+' symbol corresponds to the transfrags as defined by Cheng et al. [3]; and lines correspond to our algorithm as applied with/without neighborhood smoothing and with/with-out minrun/maxgap post-processing)Click here for file
Acknowledgements
We are grateful to an anonymous reviewer for valuable and detailed com-
ments. HJB was supported by grants from the National Institutes of Health
(HG003008, CA121852). KPW was supported by grants from the WM
Keck Foundation, the Arnold and Mabel Beckman Foundation, and the
NIH/NHGRI. MFvB was supported by grant BMI-050.50.201 from the
Netherlands Organization for Scientific Research (NWO). GH was sup-
ported by an NIH training program in molecular biophysics (GM08281).
References
1. Hogenesch JB, Ching KA, Batalov S, Su AI, Walker JR, Zhou Y, Kay
SA, Schultz PG, Cooke MP: A comparison of the Celera and
Ensembl predicted gene sets reveals little overlap in novel
genes. Cell 2001, 106:413-415.
2. Bertone P, Stolc V, Royce TE, Rozowsky JS, Urban AE, Zhu X, Rinn
JL, Tongprasit W, Samanta M, Weissman S, et al.: Global identifica-
tion of human transcribed sequences with genome tiling
arrays. Science 2004, 306:2242-2246.
3. Cheng J, Kapranov P, Drenkow J, Dike S, Brubaker S, Patel S, Long J,
Stern D, Tammana H, Helt G, et al.: Transcriptional maps of 10
human chromosomes at 5-nucleotide resolution. Science
2005, 308:1149-1154.
4. David L, Huber W, Granovskaia M, Toedling J, Palm CJ, Bofkin L,
Jones T, Davis RW, Steinmetz LM: A high-resolution map of tran-
scription in the yeast genome. Proc Natl Acad Sci USA 2006,
103:5320-5325.
5. Frey BJ, Mohammad N, Morris QD, Zhang W, Robinson MD, Mnaim-
neh S, Chang R, Pan Q, Sat E, Rossant J, et al.: Genome-wide anal-
ysis of mouse transcripts using exon microarrays and factor
graphs. Nat Genet 2005, 37:991-996.
6. Kampa D, Cheng J, Kapranov P, Yamanaka M, Brubaker S, Cawley S,
Drenkow J, Piccolboni A, Bekiranov S, Helt G, et al.: Novel RNAs
identified from an in-depth analysis of the transcriptome of
human chromosomes 21 and 22. Genome Res 2004, 14:331-342.
7. Kapranov P, Cawley SE, Drenkow J, Bekiranov S, Strausberg RL,
Fodor SP, Gingeras TR: Large-scale transcriptional activity in
chromosomes 21 and 22. Science 2002, 296:916-919.
8. Li L, Wang X, Stolc V, Li X, Zhang D, Su N, Tongprasit W, Li S, Cheng
Z, Wang J, Deng XW: Genome-wide transcription analyses in
rice using tiling microarrays. Nat Genet 2006, 38:124-129.
9. Rinn JL, Euskirchen G, Bertone P, Martone R, Luscombe NM, Hart-
man S, Harrison PM, Nelson FK, Miller P, Gerstein M, et al.: The
transcriptional activity of human Chromosome 22. Genes Dev
τ
ki
ikn
kn
P=
=−
+
∏
R59.10 Genome Biology 2006, Volume 7, Issue 7, Article R59 Halasz et al. />Genome Biology 2006, 7:R59
2003, 17:529-540.
10. Samanta MP, Tongprasit W, Sethi H, Chin CS, Stolc V: Global iden-
tification of noncoding RNAs in Saccharomyces cerevisiae by
modulating an essential RNA processing pathway. Proc Natl
Acad Sci USA 2006, 103:4192-4197.
11. Schadt EE, Edwards SW, GuhaThakurta D, Holder D, Ying LVS, Svet-
nik V, Hart KW, Russell A, Li G, Cavet C, et al.: A comprehensive
transcript index of the human genome generated using
microarrays and computational approaches. Genome Biol
2004, 5:R73.
12. Schmid M, Davison TS, Henz SR, Pape UJ, Demar M, Vingron M,
Scholkopf B, Weigel D, Lohmann JU: A gene expression map of
Arabidopsis thaliana development. Nat Genet 2005, 37:501-506.
13. Stolc V, Gauhar Z, Mason C, Halasz G, van Batenburg MF, Rifkin SA,
Hua S, Herreman T, Tongprasit W, Barbano PE, et al.: A gene
expression map for the euchromatic genome of Drosophila
melanogaster. Science 2004, 306:655-660.
14. Yamada K, Lim J, Dale JM, Chen H, Shinn P, Palm CJ, Southwick AM,
Wu HC, Kim C, Nguyen M, et al.: Empirical analysis of transcrip-
tional activity in the Arabidopsis genome. Science 2003,
302:842-846.
15. Shoemaker DD, Schadt EE, Armour CD, He YD, Garrett-Engele P,
McDonagh PD, Loerch PM, Leonardson A, Lum PY, Cavet G, et al.:
Experimental annotation of the human genome using micro-
array technology. Nature 2001, 409:922-927.
16. Royce TE, Rozowsky JS, Bertone P, Samanta M, Stolc V, Weissman S,
Snyder M, Gerstein M: Issues in the analysis of oligonucleotide
tiling microarrays for transcript mapping. Trends Genet 2005,
21:466-475.
17. Frey BJ, Morris QD, Zhang W, Mohammad N, Hughes TR: Genrate:
a generative model that finds and scores new genes and
exons in genomic microarray data. Pac Symp Biocomput
2005:495-506.
18. Hubbell E, Liu WM, Mei R: Robust estimators for expression
analysis. Bioinformatics 2002, 18:1585-1592.
19. Li C, Wong WH: Model-based analysis of oligonucleotide
arrays: expression index computation and outlier detection.
Proc Natl Acad Sci USA 2001, 98:31-36.
20. Kerr MK, Churchill GA: Bootstrapping cluster analysis: assess-
ing the reliability of conclusions from microarray
experiments. Proc Natl Acad Sci USA 2001, 98:8961-8965.
21. Hekstra D, Taussig AR, Magnasco M, Naef F: Absolute mRNA con-
centrations from sequence-specific calibration of
oligonucleotide arrays. Nucleic Acids Res 2003, 31:1962-1968.
22. Held GA, Grinstein G, Tu Y: Modeling of DNA microarray data
by using physical properties of hybridization. Proc Natl Acad Sci
USA 2003, 100:7575-7580.
23. Mei R, Hubbell E, Bekiranov S, Mittmann M, Christians FC, Shen MM,
Lu G, Fang J, Liu WM, Ryder T, et al.: Probe selection for high-
density oligonucleotide arrays. Proc Natl Acad Sci USA 2003,
100:11237-11242.
24. Zhang L, Miles MF, Aldape KD: A model of molecular interac-
tions on short oligonucleotide microarrays [see comment].
Nature Biotechnol 2003, 21:818-821.
25. Wu Z, Irizarry RA, Gentleman R, Murillo FM, Spencer F: A Model
Based Background Adjustment for Oligonucleotide Expres-
sion Arrays. In Department of Biostatistics Working Papers Baltimore,
MD: John Hopkins University; 2004.
26. Bolstad BM, Irizarry RA, Astrand M, Speed TP: A comparison of
normalization methods for high density oligonucleotide
array data based on variance and bias. Bioinformatics 2003,
19:185-193.
27. Naef F, Magnasco MO: Solving the riddle of the bright mis-
matches: labeling and effective binding in oligonucleotide
arrays. Phys Rev E Stat Nonlin Soft Matter Phys 2003, 68:011906.
28. Fisher RA: Statistical Methods for Research Workers 11th edition. Edin-
burgh: Oliver & Boyd; 1950.
29. Bailey TL, Gribskov M: Estimating and evaluating the statistics
of gapped local-alignment scores. J Comput Biol 2002, 9:575-593.
30. Huang JC, Morris QD, Hughes TR, Frey BJ: GenXHC: a probabil-
istic generative model for cross-hybridization compensation
in high-density genome-wide microarray data. Bioinformatics
2005, 21(Suppl 1):i222-i231.
31. TranscriptionDetector Information and Software [http://
bussemakerlab.org/software/TranscriptionDetector/]
32. Nuwaysir EF, Huang W, Albert TJ, Singh J, Nuwaysir K, Pitas A, Rich-
mond T, Gorski T, Berg JP, Ballin J, et al.: Gene expression analysis
using oligonucleotide arrays produced by maskless
photolithography. Genome Res 2002, 12:1749-1755.
33. Benjamini YH, Yosef : Controlling the false discovery rate: a
practical and powerful approach to multiple testing. J Roy
Statist Soc 1995, 57:289-300.
34. Affymetrix Human Transcriptome Project [http://transcrip
tome.affymetrix.com/publication/transcriptome_10chromosomes/]
35. UCSC Genome Annotation Database [http://hgdown
load.cse.ucsc.edu/goldenpath/10april2003/database/]