the art of scalability scalable web architecture processes and organizations for the modern enterprise phần 3 potx
Bạn đang xem bản rút gọn của tài liệu. Xem và tải ngay bản đầy đủ của tài liệu tại đây (6.11 MB, 59 trang )
ptg5994185
BUILDING TEAMS—A SPORTS ANALOGY 93
Building Teams—A Sports Analogy
Professional football team coaches and management know that having the right team
to accomplish the mission is critical to reaching the Super Bowl in any given season.
Furthermore, they understand that the right team today might not be the right team
for next season; rookie players enter the sport stronger and faster than ever before;
offensive strategies and needs change; injuries plague certain players; and salary caps
create downward pressure on the total value of talent that can exist within any team
in any year.
Managing team skill sets and skill levels in professional sports is a constant job
requiring the upgrading of talent, moving personnel to different positions, manage-
ment of depth and bench strength, selection of team captains, recruiting new talent,
and coaching individual high performance players.
Imagine a coach or general manager faced with the difficult task of needing to
bring in a new player at a high salary to fill a specific weakness in his team. That
coach is likely already at or near the team’s salary cap. The choices are to remove an
existing player, renegotiate one or more players’ salaries to make room for the new
player’s salary, or not hire the necessary player into the critical position. What do you
think would happen to the coach who decides to take no action and not hire the new
player? If his owners find out, they would likely remove him and if they didn’t find
out sooner or later, the team would atrophy and consistently turn out substandard
seasons resulting in lower ticket sales and unhappy shareholders (owners).
Our jobs as managers and executives are really no different than the jobs of the
coaches of professional football teams. Our salary caps are the budgets that are
developed by the executive management team and are reviewed and approved by our
boards of directors. In order to ensure that we are cost effectively doing our jobs with
the highest possible throughput and an appropriate level of quality, we too must con-
stantly look for the best talent available at a price that we can afford. Yet most of us
don’t actively manage the skills, people, and composition of our teams, which in turn
means that we aren’t doing the right thing for our company and our shareholders.
Scalability in professional sports means scaling the output of individuals; profes-
sional football, for instance, will not allow you to add a twelfth player. In your orga-
nization, scaling individuals might mean the same thing. The output of your
organization is dependent both on the output of any individual as well as the size of
your team. Efficiency in output, another component of scale (or at least scaling cost
effectively), is a measurement of getting more for the same amount of money or (bet-
ter yet) more for less money. Scaling with people then is a function both of the indi-
vidual people, the number of people, and the organization of people.
Now think about a coach who refused to spend time improving his players. Can
you imagine such a coach keeping her job? Similarly, can you imagine walking into
ptg5994185
94 CHAPTER 5MANAGEMENT 101
your next board of directors meeting and stating that part of your job is not to grow
and maintain the best team possible? Think about that last point for a minute. In our
last chapter on leadership, we made the case that everything you do needs to be
focused on shareholder value creation. Here, we have just identified a test to help you
know when you are not creating shareholder value. For any major action that you
make, would you go in and present it to the board of directors as something that
must be done? Remember that a decision to not do something is the same as deciding
to do something. Further, ignoring something that should be done is a decision not to
do it. If you have not spent time with the members of your team for weeks on end,
you have decided not to spend time with them and that is absolutely inexcusable and
not something that you would likely feel comfortable discussing with your board of
directors.
The parallels in professional sports to the responsibilities of team building for cor-
porate executives are clear but all too commonly ignored. To get our jobs done, we
must have the best talent (the best people) possible for our board authorized budgets.
We must constantly evaluate and coach our team to ensure that each member is add-
ing value appropriate to his level of compensation, find new and higher performing
talent, and coach the great talent that we have to even higher levels of performance.
Upgrading Teams—A Garden Analogy
Even a novice gardener knows that gardening is about more than just raking some
soil, throwing some seeds, and praying for rain. Unfortunately, if you are like most
managers, rake, throw, and pray is probably exactly what you do with your team.
Our team is a garden and our garden expects more of us than having manure spread
upon it at times convenient to us. As importantly, the scalability of our organization
as we described in our last metaphor is largely tied to how great our talent is on a per
person basis and how consistent their behaviors are with our corporate culture.
Gardens should be designed and so should our teams. Designing our teams means
finding the right talent that matches the needs of our vision and mission. Before
planting our garden or inserting new seeds or seedlings in our garden, we evaluate
how the different plants and flowers will interact. We should do the same with our
teams. Will certain team members steal too many nutrients? Will the soil (our cul-
ture) properly support their needs? Should the garden be full of only bright and bril-
liant flowers or will it be more pleasing with robust and healthy foliage to support
the flowers?
Managers in hyper-growth companies often spend a lot of time interviewing and
selecting candidates but usually not much time on a per candidate basis. Worst still,
these managers often don’t take the time to determine where they’ve gone wrong
ptg5994185
UPGRADING TEAMS—A GARDEN ANALOGY 95
with past hiring decisions and what they’ve done well in certain decisions. Finding
the right individual for your job requires paying attention to and correcting your past
failures and repeating your past hiring successes. We might interview for skills but
overlook critical items like cultural or team fit. Why have you had to remove people?
Why have people decided to leave?
Candidate selection also requires paying attention to the needs of the organization
from a productivity and quality perspective. Do you really need another engineer or
product manager, or do your pipeline inefficiencies indicate additional process defini-
tion needs, tools engineers, or quality assurance personnel?
Too often, we try to make hiring decisions after we’ve spent 30 to 60 minutes with
a candidate. We encourage you to spend as much time as possible with the candidate
and try to make a good hire the first time. Seek help in interviewing by adding people
whom you trust and who have great interviewing skills to your interview team. Call
previous managers and peers and be mindful to ask and prod for weaknesses of indi-
viduals in your background checks. Pay attention to more than just the skills and
determine whether you and your team will like spending a lot of time with the indi-
vidual. Interview the person to make certain that she will be a fit with your cultures
and that her behaviors are consistent with the behavioral expectations of the company.
The Cultural Interview
One of the most commonly overlooked components of any interview is interviewing a candidate
to ensure that he is a cultural and behavioral fit for your company. We recommend picking up a
book or taking a class on behavioral interviewing, but here are some things that you can do in
your next interview to find the right cultural and behavior fit for your company:
• Make a list of your company’s beliefs regarding people. They may be on the back of your
identification badge or on your intranet. Identify questions around these beliefs and dis-
tribute them to interview members.
• Identify interviewers who are both high performers within your team and a good match
with the cultures, beliefs, and behaviors of your company (or the behaviors to which your
company aspires).
• Gather after the interview and discuss the responses to the questions and the feelings of
the team.
It is as important to make the right cultural hire as it is to hire the right talent and experience.
Can you spend 9 to 12 hours a day with this person? Can the team do the same? Can you
learn from him? Will the candidate allow the team to teach him?
ptg5994185
96 CHAPTER 5MANAGEMENT 101
Feeding your garden means spending time growing your team. Of all the practices
in tending to your team, this is the one that is most often overlooked for lack of time.
We might spend time picking new flowers (though not enough on a per flower basis),
but we often forget about the existing flowers needing nourishment within our garden.
The intent of feeding is to help grow the members of your team who are producing
to the expectations of your shareholders. Feeding consists of coaching, praising, cor-
recting technique or approach, adjusting compensation and equity, and anything else
that creates a stronger and more productive employee.
Feeding your garden also means taking individuals who might not be performing
well in one position and putting them into positions where they can perform well.
However, if you find yourself moving an employee more than once, it is likely that
you are avoiding the appropriate action of weeding.
Finally, feeding your garden means raising the bar on the team overall and helping
employees achieve greater levels of success. Great teams enjoy aggressive but achiev-
able challenges, and it is your job as a manager to challenge them to be the best they
can be.
Although you should invest as much as possible in seeding and feeding, we all
know that underperforming and nonperforming individuals choke team productivity
just as surely as weeds steal vital nutrients from the flowers within your garden. The
nutrients in this case are the time that you spend attempting to coach underperform-
ing individuals to an acceptable performance level and the time your team spends
compensating for an underperforming individual’s poor results. Weeding our gardens
is often the most painful activity for most managers and executives, and as a result it
is often the one to which we tend last.
Although you must abide by your company’s practices regarding the removal of
people who are not performing (these practices vary not only by country but by state
as well), it is vital that you find ways to quickly remove personnel who are keeping
you and the rest of your team from achieving your objectives. The sooner you remove
them, the sooner you can find an appropriate replacement and get your team where it
needs to be.
When considering performance as a reason for termination, one should always
include an evaluation of the person’s behaviors. It is possible to have an individual
within an organization who creates more and gets more done than any other team
member, but whose actions and behaviors bring the total output of the team down.
This is typically pretty obvious in the case of an employee creating a hostile work
environment, but it can also be the case for an employee who simply does not work
well with others. For instance, you might have an employee who gets a lot done, but
does so in a manner that absolutely no one wants to work with him. The result might
be that you spend a great deal of time soothing hurt feelings or finding out how to
assign the employee work that does not require teamwork. If the employee’s actions
ptg5994185
UPGRADING TEAMS—A GARDEN ANALOGY 97
are such that she limits the output of the team, that limitation is by definition a scale
limitation and one upon which you should immediately act.
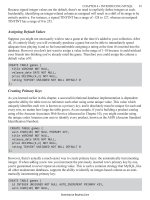
We’ve found that it’s often useful to use the concept of a two-dimensional axis
with defined actions such as in Figure 5.1. The x-axis here is the behavior of the
employee and the y-axis is the employee’s performance. Many employee reviews,
when done properly, identify the actions on the y-axis. But many such reviews do not
consider the impact of the behavioral x-axis. The idea here is that the employees you
want to keep are in the upper-right portion of our graph. Those that should be imme-
diately “weeded” are in the bottom-left portion of the graph. You should coach those
individuals in the upper-left and lower-right portion of the graph, but be prepared to
weed them should they not respond to coaching. And of course, you want all of your
seeds or new employees to be targeted in the upper-right portion of the graph.
One thing that we have learned over time is that you will always wish you had
acted earlier in removing underperformers. There are a number of reasons why you
just can’t act quickly enough, including company travel, competing requests, meet-
ings, and so on. You shouldn’t waste time agonizing over whether you are acting too
quickly—that never happens. You will always wish you had acted even sooner when
you have completed the termination.
Figure 5.1 Evaluating Behaviors and Performance
Performance
Unsatisfactory
Behavior
Superior
Great Performance
Bad Behavior
Poor Performance
Great Behavior
Poor Performance
Bad Behavior
Weed Immediately!
Coach or “Feed”—
If Unsuccessful,
Weed
Coach or “Feed”—
If Unsuccessful,
Weed
Feed!
Target for New
Hires
Great Performance
Great Behavior
ptg5994185
98 CHAPTER 5MANAGEMENT 101
Seed, Feed, and Weed to Succeed
To continually upgrade or improve our team’s performance, we need to perpetually perform
three individual activities:
• Seeding is the addition of new and better talent to our organization.
• Feeding is the development of the people within our organization we want to retain.
• Weeding is the removal of underperforming individuals within our organization.
As managers, we often spend too little time interviewing and selecting our new employees,
too little time developing and coaching our high performing employees, and act too late to
remove employees who do not display behaviors consistent with our culture or have the drive
and motivation to create shareholder wealth.
Measurement, Metrics, and Goal Evaluation
We’re not certain who first said it, but one of our favorite sayings is “You can’t
improve that which you do not measure.” Amazingly, we’ve found ourselves in a
number of arguments regarding this statement. These arguments range from “Mea-
surement is too expensive” to “I know intuitively whether I’ve improved something.”
You can get away with both of these statements if you are the only shareholder of your
company, though we would still argue that your results are going to be suboptimal. If
you happen to be a manager in a company with external shareholders, however, you
must be able to prove that you are creating shareholder value, and the only way to do
that is with data. Data in return requires measurements in order to be produced.
We believe in creating cultures that support measurement of nearly everything that
is related to the creation of shareholder value. With respect to scale, however, we
believe in bundling our measurements thematically. The themes we most often rec-
ommend for scale related purposes are cost, availability and response times, engineer-
ing productivity and efficiency, and quality.
As we’ve previously indicated, cost has a direct impact to the scalability of your
platform. You undoubtedly are either given or have helped develop a budget for the
company’s engineering initiatives. A portion of that budget in a growth company ide-
ally is dedicated to the scalability of your platform or services. This alone is an inter-
esting value to measure over time as we would expect that good managers will be
able to reduce the cost of scaling their platforms over time. Let’s assume that you
inherit a platform with scalability problems that manifest themselves as availability
issues. You might decide that you need to spend 30% to 50% of your engineering
time and a significant amount of capital to fix a majority of these issues in the first
ptg5994185
MEASUREMENT, METRICS, AND GOAL EVALUATION 99
two to 24 months of your job. However, something is wrong if you can’t slowly start
giving more time back to the business for business initiatives (customer features) over
time. We recommend measuring the cost of scale as both a percentage of total engi-
neering spending and as a cost per transaction.
Cost of scale as a percentage of engineering time should go down over time. But it’s
easy to “game” this number. If in year 1 you have a team of 20 engineers and dedicate
10 to scalability initiatives, you are spending 50% of your engineering headcount
related budget on scalability. If in year 2 you hire 10 more engineers but still only dedi-
cate the original 10 to scale, you are now spending only 33% of your budget. Although it
would appear that you’ve reduced the cost of scale, you’ve really kept it constant, which
could argue for measuring and reporting on the relative and absolute cost of scale.
Rather than reporting the absolute cost of scale (10 engineers, or $1.2M per
annum), we often recommend normalizing the value by the activities that create
shareholder value. If you are a Software as a Service platform (SaaS) provider and
make money on a per transaction basis, either through advertising or the charging of
transaction fees, this might be accomplished by reporting the cost of scale on a per
transaction basis. For instance, if you have 1.2 million transactions a year and spend
1.2 million in headcount on scale initiatives, your cost of scale would be $1/transac-
tion. Ouch! That’s really painful if you don’t make at least a dollar a transaction!
Availability is another obvious choice when figuring out what to measure. If you
see a primary goal of scalability initiatives as eliminating scalability related down-
time, you must measure availability and report on how much of your downtime is
associated with scalability problems within your platforms or systems. The intent
here is to eliminate lost opportunity associated with users not being able to complete
their transactions. In the Internet world, this most often is a real impact to revenue;
whereas in the back office information technology world, it might result in a greater
cost of operations as people are required to work overtime to complete jobs when
systems become available again.
Closely related to measuring availability for the purposes of scalability is measuring
response time of your systems. In most systems, increasing user perceived response
times often escalate to brownouts followed by blackouts or downtime for the system.
Brownouts are typically caused by systems performing so slowly that most users will
abandon their efforts, whereas blackouts are a result of a system that completely fails
under high demand. The measurement of response times should be against an abso-
lute service level agreement (SLA), even if that agreement isn’t published to the end
users. Ideally, the measurement is performed using actual end-user transactions rather
than proxies for their interaction. In addition to the absolute measurement against
internal or external service levels, relative measurement against past month values
should be tracked over time for critical transactions. This data can later be used to
justify projects if a slowing of any given critical transaction is proven to be tightly
correlated with revenue associated with that transaction, abandon rates, and so on.
ptg5994185
100 CHAPTER 5MANAGEMENT 101
Engineering productivity and efficiency is another important measurement when
considering scalability. Your first reaction may be that these two things have abso-
lutely nothing to do with the scalability of a platform. Consider an organization that
measures and improves the productivity of its engineers over time versus that of an
organization that has no such measurements. You would expect that the former will
start to produce more products and complete more initiatives at an equivalent cost to
the latter or that they would start to produce the same at a lower cost. Either of these
will help us in our scalability initiatives because if we produce more, by allocating an
equivalent percentage of our engineering team, we can get more done more quickly
and thereby reduce future scale demands on our engineering team. And if we can produce
the same at lower cost, we are increasing shareholder value as the net decrease in cost
structure to produce a scalable platform means greater profitability for the company.
The real trick in figuring out how to measure engineering productivity and effi-
ciency is to split it up into at least two component parts. The first part has to do with
whether your engineering teams are using as much of the available engineering days
as possible for engineering related tasks. To do this, assume that an engineer is avail-
able for 200 days/year minus your company’s sick time, vacation time, training time,
and so on. Maybe your company has 15 days of paid time off a year and expects
engineers to be in 10 days of training a year resulting in 175 engineering days/engi-
neer. This becomes the denominator within our equation. Then, subtract from this
denominator all of the hours and days spent “blocked” on issues related to unavail-
able build environments, nonworking test environments, broken tools or build envi-
ronments, missing source code or documentation, and so on. It shouldn’t surprise
you if you haven’t measured such value destroyers in the past to find out that you are
only getting to make use of 60% to 70% of your engineering days.
The second component part of engineering productivity and efficiency is to mea-
sure how much you get out of each of your engineering days. This is a much harder
exercise as it requires you to choose among a set of unattractive options. These
options range from measuring thousands of lines of code (KLOC) produced by an
engineer, to stories produced, function points produced, or use cases produced. The
options are unattractive as they all have “failures” within their implementation. For
instance, you may produce 100 lines of code per engineer per day, but what if you
really only need to write 10 to get the same job done? Function points on the other
hand are difficult and costly to calculate. Stories and use cases don’t really contain a
measure of complexity within their evaluation or use. As such, they all sound like bad
options. But a worse option is to decide not to measure this area at all. Training pro-
grams, after all, are intended to help increase individual output, and without some
sort of measurement of their effectiveness, there is no way to prove to a shareholder
that the money spent on training was well spent.
Quality rounds out our scalability management measurement suite. Quality has a
positive or negative impact on many of the other measurements. Poor product quality
ptg5994185
THE GOAL TREE 101
can cause scalability issues in the production environment and as a result can increase
downtime and decrease availability. Poor product quality causes an increase in cost
and a reduction in productivity and efficiency as rework is needed to meet the appro-
priate scalability needs. Although you obviously need to look at such typical metrics
as bugs KLOC in production and per release, absolute bug numbers for your entire
product, and the cost of your product quality initiatives, we also recommend further
breaking these out into the issues that affect scale. How many defects cause scalabil-
ity (response time or availability) problems for your team? How many do you release
per major or minor release of your code and how are you getting these to trend down
over time? How many do you catch in your quality assurance initiatives versus those
that are found in production, and so on?
The Goal Tree
One easy way to map organizational goals to company goals is through a goal tree. A
goal tree takes as its root one or more company or organizational goals and breaks it
down into the subordinate goals to achieve that major goal. Here, we will use the
computer science inverted view of a tree, where the root is at the top of the tree
rather than the bottom. For instance, AllScale may have a goal to “Achieve Profit-
ability by Q1.” As you can see in Figure 5.2, this company goal is at the “root” of the
tree. Johnny Fixer decides that the two ways he can increase profitability is by creating
more monetization opportunities and creating greater revenue at a reduced cost base.
Figure 5.2 Example Goal Tree for AllScale Networks
AllScale Goals
Achieve Profitability
by Q1
Greater Revenue at a Reduced Cost BaseMore Monetization Opportunities
Availability CostQuality Efficiency
Bugs per Push
0 P1
< 5 P2
Time to Verify Bugs
P1 < 1d
P2 < 2d
P3 < 5d
Coverage
100% regression per
push
Bugs/KLOC
0.15
Adserving 99.9%
Registration 99.99%
Scalability 99.99%
Response SLA 99.9%
$/1K Impression
Current $0.56
Goal $0.25
Days/Engineer
175/200 Days
KLOC/Day
.20/Day
Time to Market
Production SLA
New h/w 1wk
Hot fix 1d
Code push 1wk
ptg5994185
102 CHAPTER 5MANAGEMENT 101
Johnny determines that quality and availability affect the opportunity to monetize
AllScale’s platform and adds a number of quality and availability goals. One avail-
ability goal has to do with scalability (no more than .01% downtime for the quarter
due to scalability), and he also adds a 99.9% adherence to the internal response time
SLAs for the platform. Quality goals are to reduce the number of bugs per push (with
measurable amounts), reduce the time to verify bugs, increase test suite coverage for
regression tests, and have fewer than .15 bugs/KLOC outstanding in production.
From a cost perspective, Johnny desires to reduce the cost per thousand pages
delivered by over 50%. Johnny also wants to impact time to market (TTM), thereby
decreasing the cost of delivery, and has specific goals for that. Finally, he desires to
increase his engineering productivity and decides to count both used man days versus
available man days and KLOC produced per day.
Paving the Path for Success
So far, we’ve painted the picture of a manager as being equal parts task master, tacti-
cian, gardener, and measurement guru. But a manager’s job isn’t done there. Besides
being responsible for ensuring the team is up to the job, deciding on the path to take
to a goal, and measuring progress, a manager is also responsible for ensuring that the
path to that goal is bulldozed and paved. A manager who allows a team to struggle
unnecessarily over rough terrain on the way to an objective when he can easily pave
the way means reducing the output of the team. This reduction in output means the
team can’t scale efficiently, as less work is applied to the end goal. Less efficiency
means lower shareholder return for an investment.
Bulldozed is a rather aggressive term and we don’t mean to imply that a manager
should act as a fullback attempting to lay out a linebacker so that a halfback can
make a touchdown. Although that type of aggressive play might be required from
time to time, employing it all the time will get you a reputation that you’d rather not
have. Additionally, it may be absolutely unacceptable in some cultures. What we
mean here is that managers are responsible for removing obstacles to the success of
an organization and its objectives.
It is very easy for people to confuse this idea with “anything that stands in my way
is an obstacle to my success and should be removed.” Sometimes, the obstacles in
your way serve to ensure that you are performing the correct functions. For instance,
if you have a need to release something to your production environment, you might
see the quality assurance organization as an obstacle. This observation is at odds
with our definition of obstacle, as the QA organization serves to help you ensure that
you are meeting the shareholder’s needs for a higher quality product. The obstacle in
this case is actually you and your perception.
ptg5994185
CONCLUSION 103
Obstacles are issues that arise and for which the team is not equipped to handle.
Examples might be a failure of a partner to deliver software or hardware in a time
consistent with your needs or issues in getting testing support or capital to be freed
up for a project. The team isn’t working for you but rather with you. You may be the
captain of the team, but you are still a critical part of its success. Great managers
actually get their hands dirty and “help” the team accomplish its goals.
Conclusion
Management is about execution and all of the activities necessary to reach goals,
objectives, and vision, while adhering to the mission of the company. It should be
thought of as a “judicious and ethical use of means to accomplish an end.” Being
good at management, as is the case with leadership, requires a focus and commitment
to learning and growing as a manager. Management requires a focus on tasks, peo-
ple, and measurements to accomplish the desired goals.
Project and task management is essential to successful management. It includes the
disaggregation of goals into their associated projects and tasks, the assignment of
individuals and organizations to those tasks, the measurement of progress, communi-
cation of status, and resolution of issues. In larger projects, it will include the rela-
tionship of tasks to each other in order to determine which tasks should happen
when and to help determine timelines.
People management has to do with the composition and development of organiza-
tions and the hiring, firing, and development of individuals. We often spend too much
time with our underperformers and wait too long to eliminate them from the team.
The result is that we don’t spend enough time growing the folks who are truly adding
value. In general, we need to spend more time giving timely feedback to the individuals
on our team to ensure that they have an opportunity to create greater shareholder
value. We also spend a great deal of time interviewing new candidates in total, but
often not enough on a per candidate basis. Too often, our new team members have
spent 30 minutes to an hour with six to seven people before a hiring decision is made.
Spend enough time with people to be comfortable with welcoming them into your family.
Measurement is critical to management success. Without measurements and met-
rics, we cannot hope to improve, and if there is no hope for improvement, why
employ people as managers? We gave a number of measurement suggestions in
“Measurement, Metrics, and Goal Evaluation,” and we highly recommend a review
of these from time to time as you develop your scalability program.
Managers need to help their team complete its tasks. This means ensuring that
issues are resolved in a timely fashion and helping to ensure that issues don’t arise
whenever possible. Good managers will work to immediately remove barriers to suc-
cess and great managers keep them from arising in the first place.
ptg5994185
104 CHAPTER 5MANAGEMENT 101
Key Points
• Management is the judicious and ethical use of means to accomplish an end.
• As with leadership, the pursuit of management excellence is a lifelong goal and
as much a journey as it is a definition.
• As with leadership, management can be viewed as a function consisting of per-
sonal characteristics, skills, experiences, actions, and approaches. Increasing any
aspect increases your management “quotient.”
• Project and task management are critical to successful management. They
require the ability to decompose a goal into component parts, determine rela-
tionships of those parts, assignment of ownership with dates, and the measure-
ment of progress to those dates.
• People and organization management is broken into “seeding, feeding, and
weeding:”
q
Seeding is the hiring of people into an organization with the goal of getting
better and better people. Most managers spend too little time on the interview
process and don’t aim high enough. Cultural and behavioral interviewing
should be included when looking to seed new employees.
q
Feeding is the development of people within an organization. We can never
spend enough time giving good performance related feedback to our employees.
q
Weeding is the elimination of underperforming people within an organization.
It is almost impossible to do this “soon enough,” though we should feel obli-
gated to give someone performance related feedback first.
• We can’t improve that which we do not measure. Scalability measurements
should include measurements of availability, response time, engineering produc-
tivity and efficiency, cost, and quality.
• Goal trees are an effective way to map organizational goals to company goals
and help form the “causal roadmap to success.”
• Managers are responsible for paving the path to success. The most successful
managers see themselves as critical parts of their teams working toward a com-
mon goal.
ptg5994185
105
Chapter 6
Making the Business Case
In war, the general receives his command from the sovereign.
—Sun Tzu
So far in Part I, Staffing a Scalable Organization, we have talked about how impor-
tant it is to choose the right people, get them in the right roles, exercise great leader-
ship and management, and finally establish the right organization size and structure.
To pull this all together, we need to talk about the final link in the scalable organiza-
tion chain. This is how to make the business case for hiring resources, allocating
resources, and staying focused on scalability as a business initiative. In this chapter,
we are going to cover these topics and explain some of the reasons that many compa-
nies and their executive teams are so reluctant to listen to the lamentations of their
technology staff until it is too late. Most importantly we will give you some tips on
how to turn these problems around and become successful at making the proper
business case for scalability.
Understanding the Experiential Chasm
It is our belief that a great deal of the problem existing between many general manag-
ers and their technical teams is a result of a huge and widening chasm in education
and experience that causes a type of “destructive interference” in communication.
The education of the two individuals are often very different with the technical exec-
utive likely having taken an increasingly difficult and complex engineering curricu-
lum in college, whereas the general manager might have had a less math intensive
liberal arts undergraduate degree. The behaviors of the two executives may vary with
the technical executive likely having been promoted rightly or wrongly based on his
focused, somewhat introverted behavior (“put him in a dark room alone and he can
get anything done”) and with the general manager being much more extroverted,
ptg5994185
106 CHAPTER 6MAKING THE BUSINESS CASE
friendly, and “sales-person like.” The work experience likely varies with the general
manager having been promoted to her position through closing deals, selling propos-
als, and making connections. The technical executive might have been promoted
either based on technical brilliance or the ability to get product complete and poten-
tially shipped on time.
This mismatch in education and experience causes difficulty in communication for
several reasons. First, with very little in common, there is often little reason outside of
work specific tasks for the two people to communicate or have a relationship. They
might not enjoy the same activities and might not know the same people. Without
this common bond outside of work, the only way to build trust between the two indi-
viduals is through mutual success at work. Success may in the end create a bond that
kindles a relationship that can last through hard times, but when mutual success has
not yet been achieved, the spark that occurs kindles the opposite of trust; and with-
out trust, the team is doomed.
Second, without some previous relationship, communication does not happen on
mutual footing. Questions are often rightfully asked from a business perspective, and
the answers are often given in technical terms. The general manager may for instance
ask, “When can we ship the Maxim 360 Gateway for revenue release?” to which the
technical executive may respond, “We are having problems with the RF modulation
and power consumption and we are not sure if it is a software potentiometer or a
hardware rheostat. That said, I do not think we are off more than two weeks of the
original delivery schedule to QA.” Although the technical executive here gave a full
and complete response, it probably only frustrated the general manager as she likely
has no idea what a soft-pot or a rheostat is and may not even know what RF is. The
information came so fast and was intermixed with so many important, but to her
meaningless pieces of information that it just became confusing.
This resulting mismatch in communication actually quite often gives way to a
more destructive form of communication, which we call destructive interference.
Questions begin to be asked in a finger-pointing fashion—for example, “What are
you doing to keep this on track?” or “How did you let it slip a week?”—rather than
in a fashion meant to resolve issues early—such as, “Let us see if together we cannot
work to find out how we can get the project back on the timeline.” This is not to say
that you should not keep and hold high expectations of your management team, but
doing so should not create a destructive team dynamic. It is possible to both have high
standards and actually be a participative, supporting, and helpful leader and executive.
Why the Business Executive Might Be the Problem
Some questions can be asked to determine if the likely culprit of poor communication
is the business executive. Do not fret; we will give a similar set of questions to point
the blame at the technology executive. The most likely result is that some amount of
ptg5994185
UNDERSTANDING THE EXPERIENTIAL CHASM 107
fault resides with both, business and technology. Understanding this is a major step
toward fixing the problems and improving communication.
• Has the head of technology been replaced more than once?
• Do different people in the technology team give the business the same explana-
tions but they are still not believed?
• Do business leaders spend as much time attempting to understand technology as
they have spent learning to read financial statements?
• Do the business leaders understand how to ask questions to know whether dates
are both aggressive and achievable?
• Does the business spend time in the beginning of a product life cycle figuring out
how to measure success?
• Do business leaders lead by example or do they point fingers?
Chances are that at least one, and likely several, of the preceding points hits home.
We do not mean to imply that the business leaders are the only problem. However, if
they absolutely refuse to accept culpability in the problem, this is a huge warning
sign. The best leaders accept that they are at least part of the problem, and we believe
that the very best leaders believe that they are the source of most problems. It abso-
lutely may be the case, and often is the case, that other people need to be fired in
order to get the problem fixed. But if the business is constantly hiring and firing tech-
nology leaders, at the very least, they owe it to the shareholders to consider them-
selves part of the problem.
To get back on point, however, note how many of the preceding questions can be
easily traced back to education and experience. For instance, if you are getting con-
sistent answers throughout from your team, maybe it is the case that you just do not
understand what they are saying. There are two ways to resolve that: You can either
gain a better understanding of what it is they are telling you, or you can work with
them to speak a language that you better understand. Better yet, do both!
Why the Technology Executive Might Be the Problem
For nearly all of the reasons that the business executives are responsible for their own
frustration with the technology teams, so is the technical executive responsible. She is
standing on the opposite side of the chasm and is participating in the “staring game.”
Each is looking at the other and attempting to find ways to communicate effectively,
each ultimately falling into the mode of destructive interference that destroys trust
and organizations.
As promised, here are the questions to ask your technology leadership to see how
much of the communication problem it is responsible for.
ptg5994185
108 CHAPTER 6MAKING THE BUSINESS CASE
• Does the technology team provide you early feedback on the likelihood of mak-
ing key dates?
• Is that feedback consistently incorrect?
• Is the business experiencing the same problems over and over, either in produc-
tion or in product schedules?
• Does the technology team measure themselves against metrics that are meaningful?
• Are the technology choices couched in terms of technical merit rather than busi-
ness benefit and cost?
• Does the technology team understand what drives your business, who your
competitors are, and how your business will be successful?
• Does the technology team understand the business challenges, risks, obstacles,
and strategy?
Just as the business executives have not spent as much time understanding how to
run technical projects or how to “speak tech” as the technology leaders have spent
learning to read financial statements, it is also likely that the technical executive has
not spent a lot of time learning what truly drives your business. To be sure, he proba-
bly believes he knows. A good test is to have him define the technology metrics in
terms of things that are important to your business: revenue, profit, time to market,
barriers to entry, customer retention, and so on. It is critical for the technology exec-
utive to understand how the business makes money, the drivers of that revenue equa-
tion, the current financial reality within the business, and the current year’s financial
goals for the business.
In AllScale, as discussed in Chapter 2, Roles for the Scalable Technology Organi-
zation, the previous CTO was promoted based on his technical acumen. As the CEO
Christine quickly learned, the previous CTO had no business acumen and could not
properly explain the need for purchases or projects in business terms. This frustrated
the remainder of the company’s executives as technology initiatives were never tied to
business goals or needs. When other departments were cutting travel to save money,
the old CTO was buying extra terabytes of storage area network (SAN) space costing
hundreds of thousands of dollars that no one could explain the need for. The old
CTO would rely on the threat of “we either do this or we will die” to get all the other
executives in line. Although this worked for the short term, it left all the other execu-
tives feeling that something was not right with the decision that had to be forced on
them. Christine quickly saw this situation and put an end to it. She brought on board
the new CTO, Johnny Fixer, who understands both technology and business. Johnny
in only his first couple of months has been able to put metrics in place that represent
the business goals and can explain all of his team’s initiatives in terms of revenue gen-
eration or cost cutting. He has definitely been a welcome relief to the executive team.
ptg5994185
DEFEATING THE CORPORATE MINDSET 109
Defeating the Corporate Mindset
Lots of companies claim that technology is a key differentiator, critical to the busi-
ness, or in military lingo, a force multiplier, but the reality is that many of them,
including Software as a Service (SaaS) companies, treat technology as a support ser-
vice. There are two basic forms that a technology organization can take within a
business. One is to be a support service where technology supports the business pro-
cesses of manufacturing, sales, or any number of other business lines. The other form
that technology can take within a business is to be the product for the business, such
as with SaaS, infrastructure as a service (IaaS), hardware product companies, or Web
2.0 companies.
Being a support service and supporting other key business processes is a fine call-
ing. As a technologist, being the product that the business is founded around, while
often more stressful, is great as well. The terms usually applied to these are cost cen-
ter for the support service and profit center for the product development organiza-
tions. Cost center, as the name implies, is a center or organization that adds cost to
the income statement of a business usually at the Selling General and Administrative
expense line. A profit center is an organization that derives revenue for the business.
The problem arises when one type of company thinks of itself, or worse acts as if, it
were the other type. To understand this more, we need to dive into the two forms
deeper. All different types of organizations require technology support to ensure their
processes are efficient and consistent. Today’s manufacturing would be lost without
technology from computer numerical control (CNC) machines to ladder logic. These
types of companies and technology departments are hopefully upfront and aware of
how technology is viewed. It is a support service or cost center that will likely always
be viewed as a cost line item in the budget. No matter how scalable, artful, impres-
sive, or on time the tech is, the best these technology systems and projects can strive
for is a reduction of cost or improvement in efficiency for the business. We label this
view of technology as the “corporate mindset” because most very large corporations
whose primary business is not technology, Corporate America, have this view.
On the other hand, businesses that were founded on the technology as the product
hopefully see things quite differently. In companies such as eBay, PayPal, Amazon,
and Google, one would expect that executives view technology as being directly cor-
related with the revenue and treat them as a profit center. If a new feature is
requested for the system or platform, that feature should be predicated on a change
in revenue and a return on investment. These companies should understand in their
DNA that the technology is the business. This should not, however, give the technol-
ogy team carte blanche to spend any amount or not relate technology projects into
business terms; in fact, the opposite is true. These technology leaders owe it to the
business to justify and explain themselves just as thoroughly.
ptg5994185
110 CHAPTER 6MAKING THE BUSINESS CASE
If you are in Corporate America and the business has a corporate mindset about
technology, as it does with all other support functions such as human resources and
finance (assuming it is not an HR or CPA services company), the problems are much
more straightforward. If you want a technology project approved, you know you
need to cost justify it through cost cutting explanations. Although the problem is
clear cut, you will certainly have a more difficult challenge convincing your business
partners that improving the scalability of a particular platform is necessary. In this
case, you should pay particular attention to the next section where we will provide
some mechanisms to help you justify the projects.
The real challenges with corporate mindset come when it exists in a SaaS or Web
2.0 company. When the primary business of the company is selling the technology
product or service, yet the business leaders think the technology team simply sup-
ports their brilliant product ideas or sales initiatives, we have real problems. These
business executives are the ones who, if they were willing to answer, would answer
“yes” to all the questions in the preceding subsection “Why the Business Executives
Might Be the Problem.” Unfortunately, these executives are also probably not
insightful or self-reflective enough to think they could be part of the problem and
therefore need to be fixed. Having worked in a few and having been a spectator to
many of these types of environments, our first reaction is to run away. And if you are
lucky enough during the interview process to catch a vibe of this, our recommenda-
tion is to run away. These are uphill battles that we are getting ready to describe and
if you can avoid the confrontation, you are probably better off. We know, however,
that this is not always an option for any of us. Sometimes, you find yourself commit-
ted before you recognize this problem and you are faced with confronting and fixing
it rather than turning your back on it.
To solve the corporate mindset problem, we have seven ideas that you should con-
sider implementing. These are all things that as a technology leader are in your con-
trol. Waiting for your colleagues to wake up and realize their deficiencies will not
work. Take responsibility into your own hands and make the organization the type of
place that you want it to be. Here is the list of ideas:
1. Form relationships
2. Set the example
3. Educate other executives
4. Use the RASCI model
5. Speak in business terms
6. Get them involved
7. Scare the executive team with facts
ptg5994185
DEFEATING THE CORPORATE MINDSET 111
Forming Relationships
One of the best ways to start changing the business executives is to begin forming a
relationship with them. As discussed in the section “Understanding the Experiential
Chasm” of this chapter, a relationship is the key to communication. Start building
those relationships today. Schedule monthly lunches with each member of the execu-
tive staff. Spend time over a meal getting to know these team members, their careers,
their families, their business challenges. Pay attention and get to know them on mul-
tiple levels. Open up and share your background as well; let them get to know you.
The best teams in the world spend thousands of hours training with each other and
maybe even living together. When you think of great teams, you probably think of
professional sports teams or Navy SEALS or Delta Force. The one thing all of these
organizations have in common is a set of shared experiences and shared trials created
over thousands and thousands of hours of training time. You aren’t likely to spend as
much time creating relationships through shared experiences in your entire career as
these teams spend in a single year. The lesson here is that you need to force yourself
to create relationships with the people who are your peers and your boss.
Setting the Example
There may be finger pointing or, worse, backstabbing, politics, or gamesmanship
already existing on the executive staff or between departments. Avoid getting pulled
into this. Be the better person and set the example for how you want to see people
interact. Instead of jumping to defend your team, ask the person or group how can
we work together to solve this and learn from it. Pulling a concept from emotional
intelligence, start by asking if they are willing to accept that there is a better way.
This is supposed to be a very disarming question that opens people up to discussing
alternatives.
It surely will be tempting for most to jump in and start playing the games, setting
each other up for failure, and defending your actions. Avoid this if at all possible, but
remain on strong footing by looking for solutions. The worse case is that you are not
able to change the culture and you are eventually another technology executive that
pays the price for the business’s incompetence. Although this seems dire for you and
your career, leaving or being asked to leave a no-win scenario is better in the long run
than sticking it out and ultimately having the business fail, which is a likely outcome.
Educating Other Executives
One of the best things that you can do for your colleagues is to educate them about
technology and the role it plays in the business. There are many ways that you can
accomplish this. Some of them are covered below in the section below entitled “The
Business Case for Scale.” Some other ways include teaching classes on technology.
ptg5994185
112 CHAPTER 6MAKING THE BUSINESS CASE
This can be brownbag sessions over lunch or asking for 15 minutes each staff meet-
ing to discuss a technology subject. The more they understand how things work, how
complicated, and how different parts affect customers, the more likely they are to
being sympathetic and understanding when it comes to discussions about technology.
Another creative way to educate business executives is to invite them for a “tech-
nology ride-along.” This concept is similar to what police departments have set up
for private citizens to ride along with them on patrol. Usually, the citizens walk away
from this with a renewed respect for the police officers and the incredibly stressful
and tough job that they perform. Hopefully, this is what the business executives will
take away from the evening as well. To most business executives outside of technol-
ogy, what the technology team and system does is black magic and most likely they
are afraid to ask for fear of looking stupid. Get over this by reaching out to them and
inviting them to spend the night alongside you as you release the next version of the
product or patch bug fixes. As they come in the next morning from being up late,
they will likely appreciate the many late nights and intellectually challenging prob-
lems that you and your team face on a daily and weekly basis.
Using the RASCI Model
As we have covered in Chapter 2, we highly recommend the use of the RASCI model
for helping define role clarity for initiatives. As a quick review, R is Responsible, A is
Accountable, S is Supportive, C is Consulted, and I is Informed. The I is often given
lip service but generally not followed up on as intensely as the other roles. For help-
ing to solve the corporate mindset, we recommend reconsidering the importance of
the I. Technology initiatives are a great way to involve other business executives by
adding them to the list of those to keep informed about a particular project. Weekly
emails, monthly report outs, whatever manner your team deems necessary to keep
this group informed will aid in your initiative to fix the corporate mindset problem.
Speaking in Business Terms
Just because the business has not bothered to learn your native tongue, the language
of technology, does not mean that you should not try to speak in a language that they
can understand. If you have ever traveled internationally and you ran across native
people who attempted to speak English in order to make you feel more comfortable
and understood, you can relate to how your business counterparts will feel when you
start explaining things in their language. By making the effort to speak the universal lan-
guage of business, you will earn the gratitude and respect of your business counterparts.
Remember our points regarding the maximization of shareholder value. If you
hold a technology management or executive position, you are first and foremost a
manager or executive of that business. You must learn to speak the language of busi-
ness and you must also learn what drives your business. You cannot possibly maxi-
ptg5994185
DEFEATING THE CORPORATE MINDSET 113
mize shareholder value if you do not understand the concepts that drive all businesses
at a macro level and equally important your business at a micro level.
Translate projects, goals, and initiatives to business metrics such as revenue, cus-
tomer acquisition, customer retention, and so on. When providing an update on an
initiative, instead of describing the project as “the initiative to shard the database by
mod of customer_id,” try describing it as “the database project that will allow the
business to double revenue over the next year as the growth projections indicate.”
The last description will get them a lot more excited and help them understand it a
lot better.
Getting Them Involved
Even better than keeping the business executives informed about major technology
initiatives, get them involved. Moving them from no involvement to owning projects
is probably not going to happen overnight, but you can start by getting them
involved. Ask for members from their teams as Cs. The idea is that the more stakes
they have in the projects the more they will be interested and support you.
Another way to get the business executives involved is asking them to mentor your
top folks. It is always great for technologists to learn about the business, so this
should not be seen as unreasonable. The dual benefit is that while your key staff
members get exposure and education from the business leaders, your team members
are teaching the business leaders about technology and keeping them updated on
projects. It is a great win-win situation.
Scaring the Executive Team with Facts
Our last idea, when all else has failed and your business colleagues continue to not
give you support for necessary scalability projects, is to use the next outage as an
example of what will happen without a consistent and focused support on scalability.
The reality is that if you are not focused on continuous improvements and the scal-
ability of your applications, there will be a downtime event. Crisis is a catalyst for
change. It is easier to get people’s attention and get their support for change if they
have witnessed or experienced a calamity.
Note that this should never be your first choice and in most organizations should
truly be seen as a failure for the executive team to make the right calls. The only time
this is an appropriate approach is if all other options have failed. The only way this
approach will work is if you can show the case over time you’ve been attempting to
make for the need for scale. Additionally, this approach will only work one time. If
you are consistently using the “scared straight” method over and over to get your
way, you are in effect Chicken Little claiming that the sky is falling. You are either in
the wrong company or you are the wrong person for the job.
ptg5994185
114 CHAPTER 6MAKING THE BUSINESS CASE
That concludes the list of ideas that you should consider when attempting to rem-
edy the corporate mindset problem. Take notice that these are all actionable and put
you in control. Do not wait for your colleagues to wake up and realize they are part
of the problem. Be proactive, take responsibility, and make the organization what
you want it to be.
The Business Case for Scale
So far in this chapter, we have covered why there may be a communication break-
down between you and your business colleagues, perhaps even your boss. Next, we
covered the corporate mindset and why this may be a big problem for your business.
Lastly, we provided some ideas on how to change the corporate mindset and get your
business colleagues involved and supportive of your scalability projects. Now that
you have a clear understanding of why a problem might exist, how this problem can
negatively affect your efforts to build a scalable platform, and what to do about it, it
is time to focus on the last piece of the puzzle: the business case for scale. After you
have your boss’ and colleagues’ attention and support, wrap the whole thing up by
explaining in clear business related terminology the need for scalability. In this sec-
tion, we are going to cover some ideas on how to accomplish this.
Your business is unique and therefore your business case will need to be tailored
for your platform or application. Through these examples, you should hopefully see
the pattern and how you should be able to relate almost any aspect of your applica-
tion to metrics and goals that the business cares about. The most straightforward
concept is that downtime equals lost revenue, assuming you are past the early stage
of giving away your product and are actually generating revenue. When the site is not
available, the company does not make money. Simply take the projected revenue for
the quarter or month and calculate what that is per hour or minute. This is the
amount associated with the downtime. There are way more complicated methods of
doing this if you are so inclined, but a simple straight line projection is useful to get
the point across.
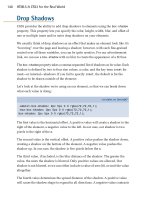
For a more accurate example of downtime cost calculation, you can use the graph
of your site’s normal daily and weekly traffic. Take last week’s traffic graph, assum-
ing last week was a normal week, and put over top of it the traffic graph depicting
the outage. The amount of area between the two lines should be considered the per-
centage of downtime. This method is particularly useful for partial outages, which
you should have if you follow our advice in Chapter 21, Creating Fault Isolative
Architectural Structures.
In Figure 6.1, AllScale’s HRM Outage Graph, the solid gray line is AllScale’s nor-
mal day’s traffic and the dashed black line is the traffic from yesterday when there
ptg5994185
THE BUSINESS CASE FOR SCALE 115
was an outage of the HRM SaaS system. Johnny, the CTO, has requested that his
operations team pull this graph together in order that they understand the exact cus-
tomer impact of downtime. The outage began at 4:00 PM and lasted until approxi-
mately 9:00 PM when the site was fully recovered. The area between the lines from
4:00 to 9:00 PM would be considered the outage percentage and could be used in the
calculation of downtime and cost associated with it. However, notice the dashed line
from 9:00 PM to 12:00 AM goes much higher than the normal traffic in solid. This is
typical of sites for consumer user bases where there is a pent-up demand for the ser-
vice and a spike usually occurs afterward. Unfortunately, this is a busy time of the
year for AllScale’s HRM system. A lot of its customer base is performing annual eval-
uations and have tight deadlines for getting their evaluations in the system. There
were likely many managers that needed to get personnel files uploaded and had to
stay up late to get their work done. To most accurately account for the cost of the
downtime, this area, highlighted in dark gray, must be added back into the outage
percentage, because it was recovered revenue or recovered service depending on the
actual business model. In this example, the area under the solid gray line is 100% of
the daily traffic; the area between the solid gray line and dashed black line during the
outage, highlighted in light gray, is approximately 27%. The dark gray highlighted
area is approximately 9%. The percentage of missed traffic and potential revenue due
to the outage would be 27% – 9% = 18% of the daily total. Johnny can now take
Figure 6.1 AllScale’s HRM Outage Graph
0
5
10
15
20
25
30
35
40
45
12:00:00 AM
1:00:00 AM
2:00:00 AM
3:00:00 AM
4:00:00 AM
5:00:00 AM
6:00:00 AM
7:00:00 AM
8:00:00 AM
9:00:00 AM
10:00:00 AM
11:00:00 AM
12:00:00 PM
1:00:00 PM
2:00:00 PM
3:00:00 PM
4:00:00 PM
5:00:00 PM
6:00:00 PM
7:00:00 PM
8:00:00 PM
9:00:00 PM
10:00:00 PM
11:00:00 PM
12:00:00 AM
ptg5994185
116 CHAPTER 6MAKING THE BUSINESS CASE
this percentage and use it to calculate the cost or impact of the outage, although this
does not take into account the frustration that AllScale’s customers had to put up
with having the system unavailable during peak work hours.
Amazon Outage
As an extreme example of how downtime translates into revenue dollars, let us take a service
such as Amazon and see what its downtime costs are. Now, we do not mean to single Amazon
out in any negative way because it typically has great uptime and almost any other large Inter-
net service has seen equal or more downtime. But Amazon does make a great case study
because it is so large and is a public company (NASD: AMZN).
According to the New York Times technology blog “Bits,” on June 6, 2008, Amazon experi-
enced over an hour outage of its site. Using the expected revenue from Q2 of $4 billion, this
calculates as a straight line projection to $1.8 million in lost sales per hour. One can make the
argument that customers who could not purchase during that hour will come back, but it is also
likely that they made their purchases elsewhere. Even if the company only ultimately lost 50%
or 25% of that revenue, it is still a significant amount. This lost revenue calculation is what you
should be doing for your outages, not only to drive home to your technology team the impor-
tance of keeping the system available but also as a fact to help explain to your business coun-
terparts the cost of not investing in the proper people and projects to keep the site available
and scaling properly.
Another approach to capturing platform issues in terms of business metrics is to
relate it to customer acquisition cost. If your business spends marketing dollars to
attract users to visit the site or sign up, most likely there is a cost associated with each
customer acquired. This way, the marketing team can determine which media offers
the lowest cost per user. When the site is down, the marketing spend does not stop—
usually these campaigns cannot be started and stopped immediately and very rarely
do people think about this until after the fact. Because the marketing continues, users
are still being lured to the site even though they cannot experience the wonders of the
service. When this occurs, it is very unlikely that a customer will ever show back-up
when their first experience was terrible. Downtime can be directly responsible for the
lost customers during the outage. Extending beyond this, if you keep track of return-
ing users, another metric to look at is how many users stop returning after an outage.
If you have 35% of your users returning to the site once per month, watch this metric
post outage. If the numbers drop, you may have just lost those users permanently.
The last idea for describing the outages or potential for outages in business terms
is to translate it to cost within the organization. This can be in terms of operations
ptg5994185
CONCLUSION 117
staff, engineers, or customer support staff, the last being the most immediately
noticeable by the business. When downtime occurs and engineers and operations
staff must attend to it, they are not working on other projects such as customer fea-
tures. A dollar amount can be associated to this by determining the total engineering
budget for salaries and support and associate the number of engineers and time spent
on the outage as a percentage of the total budget. As noted previously, the factor clos-
est to the business would be customer support staff that are either not able to work
due to the support tools being unavailable during the outage or having to handle
extra customer complaints during the outage and for hours afterward. For companies
with large support staffs, this amount of work can add up to significant amounts of
money.
Although determining the actual cost of an outage may be a painful exercise for
the technology staff, it serves several purposes. The first is that it puts in real dollar
values what downtime costs the business. This should be helpful in your arguments
for needing support and staffing for scalability projects. The second purpose is that it
helps educate the technology staff to what it really costs the business to not have the
platform available. This can be a huge motivator to engineers when they understand
how profitability, bonuses, budgets, hiring plans, and so on are all tied together
dependent on the platform.
Conclusion
In this chapter, we wrapped up Part I by pulling together the final link in the scalable
organization chain: how to make the business case for hiring resources, allocating
resources, and staying focused on scalability as a business initiative. We covered the
experiential chasm that exists between most technologists and their business counter-
parts, including most likely the CTO’s boss, and we explored the idea of a business
having a “corporate mindset.” We have given some ideas on how to cross the chasm
and undo the corporate mindset in order that the business be receptive to the need to
focus on scalability, especially from a people and organizational perspective, which
include hiring the right people, putting them in the right roles, demonstrating the nec-
essary leadership and management, as well as building the proper organizational
structure around the teams.
Key Points
• There is an experiential chasm between technologists and other business leaders
due to education and experiences that are missing from most nontechnology
executive’s careers.