Báo cáo y học: "Statistical assessment of the global regulatory role of histone acetylation in Saccharomyces cerevisia" potx
Bạn đang xem bản rút gọn của tài liệu. Xem và tải ngay bản đầy đủ của tài liệu tại đây (1.11 MB, 9 trang )
Genome Biology 2006, 7:R70
comment reviews reports deposited research refereed research interactions information
Open Access
2006Yuanet al.Volume 7, Issue 8, Article R70
Research
Statistical assessment of the global regulatory role of histone
acetylation in Saccharomyces cerevisiae
Guo-Cheng Yuan
¤
*†
, Ping Ma
¤
‡§
, Wenxuan Zhong
*
and Jun S Liu
*
Addresses:
*
Department of Statistics, Harvard University, Cambridge, MA 02138, USA.
†
Bauer Center for Genomics Research, Harvard
University, Cambridge, MA 02138, USA.
‡
Department of Statistics, University of Illinois, Champaign, IL 61820, USA.
§
Institute for Genomic
Biology, University of Illinois, Champaign, IL 61820, USA.
¤ These authors contributed equally to this work.
Correspondence: Jun S Liu. Email:
© 2006 Yuan et al.; licensee BioMed Central Ltd.
This is an open access article distributed under the terms of the Creative Commons Attribution License ( which
permits unrestricted use, distribution, and reproduction in any medium, provided the original work is properly cited.
Histone acetylation in yeast<p>An analysis of genome-wide histone acetylation data using a few complementary statistical models gives support to a cumulative effect model for global histone acetylation.</p>
Abstract
Background: Histone acetylation plays important but incompletely understood roles in gene
regulation. A comprehensive understanding of the regulatory role of histone acetylation is difficult
because many different histone acetylation patterns exist and their effects are confounded by other
factors, such as the transcription factor binding sequence motif information and nucleosome
occupancy.
Results: We analyzed recent genomewide histone acetylation data using a few complementary
statistical models and tested the validity of a cumulative model in approximating the global
regulatory effect of histone acetylation. Confounding effects due to transcription factor binding
sequence information were estimated by using two independent motif-based algorithms followed
by a variable selection method. We found that the sequence information has a significant role in
regulating transcription, and we also found a clear additional histone acetylation effect. Our model
fits well with observed genome-wide data. Strikingly, including more complicated combinatorial
effects does not improve the model's performance. Through a statistical analysis of conditional
independence, we found that H4 acetylation may not have significant direct impact on global gene
expression.
Conclusion: Decoding the combinatorial complexity of histone modification requires not only
new data but also new methods to analyze the data. Our statistical analysis confirms that histone
acetylation has a significant effect on gene transcription rates in addition to that attributable to
upstream sequence motifs. Our analysis also suggests that a cumulative effect model for global
histone acetylation is justified, although a more complex histone code may be important at specific
gene loci. We also found that the regulatory roles among different histone acetylation sites have
important differences.
Published: 2 August 2006
Genome Biology 2006, 7:R70 (doi:10.1186/gb-2006-7-8-r70)
Received: 5 April 2006
Revised: 5 June 2006
Accepted: 2 August 2006
The electronic version of this article is the complete one and can be
found online at />R70.2 Genome Biology 2006, Volume 7, Issue 8, Article R70 Yuan et al. />Genome Biology 2006, 7:R70
Background
Gene activities in eukaryotic cells are concertedly regulated
by transcription factors and chromatin structure. The basic
repeating unit of chromatin is the nucleosome, an octamer
containing two copies each of four core histone proteins.
Recent microarray based studies [1-8] have begun to uncover
the global regulatory role of nucleosome positioning and
modifications. While nucleosome occupancy in promoter
regions typically occludes transcription factor binding,
thereby repressing global gene expression [1-8], the role of
histone modification is more complex [9-11]. Histone tails
can be modified in various ways, including acetylation, meth-
ylation, phosphorylation, and ubiquitination. Even the regu-
latory role of histone acetylation, the best characterized
modification to date, is still not fully understood [12,13].
Each of the four core histones contains several acetylable sites
at their amino terminus tails. Genome-wide histone acetyla-
tion data from Saccharomyces cerevisiae [2,8] have offered
new opportunities for us to evaluate the regulatory effects of
histone acetylation at these lysine sites. In particular, both H3
and H4 acetylation levels were found to be positively corre-
lated with gene transcription rates. However, a subtle but
important issue in analyzing such data is that effects of other
potentially important factors not included in the analysis,
generally termed as confounding factors, cannot be revealed
by simple correlation plots. It is unclear, for example, how
much regulatory information associated with histone acetyla-
tion is redundant with the genomic sequence information. To
gain insights into this, we conducted a statistical analysis by
combining acetylation [2,4,8], nucleosome occupancy [1,3,8],
gene upstream sequence information [14], and gene expres-
sion data [1,15,16] to investigate the effect of histone acetyla-
tion in the context of other regulatory factors in S. cerevisiae.
A related question is whether different histone acetylation
sites play similar roles in gene regulation. It is commonly pos-
tulated that globally H3 and H4 acetylation are both associ-
ated with global gene activation. Indeed, the acetylation levels
of H3 and H4 across gene promoters have been shown to be
highly correlated [2,7,8]. However, other experimental stud-
ies have also suggested that H3 and H4 acetylations have dif-
ferent regulatory roles [17-20]. We investigated the validity of
a cumulative model for the regulatory effect of histone
acetylation and also compare the regulatory effects of H3 and
H4 acetylation in a coherent statistical framework.
Another interesting question is whether combinatorial pat-
terns of histone acetylation code for distinct regulatory infor-
mation at a global level [9,11], with each pattern being
recognized by a specific regulatory protein. If such codes
exist, a large number of codes may result from combinations
of different histone acetylation sites. On the other hand, if the
effect is cumulative, multiple histone acetylation sites may be
used to gradually control the interaction between nucleo-
somes or the stability of the regulatory proteins. Recent muta-
genesis studies [5] have suggested that multiple H4
acetylation sites have a cumulative effect. Here we revisit this
question using a statistical approach to combine available
genome-wide data. Our analysis suggests that the simple
additive-effect model is sufficient for fitting the available
data.
Results
Effect of histone acetylation on gene transcription rate
Standard analysis
We analyzed two recent genome-wide histone acetylation
datasets [2,8] (see Materials and methods for details about
the data sources). Due to space limits, here we only present
the results for Pokholok et al.'s data [8], with the discussion
of Kurdistani et al.'s data [2] in Additional data file 1.
Pokholok et al. measured acetylation levels at three different
sites, H3K9, H3K14, and H4, with the last referring to non-
specific acetylation on any of the four acetylable lysines on H4
tails.
A typical analysis, when both histone acetylation data on a
single site (for example, H3K9) and transcription rate data
are available, is to simply correlate the two sets of measure-
ments and to report the apparent significant statistical corre-
lation between the two. When data on multiple acetylation
sites are available, a slightly more formal analysis is to fit a
linear regression model of the form:
where y
i
is the transcription rate of gene i, and x
ij
, for j = 1,2,3,
is the histone acetylation level of H3K9, H3K14, and H4,
respectively. All data were log-transformed before analysis.
This model is highly statistically significant for both inter-
genic (p value < 2.0 × 10
-16
) and coding regions (p value < 2.0
× 10
-16
). The association between gene expression and inter-
genic histone acetylation is commonly interpreted as regula-
tory effects, whereas correlation between gene expression
and coding histone acetylation is believed to be a result of
passing of transcriptional machineries through active genes.
Significant confounding factors
Gene regulation is a complex process involving many contrib-
uting factors. Probably the best characterized factor for con-
trolling gene transcription is the upstream sequence
information. Although histone acetyltransferases (HATs) and
histone deacetylases (HDACs) do not have obvious sequence
specificity themselves, they may be recruited by transcription
factors that recognize specific sequences. Thus, sequence
information is an important confounding factor. Our main
interest here is to delineate the roles of these factors and
investigate whether histone acetylation provides any addi-
tional information on gene transcription. In the past decade,
numerous computational methods have been developed to
yx
ij
j
ij i
=+ +
()
∑
αβ ε
,
equation 1
Genome Biology 2006, Volume 7, Issue 8, Article R70 Yuan et al. R70.3
comment reviews reports refereed researchdeposited research interactions information
Genome Biology 2006, 7:R70
identify target sequences of transcription factors and to use
such information to predict gene expression [21-26].
Another well-characterized property of the chromatin struc-
ture, the nucleosome occupancy, also plays an important role
in gene regulation. Histone acetylation and nucleosome posi-
tioning are closely related events. Genome-scale, high-resolu-
tion nucleosome positioning data have led to the observation
that transcription factor binding sites tend to be nucleosome-
depleted [6]. Although genome-wide, high-resolution nucleo-
some positioning data are still unavailable, lower resolution
data have already shown that gene expression levels are recip-
rocally correlated with nucleosome occupancy [1,3,8]. There-
fore, nucleosome occupancy may also be an important
confounding factor in explaining gene regulation.
Refined analysis
We tested using two different sequence motif based-methods
to account for the cis regulatory information (see Materials
and methods for details). As shown in Additional data file 1,
the two methods gave remarkably consistent results. Here we
present results from using MDscan [24], which infers
sequence motif information de novo. The combined tran-
scriptional control by transcription factor binding motifs
(TFBMs), nucleosome occupancy, and histone acetylation is
modeled as:
where the x
ij
values are the three histone acetylation levels
(corresponding to H3K9, H3K14, and H4, respectively), the z
ij
values are the corresponding scores to the 33 selected motifs,
and w
i
is the nucleosome occupancy level. Table 1 shows the
R
2
(referring to the adjusted R-square statistic, which meas-
ures the fraction of explained variance after an adjustment of
the number of parameters fitted; see page 231 of [27]) of the
various linear models. One can see that a simple regression of
transcription rates against histone acetylation without con-
sidering any other factors gave an R
2
of 0.1841 (Table 1),
implying that about 18% of the variation of the transcription
rates is attributable to histone acetylation. In contrast, the
regression of transcription rates against motif scores and
nucleosome density levels (no histone acetylation) gave an R
2
of 0.1997. The comprehensive model with all the variables we
considered (equation 2) bumped up the R
2
to 0.3262, indicat-
ing that the histone acetylation does have a significant effect
on the transcription rate, although not as high as that in the
naïve model.
To confirm that the above results indicate intrinsic statistical
associations rather than artifacts of the statistical procedure,
we validated our model using two independent methods.
First, we tested whether applying the above procedure to the
random inputs would yield substantially worse performance
than applying it to the real data. We generated 50 independ-
ent samples by random permutation (see Materials and
methods). The R
2
for these randomized data are much
smaller than for the real data. For example, considering equa-
tion 2 fitted with sequence motif information only, the largest
R
2
for coding regions for the 50 randomly permutated sam-
ples is 0.0378 (Figure 1), compared to R
2
of 0.1315 for the real
data. The differences between the R
2
values are even larger if
we also include histone acetylation and nucleosome occu-
pancy in the model. Therefore, our model is able to extract
real statistical association. Secondly, we tested whether the
model might overfit by a five-fold cross validation procedure
(see Materials and methods). The root mean square (rms)
errors for the training data are 1.500 (for intergenic regions)
and 1.483 (for coding regions), whereas the rms errors for the
testing data were 1.519 (for intergenic regions) and 1.498 (for
coding regions). In both cases, the difference between the in-
sample and out-of-sample errors is less than 2%, suggesting
overfitting is not an issue here.
Multiple histone acetylation sites have cumulative
regulatory effects
With the foregoing regression framework, we further investi-
gated whether the combined effect of various histone acetyla-
tion sites could be approximated by a simple cumulative
model, or a more complex 'combinatorial histone code' is
needed. To gain a qualitative overview, we grouped genes
according to their upstream histone acetylation patterns,
each corresponding to a combination of high (greater than
60th percentile) or low (less than 40th percentile) histone
acetylation levels at three acetylation sites. To avoid ambigu-
ity due to measurement noise, the middle 20% of genes was
yxzw
ij
j
ij j
j
ij i i
=+ + + +
()
∑∑
αβ η δε
,
equation 2
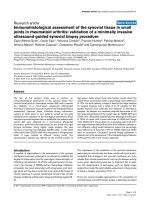
Model validation by comparing the R
2
for the real versus randomly permutated datasetsFigure 1
Model validation by comparing the R
2
for the real versus randomly
permutated datasets. The R
2
obtained by applying the motif selection and
fitting equation 2 (with sequence motif information only) procedures to
randomly permutated and real data. The histogram is obtained based on
50 randomly permutated samples. The arrow on the right marks the R
2
for
the real data. Results for the coding regions are represented here. See the
main text for details.
0 0.05 0.1 0.15 0.2 0.25
0
5
10
15
R
2
Number of cases
R70.4 Genome Biology 2006, Volume 7, Issue 8, Article R70 Yuan et al. />Genome Biology 2006, 7:R70
not included in any groups. This coarse-grained partition
method results in eight groups of genes with distinct
upstream acetylation patterns. For example, one of these
eight groups contains genes with high H3K9, high H3K14,
and low H4 acetylation levels in their upstream intergenic
regions. Increasing H3K9 acetylation level enhances gene
transcription (Table 2), regardless of the acetylation level at
other sites. A similar but weaker pattern can be seen for
H3K14 acetylation. In contrast, the increase of H4 acetylation
level is associated with both elevated and reduced transcrip-
tion rates. A possible explanation is that the regulatory effect
of H4 acetylation is dependent on acetylation level at other
sites, while another explanation is that the H4 acetylation
effect is weak overall. These relationships are not sensitive to
the cutoff threshold for removing ambiguous genes.
As a quantitative validation of the above observation, we re-
examined the validity of equation 2 in modeling the regula-
tory role of histone acetylation. We observed that the inclu-
sion of all quadratic interaction terms among the three
histone acetylation covariates in the regression model does
not improve the model fitting (that is, R
2
= 0.3262 and
0.3278, respectively, for intergenic regions, and R
2
= 0.3131
and 0.3132, respectively, for coding regions). The same con-
clusion also holds when we do not include the sequence motif
information and nucleosome occupancy data as covariates
(R2 = 0.1841 and 0.1925, respectively, for intergenic regions).
These observations suggest that the combinatorial effect is, at
best, undetectable from the current data and the simple
cumulative model (equation 2) is sufficient. Similar results
were obtained using the acetylation data in Kurdistani et al.
[2] (Additional data file 1).
H3 and H4 acetylation play different roles in gene
regulation
A statistical measure of the effect of an individual factor/cov-
ariate on the response variable is the partial correlation
(Materials and methods), which roughly reflects the 'pure'
relationship between two variables while controlling other
factors. As shown in Table 3, partial correlations between
transcription rates and intergenic H3K9 and H3K14 acetyla-
tion levels, while controlling the sequence information and
H4 acetylation levels, are 0.25 and 0.21, respectively; whereas
that between transcription rates and H4 acetylation effect is
insignificant (-0.03). In addition, the difference between the
effects of H3 and H4 acetylations is visually evident (Figure
2). The same phenomenon can be observed by comparing dif-
ferent regression models. As shown by Table 1, the R
2
Table 1
Model performance (adjusted R
2
) with different covariates
Intergenic regions Coding regions
Acetylation
sites included
- Seq Nuc Seq/Nuc - Seq Nuc Seq/Nuc
- 0 0.1387 0.1145 0.1997 0 0.1315 0.1440 0.2185
H3K9 and
H3K14
0.1808 0.2700 0.2641 0.3208 0.1014 0.2059 0.2515 0.3068
H4 0.0849 0.2086 0.2487 0.3085 0.0222 0.1522 0.2131 0.2774
H3K9, H3K14,
and H4
0.1841 0.2706 0.2704 0.3262 0.1957 0.2627 0.2619 0.3131
The adjusted R
2
for the linear regression model (equation 2) containing different regulatory factors (Nuc, nucleosome occupancy; Seq, sequence
information). (The adjusted R
2
is related to the (unadjusted) R
2
as , where n is the sample
size, and p is the number of explanatory variables in the linear regression model.)
Table 2
Mean transcription rates (log-transformed) for genes with similar histone acetylation patterns
H3K9ac Low H3K9ac High
H3K14ac Low
H4ac Low -0.850 0.207
H4ac High -0.522 0.307
H3K14ac High
H4ac Low -0.454 0.816
H4ac High -0.126 0.460
Ac, acetylation.
RnnpR
adjusted unadjusted
22
11 11=− − − − −[( )/( )]( )
Genome Biology 2006, Volume 7, Issue 8, Article R70 Yuan et al. R70.5
comment reviews reports refereed researchdeposited research interactions information
Genome Biology 2006, 7:R70
Table 3
Partial correlation between covariate and transcription rates
Intergenic regions Coding regions
Covariate Control
variable
Partial
correlation
Control variables Partial
correlation
Control variable Partial
correlation
Control variables Partial
correlation
H3K9 H4 0.3015 H4 and Seq 0.2507 H4 0.2439 H4 and Seq 0.2038
H3K14 H4 0.2359 H4 and Seq 0.2105 H4 0.4070 H4 and Seq 0.3473
H4 H3K9, H3K14 -0.0656 H3K9, H3K14 and Seq -0.0344 H3K9, H3K14 -0.3245 H3K9, H3K14 and Seq -0.2678
The partial correlation between transcription rates and H3 (or H4) acetylation levels while controlling for the effects of H4 (or H3) acetylation and
sequence information (Seq).
Dependency of transcription rates on histone acetylation levels (ac) after controlling for confounding effectsFigure 2
Dependency of transcription rates on histone acetylation levels (ac) after controlling for confounding effects. (a) Transcription rates versus intergenic
H3K9 and K14 acetylation levels controlling for H4 acetylation levels. (b) Transcription rates versus intergenic H4 acetylation levels controlling for H3K9
and K14 acetylation levels. (c) Same as (a) except that coding region histone acetylation data are used. (d) Same as (b) except that coding region histone
acetylation data are used. All data are log-transformed. Genes are sorted by transcription levels. A sliding smoothing window of 20 genes is applied to the
transcription rates and histone acetylation data.
-4 0 4 8
-0.4
-0.2
0.2
0.4
0.6
0.8
H3K9
H3K14
-4 0 4 8
-0.4
-0.2
0
0.2
-4 0 4 8
-0.4
-0.2
0.2
0.4
0.6
0.8
H3K9
H3K14
-4 048
-0.4
-0.2
0
0.2
Transcription rates controlling for H4 ac
Transcription rates controlling for H4 ac Transcription rates controlling for H3 ac
Transcription rates controlling for H3 ac
H3 ac controlling for H4 ac H3 ac controlling for H4 ac
H4 ac controlling for H3 ac H4 ac controlling for H3 ac
(a) (b)
(d)(c)
-4
0
4
8
-0.4
-4
-0.4
-4
-0.2
0.2
0.4
0.6
0.8
-4
0
4
8
-0.4
-4
-0.4
-4
-0.2
0
0.2
-4
0
4
8
-0.4
.4
-4
-0.4
-4
-0.2
0.2
0.4
0.6
0.8
H3K9
4
H3K14
14
-4
0
4
8
-0.4
-4
-0.4
-4
-0.2
0
0.2
H3K9
H3K14
14
Transcription rates controlling for H4 ac
Transcription rates controlling for H4 ac
Transcription rates controlling for H3 ac
Transcription rates controlling for H3 ac
H3 ac controlling for H4 ac
H3 ac controlling for H4 ac
H4 ac controlling for H3 ac
H4 ac controlling for H3 ac
(a)
(b)
(d)
(c)
R70.6 Genome Biology 2006, Volume 7, Issue 8, Article R70 Yuan et al. />Genome Biology 2006, 7:R70
(adjusted R-square) for the model without using the H4
acetylation information is comparable to the full model,
whereas the performance of the model without H3 acetylation
is significantly poorer. Interestingly, the transcription rate is
negatively correlated with coding region H4 acetylation.
These observations suggest that while H3 acetylation plays an
important role in global gene activation, H4 acetylation in the
intergenic region has little global effect. Similar results were
also obtained for the acetylation data in Kurdistani et al.
(Additional data file 1).
Gcn5 is the catalytic component of the SAGA complex and
preferentially acetylates H3 lysines, including K9, K14, and
K18. Esa1 is the catalytic component of the NuA4 complex
and preferentially acetylates H4 lysines. Based on the above
analysis, we predicted that the global gene expression was sig-
nificantly affected by the abundance of Gcn5 but not of Esa1.
Genome-wide occupancy of Gcn5 and Esa1 has been meas-
ured previously [4]. Both enzymes were found to be globally
associated with active genes, and the Pearson correlation
between the occupancy levels of the two is as high as 0.7890,
probably because they share a common component, Tra1, for
recognizing targets [28]. We modified equation 2 to estimate
the association between Pol II occupancy [4] and these two
HATs. In this case, the response variable y
i
is the log-ratio of
Pol II binding, whereas the x
ij
(j = 1,2) are the log-transformed
binding ratios of Gcn5 and Esa1, respectively. Fitting the
model using both Gcn5 and Esa1 data yields an R
2
of 0.2365.
If we remove Gcn5 from the model, the R
2
is reduced to
0.1808. However, removing Esa1 causes little change in
model performance (R
2
= 0.2366). In addition, the partial
correlation between the occupancy levels of Pol II and Gcn5
while controlling Esa1 occupancy is 0.2690, whereas the
number is reduced to only 0.0154 if the order of Gcn5 and
Esa1 is reversed. Taken together, these results show that,
indeed, Esa1 only marginally affects the global association
with Pol II binding.
Discussion
The global regulatory role of histone acetylation is still not
fully understood and contradictory results have been
reported in the literature [2,5,8]. Part of this inconsistency
has been attributed to data analysis procedures [29]. In this
paper, we analyzed two recent CHIP-chip datasets [2,8] in a
statistically coherent framework. Our model isolates the reg-
ulatory role of individual acetylation sites and systematically
controls for the effects of important confounding factors, thus
resulting in a more detailed evaluation of the regulatory role
of histone acetylation than previous studies [2,8]. Interest-
ingly, our analyses of the two aforementioned datasets
yielded similar results, even though the biological interpreta-
tions in the original papers were drastically different.
We found that the regulatory effect of histone acetylation can
be well approximated by a simple regression model. In con-
trast to Kurdistani et al.'s claims [2], our results suggest that
the currently available data supports a simple cumulative
effect model instead of a combinatorial code model of histone
modifications as originally proposed in [9], consistent with a
recent mutagenesis study [5] showing that three of the four
acetylable sites on H4 tails are functionally redundant. It is
worth noting that these results do not exclude the possibility
that combinatorial control is critical at specific gene loci, but
it is unlikely that a fully combinatorial code regulates global
gene expression.
We also quantitatively analyzed the regulatory effects due to
individual acetylation sites. To our surprise, we found that the
overall effects of H3 and H4 acetylation were quite different,
at least statistically. In particular, while elevated H3 acetyla-
tion in promoter regions appears to be responsible for activat-
ing global gene expression, H4 acetylation seems to play a less
important role. Levels of H3 and H4 acetylation in intergenic
regions are closely coordinated by the binding of Gcn5 and
Esa1, both of which have been found to bind to actively tran-
scribed genes [4]. However, our analysis suggests that Esa1
may not be important for global regulation, consistent with
previous experimental studies by Kevin Struhl's group
[17,30,31]. In these studies, the authors show that depletion
of Esa1 causes a global decrease of H4 acetylation, but only a
small subset of the genes responds with significant
transcription change [30]. They also found that the effect of
H4 acetylation may be highly transcription factor specific
[17]. It will be interesting to further investigate whether there
is any biological benefit for the co-recruitment of Esa1 and
Gcn5 to activate genes.
Histone modification in coding regions is often viewed as
demarcating recent transcriptional events rather than playing
a regulatory role. In this view, our analysis suggests that,
along with methylation, acetylation also serves as a potent
marker for transcription activities. On the other hand, H4
acetylation in coding regions may also have important regula-
tory roles. For example, the binding of the HDAC protein
Hos2 to coding regions is important for active transcription
[18,20]. The negative partial correlation between transcrip-
tional activities and H4 acetylation levels is consistent with
the aforementioned experimental results.
Materials and methods
Data sources
Datasets analyzed in this study include those for histone
acetylation, nucleosome occupancy, gene expression, and
genome sequence. In two recently published papers, genome-
wide histone acetylation levels at eleven [2] and three sites [8]
in yeast were measured using CHIP-chip. A major difference
in experimental procedure between these two studies is that
the acetylated DNA was hybridized against nucleosomal DNA
on microarrays in Pokholok et al.'s study [8], but was hybrid-
ized against the genomic DNA in Kurdistani et al.'s study [2].
Genome Biology 2006, Volume 7, Issue 8, Article R70 Yuan et al. R70.7
comment reviews reports refereed researchdeposited research interactions information
Genome Biology 2006, 7:R70
Since in the latter dataset histone acetylation was confounded
with nucleosome occupancy, our discussion in the main text
is focused on analyzing Pokholok et al.'s data. To compare the
results from the two experiments, we repeated our analysis
procedure on a normalized version of Kurdistani et al.'s data
after removing its dependency on nucleosome occupancy. We
found that the main conclusions remain the same. Detailed
analysis of Kurdistani et al.'s data is presented in Additional
data file 1.
In addition, several groups have measured genome-wide
nucleosome occupancy in yeast [1,3,8]. We chose to utilize
Pokholok et al.'s nucleosome occupancy data in our analysis
as well, since nucleosome occupancy has a clear effect on gene
regulation [6]. We used Bernstein et al.'s transcription rate
data [1] as the response variable in our study of the relation-
ship between gene transcription and histone acetylation.
These transcription rates were estimated by dividing the tran-
scription levels by half-life time [16]. Due to concern that
measured microarray data may vary significantly among dif-
ferent microarray platforms or research groups [32-34], we
repeated our analysis using an independent dataset [15]. The
results obtained from the two gene transcription data are
similar (Additional data file 1).
After removing genes (with their corresponding intergenic
and coding regions) that have missing data in any of the above
datasets, we merged all the data into a single dataset, which
contains 3,049 intergenic and 3,384 coding regions. The
genomic sequence of S. cerevisiae was downloaded from the
Saccharomyces Genome Database [14]. The promoter
sequences (up to 800 base pairs (bp) upstream of the transla-
tion start site of each gene) were extracted for cis regulatory
signal analysis.
Delineating cis regulatory information
Transcription factors regulate genes by binding to transcrip-
tion factor binding sites (TFBSs), which are short sequence
segments (approximately 10 bp) located near genes' tran-
scription start sites (TSSs). In yeast, these binding sites are
mostly within 500 bp upstream of each gene's TSS. It has
been shown that a gene's expression pattern can be predicted
to a great extent by its upstream sequence information [26].
We took two different approaches to accommodate sequence
information in our analysis of the histone acetylation effect.
In our first approach, we conducted de novo TFBS predic-
tions using MDscan [24] among the upstream sequences of
the genes that were transcribed at high rates [1]. In particular,
this algorithm searched for enriched sequence motifs of
widths 5 to 15 in the promoter sequences, resulting in 580 sta-
tistically significant, possibly overlapping, candidate TFBMs
(p value < 0.05). We then used these motif patterns to scan all
promoter regions for matches so as to compute a motif score
for each TFBM at each promoter [24]. To avoid overfitting, we
selected a subset of 33 functional motifs based on the associ-
ation of the motif score of a promoter with the transcription
rate of the corresponding gene. In particular, we used both a
linear regression procedure, Motif Regressor [25], and a
model-free method, regularized sliced inverse regression
(RSIR) [35], as explained below.
Our second approach to account for the cis regulatory infor-
mation was to directly use the 666 transcription factor bind-
ing motifs reported by Beer and Tavazoie [26], which is a
combination of computational predictions using AlignACE
[22] and 51 experimentally derived ones [36,37]. Since these
motifs have been shown to have a high predictive power for
gene expression patterns, they may also be informative for
predicting transcription rate. Out of these 666 motifs, our lin-
ear regression and RSIR procedures (see below) found 15 that
are highly relevant to predicting gene transcription rates.
Model free motif selection
RSIR [35] is a statistical method for dimension reduction and
variable selection. It assumes that gene i's transcription rate
y
i
and its sequence motif scores x
i
= (x
i1
, ,x
iM
)
T
are related as:
where f() is an unknown (and possibly nonlinear) function, β
l
= (
β
l1
, ,
β
lM
)
T
, (l = 1, ,k), are vectors of linear coefficients,
and
ε
i
represents the noise. The number k is called the dimen-
sion of the model. A linear regression model is a special one-
dimensional case of equation 3. RSIR estimates both k and
the β
l
values without estimating f(). Since many entries of the
β
lj
values are close to zero, which implies that the correspond-
ing motif scores contribute very little in equation 2, we retain
only those motifs whose coefficient
β
lj
is significantly nonzero.
We applied RSIR to the 580 candidate motifs selected by
MDscan and the 666 motifs from [26], with the transcription
rate as the response variable. In both cases, k was estimated
as 1, and f() showed a strong linear pattern. We found 104 and
69 motifs, respectively, that have significantly nonzero coeffi-
cients in our RSIR model.
Previous application suggests that RSIR is conservative in
selecting variables [35]. We applied the stepwise regression
algorithm (which is a recursive method commonly used for
variable selection; see page 347 of [27]) to further reduce the
number of motifs. In the end, a total of 33 motifs from
MDscan and 15 motifs from [26] were retained for further
use. These motifs represent our summary of sequence-spe-
cific information on gene transcription rates.
Model validation
To assess the significance of our model for controlling the
confounding effects due to sequence information, we ran-
domly permuted the transcription rates data 50 times and
repeated the same statistical procedures: identifying motif
candidates using MDscan, selecting the most significant
yf
i
T
i
T
ik
T
ii
=
()
( , , , ),ββββββ
12
3
xx x
ε
equation
R70.8 Genome Biology 2006, Volume 7, Issue 8, Article R70 Yuan et al. />Genome Biology 2006, 7:R70
motifs using RSIR, and fitting the linear regression model.
The distribution of R
2
obtained for these randomized data
was used as a baseline to evaluate the significance of our sta-
tistical procedure.
We also performed a five-fold cross validation procedure to
test whether equation 2 overfit data. In particular, the full set
of genes (seethe Data sources section above) was randomly
partitioned into five subsets of equal sizes. Each subset was
used for testing in turn with the rest used for training. For
each training subset, the sequence motifs were inferred using
MDscan, RSIR, and stepwise regression methods. We fit the
model equation 2 using the training data and then evaluated
out-of-sample error by applying to the testing data. The in-
sample and out-of-sample root mean square errors were then
compared.
Partial correlation
Let X and Y represent two random variables and Z =
(Z
1
,Z
2
, ,Z
p
) be a set of control random variables. The linear
relationship between X and Z can be estimated via a linear
regression model X =
α
X
+ Z
β
X
+
ε
X
, similarly for that between
Y and Z. The residues
ε
X
and
ε
Y
contain the information left
unexplained by Z. The partial correlation between X and Y
while controlling Z is defined as the Pearson correlation
between
ε
X
and
ε
Y
.
Additional data files
The following additional data are available with the online
version of this paper: Additional data file 1 contains support-
ing text, figures, and tables. The adequacy of the linear regres-
sion, normalization of the Kurdistani et al. data, and
sensitivity issues are discussed in further detail in the text.
The figures and tables included demonstrate and compare the
Pokholok et al. and Kurdistani et al. data.
Additional File 1Supporting text, figures, and tablesSupporting text, figures, and tables relating to the Kurdistani et al., Pokholok et al. and Kurdistani et al. data.Click here for file
Acknowledgements
We thank Oliver Rando for helpful discussions. GY was partially supported
by the Bauer Center for Genomics Research. PM was partially supported
by a research board grant from University of Illinois. JSL acknowledges sup-
port from NSF DMS-0204674 and a grant (10228102) from NSF China.
References
1. Bernstein BE, Liu CL, Humphrey EL, Perlstein EO, Schreiber SL: Glo-
bal nucleosome occupancy in yeast. Genome Biol 2004, 5:R62.
2. Kurdistani SK, Tavazoie S, Grunstein M: Mapping global histone
acetylation patterns to gene expression. Cell 2004,
117:721-733.
3. Lee CK, Shibata Y, Rao B, Strahl BD, Lieb JD: Evidence for nucleo-
some depletion at active regulatory regions genome-wide.
Nat Genet 2004, 36:900-905.
4. Robert F, Pokholok DK, Hannett NM, Rinaldi NJ, Chandy M, Rolfe A,
Workman JL, Gifford DK, Young RA: Global position and recruit-
ment of HATs and HDACs in the yeast genome. Mol Cell 2004,
16:199-209.
5. Dion MF, Altschuler SJ, Wu LF, Rando OJ: Genomic characteriza-
tion reveals a simple histone H4 acetylation code. Proc Natl
Acad Sci USA 2005, 102:5501-5506.
6. Yuan GC, Liu YJ, Dion MF, Slack MD, Wu LF, Altschuler SJ, Rando OJ:
Genome-scale identification of nucleosome positions in S.
cerevisiae. Science 2005, 309:626-630.
7. Liu CL, Kaplan T, Kim M, Buratowski S, Schreiber SL, Friedman N,
Rando OJ: Single-nucleosome mapping of histone modifica-
tions in S. cerevisiae. PLoS Biol 2005, 3:e328.
8. Pokholok DK, Harbison CT, Levine S, Cole M, Hannett NM, Lee TI,
Bell GW, Walker K, Rolfe PA, Herbolsheimer E, et al.: Genome-
wide map of nucleosome acetylation and methylation in
yeast. Cell 2005, 122:517-527.
9. Strahl BD, Allis CD: The language of covalent histone
modifications. Nature 2000, 403:41-45.
10. Turner BM: Cellular memory and the histone code. Cell 2002,
111:285-291.
11. Schreiber SL, Bernstein BE: Signaling network model of
chromatin. Cell 2002, 111:771-778.
12. Roth SY, Denu JM, Allis CD: Histone acetyltransferases. Annu Rev
Biochem 2001, 70:81-120.
13. Kurdistani SK, Grunstein M: Histone acetylation and deacetyla-
tion in yeast. Nat Rev Mol Cell Biol 2003, 4:276-284.
14. Saccharomyces Genome Database [stge
nome.org/]
15. Holstege FC, Jennings EG, Wyrick JJ, Lee TI, Hengartner CJ, Green
MR, Golub TR, Lander ES, Young RA: Dissecting the regulatory
circuitry of a eukaryotic genome. Cell 1998, 95:717-728.
16. Wang Y, Liu CL, Storey JD, Tibshirani RJ, Herschlag D, Brown PO:
Precision and functional specificity in mRNA decay. Proc Natl
Acad Sci USA 2002, 99:5860-5865.
17. Deckert J, Struhl K: Histone acetylation at promoters is differ-
entially affected by specific activators and repressors. Mol Cell
Biol 2001, 21:2726-2735.
18. Wang A, Kurdistani SK, Grunstein M: Requirement of Hos2 his-
tone deacetylase for gene activity in yeast. Science 2002,
298:1412-1414.
19. Kurdistani SK, Robyr D, Tavazoie S, Grunstein M: Genome-wide
binding map of the histone deacetylase Rpd3 in yeast. Nat
Genet 2002, 31:248-254.
20. Wiren M, Silverstein RA, Sinha I, Walfridsson J, Lee HM, Laurenson P,
Pillus L, Robyr D, Grunstein M, Ekwall K: Genomewide analysis of
nucleosome density histone acetylation and HDAC function
in fission yeast. EMBO J 2005, 24:2906-2918.
21. Liu JS, Neuwald AF, Lawrence CE: Bayesian models for multiple
local sequence alignment and gibbs sampling strategies. J Am
Stat Assoc 1995, 90:1156-1170.
22. Roth FP, Hughes JD, Estep PW, Church GM: Finding DNA regula-
tory motifs within unaligned noncoding sequences clustered
by whole-genome mRNA quantitation. Nat Biotechnol 1998,
16:939-945.
23. Bussemaker HJ, Li H, Siggia ED: Regulatory element detection
using correlation with expression. Nat Genet 2001, 27:167-171.
24. Liu XS, Brutlag DL, Liu JS: An algorithm for finding protein-DNA
binding sites with applications to chromatin-immunoprecip-
itation microarray experiments. Nat Biotechnol 2002,
20:835-839.
25. Conlon EM, Liu XS, Lieb JD, Liu JS: Integrating regulatory motif
discovery and genome-wide expression analysis. Proc Natl
Acad Sci USA 2003, 100:3339-3344.
26. Beer MA, Tavazoie S: Predicting gene expression from
sequence. Cell 2004, 117:185-198.
27. Neter J, Kutner MH, Wasserman W, Nachtsheim CJ: Applied Linear
Statistical Models 4th edition. Singapore; Boston: McGraw-Hill; 1996.
28. Brown CE, Howe L, Sousa K, Alley SC, Carrozza MJ, Tan S, Workman
JL: Recruitment of HAT complexes by direct activator inter-
actions with the ATM-related Tra1 subunit. Science 2001,
292:2333-2337.
29. Schubeler D, Turner BM: A new map for navigating the yeast
epigenome. Cell 2005, 122:489-492.
30. Reid JL, Iyer VR, Brown PO, Struhl K: Coordinate regulation of
yeast ribosomal protein genes is associated with targeted
recruitment of Esa1 histone acetylase. Mol Cell 2000,
6:1297-1307.
31. Reid JL, Moqtaderi Z, Struhl K: Eaf3 regulates the global pattern
of histone acetylation in Saccharomyces cerevisiae. Mol Cell Biol
2004, 24:757-764.
32. Bammler T, Beyer RP, Bhattacharya S, Boorman GA, Boyles A, Brad-
ford BU, Bumgarner RE, Bushel PR, Chaturvedi K, Choi D, et al.:
Standardizing global gene expression analysis between labo-
ratories and across platforms. Nat Methods 2005, 2:351-356.
33. Irizarry RA, Warren D, Spencer F, Kim IF, Biswal S, Frank BC, Gabri-
Genome Biology 2006, Volume 7, Issue 8, Article R70 Yuan et al. R70.9
comment reviews reports refereed researchdeposited research interactions information
Genome Biology 2006, 7:R70
elson E, Garcia JG, Geoghegan J, Germino G, et al.: Multiple-labora-
tory comparison of microarray platforms. Nat Methods 2005,
2:345-350.
34. Larkin JE, Frank BC, Gavras H, Sultana R, Quackenbush J: Independ-
ence and reproducibility across microarray platforms. Nat
Methods 2005, 2:337-344.
35. Zhong W, Zeng P, Ma P, Liu JS, Zhu Y: RSIR: regularized sliced
inverse regression for motif discovery. Bioinformatics 2005,
21:4169-4175.
36. Hughes JD, Estep PW, Tavazoie S, Church GM: Computational
identification of cis-regulatory elements associated with
groups of functionally related genes in Saccharomyces
cerevisiae. J Mol Biol 2000, 296:1205-1214.
37. Lee TI, Rinaldi NJ, Robert F, Odom DT, Bar-Joseph Z, Gerber GK,
Hannett NM, Harbison CT, Thompson CM, Simon I, et al.: Tran-
scriptional regulatory networks in Saccharomyces cerevisiae.
Science 2002, 298:799-804.