Báo cáo y học: "Identification of 491 proteins in the tear fluid proteome reveals a large number of proteases and protease inhibitors" pot
Bạn đang xem bản rút gọn của tài liệu. Xem và tải ngay bản đầy đủ của tài liệu tại đây (559.85 KB, 11 trang )
Genome Biology 2006, 7:R72
comment reviews reports deposited research refereed research interactions information
Open Access
2006de Souzaet al.Volume 7, Issue 8, Article R72
Research
Identification of 491 proteins in the tear fluid proteome reveals a
large number of proteases and protease inhibitors
Gustavo A de Souza
*†
, Lyris MF de Godoy
*†
and Matthias Mann
*†
Addresses:
*
Center for Experimental BioInformatics (CEBI), Department of Biochemistry and Molecular Biology, University of Southern
Denmark, Campusvej, DK-5230 Odense M, Denmark.
†
Department of Proteomics and Signal Transduction, Max Planck Institute of
Biochemistry, Am Klopferspitz, D-82152 Martinsried, Germany.
Correspondence: Matthias Mann. Email:
© 2006 de Souza et al.; licensee BioMed Central Ltd.
This is an open access article distributed under the terms of the Creative Commons Attribution License ( which
permits unrestricted use, distribution, and reproduction in any medium, provided the original work is properly cited.
The tear fluid proteome<p>A proteomic analysis of the tear fluid suggests that an interplay between proteases and protease inhibitors, and between oxidative reac-tions, is an important feature of the ocular environment.</p>
Abstract
Background: The tear film is a thin layer of fluid that covers the ocular surface and is involved in
lubrication and protection of the eye. Little is known about the protein composition of tear fluid
but its deregulation is associated with disease states, such as diabetic dry eyes. This makes this body
fluid an interesting candidate for in-depth proteomic analysis.
Results: In this study, we employ state-of-the-art mass spectrometric identification, using both a
hybrid linear ion trap-Fourier transform (LTQ-FT) and a linear ion trap-Orbitrap (LTQ-Orbitrap)
mass spectrometer, and high confidence identification by two consecutive stages of peptide
fragmentation (MS/MS/MS or MS
3
), to characterize the protein content of the tear fluid. Low
microliter amounts of tear fluid samples were either pre-fractionated with one-dimensional SDS-
PAGE and digested in situ with trypsin, or digested in solution. Five times more proteins were
detected after gel electrophoresis compared to in solution digestion (320 versus 63 proteins).
Ontology classification revealed that 64 of the identified proteins are proteases or protease
inhibitors. Of these, only 24 have previously been described as components of the tear fluid. We
also identified 18 anti-oxidant enzymes, which protect the eye from harmful consequences of its
exposure to oxygen. Only two proteins with this activity have been previously described in the
literature.
Conclusion: Interplay between proteases and protease inhibitors, and between oxidative
reactions, is an important feature of the ocular environment. Identification of a large set of proteins
participating in these reactions may allow discovery of molecular markers of disease conditions of
the eye.
Background
The eye is covered by a thin, fluid film that serves several
functions. It has critical roles in the optical system, lubricates
the eye, provides nutrients and growth factors to the epithe-
lium and serves as a barrier to the outside environment [1,2].
In the last function, it protects the eye against infection. The
tear film is an aqueous layer containing proteins and electro-
lytes secreted by the lacrimal gland situated within the orbit
above the lateral end of the eye, and other accessory gland
secretions. Additionally, tear fluid is in contact with the
Published: 10 August 2006
Genome Biology 2006, 7:R72 (doi:10.1186/gb-2006-7-8-r72)
Received: 12 April 2006
Revised: 30 May 2006
Accepted: 10 August 2006
The electronic version of this article is the complete one and can be
found online at />R72.2 Genome Biology 2006, Volume 7, Issue 8, Article R72 de Souza et al. />Genome Biology 2006, 7:R72
epithelium of the lid and, thereby, is in indirect contact with
the blood circulation. Major tear proteins include lysozyme,
lactoferrin, secretory immunoglobin A, serum albumin, lipoc-
alin and lipophilin [3]. The function of lysosyme, for example,
is to lyse bacterial cell walls.
Tear fluid has become a body fluid of interest because it con-
tains proteins in high concentration (about 8 μg/μl), it is rel-
atively easy to collect, and several reports indicate that
changes in its protein content can reflect normal or disease
states. For example, electrophoretic and chromatographic
analyses suggest that the tear protein patterns of diabetic
patients are very different from those of healthy subjects
[4,5]. Biochemical characterization of tear proteins is also
important for understanding tear deficiencies, contact lens
incompatibilities, tear film instabilities and several other eye
diseases.
Qualitative and quantitative techniques that have been
applied to the study of the tear proteome include one- and
two-dimensional electrophoresis [6,7], enzyme-linked immu-
nosorbent assay (ELISA) and high-performance liquid chro-
matography techniques [4]. More recently, analytical
methods that couple microliter sample size with high sensi-
tivity and resolution have been used in detailed studies of
changes in tear composition following injury or disease.
These methods have been used to map tear protein profiles,
and include several mass spectrometry technologies, such as
matrix assisted laser desorption ionization-time of flight
(MALDI-TOF), surface-enhanced laser desorption ioniza-
tion-TOF (SELDI-TOF) and liquid chromatography coupled
with electrospray ionization (LC/MS) [8-11].
However, despite these efforts to identify and catalogue the
proteins present in the tear, only a very limited number of
proteins have been described in the literature. Patterns
obtained in two-dimensional gel electrophoresis suggest that
tear fluid contains at least 200 proteins [12] and an LC/MS
study of intact proteins indicated at least 17 different molecu-
lar weights [8]. More recently, Li et al. [13] identified 54 dif-
ferent proteins using a combination of different proteomic
approaches. Using a membrane-bound antibody array, Sack
et al. [14] detected 80 different cytokines, chemokines and
growth factors in tear samples. We were able to retrieve a
total of about 60 described identifications and Harding [15]
mentions a tear fluid proteome of about 80 proteins, includ-
ing proteins only present in special conditions, such as
allergy. The relatively low number of proteins identified,
compared to other body fluids, may be due to the limited sen-
sitivity of the methods employed [16], as well as the challeng-
ing composition of the tear fluid proteome, in which three
proteins (lipocalin, lysozyme and lactoferrin) correspond to
approximately 80% of the total protein concentration [17].
Recent developments in mass spectrometry-based proteom-
ics (reviewed in Aebersold and Mann [18]) have dramatically
increased our ability to analyze complex proteomes in-depth.
In particular, a hybrid instrument, the linear ion trap-Fourier
transform (LTQ-FT) mass spectrometer, combines very fast
sequencing speed and high sensitivity with high resolution
and mass accuracy [19]. We have recently described very high
confidence protein identification by a combination of
extremely accurate peptide mass measurement with two
stages of peptide fragmentation [20]. These MS
3
spectra are
scored with a probability based algorithm, which significantly
adds to the confidence of peptide identification and allows
'rescue' of proteins identified with only one peptide. In our
laboratory, this instrument has allowed the unambiguous
identification of low abundant proteins in signaling pathways
and organelles [21,22]. In addition, we also used the very
recently developed LTQ-Orbitrap mass spectrometer [23] for
analysis of tear fluid. In this instrument, ions are detected
with high resolution by their motion in a spindle shaped elec-
trode, instead of in a high magnetic field as is the case in the
LTQ-FT spectrometer. We have recently shown that, by using
a 'lock mass strategy', very high mass accuracy is routinely
achievable in both the MS and MS/MS mode [24], which vir-
tually eliminates the problem of false positive peptide identi-
fication in proteomics, and it is much easier than previously
possible to identify post-translational modifications.
Here, we used both mass spectrometers in the analysis of the
tear fluid proteome and report the unambiguous identifica-
tion of 491 proteins. We observed a large number of proteases
(32 proteins) and protease inhibitors (also 32 proteins), most
not previously described as components of the tear fluid. In
addition, we also identified 18 proteins that are involved in
the anti-oxidant activity of the tear, of which 16 were not
described previously. This in-depth analysis of the tear fluid
should be of interest in ophthalmology and the results can be
used as a reference to allow future characterization of disease
states reflected in the tear fluid.
Results
Comparison between in-gel and in-solution digestion
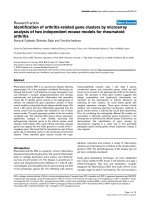
To establish optimal conditions for determination of the tear
fluid proteome we performed both in-gel and in-solution
digestion, as summarized in Figure 1. Tear fluid was subjected
to SDS-PAGE, the gel band cut into 13 slices, in-gel digested
with trypsin and the resulting peptide mixtures analyzed by
LC MS
3
in the LTQ-FT. Alternatively, proteins were digested
in solution with Lys-C, or alternatively by Lys-C followed by
trypsin, prior to MS analysis. Our results showed a total of
320 proteins identified for in gel-based analysis whereas only
59 proteins were identified using 1 μl of tear digested in solu-
tion and 63 proteins for 4 μL of in solution tear digestion.
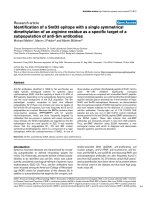
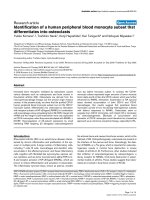
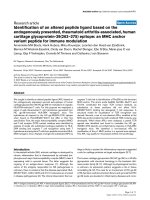
Figure 2 illustrates an example of MS acquisition and identi-
fication for in-gel digestion. In the inset of Figure 2a, the total
ion chromatogram (TIC) is represented, and the spectrum
shows the ions detected in selected ion monitoring (SIM)
Genome Biology 2006, Volume 7, Issue 8, Article R72 de Souza et al. R72.3
comment reviews reports refereed researchdeposited research interactions information
Genome Biology 2006, 7:R72
mode. Figure 2b shows the fragmentation pattern of the most
intense ion in Figure 2a (m/z = 494.2906, peptide mass =
987.5812 Da). The identification is initially done on the basis
of the data obtained using the Mascot algorithm [25]. Figure
2c shows the MS
3
of the most intense ion observed in Figure
2b, which is used to support or discard the identification
made on the basis of MS
2
spectra [20,26].
Comparison between LTQ-FT and LTQ-Orbitrap
analysis
As shown in Figure 1, in situ digestion of 4 μl of tear sample
was also analyzed by the LTQ-Orbitrap mass spectrometer. In
this case, we were able to identify 368 proteins in the sample.
Since MS
3
analyses were not performed in the LTQ-Orbitrap,
the criteria used for protein identification required at least
two peptides with statistical significance (see Materials and
methods). When the LTQ-FT protein list was overlaid with
the Orbitrap data, we observed that approximately one-third
of the proteins identified in the LTQ-FT analysis were not
detected on the Orbitrap (112 of 320 proteins). Interestingly,
most of the proteins that were exclusive to the LTQ-FT analy-
sis (86 hits) are the ones that were validated due to improve-
ments in the Mascot score resulting from MS
3
data, and even
though most of these 86 hits are present in the Orbitrap data
(61 hits), they were discarded due to statistical reasons. On
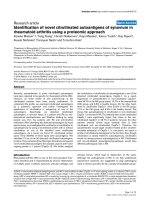
the other hand, the most abundant proteins in the sample had
better sequence coverage in the Orbitrap data than in the
LTQ-FT data (Figure 3). Discarding single peptide hits with
Orbitrap tandem MS data may be overly conservative, since
these spectra have very high resolution and low ppm mass
errors, making false positives extremely unlikely. If such sin-
gle peptide hits had been admitted, more than 100 additional
proteins could be reported (data not shown). Either way, the
presence of a substantial number of single peptide hits sug-
gests that many more proteins are present in this proteome
than we report here.
The complete list of proteins identified is summarized in
Additional data file 1; this table lists the number of peptides
observed for each identified protein, the Mascot score and the
MS
3
score for each peptide and protein (if available, that is,
LTQ-FT data). Protein identification criteria were extremely
stringent, requiring fully tryptic peptides with a mass error
less than 3 ppm for the LTQ-FT or less than 5 ppm for the
Orbitrap. For the FT data, the criteria needed were two
matching peptides with a Mascot score of 27 or one matching
peptide 'rescued' by an additional MS
3
score, adding to a total
probability score of at least 54. For the Orbitrap data, the cri-
teria were two matching peptides with minimal score of 21.
These criteria ensure an error rate in protein identification of
less than 0.1%, so there should be no false positive protein
identifications in our data set. In-gel analysis fully covered in-
solution identifications. Therefore, all subsequent discussion
is based on the in-gel data set.
Ontology of proteins identified
The 491 proteins identified in the in-gel analysis were func-
tionally classified using the Protein Center Tool (Proxeon Bio-
systems, Odense, Denmark) and statistical analysis was done
using the BiNGO tool [27], based on cellular localization,
molecular function and biological process. It should be kept
in mind that Gene Ontology (GO) classification and tools that
build on those annotations often comprise very broad and
overlapping functional categories. Nevertheless, they provide
a useful method of initial classification of a large proteome in
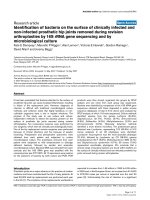
terms of origin and molecular processes. Figure 4 illustrates
an example of group over-representation determined by
BiNGO. Tables 1 and 2 list the two main groups of molecular
functions identified in this work, and also indicate the biolog-
ical process that it is involved. Extracellular proteins are indi-
cated by a dagger and proteins already identified in tear
samples by an asterisk. Note that the hydrolase GO classifica-
tion group is very broad, involving several processes, such as
signal transduction (phosphatases), energy-driven reactions
(ATPases), and glycolysis. We selected from this group pro-
teins that possibly are directly functional in the tear environ-
ment, and not only present as a result of cellular degradation
in the epithelia, for example. Thus, our 'hydrolase' group
listed in Table 1 considers only extracellular proteins, pro-
teins already described as components of the tear fluid, or
proteins that participate in biological processes that are
known to occur in the fluid that covers the eye. In this way we
identified 32 proteins with hydrolase activity, and 32 proteins
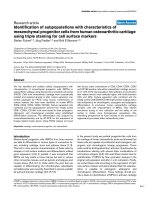
Approach used for tear fluid analysisFigure 1
Approach used for tear fluid analysis. The tear fluid was analyzed by both
in-solution digestion (1 and 4 μl) and one-dimensional gel separation
combined with MS (GeLC-MS; 2 lanes of 4 μl each) on a LTQ-FT, and also
through GeLC-MS on a LTQ-Orbitrap. The numbers indicate the bands
according to the slicing pattern used for sample fractionation prior to in
situ digestion.
Tear fluid sample
12% SDS-PAGE In-solution
digestion
In-solution
digestion
In-gel
digestion
4µ 4enal/LµL1µL
LC/MS – LTQ-
FT
1
2
3
4
5
6
7
8
9
12
10
11
13
LC/MS – LTQ-
Orbitrap
R72.4 Genome Biology 2006, Volume 7, Issue 8, Article R72 de Souza et al. />Genome Biology 2006, 7:R72
Figure 2 (see legend on next page)
gs-band3 # 7638 RT: 72.00 AV: 1 NL: 1.04E5
T: FTMS + p ESI d SIM ms [ 492.00-499.00]
492 493 494 495 496 497 498 499
m/z
0
5
10
15
20
25
30
35
40
45
50
55
60
65
70
75
80
85
90
95
100
Relative abundance
494.29
495.75
494.79
496.26
495.30
492.29
496.62
495.61
493.77
492.79
493.20
495.94
494.24
495.00
496.32
494.70
497.22
RT: 0.00 - 140.02
0 10 20 30 40 50 60 70 80 90 100 110 120 130 140
Time (min )
0
5
10
15
20
25
30
35
40
45
50
55
60
65
70
75
80
85
90
95
100
Relative abundance
137.79
48.08
60.71
123.84
72.78
48.83
61.07
61.39
57.45
81.92
64.37
101.39
65.67
122.30
104.86
90.32
110.50
46.21
113.10
91.90
78.09
45.12
124.56
125.44
44.33
40.67
126.59
95.40
34.97
34.31
29.024.76 14.11
NL:
2.61E8
TIC F: MS
gs-band3
MS1
gs-band3 # 7639 RT: 72.01 AV: 1 NL: 1.75E 4
T: ITM S + p E SI d w Full m s2 494.30@ 33.00 [ 125.00-1000.00]
200 300 400 500 600 700 800 900 1000
m/z
0
5
10
15
20
25
30
35
40
45
50
55
60
65
70
75
80
85
90
95
100
Relative abundance
761.45
533.27
227.09
420.27
646.45
342.27
427.18
874.45
291.09
611.36
697.45
402.18
777.55
525.64
962.73
MS2
ILDLIESGK
Score 46
y8
y7
y6
b6
y5
b4
y4
b3
y3
b2
a2
gs-band3 # 7640 RT: 72.01 AV: 1 NL: 4.81E3
T: ITM S + c ES I d w Full m s3 494.30@ 33.00 761.39@ 33.00 [ 195.00-775.00]
250 300 350 400 450 500 550 600 650 700
m/z
0
5
10
15
20
25
30
35
40
45
50
55
60
65
70
75
80
85
90
95
100
Relative
291.21
646.36
420.22
402.15
533.40
384.32
597.37
366.42
468.28
342.10
615.35
484.25
541.99
243.04
558.09
278.24
570.83
664.52
701.02
MS3
y6
y5
y4
b3
y3
Score 99
gs-band3 # 7638 RT: 72.00 AV: 1 NL: 1.04E5
T: FTMS + p ESI d SIM ms [ 492.00-499.00]
492 493 494 495 496 497 498 499
m/z
0
5
10
15
20
25
30
35
40
45
50
55
60
65
70
75
80
85
90
95
100
Relative
494.29
495.75
494.79
496.26
495.30
492.29
496.62
495.61
493.77
492.79
493.20
495.94
494.24
495.00
496.32
494.70
497.22
RT: 0.00 - 140.02
0 10 20 30 40 50 60 70 80 90 100 110 120 130 140
Time (min )
0
5
10
15
20
25
30
35
40
45
50
55
60
65
70
75
80
85
90
95
100
Relative
137.79
48.08
60.71
123.84
72.78
48.83
61.07
61.39
57.45
81.92
64.37
101.39
65.67
122.30
104.86
90.32
110.50
46.21
113.10
91.90
78.09
45.12
124.56
125.44
44.33
40.67
126.59
95.40
34.97
34.31
29.024.76 14.11
NL:
2.61E8
TIC F: MS
gs-band3
MS1
gs-band3 # 7639 RT: 72.01 AV: 1 NL: 1.75E 4
T: ITM S + p E SI d w Full m s2 494.30@ 33.00 [ 125.00-1000.00]
200 300 400 500 600 700 800 900 1000
m/z
0
5
10
15
20
25
30
35
40
45
50
55
60
65
70
75
80
85
90
95
100
Relative
761.45
533.27
227.09
420.27
646.45
342.27
427.18
874.45
291.09
611.36
697.45
402.18
777.55
525.64
962.73
MS2
ILDLIESGK
Score 46
y8
y7
y6
b6
y5
b4
y4
b3
y3
b2
a2
gs-band3 # 7640 RT: 72.01 AV: 1 NL: 4.81E3
T: ITM S + c ES I d w Full m s3 494.30@ 33.00 761.39@ 33.00 [ 195.00-775.00]
250 300 350 400 450 500 550 600 650 700
m/z
0
5
10
15
20
25
30
35
40
45
50
55
60
65
70
75
80
85
90
95
100
Relative abundance
291.21
646.36
420.22
402.15
533.40
384.32
597.37
366.42
468.28
342.10
615.35
484.25
541.99
243.04
558.09
278.24
570.83
664.52
701.02
gs-band3 # 7640 RT: 72.01 AV: 1 NL: 4.81E3
T: ITM S + c ES I d w Full m s3 494.30@ 33.00 761.39@ 33.00 [ 195.00-775.00]
250 300 350 400 450 500 550 600 650 700
m/z
0
5
10
15
20
25
30
35
40
45
50
55
60
65
70
75
80
85
90
95
100
Relative
291.21
646.36
420.22
402.15
533.40
384.32
597.37
366.42
468.28
342.10
615.35
484.25
541.99
243.04
558.09
278.24
570.83
664.52
701.02
MS3
y6
y5
y4
b3
y3
Score 99
(a)
(b)
(c)
Genome Biology 2006, Volume 7, Issue 8, Article R72 de Souza et al. R72.5
comment reviews reports refereed researchdeposited research interactions information
Genome Biology 2006, 7:R72
classified as protease inhibitors, mainly serine protease
inhibitors. From these 64 proteins, only 24 proteins had been
previously identified as components of tear fluid in other
studies.
Figure 5a shows the cellular localization pattern of all pro-
teins identified. Approximately 199 proteins were not classi-
fied by the ontology database. Interestingly, our data show
that 41% (200 proteins) belong to the intracellular compart-
ment, mainly present in cytoplasm (136 proteins), and, to a
lesser extent, to compartments such as the nucleus (20 pro-
teins), the Golgi apparatus (12 proteins) and the lysosome (11
proteins). On the other hand, only 68 proteins were classified
as extracellular proteins, in addition to 2 that were classified
as components of the extracellular matrix. When the not
mapped protein group is eliminated from the chart, the intra-
cellular proteins represent approximately 68% of the total
identification (Figure 5b).
In addition, the classification of the identified proteins based
on biological processes (Figure 6) revealed that at least 37
proteins belong to the immune system, 50 proteins are
involved in immune response, such as antibodies and pro-
teins from the complement system, 15 proteins are involved
in inflammatory response, and 7 proteins are responsible for
defense against pathogens. We also identified 31 proteins that
are associated with response to wounding and blood coagula-
tion. Finally, we identified 18 proteins that are involved in the
metabolism of reactive oxygen species, such as peroxiredox-
ins and catalase, which may be functioning in the tear film in
the defense against toxic oxygen compounds.
Discussion
Over the past few decades, less then 80 proteins have been
identified in tear fluid in normal or disease states [15]. How-
ever, a more comprehensive identification of a larger number
of proteins would be desirable to help identify molecular
markers of a variety of diseases, such as dry eye syndrome,
Sjogren syndrome, complications due to diabetes, conjuncti-
vitis and others [28-30], as well as advance investigation of
normal processes of wound healing and immune defense
[14,31]. In this study, using a mass spectrometry-based pro-
teomic approach, we identified 491 proteins in tear fluid,
using SDS-PAGE fractionation, in-gel trypsin digestion and
independent analysis using two different high performance
LTQ-FT data for the peptide at m/z 494Figure 2 (see previous page)
LTQ-FT data for the peptide at m/z 494.29 (ILDLIESGK). The figure shows an example of data-dependent acquisition on the LTQ-FT. (a) SIM scan of the
doubly charged peptide at 494.29, observed in the total ion chromatogram. (b) The peptide is selected for fragmentation and MS
2
acquisition, and (c) the
most intense daughter-ion is selected for a new round of fragmentation MS
3
. Partial data obtained in the MS
3
is used to confirm sequence observed in the
MS
2
and, consequently, improves the probability score for the identified sequence.
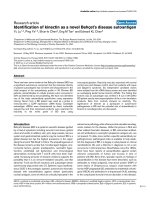
Data comparison between LTQ-FT and LTQ-Orbitrap spectrometryFigure 3
Data comparison between LTQ-FT and LTQ-Orbitrap spectrometry. The
numbers of peptides for the top six identified proteins (LTQ-FT data)
were compared between the two methods. Except for the protein
Apolipoprotein B100, we observed a significant increase in the number of
peptides identified with the LTQ-Orbitrap. This pattern was observed for
most of the proteins identified with more then three peptides in the LTQ-
FT. Light gray bars represent LTQ-FT data, dark gray represents LTQ-
Orbitrap data.
0
20
40
60
80
100
120
140
160
Apolipoprotein
B100
Lactotransferrin HSP2 Complement C3 PIgR Serum albumin
Protein name
Number of identified peptides
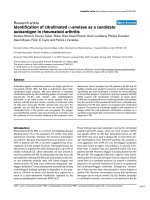
Statistical analysis of GO classification using the BiNGO toolFigure 4
Statistical analysis of GO classification using the BiNGO tool. After
identification and merging of the two datasets by the Protein Center tool,
a gene list of the 491 identified proteins was generated and submitted to
the BiNGO tool. This tool is able to apply statistical analysis to determine
over-represented groups present in the sample. The figure shows a partial
diagram of the analysis of GO molecular function, zoomed in the protease
inhibitors branch. The p values for this group are also indicated.
p-value Description
2.7093E-16 enzyme inhibitor activity
1.1332E-13 endopeptidase inhibitor activity
1.3732E-13 protease inhibitor activity
2.5867E-10 enzyme regulator activity
2.1781E-7 serine-type endopeptidase inhibitor activity
R72.6 Genome Biology 2006, Volume 7, Issue 8, Article R72 de Souza et al. />Genome Biology 2006, 7:R72
mass spectrometers. We analyzed material from a single,
healthy donor as we wanted to characterize the normal tear
fluid proteome. The basic composition and make up of such
body fluid proteomes are likely to be very similar between
healthy subjects, as we have already investigated in more
detail in the case of the urinary and saliva proteomes. In these
cases, we found that single and pooled samples were identical
in terms of their main properties, such as molecular weight
distributions and GO classification (Adachi et al.: The human
urinary proteome contains more than 1,500 proteins, includ-
ing a large proportion of membrane proteins, Genome Biol-
ogy, in revision; de Souza, Schenk and Mann, unpublished
data).
To determine the efficiency of different methods for the char-
acterization of the tear fluid content, we compared an in-gel
digestion of tear sample subjected to SDS-PAGE with an in-
solution digestion of 1 or 4 μL of tear fluid, all analyzed using
the LTQ-FT spectrometer. Our results showed that in-gel
digestion identified about five times more proteins than in-
solution digestion. This result was unexpected because in-
solution digests of protein mixtures, in our experience, can
readily identify several hundred proteins in a single analysis
[32]. This difference in the number of proteins identified by
each method could partly be caused by the high 'dynamic
range' of tear fluid, in which 80% to 90% of the protein con-
tent is represented by a minor group of proteins [17], which
Table 1
Hydrolases identified in tear fluid
Hydrolase activity Gene symbol Biological process
Leukotriene A-4 hydrolase LTA4H 1,2
Matrix metalloproteinase 8* MMP8 1,3
Matrix metalloproteinase 9* MMP9 1,3
Myeloblastin
†
PRTN3 3
Apolipoprotein B APOBEC3C 4
Azurocidin
†
AZU1 4
Dipeptidylpeptidase IV DPP4 4
Leukocyte elastase* ELA2 4
Haptoglobin* HP 4
Lactotransferrin* LTF 4,5
Lysozyme C* LYZ 4
Eosinophil cationic protein* RNASE3 4,9
Adipocyte-derived leucine aminopeptidase
†
ARTS-1 5
Zinc-alpha-2-glycoprotein* AZGP1 5
Complement factor B
†
BF 5
Ubiquitin thiolesterase protein
†
OTUB1 5
Palmitoyl-protein thioesterase 1 PPT1 6
Plasminogen* PLG 7
Aminopeptidase N ANPEP 8
Acid phosphatase, prostate
†
ACPP 10
Chitinase 3-like protein 2
†
CHI3L2 11
Cytosolic nonspecific dipeptidase
†
CNDP2 1
Cathepsin B* CTSB 1
Cathepsin D CTSD 1
Cathepsin G CTSG 1
Cathepsin Z CTSZ 1
Prostasin
†
PRSS8 1
Aminopeptidase B
†
RNPEP 1
Tissue alpha-L-fucosidase FUCA1 12
Beta-mannosidase* MANBA 13
Alpha-N-acetylglucosaminidase* NAGLU 12
Neuraminidase NEU1 12
*The protein has already described in the tear fluid.
†
The protein is classified as an extracellular protein. 1, Proteolysis; 2, inflammatory response; 3,
extracellular matrix degradation; 4, defense response; 5, immune response; 6, visual perception; 7, blood coagulation; 8, angiogenesis; 9, nucleotide
metabolism; 10, regulation of cell proliferation; 11, chitin catabolism; 12, carbohydrate metabolism; 13, protein modification; 14, central nervous
system development; 15, signal transduction.
Genome Biology 2006, Volume 7, Issue 8, Article R72 de Souza et al. R72.7
comment reviews reports refereed researchdeposited research interactions information
Genome Biology 2006, 7:R72
may make the identification of the lower abundant proteins
difficult without pre-fractionation of the sample. Although we
have no direct evidence, we also speculate that the ineffi-
ciency of the in-solution digestion could result from a lack of
efficiency of the protocol itself, or from the high number of
protease inhibitors and proteases present in the sample.
The large dynamic range of the tear sample could also explain
the differences observed in the number of identified proteins
between the LTQ-FT and Orbitrap analyses. From the 320
proteins validated in the LTQ-FT data, only two-thirds were
also validated in the Oribitrap data. This does not mean that
the peptides that lead to a protein identification were not
present in the Orbitrap analysis, but it does mean that, due to
differences in validation criteria, these hits were not consid-
ered statistically significant. Also, as mentioned above, many
'LTQ-FT only' proteins were identified with one peptide in the
Orbitrap analysis. Different validation criteria were applied
due to the fact that the LTQ-FT instrument performs MS
3
analysis while it also performs SIM scans of the precursor ion.
We are currently evaluating if one peptide hits in the Orbitrap
should also be allowed for protein identification due to the
Table 2
Protease inhibitors identified in the tear fluid
Protease inhibitor Gene symbol Biological process
Alpha-2-macroglobulin* A2M
Alpha-2-HS-glycoprotein* AHSG 2
Alpha-1-microglobulin
†
AMBP 2
Annexin 5 ANXA5 7
Complement C3* C3 2,5
Complement C4
†
C4A 2,5
Cystatin B CSTB
Cystatin SN* CST1
Cystatin SA* CST2
Cystatin C* CST3
Cystatin S* CST4
Inter-alpha-trypsin inhibitor heavy chain H1* ITIH1 5
Inter-alpha-trypsin inhibitor heavy chain H2
†
ITIH2 5
Inter-alpha-trypsin inhibitor heavy chain H4
†
ITIH4 5
Lipocalin 1* LCN1 5
Similar to Lipocalin 1
Lipocalin 2 LCN2
Latexin
†
LXN
Prosaposin
†
PSAP
Alpha-1-antitrypsin* SERPINA1 5
Alpha-1-antichymotrypsin* SERPINA3 2,5
Leukocyte elastase inhibitor* SERPINB1 5
Plasminogen activator inhibitor-2
†
SERPINB2 7
Maspin
†
SERPINB5
Placental thrombin inhibitor
†
SERPINB6
Antithrombin-III
†
SERPINC1 7
Pigment epithelium-derived factor* SERPINF1 8
Plasma protease C1 inhibitor
†
SERPING1 5,7
Neuroserpin SERPINI1 14
Stratifin
†
SFN 15
Thrombospondin-1
†
THBS1 7
Tissue inhibitor of metalloproteinase 1* TIMP1 10
*The protein has already described in the tear fluid.
†
The protein is classified as an extracellular protein. 1, Proteolysis; 2, inflammatory response; 3,
extracellular matrix degradation; 4, defense response; 5, immune response; 6, visual perception; 7, blood coagulation; 8, angiogenesis; 9, nucleotide
metabolism; 10, regulation of cell proliferation; 11, chitin catabolism; 12, carbohydrate metabolism; 13, protein modification; 14, central nervous
system development; 15, signal transduction.
R72.8 Genome Biology 2006, Volume 7, Issue 8, Article R72 de Souza et al. />Genome Biology 2006, 7:R72
ppm mass accuracy of MS/MS data from this instrument
when analysis is performed in the Orbitrap analyzer. We
observed that, while the high abundant proteins from the
sample were better characterized by the Orbitrap (Figure 3),
the proteins identified based on one or two peptides plus the
MS
3
score still had similar profiles in the Orbitrap. In a
situation with a more favorable sample dynamic range, we
would expect that proteins identified with one or two peptides
in the LTQ-FT would have a larger number of peptides iden-
tified in the Orbitrap, due to the higher speed of analysis.
The ontology classification of the identified proteins revealed
remarkable characteristics of the tear fluid, so far not
described in the literature. Our data show that 200 proteins
are primarily classified as intracellular molecules, while only
68 are classified as extracellular proteins. The presence of
several intracellular metabolic proteins in tear fluid, such as
lactate dehydrogenase, was initially described by van
Haeringen and Glasius [33], who also demonstrated that
these proteins originate from the cellular shedding of the epi-
thelium that contacts the tear fluid. Most recently, several
proteins that perform important functions in tear fluid, such
as cathepsins and syaloglycoproteins, were also reported as
proteins of epithelial origin [34,35]. In some cases these
intracellular proteins may have a functional role in tear fluid,
and in other cases they may be present solely as the result of
cellular necrosis, but could in principle still be relevant for
diagnostic purposes.
We also show that 64 proteins (or approximately 12% of the
total number of proteins described) belong to the functional
group of hydrolase activity or protease inhibitors. It has been
demonstrated that the levels of proteases and proteases
inhibitors are in a constant equilibrium in tear fluid [35,36]
and that imbalance in these levels may lead to the develop-
ment of disease states in the eye [31,37]. Our large-scale pro-
teomic investigation greatly extends the number of known
proteases and protease inhibitors. These two groups of pro-
teins were the best represented functional group in this study,
indicating their importance in tear fluid. Proteins from these
groups are associated with defensive mechanisms against
pathogens, as well as extracellular matrix remodeling during
healing and wounding processes [31,38]. The biological proc-
ess in which the largest group of proteins is involved is, not
surprisingly, the immune defense of the eye. Of the 50 pro-
teins classified as components of the immune defense
(immune response, inflammatory response and defense
response), 25 were functionally classified as hydrolases or
GO classification of tear fluid based on cellular localizationFigure 5
GO classification of tear fluid based on cellular localization. (a) Of the 491
proteins identified in the tear fluid, 200 were classified as intracellular
proteins, while only 68 were classified as extracellular. As already
described in the literature, the presence of intracellular proteins may be a
result of cell death in the epithelium in close contact with the eye. (b)
From the intracellular group, the great majority of proteins belongs to the
cytoplasmic region, with some organelles being well represented, such as
the lysosome (BiNGO p value of 6.9216E-8, the third highest score after
cytoplasmatic and extracellular proteins).
GO cellular component
Not mapped, 199
Extracellular, 68
Membrane, 24
Intracellular, 200
c
Intracellular proteins
Cytoplasm, 136
Nucleus, 20
Ribosome, 1
Lysosome, 11
Peroxisome, 1
Golgi apparatus, 12
Mitichondrion, 7
Endoplasmic
reticulum, 10
Vesicle, 2
(b)
(a)
Relevant GO biological processes identified in the tear fluidFigure 6
Relevant GO biological processes identified in the tear fluid. In the tear
fluid, the most over-represented groups identified according to GO
biological process were those involved in defense of the eye environment.
These mainly comprised process such as immune response, defense
against external biotic agents, response to wounding, and blood
coagulation. Interestingly, 18 proteins responsible for response to
oxidative stress were identified, only two of them described previously in
tear fluid samples.
GO biological process
Inflammatory
response, 15
Response to
wounding, 31
Blood coagulation,
12
Proteolysis, 35
Response to
oxidative stress, 18
Defense response
to bacteria, 7
Immune response,
50
Genome Biology 2006, Volume 7, Issue 8, Article R72 de Souza et al. R72.9
comment reviews reports refereed researchdeposited research interactions information
Genome Biology 2006, 7:R72
protease inhibitors. The other proteins involved in the
immune defense are, mainly, antibodies and proteins from
the complement pathway.
We identified 18 proteins that were classified as molecules
involved in the response to oxidative stress. It has been dem-
onstrated that the tear fluid possesses anti-oxidative
protection against reactive oxygen species (ROS) [39], and
decrease in oxidative activity in tear fluid has been associated
with several disease states, such as the development of dia-
betic dry eye disease [40]. The only two proteins related to
ROS elimination and already described as components of tear
fluid are superoxide dismutase [41,42] and oxyen-regulated
protein 1 [13].
Conclusion
Our proteomic study highlights the importance of the balance
of oxidative reactions, as well as the balance of hydrolase
activity and protease inhibitors, as we report here 82 proteins
involved in these processes (only 26 were described previ-
ously). These proteins may play crucial roles in maintaining
the eye in a healthy condition. Perturbation of these proteins
in the tear fluid may lead to the development of disease states,
making them interesting targets for diagnostics and further
functional characterization.
Materials and methods
Tear sample collection
Samples of closed-eye tear were collected from one of us
(GAS) using a 5 μl calibrated glass microcapillary tube (Blau-
band intraMARK, Brand GMBH, Werthein, Germany) with-
out touching the eye globe or lids, in the course of one week
and at different times of the day to avoid diurnal variation
[34,35]. One sample typically contained 2 μl. After collection,
the tears were centrifuged at 14,000 g for 1 minute at 4°C
(Eppendorf model 5417C, Eppendorf, Hamburg, Germany) to
remove cellular debris, and stored at -20°C until analysis.
SDS-PAGE and in situ digestion
A tear sample (4 μL) was added to electrophoretic sample
buffer (NuPAGE kit, Invitrogen, Karlsruht, Germany) and
tear protein content was resolved by SDS-PAGE using a
homogeneous 12% gel (NuPAGE gel, Invitrogen) under
reducing conditions for 50 minutes with a constant voltage of
200 V. The gel was stained with Coomassie staining kit
(NuPAGE, Invitrogen), as instructed by the manufacturer.
After staining, two lanes of the gel were combined and then
sliced in 13 pieces as indicated in Figure 1. The pieces were
then subjected to in-gel reduction, alkylation and tryptic
digestion. To reduce disulfide bonds, 100 mM DTT was added
to a final concentration of 10 mM in the protein solutions and
incubated for 1 h at 56°C in the dark. Free thiol (-SH) groups
were subsequently alkylated with iodoacetamide (50 mM
final concentration) for 45 minutes at room temperature. The
reduced and alkylated protein mixtures were digested with
sequence grade-modified trypsin (wt:wt 1:50; Promega, Mad-
ison, WI, USA) for 16 h at 37°C in 50 mM NH
4
HCO
3
, pH 8.0.
Proteolysis was quenched by acidification of the reaction mix-
tures with 2% trifluoroacetic acid (Fluka, Buchs, Switzer-
land). Finally, the resulting peptide mixtures were desalted
on RP-C
18
STAGE tips as described [43] and diluted in 0.1%
trifluoroacetic acid for nano-HPLC-MS analysis.
In-solution digest
Samples of 1 and 4 μl of tear fluid were resuspended in 20 μl
of 6 M urea and 2 M thiourea (Invitrogen) and submitted to
reduction and alkylation as described above. For enzymatic
digestion, Lys-C (wt:wt 1:50; Wako, Japan) was added to the
solution for 16 h at room temperature, and the resulting
peptides were desalted on RP-C
18
STAGE tips. The same
experiment was repeated using Lys-C for 16 h, followed by
trypsin (1:50) for 24 h at room temperature.
Mass spectrometry
All nano-HPLC-MS
2
experiments were performed on an Agi-
lent 1100 nanoflow system connected to a 7-Tesla Finnigan
linear quadrupole ion trap-Fourier transform (LTQ-FT) mass
spectrometer (ThermoElectron, Bremen, Germany), or
connected to a LTQ-Orbitrap mass spectrometer (ThermoE-
lectron), both equipped with a nanoelectrospray ion source
(Proxeon Biosystems, Odense, Denmark).
LTQ-FT
Briefly, for in-gel samples, the mass spectrometer was oper-
ated in the data-dependent mode to automatically switch
between MS, MS
2
, and MS
3
acquisition. Survey full-scan MS
spectra (m/z 300 to 1,500) were acquired in the Fourier
transform ion cyclotron resonance (FT ICR) with resolution R
= 25,000 at m/z 400 (after accumulation to a target value of
10,000,000 in the linear ion trap). The three most intense
ions were sequentially isolated for accurate mass
measurements by an ICR-FT SIM scan with 10 Da mass
range, R = 50,000 and target accumulation value of 50,000.
They were then fragmented in the linear ion trap by collision-
ally induced dissociation at a target value of 5,000. For MS
3
,
up to three ions in each MS
2
spectra (the most intense ions
with m/z > 300) were further isolated and fragmented.
Former target ions selected for MS
2
were dynamically
excluded for 30 s. Total cycle time was approximately 3 s. The
general mass spectrometric conditions were: spray voltage,
2.4 kV; no sheath and auxiliary gas flow; ion transfer tube
temperature, 100°C; collision gas pressure, 1.3 mTorr; and
normalized collision energy, 30% for MS
2
and 28% for MS
3
.
Ion selection thresholds were: 500 counts for MS
2
and 50
counts for MS
3
. An activation q-value of 0.25 and an activa-
tion time of 30 ms was applied in both MS
2
and MS
3
fragmen-
tation [20]. However, due to the expected higher complexity
of in solution digestion samples, the acquisition method was
adjusted to not perform SIM scan or MS
3
, but to sequence the
five most intense peaks for obtaining MS
2
data.
R72.10 Genome Biology 2006, Volume 7, Issue 8, Article R72 de Souza et al. />Genome Biology 2006, 7:R72
LTQ-Orbitrap
The mass spectrometer was operated in the data-dependent
mode to automatically switch between Orbitrap-MS and
Orbitrap-MS/MS (MS
2
) acquisition. Survey full scan MS
spectra (from m/z 300 to 1,600) were acquired in the
Orbitrap with resolution R = 60,000 at m/z 400 (after accu-
mulation to a target value of 1,000,000 charges in the linear
ion trap). The most intense ions (up to five, depending on sig-
nal intensity) were sequentially isolated for fragmentation in
the linear ion trap using collisionally induced dissociation at
a target value of 100,000 charges. The resulting fragment
ions were recorded in the Orbitrap with resolution R = 15,000
at m/z 400.
For accurate mass measurements the lock mass option was
enabled in both MS and MS/MS mode and the polydimethyl-
cyclosiloxane (PCM) ions generated in the electrospray proc-
ess from ambient air (protonated (Si(CH3)2O))6; m/z =
445.120025) were used for internal recalibration in real time.
For single SIM scan injections of the lock mass into the C-trap
the lock mass 'ion gain' was set at 10% of the target value of
the full mass spectrum. When calibrating in MS/MS mode the
ion at m/z 429.088735 (PCM with neutral methane loss) was
used instead for recalibration [24].
Target ions already selected for MS/MS were dynamically
excluded for 30 s. General mass spectrometric conditions
were: electrospray voltage, 2.4 kV; no sheath and auxiliary
gas flow; ion transfer tube temperature, 125°C; collision gas
pressure, 1.3 mTorr; normalized collision energy, 32% for
MS
2
. Ion selection threshold was 500 counts for MS
2
. An acti-
vation q-value of 0.25 and activation time of 30 ms was
applied for MS
2
acquisitions.
Data analysis
Stringent criteria were applied for protein identification,
which was performed by searching the data against the Inter-
national Protein Index database (IPI_human) by MASCOT
(Matrix Science) and MSQuant (an in-house developed, open
source software program). These criteria comprised: for LTQ-
FT-ICR data, a mass accuracy within 3 ppm (in-gel digestion;
average absolute peptide mass accuracy was 1.03 ppm) or 25
ppm (in-solution digestion; average absolute accuracy was
8.3 ppm); for LTQ-Orbitrap data, a mass accuracy of 5 ppm
(average absolute accuracy of 1.01 ppm); at least two, fully
tryptic, matching peptides per protein with a Mascot score for
individual peptides (MS
2
) better than 27 (p ≤ 0.01), or one
peptide with MS
2
+ MS
3
score better that 54 (p ≤ 0.0001),
when MS
3
was performed. For in-solution digestion, proteins
were considered identified if they had at least two peptides
with score higher than 35. For Orbitrap data, the criteria were
a mass accuracy within 3 ppm (average absolute peptide mass
accuracy was 1.22 ppm) and at least 2 fully tryptic peptides
per protein with a Mascot score better then 21 (p ≤ 0.01) for
individual peptides (MS
2
). Differences in mass accuracy
between in-solution samples (more complex compared to in-
gel samples due to lack of pre-fractionation) was observed
because the measurement of ion masses was not performed
with the SIM method, leading to higher sequencing speed of
the method at the cost of lower mass accuracy.
Experiments with a reversed database were performed as
described in [44]. The number of statistically significant pep-
tides identified in the IPI database was 1,935, while the
reverse database identified 12 peptides with statistical signif-
icance (0.6%) for the LTQ-FT data. However, these 12 pep-
tides were not sufficient to identify a single protein (that is,
none of the proteins had at least 2 peptides with score higher
than 27 or one peptide with MS
3
score higher than 54). The
Orbitrap data included no peptides within statistical
significance in the reverse database. Identified proteins were
combined in a larger data set and initial GO characterization
was done using the Protein Center tool (v0.62, Proxeon
Biosystems).
Data
Our data are freely available at the proteome database of the
department of proteomics and signal transduction of the
Max-Planck-Institut for Biochemistry [45].
Additional data files
The following additional data are available with the online
version of this paper. Additional data file 1 lists all peptides
and protein hits obtained in both LTQ-FT and LTQ-Orbitrap
data.
Additional data file 1All peptides and protein hits obtained in both LTQ-FT and LTQ-Orbitrap dataAll peptides and protein hits obtained in both LTQ-FT and LTQ-Orbitrap data.Click here for file
References
1. Dilly PN: Structure and function of the tear film. Adv Exp Med
Biol 1994, 350:239-247.
2. Fleiszig SM, McNamara NA, Evans DJ: The tear film and defense
against infection. Adv Exp Med Biol 2002, 506:523-530.
3. Kijlstra A, Kuizenga A: Analysis and function of the human tear
proteins. Adv Exp Med Biol 1994, 350:299-308.
4. Grus FH, Augustin AJ: High performance liquid chromatogra-
phy analysis of tear protein patterns in diabetic and non-dia-
betic dry-eye patients. Eur J Ophthalmol 2001, 11:19-24.
5. Herber S, Grus FH, Sabuncuo P, Augustin AJ: Changes in the tear
protein patterns of diabetic patients using two-dimensional
electrophoresis. Adv Exp Med Biol 2002, 506:623-626.
6. Reitz C, Breipohl W, Augustin A, Bours J: Analysis of tear proteins
by one- and two-dimensional thin-layer iosoelectric focusing,
sodium dodecyl sulfate electrophoresis and lectin blotting.
Detection of a new component: cystatin C. Graefes Arch Clin
Exp Ophthalmol 1998, 236:894-899.
7. Molloy MP, Bolis S, Herbert BR, Ou K, Tyler MI, van Dyk DD, Willcox
MD, Gooley AA, Williams KL, Morris CA, et al.: Establishment of
the human reflex tear two-dimensional polyacrylamide gel
electrophoresis reference map: new proteins of potential
diagnostic value. Electrophoresis 1997, 18:2811-2815.
8. Zhou L, Beuerman RW, Barathi A, Tan D: Analysis of rabbit tear
proteins by high-pressure liquid chromatography/electro-
spray ionization mass spectrometry. Rapid Commun Mass
Spectrom 2003, 17:401-412.
9. Fung KY, Morris C, Sathe S, Sack R, Duncan MW: Characterization
of the in vivo forms of lacrimal-specific proline-rich proteins
in human tear fluid. Proteomics 2004, 4:3953-3959.
10. Zhou L, Huang LQ, Beuerman RW, Grigg ME, Li SF, Chew FT, Ang L,
Stern ME, Tan D: Proteomic analysis of human tears: defensin
expression after ocular surface surgery. J Proteome Res 2004,
Genome Biology 2006, Volume 7, Issue 8, Article R72 de Souza et al. R72.11
comment reviews reports refereed researchdeposited research interactions information
Genome Biology 2006, 7:R72
3:410-416.
11. Grus FH, Podust VN, Bruns K, Lackner K, Fu S, Dalmasso EA, Wirth-
lin A, Pfeiffer N: SELDI-TOF-MS ProteinChip array profiling of
tears from patients with dry eye. Invest Ophthalmol Vis Sci 2005,
46:863-876.
12. Herber S, Grus FH, Sabuncuo P, Augustin AJ: Two-dimensional
analysis of tear protein patterns of diabetic patients. Electro-
phoresis 2001, 22:1838-1844.
13. Li N, Wang N, Zheng J, Liu XM, Lever OW, Erickson PM, Li L: Char-
acterization of human tear proteome using multiple pro-
teomic analysis techniques. J Proteome Res 2005, 4:2052-2061.
14. Sack RA, Conradi L, Krumholz D, Beaton A, Sathe S, Morris C: Mem-
brane array characterization of 80 chemokines, cytokines,
and growth factors in open- and closed-eye tears: angiogenin
and other defense system constituents. Invest Ophthalmol Vis Sci
2005, 46:1228-1238.
15. Harding J: Biochemistry of the Eye London: Chapman and Hall; 1997.
16. Bucknall M, Fung KY, Duncan MW: Practical quantitative bio-
medical applications of MALDI-TOF mass spectrometry. J
Am Soc Mass Spectrom 2002, 13:1015-1027.
17. Azzarolo AM, Brew K, Kota S, Ponomareva O, Schwartz J, Zylberberg
C: Presence of tear lipocalin and other major proteins in lac-
rimal fluid of rabbits. Comp Biochem Physiol B Biochem Mol Biol
2004, 138:111-117.
18. Aebersold R, Mann M: Mass spectrometry-based proteomics.
Nature 2003, 422:198-207.
19. Syka JE, Marto JA, Bai DL, Horning S, Senko MW, Schwartz JC, Ueber-
heide B, Garcia B, Busby S, Muratore T, et al.: Novel linear quadru-
pole ion trap/FT mass spectrometer: performance
characterization and use in the comparative analysis of his-
tone H3 post-translational modifications. J Proteome Res 2004,
3:621-626.
20. Olsen JV, Mann M: Improved peptide identification in pro-
teomics by two consecutive stages of mass spectrometric
fragmentation. Proc Natl Acad Sci USA 2004,
101:13417-13422.
21. Schulze WX, Mann M: A novel proteomic screen for peptide-
protein interactions. J Biol Chem 2004, 279:10756-10764.
22. Andersen JS, Wilkinson CJ, Mayor T, Mortensen P, Nigg EA, Mann M:
Proteomic characterization of the human centrosome by
protein correlation profiling. Nature 2003, 426:570-574.
23. Makarov A, Denisov E, Lange O, Horning S: Dynamic range of
mass accuracy in LTQ Orbitrap hybrid mass spectrometer.
J Am Soc Mass Spectrom 2006, 17:977-982.
24. Olsen JV, de Godoy LM, Li G, Macek B, Mortensen P, Pesch R,
Makarov A, Lange O, Horning S, Mann M: Parts per million mass
accuracy on an Orbitrap mass spectrometer via lock mass
injection into a C-trap. Mol Cell Proteomics 2005, 4:2010-2021.
25. Hirosawa M, Hoshida M, Ishikawa M, Toya T: MASCOT: multiple
alignment system for protein sequences based on three-way
dynamic programming. Comput Appl Biosci 1993, 9:161-167.
26. Steen H, Mann M: The ABC's (and XYZ's) of peptide
sequencing. Nat Rev Mol Cell Biol 2004, 5:699-711.
27. Maere S, Heymans K, Kuiper M: BiNGO: a Cytoscape plugin to
assess overrepresentation of gene ontology categories in
biological networks. Bioinformatics 2005, 21:3448-3449.
28. Johnson ME, Murphy PJ: Changes in the tear film and ocular sur-
face from dry eye syndrome. Prog Retin Eye Res 2004,
23:449-474.
29. Kassan SS, Moutsopoulos HM: Clinical manifestations and early
diagnosis of Sjogren syndrome. Arch Intern Med 2004,
164:1275-1284.
30. Leonardi A, Jose PJ, Zhan H, Calder VL: Tear and mucus eotaxin-
1 and eotaxin-2 in allergic keratoconjunctivitis. Ophthalmology
2003, 110:487-492.
31. Fini ME, Girard MT, Matsubara M: Collagenolytic/gelatinolytic
enzymes in corneal wound healing. Acta Ophthalmol Suppl 1992,
202:26-33.
32. de Godoy LM, Olsen JV, de Souza GA, Li G, Mortensen P, Mann M:
Status of complete proteome analysis by mass spectrome-
try: SILAC labeled yeast as a model system. Genome Biol 2005,
7:R50.
33. van Haeringen NJ, Glasius E: Enzymes of energy-producing
metabolism in human tear fluid. Exp Eye Res 1974, 18:407-409.
34. Sack RA, Bogart BI, Beaton A, Sathe S, Lew G: Diurnal variations
in tear glycoproteins: evidence for an epithelial origin for the
major non-reducible > or = 450 kDa sialoglycoprotein(s).
Curr Eye Res 1997, 16:577-588.
35. Sathe S, Sakata M, Beaton AR, Sack RA: Identification, origins and
the diurnal role of the principal serine protease inhibitors in
human tear fluid. Curr Eye Res 1998, 17:348-362.
36. Barka T, Asbell PA, van der Noen H, Prasad A: Cystatins in human
tear fluid. Curr Eye Res 1991, 10:25-34.
37. Katunuma N, Shiota H, Le QT: Medical significance of cysteine
protease inhibitors in mammalian secretory fluids. J Med
Invest 2003, 50:154-161.
38. Azar DT, Hahn TW, Jain S, Yeh YC, Stetler-Stevensen WG: Matrix
metalloproteinases are expressed during wound healing
after excimer laser keratectomy. Cornea 1996, 15:18-24.
39. Rose RC, Richer SP, Bode AM: Ocular oxidants and antioxidant
protection. Proc Soc Exp Biol Med 1998, 217:397-407.
40. Augustin AJ, Spitznas M, Kaviani N, Meller D, Koch FH, Grus F, Gob-
bels MJ: Oxidative reactions in the tear fluid of patients suffer-
ing from dry eyes. Graefes Arch Clin Exp Ophthalmol 1995,
233:694-698.
41. Crouch RK, Goletz P, Snyder A, Coles WH: Antioxidant enzymes
in human tears. J Ocul Pharmacol 1991, 7:253-258.
42. Behndig A, Svensson B, Marklund SL, Karlsson K: Superoxide
dismutase isoenzymes in the human eye. Invest Ophthalmol Vis
Sci 1998, 39:471-475.
43. Rappsilber J, Ishihama Y, Mann M:
Stop and go extraction tips for
matrix-assisted laser desorption/ionization, nanoelectro-
spray, and LC/MS sample pretreatment in proteomics. Anal
Chem 2003, 75:663-670.
44. Olsen JV, Ong SE, Mann M: Trypsin cleaves exclusively C-termi-
nal to arginine and lysine residues. Mol Cell Proteomics 2004,
3:608-614.
45. Tear Fluid Database [ />