Báo cáo y học: "Codon usage patterns in Nematoda: analysis based on over 25 million codons in thirty-two species" pps
Bạn đang xem bản rút gọn của tài liệu. Xem và tải ngay bản đầy đủ của tài liệu tại đây (478.34 KB, 19 trang )
Genome Biology 2006, 7:R75
comment reviews reports deposited research refereed research interactions information
Open Access
2006Mitrevaet al.Volume 7, Issue 8, Article R75
Research
Codon usage patterns in Nematoda: analysis based on over 25
million codons in thirty-two species
Makedonka Mitreva
*
, MichaelCWendl
*
, John Martin
*
, Todd Wylie
*
,
Yong Yin
*
, Allan Larson
†
, John Parkinson
‡
, Robert H Waterston
§
and
James P McCarter
*¶
Addresses:
*
Genome Sequencing Center, Washington University School of Medicine, St Louis, Missouri 63108, USA.
†
Department of Biology,
Washington University, St. Louis, Missouri 63130, USA.
‡
Hospital for Sick Children, Toronto, and Departments of Biochemistry/Medical
Genetics and Microbiology, University of Toronto, M5G 1X8, Canada.
§
Department of Genome Sciences, University of Washington, Seattle,
Washington 98195, USA.
¶
Divergence Inc., St Louis, Missouri 63141, USA.
Correspondence: Makedonka Mitreva. Email:
© 2006 Mitreva et al.; licensee BioMed Central Ltd.
This is an open access article distributed under the terms of the Creative Commons Attribution License ( which
permits unrestricted use, distribution, and reproduction in any medium, provided the original work is properly cited.
Codon usage in worms<p>A codon usage table for 32 nematode species is presented and suggests that total genomic GC content drives codon usage.</p>
Abstract
Background: Codon usage has direct utility in molecular characterization of species and is also a
marker for molecular evolution. To understand codon usage within the diverse phylum Nematoda,
we analyzed a total of 265,494 expressed sequence tags (ESTs) from 30 nematode species. The full
genomes of Caenorhabditis elegans and C. briggsae were also examined. A total of 25,871,325 codons
were analyzed and a comprehensive codon usage table for all species was generated. This is the
first codon usage table available for 24 of these organisms.
Results: Codon usage similarity in Nematoda usually persists over the breadth of a genus but then
rapidly diminishes even within each clade. Globodera, Meloidogyne, Pristionchus, and Strongyloides have
the most highly derived patterns of codon usage. The major factor affecting differences in codon
usage between species is the coding sequence GC content, which varies in nematodes from 32%
to 51%. Coding GC content (measured as GC3) also explains much of the observed variation in
the effective number of codons (R = 0.70), which is a measure of codon bias, and it even accounts
for differences in amino acid frequency. Codon usage is also affected by neighboring nucleotides
(N1 context). Coding GC content correlates strongly with estimated noncoding genomic GC
content (R = 0.92). On examining abundant clusters in five species, candidate optimal codons were
identified that may be preferred in highly expressed transcripts.
Conclusion: Evolutionary models indicate that total genomic GC content, probably the product
of directional mutation pressure, drives codon usage rather than the converse, a conclusion that is
supported by examination of nematode genomes.
Published: 14 August 2006
Genome Biology 2006, 7:R75 (doi:10.1186/gb-2006-7-8-r75)
Received: 20 April 2006
Revised: 30 June 2006
Accepted: 14 August 2006
The electronic version of this article is the complete one and can be
found online at />R75.2 Genome Biology 2006, Volume 7, Issue 8, Article R75 Mitreva et al. />Genome Biology 2006, 7:R75
Background
Utilization of the degenerate triplet code for amino acid (AA)
translation is neither uniform nor random. In particular,
there are distinct patterns among different species and genes.
Such patterns can readily be characterized by codon usage,
namely the observed percentage occurrence with which each
codon is used to encode a given AA. This measure has direct
utility in molecular characterization of a species in that it ena-
bles efficient degenerate and nondegenerate primer design
for cross-species gene cloning, open reading frame determi-
nation, and optimal protein expression [1]. Such tools are
particularly important with respect to species for which lim-
ited molecular information exists. Codon usage also serves as
an indicator of molecular evolution [2]. Codon usage bias,
namely the degree to which usage departs from uniform use
of all available codons for an AA, can be influenced by a
number of evolutionary processes. The guanine and cytosine
(GC) versus adenine and thymine (AT) composition of the
species' genome, probably the product of directional muta-
tion pressure [3,4], is a key driver of both codon usage and AA
composition [5,6]. Other factors that influence codon usage
may include the relative abundance of isoaccepting tRNAs [7-
9], especially for highly expressed mRNAs that require trans-
lational efficiency [10,11], presence of mRNA secondary
structure [12,13], and facilitation of correct co-translational
protein folding [14]. Codon usage appears not to be optimized
to minimize the impact of errors in translation and replica-
tion [15].
Nematodes are a highly abundant and diverse group of organ-
isms that exploit niches from free-living microbivory to plant
and animal parasitism. Molecular phylogenies divide nema-
todes into five major named and numbered clades within
which parasitism has arisen multiple times [16]: Dorylaimia
(clade I), Enoplia (clade II), Spirurina (clade III), Tylenchina
(clade IV), and Rhabditina (clade V). Following the sequenc-
ing of the complete genome of the model nematode
Caenorhabditis elegans [17], we have begun to catalog the
molecular diversity of nematode genomes through the gener-
ation of over 250,000 expressed sequence tags (ESTs) from
more than 30 nematode species (including 28 parasites) in
four clades. Gene expression analyses for several medically
and economically important parasites such as filarial, hook-
worm, and root knot nematode species have been completed
[18-23] (for reviews [24,25]). Moreover, we recently con-
ducted a meta-analysis of partial genomes across the whole
phylum with a focus on the conservation and diversification
of encoded protein families [26]. Project information is main-
tained on several online resources [27-30].
Now, in the most extensive such study yet performed for any
phylum, we extend the above analyses with a comprehensive
survey of observed codon usage and bias based on nearly 26
million codons in 32 species of the Nematoda. Because of its
completed genome, C. elegans has been the primary species
utilized in nematode codon usage studies [31-34]. Our find-
ings provide more complete information for Caenorhabditis
based on all 41,782 currently predicted proteins in C. elegans
and C. briggsae [35]. Studies for other nematode species have
been more limited. Codon usage has been tabulated for a
number of parasitic nematodes including filarial species Bru-
gia malayi, Onchocerca volvulus, Wucheria bancrofti, Acan-
thocheilonema viteae, Dirofilaria immitis [36-39],
Strongyloides stercoralis [40], Ascaris suum
[41], Ancylos-
toma caninum, and Necator americanus [42]. Although
Fadiel and coworkers [39] used up to 60 genes per species,
sample sizes in the other studies were quite small, typically
fewer than 10 representative genes and 5,000 codons per spe-
cies. In the present study we used an average of 2,350 genes
and 270,000 codons per species for the 30 non-Caenorhab-
ditis species. Our results provide the first codon usage tables
for 24 of these organisms. Web available automated codon
usage databases compiled from GenBank [43] lack almost all
of this information because they rely only on full-length pro-
tein coding gene sequence submissions rather than the EST
data used here.
In analyzing codon distribution in Nematoda, we describe
how average usage varies between species and across the phy-
lum. For instance, it has been shown that there is a level of
conservation in codon distribution between 'closely' related
nematodes such as Brugia malayi and B. pahangi [37] and
Brugia and Onchocerca [38]. These relationships do not
appear to extend over greater evolutionary distances, for
instance between Onchocerca and Caenorhabditis [36]. The
evolutionary distance at which conservation of codon usage
diminishes has not previously been established [32]. Here we
show that codon usage similarity in Nematoda is a relatively
short-range phenomenon, generally persisting over the
breadth of a genus but then rapidly diminishing within each
clade. We also show that the major factor affecting differences
in mean codon usage between distantly related species is the
coding sequence GC as compared with AT content. GC con-
tent also explains much of the observed variation in the effec-
tive number of codons, a measure of codon bias, and even
differences in AA frequency.
Results
Determination of codon usage patterns and amino acid
composition
Extensive nucleotide sequence data are now available for
many nematode species, largely because of recent progress
using genomic approaches [25,44]. To obtain a better under-
standing of codon usage and AA composition within the phy-
lum Nematoda, we analyzed a total of 265,494 EST sequences
originating from 30 nematode species. The ESTs define
93,645 clusters or putative genes, with 208-9,511 clusters per
species (Table 1) [26]. Table 1 also provides two letter codes
for the nematode species used throughout the remainder of
the report. We used prot4EST, a translation prediction pipe-
line optimized for EST datasets [45], to generate protein
Genome Biology 2006, Volume 7, Issue 8, Article R75 Mitreva et al. R75.3
comment reviews reports refereed researchdeposited research interactions information
Genome Biology 2006, 7:R75
predictions. To reduce noise derived from poor translations,
our analysis considered only the longest open reading frame
(ORF) translations with strong supporting evidence in the
form of similarity to known or predicted proteins (BLASTX
cutoff 1 × e
-8
) and retained only the polypeptide aligned por-
tion of the nucleotide sequence. About 75% of the clusters met
these criteria, yielding 8,080,057 codons originating from
species other than Caenorhabditis, and 25,871,325 total
codons from all 32 species including available predictions
from C. elegans and C. briggsae. The 18 AA residues with
redundant codons gave a total of (18) × C
32,2
= 496 compari-
sons of codon usage between species. Comprehensive tables
of AA composition (Tables 2 and 3) and codon usage (Table 4)
for all 32 Nematoda species studied are provided. Below we
use these tables to examine, first, variation in AA composition
and its relationship to GC content and, second, codon usage
and its relationship to GC content.
To examine these variables independent of species related-
ness, correlations were calculated using phylogenetically
independent contrasts (see Materials and methods, below).
The variances of the contrasts were computed for each char-
acter as a measure of the variance accumulating per unit
branch length. The branch lengths were estimated from the
maximum likelihood phylogeny assuming a molecular clock
(Figure 1); by this criterion, the tips of the tree are all equidis-
tant in branch length from its root. Computed contrasts were
plotted in all figures representing pair-wise comparisons, and
the correlation coefficients were calculated from the paired
contrasts. This method is robust to changes in molecular
Table 1
Summary of sequences used by nematode species
Clade Code Species ESTs Total number of
clusters
Clusters or genes used Codons GC content (%)
n %
V NA Necator americanus
a
4,766 2,294 1,784 78 192,756 46
AC Ancylostoma caninum
b
9,079 4,203 3,207 76 305,036 48
AY Ancylostoma ceylanicum
b
10,544 3,485 2,814 81 387,372 49
NB Nippostrongylus
brasiliensis
b
1,234 742 630 85 75,934 50
HC Haemonchus contortus
b
17,268 4,146 4,102 99 584,513 47
OO Ostertagia ostertagi
b
6,670 2,355 1,961 83 222,616 48
TD Teladorsagia circumcincta
b
4,313 1,655 1,616 98 194,351 48
CE Caenorhabditis elegans
c
- - 22,254 100 9,784,215 43
CB Caenorhabditis briggsae
c
- - 19,528 100 8,007,053 44
PP Pristionchus pacificus
c
8,672 3,690 2,597 70 297,605 51
IVa SS Strongyloides stercoralis
a
11,236 3,635 2,803 77 367,308 33
SR Strongyloides ratti
b
9,932 3,264 2,682 82 320,874 32
PT Parastrongyloides
trichosuri
b
7,712 3,086 2,457 80 284,785 40
IVb PE Pratylenchus penetrans
d
1,908 408 338 83 45,802 46
GP Globodera pallida
d
1,317 977 479 49 65,699 51
GR Globodera rostochiensis
d
5,905 2,851 2,192 77 290,614 51
HG Heterodera glycines
d
18,524 7,198 5,564 77 742,990 50
MI Meloidogyne incognita
d
12,394 4,408 3,214 73 366,435 37
MJ Meloidogyne javanica
d
5,282 2,609 2,086 80 203,135 36
MA Meloidogyne arenaria
d
3,251 1,892 1,483 78 176,816 36
MH Meloidogyne hapla
d
13,462 4,479 3,507 78 407,985 36
MC Meloidogyne chitwoodi
d
7,036 2,409 1,906 79 205,612 35
ZP Zeldia punctata
c
388 208 102 49 16,723 43
III AS Ascaris suum
b
38,944 8,482 5,830 69 646,740 46
AL Ascaris lumbricoides
a
1,822 853 508 60 42,919 47
TC Toxocara canis
b
4,206 1,447 866 60 103,065 48
BM Brugia malayi
a
25,067 9,511 6,483 68 561,296 39
DI Dirofiliaria immitis
b
3,585 1,747 1,380 79 126,880 38
OV Onchocerca volvulus
a
14,922 5,097 2,914 57 299,336 40
ITSTrichinella spiralis
a
10,384 3,680 2,693 73 290,794 41
TM Trichuris muris
b
2,713 1,577 1,179 75 147,995 49
TV Trichuris vulpis
b
2,958 1,257 1,000 80 106,071 48
a
Human parasite,
b
animal parasite,
c
free-living, and
d
plant parasite. EST, expressed sequence tag.
R75.4 Genome Biology 2006, Volume 7, Issue 8, Article R75 Mitreva et al. />Genome Biology 2006, 7:R75
clock assumptions. (Trees calculated without the assumption
of a molecular clock are similar in topology but differ in
rooting, and branch lengths vary according to amount of base
substitution in the 18S rRNA; the clock-based tree provides
branch lengths that should estimate most closely the relative
durations of branches in evolutionary time. Because inde-
pendent contrasts are influenced mainly by relative branch
lengths, our results should be robust to alternative place-
ments of the root.)
Amino acid composition of nematode proteins and
relationship to GC content
AA composition of predicted proteins in nematodes varies
among species within a narrow window and is similar to that
observed in other organisms (Tables 2 and 3). (Standard devi-
ations in AA usage among nematodes range from 5% to 15%
of mean usage, and mean nematode AA usage differs from the
mean of four representative organisms by an average of 8%.)
Across nematodes, Leu is the most common AA (8.8% of all
codons) and Trp the least common (1.1%). Eight AAs contrib-
ute an average of more than 6% each to AA content (Ile, Gly,
Val, Glu, Ala, Lys, Ser, and Leu); these AAs are also among the
most common in the proteomes of other representative spe-
cies, including humans (Table 3). As in other taxa [46],
nematodes show a correlation between AA usage and the
degree of codon degeneracy (R = 0.72).
In nematodes, coding sequence GC content, derived from our
EST clusters, varies from 32% to 51% (Table 1) among species,
with a mean of 43.6 ± 5.9%. The distribution is biphasic, with
a peak at 36% GC and a second peak at 48%. Strongyloides
(SS and SR), Meloidogyne (MI, MJ, and so on), and filarial
Table 2
Amino acid composition (%) of translations by nematode species
Clade Species Amino acid
ACDE F GHI K L MNP QR S T V WY
Ala Cys Asp Glu Phe Gly His Ile Lys Leu Met Asn Pro Gln Arg Ser Thr Val Typ Tyr
V NA 6.9 2.4 5.2 6.2 4.7 6.3 2.5 5.5 6.5 8.6 2.6 4.2 5.0 3.7 6.2 7.2 5.3 6.5 1.2 3.3
AC 7.02.45.06.04.75.92.75.66.38.92.84.24.63.76.27.45.46.61.33.3
AY 7.62.25.56.64.26.52.55.26.48.52.54.05.13.86.17.15.36.71.23.0
NB 7.82.25.46.34.06.92.45.07.28.12.64.04.93.56.47.05.26.91.13.1
HC 7.42.35.56.54.36.62.55.47.08.42.54.14.93.76.06.45.26.81.23.4
OO 7.22.35.36.34.46.72.65.36.78.42.64.05.23.86.16.85.36.71.13.1
TD 7.52.75.26.14.36.72.65.06.68.42.74.25.13.85.87.15.36.51.23.3
CE 6.32.05.36.54.85.42.36.16.48.62.64.94.94.25.28.15.96.21.13.1
CB 6.32.05.36.84.75.42.36.06.48.52.64.85.04.25.48.05.86.11.13.1
PP 7.41.95.46.94.06.62.55.36.68.42.63.95.13.46.47.65.46.41.23.0
IVa SS 5.5 1.9 5.7 7.0 4.3 6.0 2.1 7.1 8.0 8.3 2.3 6.0 4.5 3.7 4.6 7.2 5.5 5.8 1.0 3.5
SR 5.42.05.46.54.75.92.17.48.18.62.46.24.33.64.37.25.45.81.03.8
PT 6.32.05.36.34.66.32.46.68.18.32.45.34.33.54.96.95.56.11.03.7
IVb PE 6.9 2.0 5.3 6.7 4.3 7.0 2.4 5.8 7.6 8.4 2.6 4.5 4.5 4.5 6.2 6.4 4.9 5.9 1.2 2.9
GP 6.82.44.55.45.67.22.44.97.19.12.33.95.83.86.77.14.86.01.22.9
GR 7.42.14.96.04.86.52.65.25.99.32.54.35.04.46.57.25.26.31.22.7
HG 7.32.24.96.25.16.32.65.26.09.22.44.55.04.56.37.35.16.21.22.5
MI 5.72.04.86.75.15.62.26.57.39.42.35.64.54.65.37.55.25.41.13.0
MJ 5.52.14.86.65.55.42.26.97.89.62.45.64.24.25.47.05.15.41.13.3
MA 5.72.05.06.95.35.72.26.97.39.72.35.54.14.35.27.05.05.61.13.2
MH 5.62.04.96.85.35.62.27.07.39.52.35.84.34.35.27.34.95.41.23.2
MC 5.32.34.86.45.55.52.37.47.49.72.36.04.04.34.97.45.05.21.13.3
ZP 7.61.55.26.24.27.12.56.17.98.41.84.74.63.86.05.45.56.61.13.7
III AS 7.0 2.5 4.9 6.1 4.6 5.8 2.5 6.0 6.3 8.7 2.6 4.5 4.8 3.6 6.3 7.5 5.3 6.6 1.2 3.3
AL 7.32.64.65.84.96.12.56.06.48.32.54.35.33.56.27.45.26.51.23.4
TC 7.32.85.06.04.26.82.65.37.38.02.44.15.43.56.26.75.66.41.23.2
BM 5.62.54.65.65.45.02.67.16.89.62.85.04.13.85.67.85.35.91.13.6
DI 5.62.44.96.05.24.72.77.57.09.52.75.23.93.85.97.55.15.81.13.8
OV 6.02.25.06.14.95.62.56.97.18.92.74.94.53.95.97.35.25.71.23.5
I TS 6.2 2.6 5.0 6.2 5.1 5.1 2.5 6.1 6.6 9.5 2.6 4.9 4.1 3.9 5.6 7.6 5.1 6.5 1.2 3.4
TM 7.13.05.06.04.56.52.55.06.38.92.64.05.03.86.27.45.26.71.23.2
TV 7.03.04.96.14.55.82.55.16.49.02.64.24.83.86.17.55.56.81.33.2
Definitions of species two letter codes are provided in Table 1.
Genome Biology 2006, Volume 7, Issue 8, Article R75 Mitreva et al. R75.5
comment reviews reports refereed researchdeposited research interactions information
Genome Biology 2006, 7:R75
parasites (BM, DI, and OV) are the most AT rich (low GC);
and NB, PP, and cyst nematodes (GP, GR, and HG) are the
most GC rich (approximately 50%). The variation observed in
AA composition among species shows a clear relationship to
the species' coding sequence GC content. The frequency of
AAs encoded by WWN codons (AA, AT, TA, or TT in the first
and second nucleotide positions; Asn, Ile, Lys, Try, Phe, and
Met) decreases with increasing coding sequence GC content
(Figure 2a), whereas the proportion of AAs encoded by SSN
codons (GG, GC, CG, and CC; Ala, Arg, Pro, and Gly) increases
with higher coding sequence GC content (Figure 2b), and
these relationships remain even after removing the effect of
evolutionary relationships using phylogenetically independ-
ent contrasts. Among AAs, the most uniform and precipitous
decrease with increasing GC content was seen with Ile and
Tyr whereas the most uniform and rapid increase with higher
GC content was seen with Ala and Arg. The trend is less pro-
nounced for other AAs (flatter slope, lower R value). Thr,
encoded by four GC/AT 'balanced' codons (ACN), exhibits no
change in its frequency with changing GC content (data not
shown).
Base composition by codon position in nematode
transcripts and relationship to GC content
Codon usage in nematode species was examined by several
methods, including comparison of base usage by position (1-
3) over all AAs and comparison of codon usage within each
AA. Over all AAs, purine (AG) and pyrimidine (TC) usage in
positions 1, 2, and 3 is remarkably uniform between species,
favoring purines in position 1 (AG 59.6 ± 1.5%), near equal
usage in position 2 (AG 50.0 ± 0.8%), and pyrimidines in
position 3 (AG 47.9 ± 1.5%; Additional data file 1). Similar val-
ues were observed in Schistosoma mansoni (AG 61%, 53%,
and 48% in positions 1, 2, and 3, respectively) [1]. GC versus
AT usage also varies by position but with much greater vari-
ance, with near equal usage in position 1 (50.3% GC) and
lower GC usage in positions 2 and 3 (39.1 and 41.4%, respec-
tively), mainly due to greater use of G in position 1 and T in
positions 2 and 3 [4].
Additional file 1Click here for file
The variation observed in GC usage by codon position among
species exhibits a clear relationship to the species' overall
coding sequence GC content. Not surprisingly, both GC1 and
GC2 composition increase with higher coding sequence GC3
content (Figure 3). Specifically, species with high AT content
like root-knot Meloidogyne species (MI, MJ, and so on) and
filarial worms (BM, DI, and OV) [38,39] are biased toward
codons terminating in A or T, whereas species with higher GC
content such as NB, PP, cyst nematodes, and whipworms (TM
and TV) prefer codons ending with G or C. Differences in cal-
culated GC composition by codon position (1-3) between
species are determined both by the species' AA usage (as
described above) and the codons used for each AA. For exam-
ple, Cys was encoded by TGT
as much as 85% of the time for
the AT-rich Strongyloides genomes, whereas TGC
was used
up to 60% of the time in GC-rich genomes such as NB, PP, and
HG. To compare codon usage more systematically for individ-
ual AAs between species, we employed a statistical approach
(described in Materials and Methods and in the following
section).
Codon usage patterns and relationships to sampling
method, nematode phylogeny, and GC content
Similarity in codon usage was quantified and reported as D
100
values for each species and AA compared [47,48] (matrix of
D
100
values for each species and AA compared is available in
Additional data file 2).
Additional file 2Click here for file
Because analyses of all but two of the nematode species were
based on EST-derived partial genomes [26], comparisons
were performed to estimate the differences in codon usage
pattern that could be expected using EST collections versus
gene predictions derived from a fully assembled and anno-
tated genome. Using C. elegans, parallel analyses were per-
formed using either all 22,254 predicted gene products or two
EST datasets (CE-A and CE-B) each comprising 10,000 ESTs.
Clustering and peptide predictions were performed using the
same algorithms as for the other 30 species. The average D
100
Table 3
Amino acid composition (%) of translations from Nematoda and
four reference species
Amino acid Nematode HS DM SC EC
Mean SD
A Ala 6.6 0.8 7.1 7.5 5.6 9.2
C Cys 2.3 0.3 2.3 1.9 1.3 1.1
D Asp 5.10.34.85.25.85.2
E Glu 6.3 0.4 6.9 6.4 6.5 5.7
F Phe 4.70.53.83.54.43.8
G Gly 6.1 0.7 6.6 6.3 5.1 7.3
H His 2.4 0.2 2.6 2.7 2.2 2.2
I Ile 6.0 0.8 4.4 4.9 6.5 6.0
K Lys 6.90.65.65.67.34.8
L Leu 8.8 0.5 10.0 9.0 9.5 10.1
M Met 2.50.22.22.42.12.6
N Asn 4.70.73.64.76.14.3
P Pro 4.70.56.15.54.44.2
Q Gln 3.9 0.3 4.7 5.2 4.0 4.3
R Arg 5.80.65.75.54.45.5
S Ser 7.20.58.18.38.96.4
T Thr 5.30.25.35.75.95.7
V Val 6.20.56.15.95.67.0
W Typ 1.2 0.1 1.3 1.0 1.0 1.4
Y Tyr 3.2 0.3 2.8 2.9 3.4 3.0
DM, Drosophila melanogaster; EC, Escherichia coli; HS, Homo sapiens; SC,
Saccharomyces cerevisiae.
R75.6 Genome Biology 2006, Volume 7, Issue 8, Article R75 Mitreva et al. />Genome Biology 2006, 7:R75
Table 4
Codon usage of translations by nematode species
Species (codons [n])
AA Codon NA
(192,75
6)
AC
(305,03
6)
AY
(387,37
2)
NB
(75,934)
HC
(584,51
3)
OO
(222,61
6)
TD
(194,35
1)
CE
(9,784,2
15)
CB
(8,007,0
53)
PP
(297,60
5)
SS
(367,30
8)
SR
(320,87
5)
PT
(284,78
5)
PE
(45,802)
GP
(65,699)
GR
(290,61
4)
A Ala GCA 28.8 25.0 23.9 19.7 26.0 24.9 25.4 31.5 26.1 20.7 33.2 31.4 24.2 31.4 20.4 22.1
A Ala GCC 18.5 23.0 24.2 30.0 22.8 23.4 24.0 19.9 22.7 32.4 9.1 9.7 23.4 29.5 31.9 32.6
A Ala GCG 16.0 17.7 17.3 17.6 13.6 16.3 16.6 13.1 15.2 16.7 2.0 1.6 7.1 13.2 26.7 27.3
A Ala GCT 36.7 34.2 34.6 32.7 37.6 35.4 34.0 35.5 35.9 30.2 55.7 57.4 45.3 25.9 20.9 18.1
Codons per AA 13,237 21,208 29,600 5,916 43,104 16,126 14,513 618,499 502,187 22,118 20,285 17,201 17,930 3,173 4,494 21,522
C Cys TGT 54.0 46.9 44.4 39.5 46.7 49.0 44.3 55.3 56.9 39.2 84.4 85.3 63.9 42.6 42.1 43.7
C Cys TGC 46.0 53.1 55.6 60.5 53.3 51.0 55.7 44.7 43.1 60.8 15.6 14.7 36.1 57.4 57.9 56.3
Codons per AA 4,538 7,295 8,510 1,702 13,213 5,109 5,154 196,660 159,737 5,789 6,996 6,285 5,682 925 1,584 6,219
D Asp GAC 40.5 46.8 47.4 48.5 40.8 45.1 45.4 32.4 35.6 43.0 13.5 12.7 29.1 39.1 61.8 63.8
D Asp GAT 59.5 53.2 52.6 51.5 59.2 54.9 54.6 67.6 64.4 57.0 86.5 87.3 70.9 60.9 38.2 36.2
Codons per AA 9,934 15,229 21,124 4,117 32,318 11,797 10,014 520,465 423,125 16,048 20,825 17476 15,182 2,448 2,930 14,122
E Glu GAA 58.8 52.0 49.5 46.3 57.9 56.8 55.3 62.5 59.1 37.7 80.4 84.6 65.3 60.4 50.2 49.7
E Glu GAG 41.2 48.0 50.5 53.7 42.1 43.2 44.7 37.5 40.9 62.3 19.6 15.4 34.7 39.6 49.8 50.3
Codons per AA 11,865 18,355 25,474 4,774 38,175 14,008 11,873 638,649 543,774 20,537 25,838 20,812 18,057 3,075 3,570 17,574
F Phe TTC 56.4 61.0 67.7 72.3 63.7 63.5 63.9 50.5 58.6 81.9 17.8 17.7 41.5 52.8 43.3 50.0
F Phe TTT 43.6 39.0 32.3 27.7 36.3 36.5 36.1 49.5 41.4 18.1 82.2 82.3 58.5 47.2 56.7 50.0
Codons per AA 8,977 14,376 16,102 3,031 24,881 9,726 8,311 464,354 373,697 12,020 15,752 15,138 13,032 1,966 3,650 14,036
G Gly GGA 42.7 39.5 39.7 41.4 40.4 40.0 40.9 58.7 60.7 55.6 50.1 51.2 52.3 35.1 26.9 24.8
G Gly GGC 17.8 23.3 23.5 24.1 20.9 22.5 22.5 12.5 12.1 20.6 4.3 3.1 10.5 29.7 34.9 41.8
G Gly GGG 10.1 10.0 9.5 5.9 9.7 8.8 8.4 8.3 8.4 6.9 5.9 3.9 6.8 11.7 20.6 17.5
G Gly GGT 29.4 27.2 27.3 28.6 29.0 28.8 28.2 20.5 18.8 16.9 39.8 41.8 30.4 23.5 17.6 15.9
Codons per AA 12,228 18,073 25,292 5,264 38,407 14,914 13,068 524,163 433,832 19,759 22,207 18,910 18,057 3,189 4,741 18,802
H His CAC 43.1 48.8 51.9 55.5 43.5 46.8 45.9 39.5 39.7 53.5 15.7 16.2 35.7 37.2 50.5 52.6
H His CAT 56.9 51.2 48.1 44.5 56.5 53.2 54.1 60.5 60.3 46.5 84.3 83.8 64.3 62.8 49.5 47.4
Codons per AA 4,853 8,224 9,726 1,835 14,460 5,779 4,965 226,949 183,283 7,363 7,664 6,679 6,789 1,086 1,589 7,500
I Ile ATA 21.9 20.1 16.9 14.4 19.6 19.5 18.5 15.6 13.4 10.5 30.2 30.3 24.3 16.0 15.0 11.5
I Ile ATC 35.1 41.2 46.0 49.6 39.9 41.4 42.2 31.2 39.2 57.4 9.1 9.2 27.0 33.1 36.9 37.1
I Ile ATT 43.0 38.7 37.2 36.0 40.5 39.2 39.3 53.3 47.4 32.2 60.7 60.6 48.7 50.9 48.1 51.4
Codons per AA 10,621 17,171 20,026 3,808 31,585 11,807 9,787 596,151 477,819 15,856 26,077 23,850 18,935 2,659 3,216 15,144
K Lys AAA 50.2 44.1 39.5 36.1 47.5 48.5 45.0 59.3 57.9 24.2 80.4 82.4 56.7 55.5 58.9 53.3
K Lys AAG 49.8 55.9 60.5 63.9 52.5 51.5 55.0 40.7 42.1 75.8 19.6 17.6 43.3 44.5 41.1 46.7
Codons per AA 12,606 19,080 24,922 5,451 41,187 14,926 12,874 622,428 511,710 19,693 29,246 25,932 23,023 3,465 4,650 17,224
L Leu CTA 11.8 10.7 9.7 9.0 10.2 10.9 9.8 9.2 9.9 7.3 6.2 5.5 5.5 7.4 4.4 3.6
L Leu CTC 17.2 19.5 21.1 22.8 18.6 20.0 20.7 17.3 18.8 36.9 3.4 3.5 15.2 15.0 18.4 16.0
L Leu CTG 16.1 21.6 23.5 24.6 18.8 19.5 20.5 14.1 16.0 20.1 1.7 1.5 9.3 17.4 21.8 25.2
L Leu CTT 23.1 19.6 20.2 18.9 22.7 21.2 21.8 24.6 21.1 18.4 30.9 30.5 24.8 20.6 19.3 17.4
L Leu TTA 12.5 9.6 7.2 6.2 9.9 8.8 7.7 11.4 9.0 4.8 45.8 46.6 29.4 11.3 8.6 6.1
L Leu TTG 19.3 19.0 18.3 18.4 19.9 19.7 19.5 23.3 25.2 12.5 12.0 12.3 15.8 28.3 27.5 31.7
Codons per AA 16,664 27,074 32,761 6,176 49,075 18,693 16,399 841,631 680,113 25,061 30,422 27,556 23,764 3,828 6,003 27,096
M Met ATG 100.0 100.0 100.0 100.0 100.0 100.0 100.0 100.0 100.0 100.0 100.0 100.0 100.0 100.0 100.0 100.0
Codons per AA 5,102 8,525 9,696 1,943 14,531 5,794 5,165 255,677 209,897 7,598 8,490 7,569 6,725 1,189 1,489 7,131
N Asn AAC 48.0 52.3 53.9 58.0 46.9 48.9 50.7 37.8 42.2 49.7 13.3 13.7 31.5 35.9 53.0 53.7
N Asn AAT 52.0 47.7 46.1 42.0 53.1 51.1 49.3 62.2 57.8 50.3 86.7 86.3 68.5 64.1 47.0 46.3
Genome Biology 2006, Volume 7, Issue 8, Article R75 Mitreva et al. R75.7
comment reviews reports refereed researchdeposited research interactions information
Genome Biology 2006, 7:R75
Codons per AA 8,173 12,784 15,647 3,003 24,165 9,013 8,111 477,965 383,675 11,638 21,928 19,815 15,025 2,073 2,589 12,490
P Pro CCA 35.0 35.0 33.6 31.2 34.6 35.7 35.1 52.8 53.1 15.3 66.2 66.5 48.2 44.0 20.0 22.5
P Pro CCC 14.0 15.9 16.5 16.7 15.8 15.0 14.5 9.1 10.3 38.3 3.7 3.2 17.3 16.2 28.1 23.4
P Pro CCG 20.0 21.8 23.1 28.4 19.5 20.9 22.0 19.8 19.1 17.7 2.4 2.1 8.5 19.9 33.0 39.1
P Pro CCT 31.0 27.3 26.8 23.7 30.0 28.5 28.4 18.2 17.5 28.6 27.7 28.2 26.0 19.9 18.9 15.1
Codons per AA 9,552 14,020 19,732 3,711 28,449 11,512 9,972 481,470 403,504 15,120 16,634 13,870 12,379 2,068 3,838 14,519
Q Gln CAA 56.3 48.9 45.4 42.6 52.6 52.7 52.3 65.6 63.3 37.3 89.1 88.4 69.6 62.9 52.8 52.7
Q Gln CAG 43.7 51.1 54.6 57.4 47.4 47.3 47.7 34.4 36.7 62.7 10.9 11.6 30.4 37.1 47.2 47.3
Codons per AA 7,217 11,341 14,843 2,691 21,339 8,424 7,339 405,452 332,326 10,116 13,651 11,696 10,098 2,058 2,515 12,900
R Arg AGA 20.8 18.7 17.1 19.3 18.6 18.4 19.8 29.4 31.8 30.6 50.6 52.2 39.1 13.9 12.8 10.7
R Arg CGA 23.0 21.9 21.5 20.7 21.3 23.2 21.4 22.9 22.0 16.4 6.8 6.3 8.3 20.4 14.3 17.9
R Arg AGG 11.7 13.3 13.8 10.5 12.5 12.0 12.4 7.4 8.1 9.8 9.8 6.9 9.3 10.2 10.3 8.9
R Arg CGC 13.9 16.3 17.3 18.2 14.0 15.0 14.7 9.9 10.0 16.2 3.3 3.5 12.3 19.9 26.3 25.1
R Arg CGG 8.0 9.1 8.9 7.9 8.5 9.0 8.4 8.9 8.3 5.9 1.7 1.3 3.5 10.9 17.2 17.3
R Arg CGT 22.6 20.7 21.3 23.5 25.0 22.4 23.2 21.6 19.8 21.1 27.8 29.8 27.5 24.7 19.1 20.2
Codons per AA 11,856 19,042 23,683 4,857 35,121 13,588 11,363 511,021 432,791 19,008 17,062 13,744 14,051 2,840 4,378 18,826
S Ser AGC 14.0 16.4 16.6 18.0 14.6 14.7 16.2 10.3 9.8 9.8 3.1 2.6 7.7 15.5 17.8 17.5
S Ser TCA 21.3 19.6 18.1 16.4 21.1 21.4 19.7 25.5 20.4 14.8 36.6 37.6 27.8 24.1 13.5 13.8
S Ser TCC 13.6 15.6 16.2 16.3 14.0 14.6 14.7 13.2 16.0 20.7 5.2 4.1 13.2 16.9 20.7 21.0
S Ser AGT 14.8 13.4 12.6 11.8 14.3 13.4 14.0 15.0 14.4 10.4 23.8 21.7 17.5 12.9 11.6 11.9
S Ser TCG 16.6 16.8 18.6 22.2 16.9 18.2 17.6 15.1 16.7 21.4 2.2 2.0 8.0 14.3 20.3 22.7
S Ser TCT 19.7 18.1 18.0 15.5 19.1 17.7 17.8 20.8 22.7 22.9 29.2 31.9 25.8 16.1 16.1 13.1
Codons per AA 13,892 22,627 27,519 5,278 37,542 15,230 13,768 787,872 641,565 22,591 26,438 22,992 19,598 2,921 4,637 21,063
T Thr ACA 30.6 28.0 24.8 21.6 27.1 28.4 28.3 34.2 29.6 16.3 51.5 50.9 38.6 35.0 21.9 22.6
T Thr ACC 20.4 22.9 25.5 30.8 22.8 23.2 22.4 17.9 21.8 25.7 7.6 7.5 20.8 22.9 27.4 26.8
T Thr ACG 18.9 21.8 22.6 22.6 19.9 21.5 22.1 15.2 17.2 24.9 3.9 3.2 9.2 16.3 27.9 28.8
T Thr ACT 30.1 27.3 27.2 25.0 30.2 26.9 27.2 32.7 31.4 33.2 36.9 38.3 31.4 25.7 22.7 21.7
Codons per AA 10,197 16,333 20,529 3,959 30,547 11,909 10,364 571,606 461,093 15,952 20,070 17,360 15,532 2,255 3,164 14,970
V Val GTA 18.7 16.9 14.6 12.9 18.1 16.2 15.8 15.9 13.7 11.9 26.5 26.5 19.0 12.8 8.3 7.3
V Val GTC 21.2 24.7 25.1 28.6 24.9 24.3 25.4 21.8 26.3 34.1 10.0 8.5 20.3 24.5 26.3 28.2
V Val GTG 26.8 29.3 30.8 31.8 26.3 29.5 29.1 23.4 25.5 30.6 5.1 3.8 15.8 28.0 37.3 39.2
V Val GTT 33.2 29.1 29.5 26.7 30.8 30.0 29.7 38.9 34.6 23.5 58.4 61.2 44.9 34.7 28.1 25.3
Codons per AA 12,606 20,139 25,863 5,243 39,506 14,814 12,547 605,528 491,117 18,939 21,158 18,523 17,487 2,707 3,946 18,216
W Typ TGG 100.0 100.0 100.0 100.0 100.0 100.0 100.0 100.0 100.0 100.0 100.0 100.0 100.0 100.0 100.0 100.0
Codons per AA 2,289 3,952 4,517 833 7,229 2,494 2,424 107,642 90,785 3,498 3,508 3,090 2,830 531 791 3,496
Y Tyr TAC 51.6 56.5 59.8 62.8 52.7 54.6 55.7 44.0 47.1 64.9 18.5 18.0 36.6 39.4 57.1 61.6
Y Tyr TAT 48.4 43.5 40.2 37.2 47.3 45.4 44.3 56.0 52.9 35.1 81.5 82.0 63.4 60.6 42.9 38.4
Codons per AA 6,322 10,100 11,774 2,335 19,614 6,915 6,328 307,728 250,436 8,842 12,998 12,250 10,470 1,346 1,894 7,748
Species (codons [n])
AA Codon HG
(742,99
0)
Mi
(366,43
5)
Mj
(203,13
5)
Ma
(176,81
6)
Mh
(407,98
5)
Mc
(205,61
2)
ZP
(16,723)
AS
(646,74
0)
AL
(42,919)
TC
(103,06
5)
BM
(561,29
6)
DI
(126,88
0)
OV
(299,33
6)
TS
(290,79
4)
TM
(147,99
5)
TV
(106,07
1)
A Ala GCA 22.3 32.2 32.3 32.8 34.9 36.9 19.5 32.7 31.7 29.3 39.1 40.0 37.5 31.7 24.1 26.7
A Ala GCC 33.0 13.3 12.8 11.6 11.4 11.2 24.9 18.1 20.9 20.6 12.3 11.7 13.8 16.4 27.7 25.9
A Ala GCG 25.9 8.1 8.0 7.0 7.3 6.8 7.4 22.8 23.9 23.7 12.3 12.8 14.3 18.4 22.7 22.1
A Ala GCT 18.7 46.3 46.9 48.6 46.4 45.2 48.2 26.4 23.5 26.4 36.3 35.5 34.4 33.5 25.5 25.3
Codons per AA 54,049 21,050 11,150 10,069 22,749 10,844 1,264 45,388 3,142 7,531 31,439 7,087 17,813 18,017 10,515 7,439.0
C Cys TGT 44.5 71.4 72.8 73.7 74.3 72.9 56.3 48.8 48.8 42.8 61.2 62.9 60.0 51.8 31.8 33.8
Table 4 (Continued)
Codon usage of translations by nematode species
R75.8 Genome Biology 2006, Volume 7, Issue 8, Article R75 Mitreva et al. />Genome Biology 2006, 7:R75
C Cys TGC 55.5 28.6 27.2 26.3 25.7 27.1 43.8 51.2 51.3 57.2 38.8 37.1 40.0 48.2 68.2 66.2
Codons per AA 16,227 7,328 4,217 3,502 8,174 4,656 256 16,446 1,120 2,901 14,026 2,998 6,689 7,559 4,428 3,174.0
D Asp GAC 65.5 26.5 27.1 24.8 24.2 22.2 32.1 35.2 41.0 40.5 24.0 20.5 20.6 33.2 56.3 56.1
D Asp GAT 34.5 73.5 72.9 75.2 75.8 77.8 67.9 64.8 59.0 59.5 76.0 79.5 79.4 66.8 43.7 43.9
Codons per AA 36,495 17,627 9,747 8,876 19,863 9,894 873 31,446 1,970 5,114 26,014 6,223 15,056 14,599 7,378 5,214.0
E Glu GAA 55.7 75.3 74.6 76.2 76.6 78.4 77.9 56.5 55.4 52.8 73.9 77.0 77.1 79.0 61.4 61.8
E Glu GAG 44.3 24.7 25.4 23.8 23.4 21.6 22.1 43.5 44.6 47.2 26.1 23.0 22.9 21.0 38.6 38.2
Codons per AA 45,714 24,640 13,289 12,192 27,589 13,117 1,041 39,335 2,469 6,214 31,136 7,577 18,333 18,001 8,907 6,459.0
F Phe TTC 48.9 24.3 21.8 20.9 21.3 18.1 55.3 54.5 56.6 60.0 35.0 37.3 36.9 34.3 53.0 52.6
F Phe TTT 51.1 75.7 78.2 79.1 78.7 81.9 44.7 45.5 43.4 40.0 65.0 62.7 63.1 65.7 47.0 47.4
Codons per AA 37,855 18,687 11,103 9,412 21,612 11,345 704 29,754 2,102 4,296 30,333 6,568 14,714 14,907 6,593 4,737.0
G Gly GGA 25.5 44.5 44.7 45.8 45.8 46.2 33.3 31.2 31.0 32.5 32.7 35.4 35.0 31.1 29.9 31.7
G Gly GGC 41.8 14.8 14.9 13.7 14.0 13.0 19.2 25.0 28.1 26.4 16.8 16.9 17.2 24.6 33.8 33.2
G Gly GGG 15.7 13.7 13.6 13.0 10.0 8.6 4.9 10.6 11.1 10.6 10.2 7.9 9.2 9.1 9.5 11.0
G Gly GGT 17.0 27.1 26.7 27.5 30.2 32.1 42.6 33.2 29.8 30.5 40.2 39.8 38.6 35.3 26.9 24.0
Codons per AA 46,667 20,413 10,992 10,064 22,693 11,194 1,186 37,251 2,633 7,031 27,963 5,944 16,849 14,863 9,577 6,196.0
H His CAC 51.6 28.1 27.8 24.8 25.4 22.3 33.7 38.8 41.3 43.8 29.2 22.2 25.2 39.0 51.0 49.7
H His CAT 48.4 71.9 72.2 75.2 74.6 77.7 66.3 61.2 58.7 56.2 70.8 77.8 74.8 61.0 49.0 50.3
Codons per AA 19,477 7,978 4,459 3,819 9,003 4,628 421 16,467 1,060 2,710 14,787 3,389 7,427 7,245 3,626 2,601.0
I Ile ATA 9.7 23.0 23.1 22.9 23.5 25.3 13.8 23.2 21.9 19.6 29.5 29.2 27.5 25.0 26.6 27.0
I Ile ATC 35.7 12.5 11.7 11.2 11.0 9.8 36.5 36.2 39.7 40.7 22.3 23.0 24.7 21.5 29.7 27.9
I Ile ATT 54.7 64.5 65.1 65.9 65.5 64.8 49.7 40.6 38.3 39.7 48.3 47.8 47.7 53.5 43.6 45.2
Codons per AA 38,860 23,849 13,986 12,183 28,528 15,200 1,018 38,551 2,582 5,486 39,971 9,443 20,692 17,746 7,330 5,428.0
K Lys AAA 60.2 72.5 72.6 73.2 74.7 76.6 61.2 53.8 53.4 53.4 69.0 69.4 69.5 69.4 44.6 47.3
K Lys AAG 39.8 27.5 27.4 26.8 25.3 23.4 38.8 46.2 46.6 46.6 31.0 30.6 30.5 30.6 55.4 52.7
Codons per AA 44,829 26,575 15,780 12,963 29,876 15,288 1,324 40,639 2,742 7,563 37,793 8,913 21,167 19,233 9,334 6,794.0
L Leu CTA 3.1 6.7 6.4 6.3 6.3 6.9 8.1 10.4 9.9 10.5 10.3 9.9 9.5 5.8 7.9 8.7
L Leu CTC 17.1 7.1 6.6 6.0 6.4 5.7 15.9 18.9 19.3 19.1 7.8 7.2 7.6 6.9 10.9 11.1
L Leu CTG 21.5 5.0 4.7 4.7 4.8 4.5 4.5 14.8 16.1 18.0 13.0 10.9 13.8 16.0 24.7 23.4
L Leu CTT 17.9 24.7 25.0 25.2 25.3 26.0 25.1 21.2 20.7 20.5 19.7 19.8 19.6 17.3 18.0 18.6
L Leu TTA 6.6 30.9 31.4 32.3 33.4 35.3 17.5 13.5 12.8 10.1 26.1 27.8 24.6 17.3 9.2 9.7
L Leu TTG 33.8 25.6 25.9 25.5 23.8 21.7 29.0 21.3 21.2 21.7 23.1 24.5 24.9 36.8 29.4 28.5
Codons per AA 68,607 34,549 19,485 17,118 38,589 20,003 1,397 56,369 3,564 8,233 53,591 12,048 26,576 27,491 13,110 9,558
M Met ATG 100.0 100.0 100.0 100.0 100.0 100.0 100.0 100.0 100.0 100.0 100.0 100.0 100.0 100.0 100.0 100.0
Codons per AA 18,014 8,593 4,930 4,095 9,532 4,730 306 16,510 1,091 2,477 15,883 3,373 7,990 7,625 3,836 2,785
N Asn AAC 48.6 22.3 20.9 19.9 18.8 17.6 46.6 43.2 44.1 49.1 27.2 23.8 25.1 34.9 53.1 53.1
N Asn AAT 51.4 77.7 79.1 80.1 81.2 82.4 53.4 56.8 55.9 50.9 72.8 76.2 74.9 65.1 46.9 46.9
Codons per AA 33,133 20,562 11,306 9,756 23,509 12,351 779 28,917 1,836 4,201 28,196 6,554 14,572 14,343 5,930 4,424
P Pro CCA 24.2 40.6 39.9 41.3 44.8 45.0 46.5 36.9 32.5 34.9 45.0 45.5 44.2 38.3 30.0 30.3
P Pro CCC 24.5 10.6 9.6 8.8 7.9 7.2 14.2 14.9 18.4 17.1 10.7 8.5 9.7 10.9 17.7 17.1
P Pro CCG 34.9 10.5 11.2 10.7 8.5 8.5 11.7 24.7 24.5 24.6 19.1 19.2 22.9 24.4 28.4 28.7
P Pro CCT 16.4 38.3 39.3 39.1 38.9 39.3 27.6 23.5 24.7 23.4 25.2 26.8 23.2 26.3 23.8 23.9
Codons per AA 36,929 16,614 8,537 7,305 17,440 8,307 768 30,784 2,276 5,519 23,108 4,915 13,464 11,909 7,466 5,066
Q Gln CAA 57.1 79.4 79.6 80.2 80.9 80.3 82.0 57.4 57.1 50.2 61.4 63.6 62.8 59.9 50.4 50.3
Q Gln CAG 42.9 20.6 20.4 19.8 19.1 19.7 18.0 42.6 42.9 49.8 38.6 36.4 37.2 40.1 49.6 49.7
Codons per AA 33,107 16,926 8,552 7,532 17,739 8,805 640 23,271 1,514 3,612 21,428 4,769 11,797 11,420 5,644 4,047
Table 4 (Continued)
Codon usage of translations by nematode species
Genome Biology 2006, Volume 7, Issue 8, Article R75 Mitreva et al. R75.9
comment reviews reports refereed researchdeposited research interactions information
Genome Biology 2006, 7:R75
value for the comparison of codon usage pattern between the
CE-A and CE-B datasets was 0.18, which was not statistically
different at the P < 0.05 threshold and less than the D
100
value
of the C. elegans to C. briggsae comparison (0.40). Compar-
ing the CE-A and CE-B datasets to the genome-derived full
gene set for C. elegans yielded average D
100
values of 0.67 and
0.26, respectively. At a practical level, the calculated use of
the average codon in C. elegans based on CE-A and CE-B dif-
fers from that based on prediction from the whole genome by
just 3.4 ± 2.3% and 2.0 ± 1.5%, respectively. Therefore,
although differences in calculated codon usage using partial
versus whole genome data are modest enough to make EST-
derived codon usage data highly informative, care must be
taken not to over-interpret minor differences in D
100
values
because such differences are probably within the range of
sampling error (see Discussion, below). However, such
uncertainty around small differences in D
100
values does not
alter the major trends that we describe.
The 16 intragenus comparisons of species sharing the same
genus name (Ancylostoma, Caenorhabditis, Strongyloides,
Globodera, Meloidogyne, Ascaris, and Trichuris) all have
low D
100
values, with a mean of 0.14 ± 0.11 (median 0.09,
range 0.02-0.40), indicating very similar patterns of codon
usage among species within the same genera. By contrast, the
480 comparisons beyond named genera vary greatly, with a
mean D
100
value of 8.10 ± 7.46 (median 5.26, range 0.08-
40.56). Low D
100
values do sometimes extend to comparisons
among genera. For instance, relatively low D
100
values (0.08-
1.94) are observed within the following: order Haemonchidae
(HC, OO, and TD); subfamily Heteroderinae (GP, GR, and
HG); superfamily Ascaridoidea (AS, AL, and TC); and super-
family Filarioidea (BM, DI, and OV). However, low D
100
val-
ues are not maintained across family Ancylostomatidae (NA,
AC, and AY), family Strongyloididae (SS, SR, and PT), super-
family Tylenchoidea (PE-MC), and order Trichocephalida
(TS, TM, and TV). Similarity in codon usage, as indicated by
low D
100
values, does not extend to the level of the major
clades (I, III, IVb, IVa, and V).
R Arg AGA 11.6 28.8 28.1 29.2 30.0 30.0 16.4 17.7 16.3 17.2 22.3 21.9 21.2 21.8 16.3 17.6
R Arg CGA 18.0 16.8 16.8 17.3 16.7 17.2 17.3 21.3 18.5 19.7 24.0 26.3 25.4 22.7 18.1 17.7
R Arg AGG 9.0 9.7 9.4 8.8 8.9 8.6 2.9 12.3 11.8 12.4 10.9 8.8 9.5 7.1 12.4 13.2
R Arg CGC 25.0 9.4 9.2 8.5 8.8 7.9 15.3 15.8 20.2 17.3 9.6 9.4 10.4 13.7 22.9 21.8
R Arg CGG 15.8 5.6 5.4 4.9 4.5 4.5 1.2 8.3 7.9 7.2 9.2 8.4 8.8 8.5 11.6 11.5
R Arg CGT 20.6 29.7 31.0 31.4 31.1 31.8 47.0 24.6 25.3 26.2 24.0 25.2 24.8 26.1 18.7 18.2
Codons per AA 47,178 19,486 11,042 9,171 21,409 9,973 1,001 40,766 2,650 6,429 31,420 7,457 17,634 16,384 9,203 6,468
S Ser AGC 15.5 9.1 9.4 8.4 7.9 7.6 11.8 16.4 16.6 17.1 11.0 9.7 11.1 15.1 23.2 22.5
S Ser TCA 14.4 24.5 24.3 24.1 27.0 28.6 18.1 22.3 20.8 19.6 28.4 29.5 27.7 21.0 14.4 15.5
S Ser TCC 20.8 9.0 8.6 7.9 6.8 6.6 15.7 9.9 12.0 11.0 10.4 9.3 10.7 10.3 17.7 17.3
S Ser AGT 12.5 17.6 17.2 18.5 18.1 18.4 13.6 15.8 13.8 14.4 19.2 18.7 19.1 19.1 13.3 13.8
S Ser TCG 22.4 7.8 8.3 7.9 6.2 6.2 13.3 21.4 22.3 24.8 12.2 12.8 14.0 14.4 19.1 18.3
S Ser TCT 14.3 31.9 32.1 33.3 34.0 32.5 27.5 14.3 14.4 13.1 18.9 20.0 17.5 20.1 12.2 12.6
Codons per AA 54,466 27,606 14,239 12,353 29,702 15,207 899 48,736 3,157 6,860 43,504 9,483 21,762 22,175 10,980 7,907
T Thr ACA 23.2 40.6 39.2 41.1 42.3 42.7 19.5 30.2 30.3 27.5 39.0 40.1 38.1 31.8 21.3 25.1
T Thr ACC 25.6 11.1 9.9 9.0 9.1 7.9 28.6 19.2 22.4 20.0 15.6 12.9 15.6 16.3 24.9 23.1
T Thr ACG 26.6 8.4 8.8 8.6 8.5 7.7 12.5 26.8 24.9 29.2 15.4 16.3 17.4 19.8 30.9 30.3
T Thr ACT 24.6 39.8 42.1 41.4 40.1 41.7 39.4 23.8 22.4 23.2 30.0 30.7 28.9 32.1 22.9 21.5
Codons per AA 37,607 19,046 10,254 8,837 20,194 10,213 919 34,207 2,219 5,814 29,901 6,460 15,488 14,901 7,680 5,829
V Val GTA 6.0 17.6 16.9 17.5 17.0 20.7 14.1 16.4 16.6 16.4 25.4 26.2 26.3 19.4 16.6 17.7
V Val GTC 29.6 13.2 12.3 11.9 11.4 10.7 29.2 20.6 21.7 21.3 14.3 14.0 14.4 16.7 22.8 21.9
V Val GTG 38.3 13.5 13.2 11.7 12.9 11.7 12.9 29.7 31.1 30.7 22.9 21.2 21.6 26.3 27.6 28.3
V Val GTT 26.1 55.8 57.6 58.9 58.6 56.9 43.8 33.2 30.6 31.5 37.5 38.7 37.7 37.6 33.0 32.1
Codons per AA 45,942 19,706 10,925 9,899 21,917 10,703 1,109 42,490 2,780 6,580 33,067 7,389 17,037 18,805 9,977 7,169
W Typ TGG 100.0 100.0 100.0 100.0 100.0 100.0 100.0 100.0 100.0 100.0 100.0 100.0 100.0 100.0 100.0 100.0
Codons per AA 9,033 4,055 2,294 2,002 4,746 2,298 188 7,902 532 1,213 6,380 1,377 3,584 3,486 1,777 1,350
Y Tyr TAC 58.9 23.2 22.2 20.9 21.4 19.6 34.6 37.3 41.2 46.0 30.3 26.0 28.4 38.7 61.8 62.7
Y Tyr TAT 41.1 76.8 77.8 79.1 78.6 80.4 65.4 62.7 58.8 54.0 69.7 74.0 71.6 61.3 38.2 37.3
Codons per AA 18,687 11,019 6,656 5,582 12,940 6,716 627 21,299 1,453 3,267 20,353 4,785 10,337 9,939 4,691 3,401
Values are given as % per AA, or as numbers for Codons per AA. Definitions of species two letter codes are provided in Table 1. AA, amino acid.
Table 4 (Continued)
Codon usage of translations by nematode species
R75.10 Genome Biology 2006, Volume 7, Issue 8, Article R75 Mitreva et al. />Genome Biology 2006, 7:R75
Furthermore, species with very similar GC content, although
distantly related, can exhibit extremely similar codon usage
(for instance Ancylostoma caninum versus Toxocara canis,
GC = 48%, D
100
= 0.79). Species with the lowest average D
100
values in one-versus-all comparisons are those closest to the
median species GC content, such as PE (GC = 46%). Taxa with
the highest AT content, such as Strongyloides and Meloido-
gyne species, have among the most extreme differences in
codon usage when compared with species beyond their genus
(median D
100
values are 15.3 and 9.4, respectively).
Phylogenetic analysis of changes in codon usage using (1 -
antilog [-D]) × 100, interpretable as percentage divergence in
overall codon usage (Figure 1), identifies five branches that
have accumulated more than 5% change in codon usage.
These branches are as follows: the most recent common
ancestor of clades III, IVa, and IVb (5.2%); the most recent
common ancestor of clade IVa (11.2%); the most recent com-
mon ancestor of genus Meloidogyne (6.7%); the most recent
common ancestor of genus Globodera (7.3%); and the lineage
represented by PP (8.3%). Genera Globodera, Meloidogyne,
Pristionchus, and Strongyloides therefore represent the most
highly derived patterns of codon usage in nematodes, with the
remaining species exhibiting less relatively divergence from
an ancestral nematode pattern.
Codon bias in nematode transcripts and relationship to
GC content
We used the effective number of codons (ENC) to measure the
degree of codon bias for a gene [49]. ENC is a general measure
of non-uniformity of codon usage and ranges from 20 if only
one codon is used for each AA to 61 if all synonymous codons
are used equally. The mean ENC across all sampled nematode
species is 46.7 ± 5.1, and many nematodes have ENC values
similar to those obtained for various bacteria, yeast, and Dro-
sophila species (ENCs of 45-48) [50]. Outliers with low ENC
values include SS and SR, for which transcripts on average
utilize only about 35 of 61 available codons. The variation
observed in ENC values among species exhibits a clear rela-
tionship to the species' overall coding sequence GC3 content
(R = 0.70 following phylogenetic correction; Figure 4). The
correlation confirms that species with lower GC3 content in
coding sequence have greater codon usage bias than those
with higher GC3. ENC values for nematodes peak at 47-49%
GC (data not shown). In addition to comparing species' mean
ENC values, we also examined the distribution of ENC values
across all transcripts within each species. Although all species
have examples of transcripts across nearly the full range of
possible ENC values, in species with low GC3 content, such as
SR, the distribution is shifted toward a lower ENC peak
(Additional data file 3).
Additional file 3Click here for file
To ensure that differences in our available data for each spe-
cies (for instance, cluster number and cluster length) were not
creating artifacts in ENC values, quality checks were per-
formed. Unlike measures such as codon bias index, scaled ×2,
and intrinsic codon bias index, ENC values should be inde-
pendent of translated polypeptide length and sample size
[49,51], and our analysis confirmed this. No correlation with
ENC was observed with either average translated polypeptide
length or number of clusters for a species. In fact, SS and SR
with the lowest ENC values had above average cluster length
and number. As additional confirmation, we randomly
selected 2,400 C. elegans genes (the average number of
clusters for species other than CE and CB) and calculated
ENC based on either full-length genes or genes trimmed to
121 AAs (the average length cluster translation for species
other than CE and CB). Differences in the average ENC num-
bers for these datasets were not statistically significantly dif-
ferent from zero (P > 0.05).
In addition to codon bias, neighboring nucleotides influence
the codon observed at a position relative to synonymous
codons. The most important nucleotide determining such
context dependent codon bias [52-54] is the first one
following the codon (N1 context) [55,56]. An analysis using
the complete genesets of Homo sapiens, Drosophila mela-
nogaster, C. elegans, and Arabidopsis thaliana revealed that
90% of codons have a statistically significant N1 context-
dependent codon bias [57]. Using the same method we calcu-
lated that, for the 30 nematode species represented by EST-
derived codon data, an average of 63% of codons with N1 con-
text have a statistically significant bias (because the R values
differed from 1 by more than 3 standard deviations). Fedorov
and colleagues [57] showed that their results were not consid-
erably affected by gene sampling. However, for our dataset
the calculated CE-A and CE-B N1 context with statistically
significant bias was 75% and 83% of the codons, respectively,
as compared with 96% when the complete C. elegans gene set
was used. Therefore, the extent of significant N1 context-
dependent codon bias determined from EST-based codon
usage data may change as more complete nematode genomes
become available. The complete list of relative abundance of
all nematode species with N1 context, R values, and standard
deviations are available in Additional data file 4.
Additional file 4Click here for file
Coding sequence GC content versus total genome GC
content
Because of the clear relationships of AA composition, codon
usage pattern, and codon bias to the GC content of coding
sequences and the interest in the underlying cause of these
correlations (see Discussion, below), we examined the rela-
tionship between coding sequence GC3 content and genomic
GC content in nematodes. Total genomic GC content was cal-
culated for the six nematode species for which significant
genome sequence data were available as unassembled
sequences (TS and HC), partial assemblies (BM and AC), or
finished assemblies (CE and CB). Noncoding genomic GC
content was calculated for CB and CE based on published esti-
mates of the percentage of each genome that is composed of
noncoding sequence, namely 74.5% and 77.1%, respectively
[35]. Extrapolations were made for other species using the CE
Genome Biology 2006, Volume 7, Issue 8, Article R75 Mitreva et al. R75.11
comment reviews reports refereed researchdeposited research interactions information
Genome Biology 2006, 7:R75
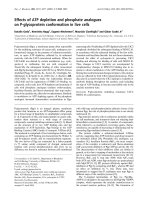
Maximum likelihood (ML) analysis of 18S ribosomal RNA from 25 nematode speciesFigure 1
Maximum likelihood (ML) analysis of 18S ribosomal RNA from 25 nematode species. The ML calculation assumes a molecular clock; thus, the tips of the
tree are all equidistant, in branch length, from its root. This model of base substitution allows the expected frequencies of the four bases to be unequal,
and different rates of evolution at different sites are allowed. The numbers indicate reconstruction of percentage changes in overall codon usage on this
phylogenetic topology (see Codon usage patterns and relationships to sampling method, nematode phylogeny, and GC content [under Results]). A
distance matrix of D values corrected for non-additivity [1 - antilog(-D)] × 100 was partitioned on the topology using the cyclic neighbor-joining algorithm,
as illustrated by Avise [82]. Approximate percentage change in overall codon usage is indicated for five branches inferred to have undergone 5% or more
divergence from an ancestral nematode pattern. This analysis identified genera Globodera, Meloidogyne, Pristionchus, and Strongyloides as having the most
highly derived patterns of codon usage, and the remaining species as having relatively little net divergence from an ancestral nematode pattern. Definitions
of species two letter codes are provided in Table 1; GenBank accession numbers are listed on right. Clades V are shown in red, IVa in blue, IVb in green,
III in yellow, and I in brown.
AC (AJ920347)
OO (AF036598)
NB (AF036597)
HC (L04153)
NA (AJ920348)
CB (U13929)
CE (X03680)
PP (AF083010)
SS (M84229)
SR (AF036605)
PE (AY286308)
GP (AF036592)
GR (AY593881)
ZP (U51760)
MJ (AY268121)
MC (AY593889)
MI (AY268120)
MA (U42342)
MH (AY593898)
AS (AF036587)
DI (AF036638)
BM (AF036588)
TC (AF036608)
TM (AF036637)
TS (AY497012)
7.3%
8.3%
6.7%
5.2%
11.2%
AC (AJ920347)
OO (AF036598)
NB (AF036597)
HC (L04153)
NA (AJ920348)
CB (U13929)
CE (X03680)
PP (AF083010)
SS (M84229)
SR (AF036605)
PE (AY286308)
GP (AF036592)
GR (AY593881)
ZP (U51760)
MJ (AY268121)
MC (AY593889)
MI (AY268120)
MA (U42342)
MH (AY593898)
AS (AF036587)
DI (AF036638)
BM (AF036588)
TC (AF036608)
TM (AF036637)
TS (AY497012)
7.3%
8.3%
6.7%
5.2%
11.2%
R75.12 Genome Biology 2006, Volume 7, Issue 8, Article R75 Mitreva et al. />Genome Biology 2006, 7:R75
percentage noncoding estimate. Although GC content varies
across the genome for some organisms (for example, isochors
in vertebrates [58]), GC content is fairly uniform across the C.
elegans genome [17]; furthermore, as yet there is no evidence
of non-uniformity in other nematode genomes. A positive
correlation was observed between coding GC3 content and
both total GC content and extrapolated noncoding GC con-
tent (R = 0.92; Figure 5). Noncoding genomic sequences var-
ied across a wider span of GC values than did coding
sequences. In all six nematodes, coding sequences were
somewhat more GC rich than were noncoding sequences (2-
10%).
Comparison of coding sequence GC versus 3'-untranslated
region (UTR) GC also supports this conclusion. Calculated 3'-
UTR GC for the 30 species in our EST dataset ranges from
28.6% to 46.1%. Correlation between phylogenetically inde-
pendent contrasts of coding GC content (Table 1) and 3'-UTR
has an R value of 0.81 (data not shown).
Codon usage patterns in abundantly expressed genes
and candidate optimal codons
Representation in cDNA library generally correlates with
abundance in the original biologic sample [59] although arti-
facts occur [60,61]. To investigate the difference in the codon
usage patterns in highly abundant transcripts as compared
with less abundantly expressed genes, as determined by
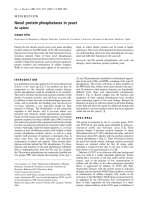
Correlation between phylogenetically independent contrasts of coding sequence GC3 content and AA usage for 25 nematode speciesFigure 2
Correlation between phylogenetically independent contrasts of coding
sequence GC3 content and AA usage for 25 nematode species. (a) AAs
lysine (Lys), isoleucine (Ile), asparagine (Asn), and tyrosine (Tyr) are used
less frequently as the species' coding sequence GC3 content increases. (b)
AAs alanine (Ala), glycine (Gly), arginine (Arg), and proline (Pro) are used
more frequently as the coding sequence GC3 content increases. AA,
amino acid.
-15
-10
-5
0
5
10
15
-80-60-40-20 0 20 40 60 80
Contrasts of %GC3
Contrasts of AA Frequencies
Asn
Ile
Lys
Tyr
R=0.66
R=0.81
R=0.35
R=0.72
-10
-8
-6
-4
-2
0
2
4
6
8
10
-80 -60 -40 -20 0 20 40 60 80
Contrasts of %GC3
Contrasts of AA Frequencies
Ala
Arg
Gly
Pro
R=0.79
R=0.71
R=0.45
R=0.32
(a)
(b)
Correlation between phylogenetically independent contrasts of the third position GC content (GC3) and that of the first (GC1) and second (GC2) codon positions for 25 nematode speciesFigure 3
Correlation between phylogenetically independent contrasts of the third
position GC content (GC3) and that of the first (GC1) and second (GC2)
codon positions for 25 nematode species.
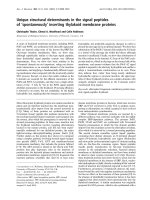
Correlation between phylogenetically independent contrasts of each species' %GC3 and its mean ENC for 25 nematode speciesFigure 4
Correlation between phylogenetically independent contrasts of each
species' %GC3 and its mean ENC for 25 nematode species. ENC, effective
number of codons.
-40
-30
-20
-10
0
10
20
30
40
-80 -60 -40 -20 0 20 40 60 80
Contrasts of %GC3
Contrasts of %GC1
-25
-20
-15
-10
-5
0
5
10
15
20
25
-80 -60 -40 -20 0 20 40 60 80
Contrasts of %GC3
Contrasts of %GC2
R=0.87
R=0.79
-45
-35
-25
-15
-5
5
15
25
35
45
-80 -60 -40 -20 0 20 40 60 80
Contrasts of %GC3
Contrasts of ENC
R=0.70
Genome Biology 2006, Volume 7, Issue 8, Article R75 Mitreva et al. R75.13
comment reviews reports refereed researchdeposited research interactions information
Genome Biology 2006, 7:R75
ESTs, we selected five species, each of which is a member of a
different clade. The selected species (AY, MI, OV, SR, and TS)
were represented by approximately 3,000 clusters each
(range 2,693-3,214), and codon usage tables were generated
for subsets of genes from each species: the 20 most abundant
clusters versus all remaining clusters, and the 50 most abun-
dant clusters versus all remaining clusters. Results of both
comparisons were similar, and for simplicity we discuss only
the results based on the comparison of the 50 most abundant
versus all remaining clusters. Clusters 51 to about can be
described as containing mainly genes with low to moderate
expression because transcripts of extremely low abundance
are less likely to be represented in EST collections (for
instance, neuronal 7-transmembrane receptors). Codon
usage tables, AA frequencies, and relative differences
between AA usage of the most abundant and less abundant
genes are available in Additional data file 5.
Additional file 5Click here for file
D values were calculated across all AAs and the codon usage
in each species was generally similar for genes represented by
abundant EST clusters and genes represented by low to
moderate expression EST clusters. SR exhibited the greatest
difference between the two usage patterns (D
100
= 6.15).
Additionally, for all the species at least seven AAs were used
significantly more frequently in the abundant genes than in
the remainder of the genes. For example, although the
abundant OV clusters had a Pro composition of 10.5% of all
AAs, the rest of the clusters were only 4.4% Pro.
Examining the codon usage frequencies within an AA, an
increase in usage has been noted with higher gene expression
for specific so-called 'optimal' codons [62,63]. Using the
codon usage tables for the top 50 and remaining clusters, we
have defined a list of potentially optimal codons with usage
that is higher in abundant transcripts by a statistically signif-
icant measure. Out of the 59 synonymous codons there were
24, 28, 25, 27, and 23 candidate optimal codons (Table 5) in
AY, MI, OV, SR, and TS, respectively. For example, Tyr is
encoded by two codons (TAC and TAT); in AY TAC is used
75% of the time in the abundant clusters and 59% of the time
in the less abundant clusters. Similar analysis documented
about 21 candidate optimal codons in C. elegans for which
usage differed significantly when comparing high and low
expressed genes [31,33,64]. Confirmation of these candidate
codons as truly 'optimal' will require additional
investigations, including other means of verifying relative
expression levels (for example, microarrays and reverse tran-
scription [RT]-polymerase chain reaction [PCR]).
Discussion
A comprehensive and well supported codon usage table for 32
nematode species across most of the phylum's major clades
and based on nearly 26 million codons is now available. Use
of large EST datasets provide an excellent resource for deter-
mining a species mean codon usage with results that differ
only modestly from those obtained from full genomes. In
nematodes, codon usage varies widely, as does coding and
noncoding GC content of nematode genomes. GC content cor-
relates with AA usage, similarity of codon usage, and codon
bias. Codon usage similarity in Nematoda usually persists
within a genus but then rapidly diminishes, even within each
major clade (clades I-V). Based on EST sampling, differences
in codon usage between highly abundant genes and moder-
ately expressed genes are recognizable, and candidate opti-
mal codons can be identified.
GC content, causality, and directional mutation
pressure
Correlations between GC content and mean codon usage and
mean AA usage similar to those we describe across the phy-
lum Nematoda have been observed in many other species
[4,65-70]. Directional mutation pressure is a theory proposed
to quantify differences in GC content observed in species [3].
Important variables include the relative values of the muta-
tion rates u (GC/CG → AT/TA change) and v (AT/TA → GC/
CG change). The preponderance of the evidence supports
causality of genome GC content, as determined by directional
mutation pressure or nucleotide level selective pressure,
driving both codon usage and AA composition rather than the
reverse. First, in an examination of sequence data from a
large number of a bacteria, archaea, and eukaryotes, a model
assuming directional mutation and selection at the nucleotide
level with different rates of change for each of the three codon
positions can explain 71-87% of the variance in codon usage
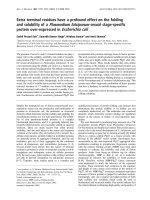
Correlation between coding sequence (transcriptome) %GC3 and genome %GC for six nematode species with extensive available genomic sequenceFigure 5
Correlation between coding sequence (transcriptome) %GC3 and genome
%GC for six nematode species with extensive available genomic sequence.
The green line indicates the coding sequence %GC versus the full genomic
%GC. In this case, coding sequence %GC3 is a contributor to the full
genomic %GC such that X and Y are not independent variables. The red
line indicates the coding sequence %GC3 versus noncoding genomic %GC.
In this case, the coding sequence contribution has been removed from
genomic totals such that X and Y are independent variables. For BM, TS,
HC, and AC, the calculation of noncoding genomic %GC relies on the
assumption that the species will have a similar breakdown of coding and
noncoding sequence as CE. Assembly and gene calling for the BM, HC, TS,
and AC sequences are needed to test this assumption. Definitions of
species two letter codes are provided in Table 1.
R=
27
32
37
42
47
33 38 43 48
Coding %GC3
Genomic %GC
R=0.92
R75.14 Genome Biology 2006, Volume 7, Issue 8, Article R75 Mitreva et al. />Genome Biology 2006, 7:R75
and 71-79% of the variance in AA composition [5]. Knight and
coworkers [5] found that between species an AA's change in
frequency in response to GC content is determined by the
mean GC content of its codons, whereas a codon's change in
frequency is determined by the difference between its GC con-
tent and the mean GC content of its synonyms. We observe
this result to be generally true across nematodes as well.
Second, an analysis comparing codon usage from eubacterial
and archaeal species with complete genomes [6] found that
codon usage can be predicted with some accuracy if one
knows only the sequence of the species' intergenic sequences
from which genome GC content, and context dependent
nucleotide bias parameters can be calculated. Using data
from six nematode species for which substantial genome
sequence data are available, we observed that coding
sequence GC3 content correlates with noncoding sequence
GC content. This perhaps indicates that, for nematodes too, it
should be possible to predict mean codon usage using only
knowledge of the intergenic sequences of the species. Our
findings are consistent with the model that genome GC con-
tent drives both mean codon usage and AA composition.
Little is known about why directional mutation pressure or
selective pressure leads to differences in genomic GC content
among species [5,6]. Within nematodes we see no pattern
based on ecologic niche or other factors that corresponds to
GC content. For instance, cyst nematodes (GP, GR, and HG)
Table 5
Candidate optimal codons in five species, determined as frequency increase by increased expression level
a
Species Species
AA Codon AY MI OV SR TS AA Codon AY MI OV SR TS
A Ala GCA GCA N Asn AAC AAC AAC AAC
A Ala GCC GCC GCC GCC GCC N Asn AAT AAT
A Ala GCT GCT GCT GCT GCT
P Pro CCA CCA CCA CCA CCA
C Cys TGC TGC TGC TGC TGC P Pro CCC CCC
PPro CCG CCG
D Asp GAC GAC GAC GAC GAC P Pro CCT CCT
DAspGAT GAT
Q Gln CAA CAA CAA
E Glu GAA GAA GAA GAA Q Gln CAG CAG CAG CAG
E Glu GAG GAG GAG
RArg AGA AGA
F Phe TTC TTC TTC TTC TTC R Arg CGA CGA
F Phe TTT TTT R Arg AGG AGG
R Arg CGC CGC CGC CGC
G Gly GGA GGA GGA GGA GGA R Arg CGG CGG
G Gly GGC GGC R Arg CGT CGT CGT CGT
G Gly GGT GGT
S Ser AGC AGC AGC AGC AGC AGC
H His CAC CAC CAC CAC CAC CAC S Ser TCA TCA TCA
S Ser TCC TCC TCC TCC TCC
IIleATA ATASSerAGT AGT
I Ile ATC ATC ATC ATC ATC S Ser TCG TCG TCG TCG
I Ile ATT ATT S Ser TCT TCT
K Lys AAA AAA T Thr ACC ACC ACC ACC ACC
K Lys AAG AAG AAG AAG AAG T Thr ACG ACG ACG
T Thr ACT ACT ACT
LLeuCTA CTA
L Leu CTC CTC CTC CTC V Val GTA GTA
L Leu CTG CTG V Val GTC GTC GTC GTC GTC
L Leu CTT CTT CTT CTT CTT V Val GTG GTG
L Leu TTA TTA V Val GTT GTT GTT
L Leu TTG TTG TTG TTG
Y Tyr TAC TAC TAC TAC TAC TAC
a
Expression level inferred by EST number. Definitions of species two letter codes are provided in Table 1. AA, amino acid; EST, expressed sequence
tag.
Genome Biology 2006, Volume 7, Issue 8, Article R75 Mitreva et al. R75.15
comment reviews reports refereed researchdeposited research interactions information
Genome Biology 2006, 7:R75
and root knot nematodes (MI, MJ, MA, MH, and MC) have
similar life cycles as plant sedentary endoparasites, but their
coding sequence GC contents are completely different
(approximately 50% versus 36%). Whatever the driving
forces, it is important for nematologists to note that they are
sufficiently strong not only to change base composition in
wobble sites (third position) but also to alter first and second
codon positions and even AA sequences - features that are
sometimes assumed to be under selective pressure for
conservation.
Species' mean codon usage versus optimal codons in
abundantly expressed genes
Our use of thousands of genes per species without weighting
for abundance of expression has produced a codon usage
dataset that probably reflects codon usage for genes with low
to moderate abundance of mRNAs. In the case of C. elegans
and C. briggsae, our codon usage table reflects the mean of all
predicted genes, although this is similar to that observed
based on sampling of 10,000 ESTs. At this 'genome-wide'
level, genome GC content is a dominant factor. However,
codon usage within a species does vary from gene to gene.
Prior studies of C. elegans codon usage have examined codon
usage and the role of 'optimal codons' in putatively abun-
dantly expressed genes [31,33,64]. Stenico and coworkers
[31] observed differences between usage of specific codons
based on 168 known genes, including many highly expressed
transcripts (for instance, actin, myosin, collagen, and vitello-
genin), and 90 unidentified reading frames (URFs) emerging
from sequencing efforts presumed to represent a more 'ran-
dom sampling' of the genome. Overall, our codon usage
results based on the full C. elegans genome are similar to both
the results from Stenico and coworkers' 168 known genes
(D
100
= 0.97) and the 90 URFs (D
100
= 1.1). Duret and cowork-
ers [33] weighted 15,425 C. elegans genes for expression
levels based on their EST abundance and identified 21 favored
codons used most frequently in highly expressed genes. In all
cases, these optimal codons could be decoded by isoaccepting
tRNAs that had the highest gene copy number in the genome,
indicating that optimal codons are probably selected for
translational efficiency. Likewise, Kanaya and coworkers [64]
showed that, in C. elegans, ribosomal proteins and histones,
selected as representatives of highly expressed genes, also use
optimal codons different from those used by average genes
and that these optimal codons correspond to tRNA gene copy
number. AA frequencies in abundant C. elegans genes also
correspond to isoaccepting tRNA gene copy number (R
2
=
0.67) [33].
Therefore, in C. elegans different pictures emerge of evolu-
tionary forces acting on codons and AAs in low to moderately
expressed genes (directional mutation pressure, genome GC
content) compared with abundantly expressed genes (opti-
mal codons, tRNA copy number). In other nematodes, it is
possible that a similar dichotomy exists, although we cur-
rently lack knowledge of tRNA gene copy number, and
information on gene expression levels is largely limited to
estimations based on EST abundance. Here, we have
provided candidate optimal codons in AY, MI, OV, SR, and
TS. A more detailed examination of codon usage as it relates
to gene expression level in other nematodes will be possible
by taking advantage of microarray and RF-PCR confirmation
of transcript abundance.
Implications for phylogenetic studies and molecular
biology
The extent to which average nematode genes sequences are
susceptible to GC or AT shifts should sound a cautionary note
for phylogenetic studies of nematode species, genes, and pro-
teins based solely on coding sequences because convergent
evolution may create confusing results. Knight and coworkers
[5] noted that, 'Pairs of species with convergent GC contents
might also evolve convergent protein sequences, especially at
functionally unconstrained positions. For example, the
frequencies of both lysine and arginine are highly (but oppo-
sitely) correlated with GC content, and lysine and arginine
can easily substitute for one another in proteins.' In
nematodes as well, one can envision exchanges of Lys and Arg
(Figure 2).
For cloning genes of interest from various nematode species,
we found that codon usage is a rapidly evolving feature such
that codon usage patterns beyond within a genus
comparisons are often divergent. Therefore, extrapolating
assumed codon usage patterns to unsampled species in nem-
atodes beyond the genus level is unlikely to be successful. At
a practical level of species choice, cloning of orthologs and
homologs of interest from species that are AT rich and have
low ENC values, such as SS and MI with low ENC values, will
require fewer degenerate primers than may be needed for
more GC rich species such as TC and MI. Transcript abun-
dance is also an important factor because genes suspected of
high level expression are likely to exhibit a shift in their codon
usage from the species average toward optimal codons
selected for translational efficiency.
Conclusion
Extensive sequence datasets from one complete, one draft,
and 30 partial genomes across the phylum Nematoda have
been used to analyze the conservation and diversification of
encoded protein families [26] and the factors effecting codon
usage and bias (the present report). The undertaken compre-
hensive survey of observed codon usage and bias is based on
26 million codons in 32 species, making it the most extensive
study for any phylum. Our data indicate that similarity
between species in average codon usage is a short range phe-
nomenon, generally rapidly diminishing beyond the genus
level. Mapping codon usage changes to the phyla indicates the
genera Globodera, Meloidogyne, Pristionchus, and Strongy-
loides have the most highly derived patterns of codon usage in
R75.16 Genome Biology 2006, Volume 7, Issue 8, Article R75 Mitreva et al. />Genome Biology 2006, 7:R75
nematodes, with the remaining species exhibiting less
relatively divergence from an ancestral nematode pattern.
There was a strong correlation between the exonic GC content
and similarity in codon usage. GC content also explains much
of the observed variation in the effective number of codons, a
measure of codon bias, and even differences in AA frequency.
Results from partial genomes assembled from ESTs and com-
plete genomes provide generally good agreement on codon
usage, although refinement will be necessary as more
sequences become available. EST collections from five species
have also been used as a starting point to identify potentially
abundant genes and predict optimal codons. These predic-
tions will also be refined using more accurate measures of
gene expression, including microarrays and quantitative RT-
PCR.
Materials and methods
Sequence acquisition and organization
To perform the first meta-analysis of the genomic biology of
the phylum Nematoda [26], ESTs from 30 nematode species
generated by our laboratories and others were downloaded
from the dbEST division of GenBank in May 2003. For con-
sistency, in this accompanying analysis of codon usage we
used this dataset for all analyses. Sequences were collated and
processed into partial genomes using the PartiGene pipeline
[71,72]. Polypeptide translations were predicted using
prot4EST [45,72]. Wormpep_dna121 (March 2004; Welcome
Trust Sanger Institute, unpublished data) was used for C. ele-
gans analysis, and the hybrid gene set [35] was used for C.
briggsae analysis. Mitochondria can have codon usage differ-
ing from that of the nuclear genome, and therefore protein
coding genes from mitochondrial genomes were eliminated
from consideration. Codon usage tables for human, Saccha-
romyces cerevisiae, and Escherichia coli were derived from
the Codon Usage Table Database [73] derived from GenBank
Release 140.0 (22 March 2004 [74]).
Phylogenetic correction
Analyses of the relationships among GC content, AA, and
codon usage values require statistical correction for the phyl-
ogenetic relatedness of the species being studied using phylo-
genetically independent contrasts [75]. To generate these
contrasts, we performed the following procedures. First, to
construct a phylogenetic tree independent of the transcrip-
tomic data analyzed in this paper, we aligned 18S ribosomal
RNA sequences using Clustalw [76] for all nematodes for
which more than 15 kilobases of sequence was available. The
18S sequence GenBank accession numbers are available in
Figure 1; the sequences from a priapulid worm and a nemato-
morph were used as outgroups [16] but excluded from our
analysis. Alignments were trimmed to reflect only the over-
lapping portion of the sequences from all species analyzed.
Second, this alignment, containing 1,841 base pairs/species
(including gaps) and an alternative alignment excluding any
region involving an insertion or deletion (1,423 base pairs/
species remained), was used to estimate phylogenies from the
nucleotide sequences by parsimony and maximum likelihood
(with and without assumption of a molecular clock) using
Phylip [77]. Third, the trees with branch lengths derived from
molecular clock-based analysis were used to calculate phylo-
genetically independent contrasts for our parameters of inter-
est [75]. The Phylip program 'contrasts' was used to compute
the phylogenetically independent contrasts using a Brown-
ian-motion model [78,79] of genomic evolution.
Bioinformatics
The Emboss program 'cusp' was used to calculate codon usage
in the predicted translations [80]. The ENC [49] was calcu-
lated using the Emboss program 'Codon Heterozygosity
(Inverse of) in Protein-coding Sequences'. A genetic distance
statistic was used to quantify divergence of synonymous
codon usage between species [47] follows. Let t
j
be the
number of codons that code for the j
th
amino acid. We omit
analysis of the nondegenerate codons Met and Trp, as well as
the 'stop' codon, so that j = 1, 2 r, where r = 18. Further-
more, let a
ij
and b
ij
be the frequencies of the i
th
synonymous
codon in the j
th
AA of two organisms A and B, respectively.
Then, Nei's difference statistic D is defined as the following:
Investigators have used D as an empirical measure of differ-
ence, averaged over all r residues, of the codon usage between
organisms [48]. There are a total of C
32,2
= 496 meaningful
comparisons for the entire collection of 32 species. These
results are presented as an N × N square matrix and the val-
ues are presented as D × 100. For simplicity in the remainder
of the text we will refer to D × 100 as D
100
.
Phylogenetic changes in codon usage were analyzed using the
species tree derived from 18S rRNA sequences estimated by
maximum likelihood with a molecular clock imposed. Parti-
tioning a matrix of distance values on a phylogenetic tree can
estimate amounts of change occurring on each branch, pro-
vided that the distance metrics obey the triangle inequality
(see the discussion on page 25 of the report by Page and Hol-
mes [81]). Because of its logarithmic operation, Nei's differ-
ence statistic D violates the triangle inequality at high values.
For the phylogenetic analysis of codon usage, we substituted
for D a distance measure equal to 1 - antilog(-D), which obeys
the triangle inequality. Distances were partitioned on the tree
topology using the cyclic neighbor-joining algorithm illus-
JaJbJab
jaa ij
i
t
jbb ij
i
t
jab ij ij
i
t
jjj
===
===
∑∑∑
2
1
2
11
J
r
JJ
r
JJ
r
J
aa jaa
j
r
bb jbb
j
r
ab jab
j
r
===
===
∑∑∑
111
111
D
J
JJ
ab
aa bb
=−
⎛
⎝
⎜
⎞
⎠
⎟
log .
Genome Biology 2006, Volume 7, Issue 8, Article R75 Mitreva et al. R75.17
comment reviews reports refereed researchdeposited research interactions information
Genome Biology 2006, 7:R75
trated by Avise [82], except that the topology was specified by
the prior analysis of 18S rRNA sequences.
The ENC was used to measure the degree of codon bias for a
gene [49]. Because the ENC statistic is not reliable when ana-
lyzing very short sequences (20 AAs or less), 54 short transla-
tions out of a total of 70,358 were discarded from these
analyses. The relative abundance of nematode codons (per
species) having a statistically significant N1 context-depend-
ent codon bias was calculated by computing the R values and
the standard deviations, as described by Fedorov and cowork-
ers [57].
Predicted expression level of a transcript (abundant, moder-
ate, rare, and so on) was determined by counting the number
of ESTs comprising the cluster. Five species from different
clades that have been sampled with at least 10,000 ESTs from
several life-stage libraries were selected for these analyses.
Most of the cDNA libraries were constructed using the same
protocols [61,83], and although the libraries generally corre-
late with abundance in the original biologic sample, artifacts
can occur. The increase in use of a given codon for an AA in
highly expressed genes (optimal codons) was considered sig-
nificant when the difference of the codon distributions within
that AA was statistically significant between datasets (P ≤
0.01).
To assess the differences in calculated codon usage distribu-
tions when using partial (EST-based) as compared with whole
genome data, we generated two datasets using C. elegans
ESTs and compared them with the curated gene set of C. ele-
gans (Wormpep version 121). Each EST dataset was com-
posed of 10,000 ESTs (approximately the average number of
ESTs used for the other 30 species); clustering and peptide
predictions were performed using the same algorithms as for
the other species.
Additional data files
The following additional data are included with the online
version of this article: An Excel file containing a table that
shows the nucleotide usage (%) by codon position and nema-
tode species (Additional data file 1); an Excel file containing
an N × N square matrix that shows codon usage across degen-
erate AAs for 25 nematode species reported as D values
(Additional data file 2); a PowerPoint file containing a figure
that shows the distribution of genes with various degrees of
codon usage bias as measured by ENC for three species with
approximately the same number of clusters but with different
coding GC content (S. ratti [GC = 32%], P. trichosuri [40%],
and P. pacificus [51%]; Additional data file 3); an Excel file
containing a table that shows the N1 context dependent bias
per species (Additional data file 4); and an Excel file contain-
ing a table that shows codon usage of abundant and less abun-
dant translations for five nematode species (Additional data
file 5).
Acknowledgements
We are thankful for assistance from Barry Shortt with statistics, Matt Dim-
mic with informatics, and Mark Blaxter and LaDeana Hillier with useful
comments on the manuscript. Work at Washington University was sup-
ported by NIH-NIAID research grant AI 46593 to RHW and Richard K
Wilson. JP was supported in part by the Wellcome Trust. The project orig-
inated while JPM was a Merck Fellow of the Helen Hay Whitney Founda-
tion. JPM is an employee and equity holder of Divergence, Inc.
References
1. Milhon JL, Tracy JW: Updated codon usage in Schistosoma. Exp
Parasitol 1995, 80:353-356.
2. Duret L: Evolution of synonymous codon usage in metazoans.
Curr Opin Genet Dev 2002, 12:640-649.
3. Sueoka N: On the genetic basis of variation and heterogeneity
of DNA base composition. Proc Natl Acad Sci USA 1962,
48:582-592.
4. Sueoka N: Directional mutation pressure and neutral molec-
ular evolution. Proc Natl Acad Sci USA 1988, 85:2653-2657.
5. Knight RD, Freeland SJ, Landweber LF: A simple model based on
mutation and selection explains trends in codon and amino-
acid usage and GC composition within and across genomes.
Genome Biol 2001, 2:research0010.
6. Chen SL, Lee W, Hottes AK, Shapiro L, McAdams HH: Codon
usage between genomes is constrained by genome-wide
mutational processes. Proc Natl Acad Sci USA 2004,
101:3480-3485.
7. Ikemura T: Codon usage and tRNA content in unicellular and
multicellular organisms. Mol Biol Evol 1985, 2:13-34.
8. Moriyama EN, Powell JR: Codon usage bias and tRNA abun-
dance in Drosophila. J Mol Evol 1997, 45:514-523.
9. Bulmer M: Coevolution of codon usage and transfer RNA
abundance. Nature 1987, 325:728-730.
10. Sharp PM, Li WH: The codon Adaptation Index: a measure of
directional synonymous codon usage bias, and its potential
applications. Nucleic Acids Res 1987, 15:1281-1295.
11. Gouy M, Gautier C: Codon usage in bacteria: correlation with
gene expressivity. Nucleic Acids Res 1982, 10:7055-7074.
12. Carlini DB, Chen Y, Stephan W: The relationship between third-
codon position nucleotide content, codon bias, mRNA sec-
ondary structure and gene expression in the drosophilid
alcohol dehydrogenase genes Adh and Adhr. Genetics 2001,
159:623-633.
13. Chamary JV, Hurst LD: Evidence for selection on synonymous
mutations affecting stability of mRNA secondary structure
in mammals. Genome Biol 2005, 6:R75.
14. Oresic M, Dehn M, Korenblum D, Shalloway D: Tracing specific
synonymous codon-secondary structure correlations
through evolution. J Mol Evol 2003, 56:473-484.
15. Marquez R, Smit S, Knight R: Do universal codon-usage patterns
minimize the effects of mutation and translation error?
Genome Biol 2005, 6:R91.
16. Blaxter ML, De Ley P, Garey JR, Liu LX, Scheldeman P, Vierstraete A,
Vanfleteren JR, Mackey LY, Dorris M, Frisse LM, et al.: A molecular
evolutionary framework for the phylum Nematoda. Nature
1998, 392:71-75.
17. The C. elegans Sequencing Consortium: Genome sequence of the
nematode C. elegans : a platform for investigating biology.
Science 1998, 282:2012-2018.
18. Blaxter ML, Raghavan N, Ghosh I, Guiliano D, Lu W, Williams SA,
Slatko B, Scott AL: Genes expressed in Brugia malayi infective
third stage larvae. Mol Biochem Parasitol 1996, 77:77-93.
19. Dautova M, Rosso MN, Abad P, Gommers FJ, Bakker J, Smant G: Sin-
gle pass cDNA sequencing - a powerful tool to analyse gene
expression in preparasitic juveniles of the southern root-
knot nematode Meloidogyne incognita. Nematology 2001,
3:129-139.
20. McCarter J, Dautova Mitreva M, Martin J, Dante M, Wylie T, Rao U,
Pape D, Bowers Y, Theising B, Murphy CV, et al.: Analysis and func-
tional classification of transcripts from the Nematode Mel-
oidogyne incognita. Genome Biol 2003, 4:R26.
21. Daub J, Loukas A, Pritchard DI, Blaxter M: A survey of genes
expressed in adults of the human hookworm, Necator
americanus.
Parasitology 2000, 120:171-184.
22. Mitreva M, McCarter JP, Martin J, Dante M, Wylie T, Chiapelli B, Pape
R75.18 Genome Biology 2006, Volume 7, Issue 8, Article R75 Mitreva et al. />Genome Biology 2006, 7:R75
D, Clifton SW, Nutman TB, Waterston RH: Comparative genom-
ics of gene expression in the parasitic and free-living nema-
todes Strongyloides stercoralis and Caenorhabditis elegans.
Genome Res 2004, 14:209-220.
23. Thompson FJ, Mitreva M, Barker GL, Martin J, Waterston RH, McCa-
rter JP, Viney ME: An expressed sequence tag analysis of the
life-cycle of the parasitic nematode Strongyloides ratti. Mol
Biochem Parasitol 2005, 142:32-46.
24. Parkinson J, Mitreva M, Hall N, Blaxter M, McCarter JP: 400000
nematode ESTs on the Net. Trends Parasitol 2003, 19:283-286.
25. Mitreva M, Blaxter ML, Bird DM, McCarter JP: Comparative
genomics of nematodes. Trends Genet 2005, 21:573-581.
26. Parkinson J, Mitreva M, Whitton C, Thomson M, Daub J, Martin J, Hall
N, Barrell B, Waterston RH, McCarter JP, et al.: A transcriptomic
analysis of the phylum Nematoda. Nat Genet 2004,
36:1259-1267.
27. Nematode Net [ />28. Wylie T, Martin J, Dante M, Mitreva M, Clifton SW, Chinwalla A,
Waterston RH, Wilson RK, McCarter JP: Nematode.net: a tool
for navigating sequences from parasitic and free-living
nematodes. Nucleic Acids Res 2004, 32:D423-D426.
29. Nembase [ />30. Parkinson J, Whitton C, Schmid R, Thomson M, Blaxter M: NEM-
BASE: a resource for parasitic nematode ESTs. Nucleic Acids
Res 2004, 32:D427-D430.
31. Stenico M, Lloyd AT, Sharp PM: Codon usage in Caenorhabditis
elegans : delineation of translational selection and muta-
tional biases.
Nucleic Acids Res 1994, 22:2437-2446.
32. Duret L, Mouchiroud D: Expression pattern and, surprisingly,
gene length shape codon usage in Caenorhabditis, Drosophila,
and Arabidopsis. Proc Natl Acad Sci USA 1999, 96:4482-4487.
33. Duret L: tRNA gene number and codon usage in the C. elegans
genome are co-adapted for optimal translation of highly
expressed genes. Trends Genet 2000, 16:287-289.
34. Marais G, Duret L: Synonymous codon usage, accuracy of
translation, and gene length in Caenorhabditis elegans. J Mol
Evol 2001, 52:275-280.
35. Stein LD, Bao Z, Blasiar D, Blumenthal T, Brent MR, Chen N, Chin-
walla A, Clarke L, Clee C, Coghlan A, et al.: The genome sequence
of Caenorhabditis briggsae : a platform for comparative
genomics. PLoS Biol 2003, 1:E45.
36. Unnasch TR, Katholi CR, Coate LM: Onchocerca volvulus : fre-
quency of codon usage. Exp Parasitol 1992, 75:457-459.
37. Hammond MP: Codon usage and gene organization in Brugia.
Parasitol Res 1994, 80:173-175.
38. Ellis J, Morrison DA, Kalinna B: Comparison of the patterns of
codon usage and bias between Brugia, Echinococcus,
Onchocerca and Schistosoma species. Parasitol Res 1995,
81:388-393.
39. Fadiel A, Lithwick S, Wanas MQ, Cuticchia AJ: Influence of
intercodon and base frequencies on codon usage in filarial
parasites. Genomics 2001, 74:197-210.
40. Moore TA, Ramachandran S, Gam AA, Neva FA, Lu W, Saunders L,
Williams SA, Nutman TB: Identification of novel sequences and
codon usage in Strongyloides stercoralis. Mol Biochem Parasitol
1996, 79:243-248.
41. Fadiel AA, Lithwick S, Gamra MM: Codon usage analysis of Ascaris
species influence of base and intercodon frequencies on the
synonymous codon usage. J Egypt Soc Parasitol 2002, 32:625-638.
42. Fadiel AA, Lithwick S, el-Garhy MF: Influence of parasitic life style
on the patterns of codon usage and base frequencies of Ancy-
lostoma and Necator species. J Egypt Soc Parasitol 2002,
32:657-673.
43. Nakamura Y, Gojobori T, Ikemura T: Codon usage tabulated
from the international DNA sequence databases; its status
1999. Nucleic Acids Res 1999, 27:292.
44. McCarter JP, Bird DM, Mitreva M: Nematode gene sequences:
update for December 2005. J Nematol 2006, 37:417-421.
45. Wasmuth JD, Blaxter ML: prot4EST: translating expressed
sequence tags from neglected genomes. BMC Bioinformatics
2004, 5:187.
46. King JL, Jukes TH: Non-Darwinian evolution. Science 1969,
164:788-798.
47. Nei M: Genetic distance between populations. Am Naturalist
1972, 106:283-292.
48. Long M, Gillespie JH: Codon usage divergence of homologous
vertebrate genes and codon usage clock. J Mol Evol 1991,
32:6-15.
49. Wright F: The 'effective number of codons' used in a gene.
Gene 1990, 87:23-29.
50. Powell JR, Moriyama EN: Evolution of codon usage bias in Dro-
sophila. Proc Natl Acad Sci USA 1997, 94:7784-7790.
51. Comeron JM, Aguade M: An evaluation of measures of synony-
mous codon usage bias.
J Mol Evol 1998, 47:268-274.
52. Yarus M, Folley LS: Sense codons are found in specific contexts.
J Mol Biol 1984, 182:529-540.
53. Shpaer EG: Constraints on codon context in Escherichia coli
genes. Their possible role in modulating the efficiency of
translation. J Mol Biol 1986, 188:555-564.
54. Gouy M: Codon contexts in Enterobacterialand coliphage
genes. Mol Biol Evol 1987, 4:426-444.
55. Berg OG, Silva PJN: Codon bias in Escherichia coli: the influence
of codon context on mutationand selection. Nucleic Acids Res
1997, 25:1397-1404.
56. Karlin S, Mrazek J: What drives codon choices in human genes?
J Mol Biol 1996, 262:459-472.
57. Fedorov A, Saxonov S, Gilbert W: Regularities of context-
dependent codon bias in eukaryotic genes. Nucleic Acids Res
2002, 30:1192-1197.
58. Eyre-Walker A, Hurst LD: The evolution of isochores. Nat Rev
Genet 2001, 2:549-555.
59. Audic S, Claverie JM: The significance of digital gene expression
profiles. Genome Res 1997, 7:986-995.
60. Munoz ET, Bogarad LD, Deem MW: Microarray and EST data-
base estimates of mRNA expression levels differ: the protein
length versus expression curve for C. elegans. BMC Genomics
2004, 5:30.
61. Mitreva M, Jasmer DP, Appleton J, Martin J, Dante M, Wylie T, Clifton
SW, Waterston RH, McCarter JP: Gene discovery in the adeno-
phorean nematode Trichinella spiralis: an analysis of tran-
scription from three life cycle stages. Mol Biochem Parasitol
2004, 137:277-291.
62. Ikemura T: Correlation between the abundance of Escherichia
coli transfer RNAs and the occurrence of the respective
codons in its protein genes: a proposal for a synonymous
codon choice that is optimal for the E. coli translational
system. J Mol Biol 1981, 151:389-409.
63. Musto H, Romero H, Zavala A, Jabbari K, Bernardi G: Synonymous
codon choices in the extremely GC-poor genome of Plasmo-
dium falciparum: compositional constraints and translational
selection. J Mol Evol 1999, 49:27-35.
64. Kanaya S, Yamada Y, Kinouchi M, Kudo Y, Ikemura T: Codon usage
and tRNA genes in eukaryotes: correlation of codon usage
diversity with translation efficiency and with CG-dinucle-
otide usage as assessed by multivariate analysis. J Mol Evol
2001, 53:290-298.
65. Ohama T, Yamao F, Muto A, Osawa S: Organization and codon
usage of the streptomycin operon in Micrococcus luteus, a
bacterium with a high genomic G + C content. J Bacteriol 1987,
169:4770-4777.
66. Ohama T, Muto A, Osawa S: Role of GC-biased mutation pres-
sure on synonymous codon choice in Micrococcus luteus, a
bacterium with a high genomic GC-content. Nucleic Acids Res
1990, 18:1565-1569.
67. Sueoka N: Directional mutation pressure, selective con-
straints, and genetic equilibria. J Mol Evol 1992, 35:95-114.
68. Wilquet V, Van de Casteele M: The role of the codon first letter
in the relationship between genomic GC content and pro-
tein amino acid composition. Res Microbiol 1999, 150:21-32.
69. D'Onofrio G, Mouchiroud D, Aïssani B, Gautier C, Bernardi G: Cor-
relations between the compositional properties of human
genes, codon usage, and amino acid composition of proteins.
J Mol Evol 1991, 32:504-510.
70. Lobry JR: Influence of genomic G+C content on average
amino-acid composition of proteins from 59 bacterial
species. Gene 1997, 205:309-316.
71. Parkinson J, Guiliano DB, Blaxter M: Making sense of EST
sequences by CLOBBing them. BMC Bioinformatics
2002, 3:31.
72. Parkinson J, Anthony A, Wasmuth J, Schmid R, Hedley A, Blaxter M:
PartiGene: constructing partial genomes. Bioinformatics 2004,
20:1398-1404.
73. Codon Usage Table Database [ />74. Nakamura Y, Gojobori T, Ikemura T: Codon usage tabulated
from international DNA sequence databases: status for the
year 2000. Nucleic Acids Res 2000, 28:292.
75. Felsenstein J: Phylogenies and the comparative method. Am
Genome Biology 2006, Volume 7, Issue 8, Article R75 Mitreva et al. R75.19
comment reviews reports refereed researchdeposited research interactions information
Genome Biology 2006, 7:R75
Naturalist 1985, 125:1-12.
76. Chenna R, Sugawara H, Koike T, Lopez R, Gibson TJ, Higgins DG,
Thompson JD: Multiple sequence alignment with the Clustal
series of programs. Nucleic Acids Res 2003, 31:3497-3500.
77. Felsenstein J: PHYLIP - Phylogeny Inference Package (Version
3.2). Cladistics 1989, 5:164-166.
78. Cavalli-Sforza LL, Edwards AWF: Phylogenetic analysis: models
and estimation procedures. Evolution 1967, 32:550-570.
79. Edwards AWF, Cavalli-Sforza LL: Reconstruction of evolutionary
trees. In Phenetic and Phylogenetic Classification Volume 6. Edited by:
Heywood VH, McNeill. London: Systematics Association; 1964:67-76.
80. Rice P, Longden I, Bleasby A: EMBOSS: the European Molecular
Biology Open Software Suite. Trends Genet 2000, 16:276-277.
81. Page RDM, Holmes EC: Molecular Evolution: a Phylogenetic Approach
Oxford, UK: Blackwell Science; 1998.
82. Avise JC: Molecular Markers Natural History and Evolution New York:
Chapman and Hall; 1994.
83. Mitreva M, Elling AA, Dante M, Kloek AP, Kalyanaraman A, Aluru S,
Clifton SW, Bird DM, Baum TJ, McCarter JP: A survey of SL1-
spliced transcripts from the root-lesion nematode Pratylen-
chus penetrans. Mol Gen Genomics 2004, 272:138-148.