Báo cáo y học: "Zoology, 223 Bartram Hall, University of Florida" ppsx
Bạn đang xem bản rút gọn của tài liệu. Xem và tải ngay bản đầy đủ của tài liệu tại đây (435.27 KB, 17 trang )
Genome Biology 2006, 7:R79
comment reviews reports deposited research refereed research interactions information
Open Access
2006McIntyreet al.Volume 7, Issue 8, Article R79
Research
Sex-specific expression of alternative transcripts in Drosophila
Lauren M McIntyre
*
, Lisa M Bono
†
, Anne Genissel
‡
, Rick Westerman
†§
,
Damion Junk
†¶
, Marina Telonis-Scott
¥
, Larry Harshman
#
, Marta L Wayne
¥
,
Artyom Kopp
‡§
and Sergey V Nuzhdin
**
Addresses:
*
Department of Molecular Genetics and Microbiology, 1376 Mowry Road room 116, University of Florida, Gainesville, FL 32611,
USA.
†
Computational Genomics, 901 West State Street, Purdue University, West Lafayette, IN 47907, USA.
‡
Section of Evolution and Ecology,
One Shields Avenue, University of California, Davis, California 95616, USA.
§
Department of Horticulture, 625 Agriculture Mall Dr., Purdue
University, West Lafayette, IN 47907, USA.
¶
Department of Agronomy, 915 West State Street, Purdue University, West Lafayette, IN 47907,
USA.
¥
Department of Zoology, 223 Bartram Hall, University of Florida, Gainesville, FL 32611, USA.
#
School of Biological Sciences, 335 Mant,
University of Nebraska, Lincoln, NE 68588, USA.
**
Center for Genetics and Development, One Shields Avenue, University of California, Davis,
California, 95616, USA.
Correspondence: Lauren M McIntyre. Email:
© 2006 McIntyre et al.; licensee BioMed Central Ltd.
This is an open access article distributed under the terms of the Creative Commons Attribution License ( which
permits unrestricted use, distribution, and reproduction in any medium, provided the original work is properly cited.
Sex-specific expression of alternative transcripts in Drosophila<p>A genome-wide microarray analysis of sex-specific expression of alternative transcripts in Drosophila shows sexual dimorphism in transcript abundance for 53% of the genes.</p>
Abstract
Background: Many genes produce multiple transcripts due to alternative splicing or utilization of
alternative transcription initiation/termination sites. This 'transcriptome expansion' is thought to
increase phenotypic complexity by allowing a single locus to produce several functionally distinct
proteins. However, sex, genetic and developmental variation in the representation of alternative
transcripts has never been examined systematically. Here, we describe a genome-wide analysis of
sex-specific expression of alternative transcripts in Drosophila melanogaster.
Results: We compared transcript profiles in males and females from eight Drosophila lines
(OregonR and 2b, and 6 RIL) using a newly designed 60-mer oligonucleotide microarray that allows
us to distinguish a large proportion of alternative transcripts. The new microarray incorporates
7,207 oligonucleotides, satisfying stringent binding and specificity criteria that target both the
common and the unique regions of 2,768 multi-transcript genes, as well as 12,912 oligonucleotides
that target genes with a single known transcript. We estimate that up to 22% of genes that produce
multiple transcripts show a sex-specific bias in the representation of alternative transcripts. Sexual
dimorphism in overall transcript abundance was evident for 53% of genes. The X chromosome
contains a significantly higher proportion of genes with female-biased transcription than the
autosomes. However, genes on the X chromosome are no more likely to have a sexual bias in
alternative transcript representation than autosomal genes.
Conclusion: Widespread sex-specific expression of alternative transcripts in Drosophila suggests
that a new level of sexual dimorphism at the molecular level exists.
Published: 25 August 2006
Genome Biology 2006, 7:R79 (doi:10.1186/gb-2006-7-8-r79)
Received: 15 February 2006
Revised: 8 June 2006
Accepted: 25 August 2006
The electronic version of this article is the complete one and can be
found online at />R79.2 Genome Biology 2006, Volume 7, Issue 8, Article R79 McIntyre et al. />Genome Biology 2006, 7:R79
Background
Microarray hybridization, with its unprecedented ability to
monitor genome-wide gene expression profiles, is paving the
way for exploring previously intractable problems in develop-
mental biology [1-5], neurobiology and behavior [6-8], evolu-
tionary genetics [9-13], and other areas of biology. One of the
technology's most exciting applications lies in establishing an
experimental and theoretical framework for linking genetic
variation in transcript abundance and phenotypic traits [14-
19]. However, there is more to the regulation of gene expres-
sion than steady-state transcript abundance. In particular,
many multi-exon genes in eukaryotic genomes are subject to
alternative splicing, which is thought to increase phenotypic
complexity by producing multiple, functionally distinct pro-
teins [20-24]. Much of this alternative splicing may be tissue-
specific, introducing an additional layer of regulatory com-
plexity [22,25]. Sexual dimorphism and genetic variation in
alternative splicing have never been systematically examined,
but it is reasonable to expect that such variation would have a
considerable impact on phenotypic diversity.
To estimate the extent of sexual dimorphism and genetic var-
iation in the production of alternative transcripts, we
designed a new Drosophila whole-genome microarray that
allows us to distinguish multiple transcripts of many genes
using long (60-mer) oligonucleotide probes. Since genome
annotation changes frequently as more data become availa-
ble, we have created a flexible, easily updated design, and
developed software that allows automatic annotation
updates. We have used the new platform to compare gene
expression profiles of males and females in eight lines of Dro-
sophila melanogaster, and found that over 50% of all genes
are expressed in a sex-biased manner. Interestingly, we esti-
mate that between 11% and 24% of Drosophila genes known
to produce multiple transcripts show sexual bias in the
expression of alternative transcripts.
Results
RNA was extracted from male and female flies from two lab-
oratory lines of D. melanogaster, OregonR and 2b, and six
randomly chosen recombinant inbred (RI) lines derived from
these parents. We detected 8,292 genes with a single known
transcript, represented by 8,310 microarray probes, in at least
one line/sex combination. In addition, an additional 1,651
multi-transcript genes and 71 gene families were each repre-
sented by a single hybridizing probe, since some of the probes
targeting alternative transcripts and gene families were not
detected in this experiment. These 10,014 transcripts were
analyzed using the ANOVA model for single transcripts (see
Materials and methods). Of these transcripts, 56% showed
significant variation at a false discovery rate (FDR) of 0.05
(Table 1), with the vast majority of this variation attributable
to differences between males and females (5,221 out of 10,014
transcripts). Among these sex-biased genes, 56% were
expressed at a higher level in females than in males. Among
lines, 349 transcripts showed significant differences (Table
1), and only 1 (CG33092) showed a significant difference in
the interaction between line and sex.
For 828 of the 2,479 genes known to produce multiple tran-
scripts, microarray probes targeting 2 or more distinct sets of
transcripts showed detectable hybridization. These probes
were analyzed using the ANOVA model for multiple tran-
scripts. Expression levels of 653 (78%) of these genes showed
significant variation at the FDR of 0.05, with the majority
(544) showing a sex bias and 202 showing significant differ-
ences among lines (that is, genetic variation). For 91 gene
families, hybridization was detected for probes targeting two
or more sets of transcripts. Of these, 79 were variable, with 67
of these showing significant differences between males and
females. For one transcript (modulo), the direction of the dif-
ference between males and females was affected by genotype.
Validation of platform
To evaluate the performance of the new microarray platform,
we analyzed the expression of genes for which we had a priori
expectations of sex-biased expression. First, we examined
components of the somatic sex determination pathway and
its known downstream targets [26,27]. As expected, the
female-specific genes transformer and yolk proteins 1, 2, and
3, each represented by a single probe on our arrays, showed
significantly female-biased expression in our experiments
(Table 2). Female-biased expression was also observed for
hermaphrodite and transformer 2 (tra2), which are
expressed in both sexes. tra2 was represented by four hybrid-
izing probes that targeted different regions of a nearly identi-
cal set of transcripts; all of these probes showed similar ratios
of expression in males and females (Table 2). doublesex (dsx)
is spliced in a sexually dimorphic manner, producing a male-
specific and a female-specific transcript [28]. In our design,
dsx was represented by four probes: one targeting a male-spe-
cific exon, one targeting a female-specific exon, and two tar-
geting an exon common to male and female transcripts. We
found that the male-specific probe indeed showed male-
biased expression, the female-specific probe showed female-
biased expression, and the common probes showed expres-
sion levels intermediate between the two sex-specific probes
(Table 2). These results indicate that, as intended, the new
microarray platform can distinguish among different exons
and thereby reliably indicate alternative transcript
production.
Next, we retrieved from FlyBase a list of genes known to be
involved in the development or function of reproductive
organs. We subdivided this list into three non-overlapping
sets: genes known to function only in the female reproductive
system (565 microarray probes, representing 326 genes),
those known to function only in the male reproductive system
(60 probes/42 genes), and genes implicated in both male and
female reproductive systems (120 probes/86 genes). Most of
these genes, however, are not exclusive to the reproductive
Genome Biology 2006, Volume 7, Issue 8, Article R79 McIntyre et al. R79.3
comment reviews reports refereed researchdeposited research interactions information
Genome Biology 2006, 7:R79
system and are expressed in a wide range of non-reproductive
organs as well. Since our experiments utilized whole-body
RNA samples, we may not always be able to detect sex-biased
expression in the reproductive organs. We found that among
the female reproductive system genes, 86% were female-
biased, with 72.5% being significant for sex and/or sex-by-
probe interaction effect (Additional file 1). Conversely, among
the male reproductive system genes, 64.3% were male-
biased, with 55.5% showing significant sex effect (Additional
file 1). We also analyzed a set of genes that are thought to be
expressed only in males. These genes included a number of
secreted accessory gland proteins [29-31], putative odorant-
binding proteins expressed in male-specific chemosensory
organs [25], and sperm-specific structural proteins [32]. We
found that 100% of these genes (11 out of 11) showed male-
biased expression in our experiments (Additional file 1).
Finally, we examined a set of male-specific transcripts identi-
fied earlier by differential cDNA hybridization [33,34], and
found that all genes detected in our experiments (ten out of
ten) showed male-biased expression (Additional file 1).
Finally, we examined the expression of six Y-linked genes
represented on our arrays. Only two of them were expressed
at detectable levels in enough samples to be considered
informative. As expected, neither was present in any female
samples, but both were detected in the majority of male sam-
ples. Together, these analyses confirm that the new microar-
ray platform is effective for detecting sex-biased gene
expression. For genes that produce multiple transcripts due
to alternative splicing, or due to the presence of multiple tran-
scription initiation or termination sites, we tested whether
the relative proportions of alternative transcripts differed
between sexes or lines. We used the ANOVA model for multi-
ple transcripts (see Materials and methods) to examine the
genes for which at least two probes targeting distinct sets of
transcripts produced detectable hybridization. For these
genes, we tested whether the relative amounts of signal from
the different probes differed between sexes or lines. Such dif-
ferences (called sex-by-probe or line-by-probe interactions)
imply that the same gene produces alternative transcripts in
different amounts in males versus females, or in different
genotypes, respectively.
Sex-specific production of alternative transcripts has previ-
ously been reported for only a handful of genes, so we lack an
extensive set of positive controls against which to compare
our results. The best-known example in Drosophila is the dsx
gene [28]. Indeed, as shown above, probes targeting the
male- and female-specific exons of dsx show different expres-
sion levels in different sexes (Table 2). When analyzed using
the ANOVA model for multiple transcripts, the dsx gene
shows a significant sex-by-probe interaction (P < 0.0001;
Table 2). Sex-lethal (Sxl), which also produces male- and
female-specific alternative transcripts [35], was represented
in our experiments by five probes targeting different subsets
of transcripts, and also showed significant sex-by-probe
interaction (Table 2). These results suggest that our platform
has the power to detect quantitative differences in the relative
amount of alternative transcripts in different sexes.
Sex-specific expression of alternative transcripts
We examined 828 genes for which 2 or more probes repre-
senting distinct sets of transcripts showed detectable hybrid-
ization. Of these, 182 (22%) showed significant sex-by-probe
or line-by-probe interactions at the FDR of 0.05, indicating
that the relative amounts of alternative transcripts were dif-
ferent in males and females, or in different lines (Table 3). For
the vast majority of these genes (177 out of 182 genes), the
differences were attributable to sex. These genes had a variety
of molecular functions, including transcription factors, cell
signaling components, cytoskeletal proteins, and others
(Additional data files 2 to 4). Of the 828 multi-transcript
genes, 55 had 2 or more probes targeting different subsets of
transcripts, but no probes targeting the entire set of tran-
scripts produced by the locus (that is, 'local' probes only; see
Materials and methods). Among such genes, 19 (35%) showed
evidence of sex-specific or line-specific bias in the production
of alternative transcripts (Table 3). Interestingly, no obvious
relationship was observed between the number of probes tar-
geting a given gene and the likelihood of finding evidence for
sex-specific transcript representation.
Table 1
Results from ANOVA models for single and multiple transcripts for the set of 10,933 detected genes
Multiple transcript model Single transcript model Total
ALTS GF Total S ALTS GF Total
Number of genes 828 91 919 8,292 1,651 71 10,014 10,933
Number significant for treatment 653 79 732 4,613 818 39 5,470 6,202
Number significant for line 202 27 229 297 48 4 349 578
Number significant for sex 544 67 611 4,393 792 36 5,221 5,832
Female biased 249 31 280 2,352 552 16 2,920 3,200
Singletons (S) with multiple probes to the same transcript are included in the singleton category. Alternative splice variants (ALTS) and gene families
(GF) were analyzed as multiple transcripts only when more than one probe was detected and otherwise these were analyzed as single transcripts.
R79.4 Genome Biology 2006, Volume 7, Issue 8, Article R79 McIntyre et al. />Genome Biology 2006, 7:R79
To examine sex-specific expression of alternative transcripts
more closely, we analyzed the set of 177 genes that showed
significant sex-by-probe interactions on a probe-by-probe
basis (Additional file 5). In general, we found that probes tar-
geting the same exon, or different constitutively spliced
exons, tended to have similar male/female expression ratios
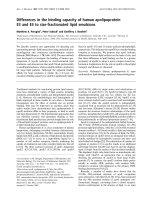
(Figure 1). Conversely, probes targeting different exons
tended to have expression ratios that were different from each
other and from constitutively spliced exons (Figure 1).
Table 2
Probe targets and effects of sex and sex by probe interaction for several components of the sex determination pathway
Genes Probes Transcripts Ratio (female/male)* Sex effect
†
Sex-by-probe
Non-sex specific Male Female
tra (CG16724) 9,174 - - -RA 1.10 <0.0001 NA
tra2 (CG10128) 4,734 -RA -RB -RD -RF -RG -RC -RE - 1.19 <0.0001 0.43
11,136 -RA -RB -RF -RG -RC - 1.13 <0.0001
15,655 -RA -RB -RD -RF -RG -RC -RE - 1.11 <0.0001
19,044 -RA -RB -RD -RF -RG -RC -RE - 1.13 <0.0001
Sxl (CG33070) 782 -RA -RC -RE -RG -RB -RF -RK -RD -RH -RJ 1.13 <0.0001 < 0.0001
824 -RG -RB 0.98 0.55
3,315 -RC -RJ 1.12 <0.0001
4,972 -RC -RJ 1.03 <0.0001
20,747 -RA -RC -RE -RG -RB -RF -RK -RD -RH -RJ 1.14 <0.0001
dsx (CG11094) 6,162 - - -RB 1.25 <0.0001 0.0006
12,495 - -RA -RB 1.06 0.22
12,690 - -RA - 0.95 0.20
13,818 - -RA -RB 0.99 0.93
her (CG4694) 4,988 -RA - - 1.12 <0.0001 NA
fru (CG14307) 1,388 -RI -RJ -RL -RM -RE -RC 0.98 0.77 0.01
2,271 -RI -RJ -RL -RM -RE -RC 0.94 0.05
9,294 -RB -RF - - 0.96 0.16
11,005 -RI -RJ -RL -RM -RE -RC 0.86 <0.0001
15,704 - -RB -RE -RG -RC -RF -RH 1.02 0.15
17,247 - -RB -RF 0.96 0.003
17,741 -RA -RD -RI -RJ -RK -RL -RM -RB -RE -RG -RC -RF -RH 1.03 0.071
Yp1 (CG2985) 13,974 - - -RA 1.37 <0.0001 NA
Yp2 (CG2979) 13,101 - - -RA 1.68 <0.0001 NA
Yp3 (CG11129) 2,812 - - -RA 1.57 <0.0001 NA
A sex by probe interaction occurs when the relative amount of the two (or more) probes differs between males and females. Thus, if only one probe
was present, then the sex by probe effect is not applicable (NA). *Ratios were estimated for each probe from the natural log of the background
corrected signal.
†
Individual probes were tested for difference between the males and females (sex effect) according to the single transcript model.
Table 3
Genes with probes targeting two or more non-identical sets of transcripts expressed
Classification of probes Number of genes total (alternatively transcribed) Significant total (alternatively transcribed)
Local probes only 89 (55) 25 (19)
Global + 1 local probe 608 (571) 103 (108)
Global + 2 local probes 151 (135) 36 (33)
Global + 3 local probes 46 (43) 14 (14)
Global + 4 local probes 12 (12) 5 (5)
Global + 5 local probes 8 (8) 2 (2)
Global + 6 local probes 3 (3) 0 (0)
Global + 7 local probes 1 (0) 0 (0)
Total 919 (828) 186 (182)
The genes with probes targeting two or more non-identical sets of transcripts expressed are divided into groups depending on the types of probes
detected. The distribution of the type of probes detected for each gene are given as well as the number of these genes that show a significant
interaction between the probe and the effect of either line or sex.
Genome Biology 2006, Volume 7, Issue 8, Article R79 McIntyre et al. R79.5
comment reviews reports refereed researchdeposited research interactions information
Genome Biology 2006, 7:R79
Figure 1 (see legend on next page)
5729 (1.32) 12354 (1.27)2894 (0.76)
18352 (1.01)
8933 (1.24)
15338 (0.84)
1869 (0.61)
8889 (0.60)
10662 (0.62)
9675 (0.97)
1992 (1.04)
8000 (1.08)
9519 (1.33)
13055 (1.30)
14658 (1.10)
1916 (0.99)
19527 (0.98)
1130 (0.82)
2876 (1.06)
2 + 1
1 + 1 + 1
3 + 1
2 + 1 + 1
2 + 2 + 1
annotation
annotation
mud-RB
mud-RC
mud-RA
0K
5K
10K
CG4662-RB
CG4662-RA
0K
2K
4K
6K
annotation
CG10899-RB
CG10899-RA
2K1K
0K
annotation
garz-RB
garz-RA
0K
2K
4K
6K
annotation
Akap200-RD
Akap200-RA
Akap200-Rc
Akap200-RB
0K
5K
10K
15K
R79.6 Genome Biology 2006, Volume 7, Issue 8, Article R79 McIntyre et al. />Genome Biology 2006, 7:R79
We did observe some exceptions where different probes tar-
geting the same set of annotated transcripts showed different
male/female expression ratios (Additional file 5). Such excep-
tions could be due either to intrinsic biases in probe hybridi-
zation, or to mistakes in the current FlyBase annotation (that
is, exons indicated as constitutive might in fact be subject to
alternative splicing or transcription). To estimate the extent
to which our results may be affected by these factors, we used
the ANOVA model for multiple transcripts to compare probes
that, according to the current annotation, targeted different
regions of the same set of transcripts. This control allows us
to assess the maximum proportion of significant sex-by-
probe or line-by-probe interactions expected in the absence
of differential transcript production (see Materials and meth-
ods). Of the 1,321 control probe sets, 129 (9.77%) showed sig-
nificant interactions - a proportion that is well short of the
22% found for probes targeting distinct sets of transcripts.
This suggests that although intrinsic probe biases and/or
mistakes in the annotation may have an effect, this effect is
not sufficient to explain the observed variation in relative
transcript abundance. We conclude that a large proportion of
multi-transcript genes in the Drosophila genome produce
alternative transcripts in a sexually dimorphic manner.
Confirmation of sex-specific alternative splicing by
quantitative PCR
Several genes that showed significant sex-by-probe interac-
tions were further tested using quantitative rt-PCR (qPCR)
with primers that flanked exon junctions. First we evaluated
the ability of qPCR to detect sex-biased transcript abundance.
The genes CG7441, Sxl, fru, and Nep4, which showed evi-
dence of sex-specific expression in the microarray data, were
used as positive controls, while Lsp1beta, which was not sex-
biased on the array, was used as a negative control. In all
cases, qPCR results were consistent with array results (Addi-
tional file 6). We then designed two to three primer pairs for
each of nine genes that are known to be alternatively spliced
and that showed evidence of sex-specific splicing in microar-
ray experiments: unc-13, mud, Jupiter, r, aret, CG4662,
CG10899, garz, and Akap200. These primer pairs were
designed to amplify either constitutive exon junctions, or
alternative splice junctions that were present in non-overlap-
ping sets of transcripts. We measured the cycle thresholds of
amplification (CT) for each primer pair in males and females
of the Oregon-R line, and tested whether these values showed
significant sex-transcript interaction. Such interaction would
indicate that different exons were produced in different
amounts in males versus females, confirming the microarray
results. We observed statistically significant differences in
transcript ratios in males versus females for eight out of nine
genes (Additional data file 6; Figure 2). For the ninth gene,
Akap200, transcript ratios also differed in the predicted
directions, but the ANOVA interaction term was not statisti-
cally significant.
Genomic distribution of differentially expressed genes
We tested whether the genes that showed evidence of differ-
ences in gene expression were more likely to be located on the
X chromosome than on the autosomes using a χ
2
test. For sin-
gle-transcript genes, 57% (840) of the X-linked genes showed
a significant difference in gene expression among sexes or
lines, compared to 54% (4,630) for the autosomal genes. This
difference, while slight, is greater than expected by chance (P
= 0.0260). In other words, X-linked genes are significantly
more likely to show differences in gene expression than auto-
somal genes. We then tested whether male- and female-
biased genes were distributed in the same proportions
between the X chromosome and the autosomes. We identified
559 female-biased genes on the X chromosome and 2,466 on
the autosomes, compared to 281 X-linked and 2,164
autosomal male-biased genes. Thus, 18.5% of all female-
biased genes are located on the X chromosome, while for
male-biased genes the corresponding number is only 11.5%.
This difference is highly significant (P < 0.0001),
demonstrating that the X chromosome is enriched for female-
biased single transcript genes.
The same comparisons were performed for multi-transcript
genes. There were 116 X-chromosomal and 616 autosomal
genes that showed a significant difference in gene expression
in either sex or line; these showed no statistical evidence for
chromosomal bias (P = 0.9479). However, among genes that
showed sex-biased transcript abundance, 78 X-linked and
304 autosomal genes were female-biased, compared to 38 X-
linked and 312 autosomal genes that were male-biased. The
proportions of female- and male-biased genes located on the
X chromosome (20.4% and 10.9%, respectively) were signifi-
cantly different (P = 0.0004), demonstrating that the X chro-
mosome is enriched for female-biased multi-transcript genes.
We also tested whether sex-specific production of alternative
transcripts (significant sex-by-probe interaction in the
ANOVA model for multiple transcripts) was more likely to be
observed for X-linked than for autosomal genes. There were
Experimental approach used to detect sex-specific splicingFigure 1 (see previous page)
Experimental approach used to detect sex-specific splicing. Probes designed based on sequence clustering may target either constitutive or alternatively
transcribed exons. Each panel shows a different example of probe distribution among constitutive and alternatively transcribed regions. For instance,
'2+1+1' indicates that the corresponding gene has two probes targeting a common region and one probe targeting each of two alternatively transcribed
regions, '3+1' indicates that the gene has three common probes and one probe that targets an alternatively transcribed region, and so on. For each probe,
the figure shows its designating number, location in the transcript, and the ratio of the normalized and log-transformed (natural log) values between
females (numerator) and males (denominator). Note that different probes that target the same subset of transcripts have similar values for the normalized
log transformed male/female expression ratios, even if they are located in different exons. In contrast, probes that target alternatively spliced regions have
different values for the normalized log transformed male/female expression ratios.
Genome Biology 2006, Volume 7, Issue 8, Article R79 McIntyre et al. R79.7
comment reviews reports refereed researchdeposited research interactions information
Genome Biology 2006, 7:R79
28 X-linked and 177 autosomal genes that showed significant
sex-specific transcription; this proportion was not signifi-
cantly different from that expected given the relative
abundance of genes on the X chromosome and the autosomes
(P = 0.3221). The male/female bias in alternative transcript
representation was also independent of chromosomal loca-
tion (P = 0.3479).
Discussion
The benefits of microarray design based upon
sequence similarity
To perform a quantitative analysis of alternative transcript
expression, we have designed transcript-specific probes
based solely on sequence clustering (see Materials and meth-
ods). Definitions based on biological constructs such as exon
junctions impose design restrictions that may result in probes
that cross-hybridize to multiple genes, or do not have optimal
hybridization properties with their intended targets. In con-
trast, our approach allows us to select probe sequences that
will hybridize only to single transcripts. Our analysis shows
that such probes perform in a uniform and highly reproduci-
ble fashion (Table 4). Moreover, a design based on the exon/
intron structure of genes would require frequent revision to
reflect changes in the genome annotation, whereas defini-
tions based on sequence similarity are likely to change less
frequently. A limitation to this design is that a gene nested in
the intron of another gene can be difficult to distinguish from
an alternative exon in the absence of junction information.
We have based our microarray design on FlyBase v3.1 anno-
tation [36]. To keep pace with annotation updates, we have
developed software that tracks the latest FlyBase annotation
of the probes comprising our microarrays (or any other oligo-
nucleotides). This insures that, as the understanding of the
genome evolves, the classification of probes can be updated as
well. The result is a flexible platform that will enable
researchers to perform simultaneous analysis of transcription
Sex-specific amplification of alternative transcripts from nine genes that showed significant sex by probe interaction in the microarray data (unc-13, mud, jupiter, r, aret, CG4662, CG10899, garz, Akap200; see Table 3)Figure 2
Sex-specific amplification of alternative transcripts from nine genes that showed significant sex by probe interaction in the microarray data (unc-13, mud,
jupiter, r, aret, CG4662, CG10899, garz, Akap200; see Table 3). The graph shows the average CTs for each exon junction in males and females of the
OregonR line. CT values were calculated by performing qPCR with SYBR
®
Green I dye chemistry on three bioreplicates consisting of four virgin males and
females, and correspond to the number of cycles when the fluorescence intensity was significantly above background during the exponential phase of
amplification; dark blue, male transcript 1; light blue, male transcript 2; green, male transcript 3; red, female transcript 1; pink, female transcript 2; orange,
female transcript 3.
20
25
30
35
40
unc-1
3
mu
d
j
upiter
r
are
t
CG466
2
CG1089
9
g
arz
Akap20
0
R79.8 Genome Biology 2006, Volume 7, Issue 8, Article R79 McIntyre et al. />Genome Biology 2006, 7:R79
and alternative transcript production on a genome-wide
basis.
Sex-specific gene expression
A very large fraction of the genome appears to be differen-
tially expressed between males and females. In our experi-
ments, 53% of all expressed genes (5,832 out of 10,933,
including 291 unannotated genes) showed sex-biased expres-
sion. Other studies utilizing different microarray platforms
produced very similar estimates [19,37-42]. It is worth
observing that all these studies, like ours, were performed in
sexually mature, intact adults, and it is not surprising that
gene expression profiles at this stage are dominated by the
reproductive differences between males and females. It is
clear, however, that most of the sexual dimorphism in gene
expression is due to the germline. Comparisons of gonadect-
omized adults, or adults in which germ cells have been genet-
ically ablated, produce much lower estimates of sexual
dimorphism, on the order of 1.5% to 3% [1,41]. Sexually
dimorphic gene expression is much more prevalent in the
germline than in the soma not only in Drosophila, but also in
Caenorhabditis elegans [43-45] and in the mouse [46]. This
pattern is observed despite the differences in the mechanisms
of sex determination in these taxa: in flies, the sex of each
individual somatic cell is determined autonomously [47],
whereas in mammals somatic sexual differentiation is con-
trolled by a global hormonal mechanism [48].
We find that more genes show female-biased than male-
biased expression (55% versus 45%). This result is in agree-
ment with some of the previous reports [39], although other
studies suggest that male-biased expression is more common
than female-biased expression [41]. The reasons for this con-
tradiction are not clear, and could in principle include differ-
ent lines, different microarray platforms, and/or different
statistical approaches. However, many of the genes that
showed significant differences in expression between males
and females in our experiments were also found to be sexually
dimorphic in other studies [19,37-40]. Interestingly, we
found that female-biased genes were much more likely to be
located on the X chromosome than male-biased genes (18.5%
versus 11.5% for single-transcript genes and 20.4% versus
10.9% for alternatively spliced genes; P < 0.0001). Similar
'feminization' of the X chromosome has previously been
observed in Drosophila [40,41] and C. elegans [44,45].
We found that only two genes, modulo and CG33092, show
significant sex differences that change depending on the line
examined (that is, have genetic variation for sex dimor-
phism). In contrast, some earlier reports suggested that as
much as 10% of the genome may show such sex-genotype
interactions [37,38]. This is despite the fact that the lines used
in this study included the two parental lines used in one of
these studies [38], as well as recombinant inbred lines
derived from these two parents. The most likely reason for
this is that significance thresholds used in our analysis were
much more stringent than in previous reports. In fact, if we
use the nominal significance threshold of 0.01, as in those
reports, we find approximately the same proportions of genes
showing sex-by-line interactions (not shown). We have cho-
sen to report FDR-corrected thresholds since this approach
incorporates an appropriate correction for multiple testing. It
is also important to note that this study examines a limited
number of lines, the two parents OregonR and 2b and six
recombinant offspring from these two parents. The extent of
alternative transcript production among lines will only be
clear as more lines are sampled.
Evidence for functional consequences of alternative
splicing
A large proportion of multi-exon genes in animal genomes are
alternatively spliced, with estimates ranging from 30% to
over 90% [20-24]. Alternative splicing is thought to make a
significant contribution to phenotypic complexity by allowing
a single locus to produce multiple, and possibly functionally
distinct, proteins [49-52]. Supporting this view, many of the
Table 4
Reliability of arrays (weighted kappa values [79]) based upon 20,265 probe spots
Comparison Min Q1 Median Q3 Max
Overall (probes representing genes) 0.77 0.84 0.86 0.88 0.92
Alternative transcripts 0.78 0.84 0.87 0.88 0.92
Gene families 0.78 0.84 0.87 0.88 0.92
Pseudo clusters 0.70 0.81 0.84 0.87 0.96
Singletons 0.76 0.83 0.86 0.87 0.91
GC percentage 0.70 0.83 0.86 0.88 0.93
Tm 0.70 0.83 0.86 0.88 0.93
1 expected probe per cluster 0.77 0.84 0.86 0.88 0.92
2 to 5 expected probes per cluster 066 0.84 0.87 0.89 0.93
Suboptimal probes 0.74 0.80 0.83 0.85 0.90
1 transcript per probe 0.77 0.83 0.86 0.88 0.92
2 to 5 transcripts per probe 0.77 0.85 0.87 0.89 0.95
Genome Biology 2006, Volume 7, Issue 8, Article R79 McIntyre et al. R79.9
comment reviews reports refereed researchdeposited research interactions information
Genome Biology 2006, 7:R79
alternatively spliced genes in the human genome are spliced
in a tissue-specific manner [25]. In Drosophila, alternative
splicing plays a prominent role in development, most notably
by controlling sex determination [53-55]. In at least some
Drosophila genes, alternative splicing is regulated in a sex-,
tissue-, and/or stage-specific manner, so that different sub-
sets of proteins encoded by the locus are produced in different
developmental contexts [53,56-61]. Alternatively spliced pro-
tein isoforms can, at least sometimes, have distinct functional
specificities. For example, alternative isoforms of the lola
transcription factor have different functional domains, and
mutations affecting the different isoforms have distinct phe-
notypes [57]. Similarly, one of the alternatively spliced tran-
scripts of the Drosophila tyrosine hydroxylase (pale) is
required for cuticle development, while a different transcript
functions primarily in neurotransmission [62]. One dramatic
Table 5
Sex-biased expression of splicing regulators
CG# Symbol FlyBase ID Ratio (F/M) P (sex) FDR
CG10279 Rm62 FBgn0003261 1.22 1.99 × 10
-29
<0.05
CG10851 B52 FBgn0004587 1.22 1.36 × 10
-25
<0.05
CG5442 SC35 FBgn0040286 1.20 6.67 × 10
-24
<0.05
CG10445 CG10445 FBgn0037531 1.55 1.12 × 10
-23
<0.05
CG16901 sqd FBgn0003498 1.09 6.95 × 10
-22
<0.05
CG8144 ps FBgn0026188 0.87 6.48 × 10
-21
<0.05
CG9696 dom FBgn0020306 1.17 1.44 × 10
-19
<0.05
CG5728 CG5728 FBgn0039182 0.80 3.09 × 10
-18
<0.05
CG7437 mub FBgn0014362 1.21 1.14 × 10
-17
<0.05
CG7185 CG7185 FBgn0035872 1.33 3.34 × 10
-17
<0.05
CG11360 CG11360 FBgn0039920 1.27 4.42 × 10
-14
<0.05
CG12759 Dbp45A FBgn0010220 1.23 4.66 × 10
-14
<0.05
CG16941 CG16941 FBgn0038464 1.21 6.94 × 10
-14
<0.05
CG4528 snf FBgn0003449 1.21 2.15 × 10
-13
<0.05
CG6841 CG6841 FBgn0036828 1.28 2.4 × 10
-13
<0.05
CG4602 Srp54 FBgn0024285 1.23 7.93 × 10
-13
<0.05
CG6197 CG6197 FBgn0033859 1.26 1.31 × 10
-12
<0.05
CG12924 CG12924 FBgn0033450 1.25 1.57 × 10
-12
<0.05
CG6999 CG6999 FBgn0030085 0.79 2.11 × 10
-12
<0.05
CG3193 crn FBgn0000377 1.23 2.14 × 10
-11
<0.05
CG13425 bl FBgn0015907 1.06 5.31 × 10
-11
<0.05
CG9998 U2af50 FBgn0005411 1.17 5.94 × 10
-11
<0.05
CG12749 Hrb87F FBgn0004237 1.13 6.24 × 10
-11
<0.05
CG3582 U2af38 FBgn0017457 1.22 1.15 × 10
-10
<0.05
CG31762 aret FBgn0000114 1.08 2.23 × 10
-10
<0.05
CG5422 Rox8 FBgn0005649 1.23 1.63 × 10
-09
<0.05
CG8019 hay FBgn0001179 1.18 5.74 × 10
-09
<0.05
CG5454 CG5454 FBgn0038667 1.14 1.38 × 10
-08
<0.05
CG10418 CG10418 FBgn0036277 1.17 2.12 × 10
-08
<0.05
CG8749 snRNP70K FBgn0016978 1.16 5.44 × 10
-08
<0.05
CG14641 CG14641 FBgn0037220 1.11 3.31 × 10
-07
<0.05
CG2926 CG2926 FBgn0037344 1.10 3.57 × 10
-06
<0.05
CG10210 tst FBgn0039117 1.15 4.91 × 10
-06
<0.05
CG9075 eIF-4a FBgn0001942 1.06 2.79 × 10
-05
<0.05
CG12085 pUf68 FBgn0028577 1.04 0.006741 <0.05
CG1646 CG1646 FBgn0039600 1.03 0.050962 <0.10
CG1658 Doa FBgn0053553 0.99 0.306628 >0.20
The CG number, symbol and Flybase ID are given. The ratio (female/male (F/M)) is a ratio of log transformed signal values (natural log). P (sex) is the
P value for the test of the null hypothesis that the males and females have the same amount of transcript. FDR gives the level at which that P value
would be significant according to the Benjamini and Hochberg 1995 criteria [80].
R79.10 Genome Biology 2006, Volume 7, Issue 8, Article R79 McIntyre et al. />Genome Biology 2006, 7:R79
example of alternative splicing is the cell adhesion receptor
Dscam, which may produce up to 38,016 splicing variants
[63,64]. Recent evidence indicates that specific isoforms
function in distinct axon guidance pathways [65]. However,
evidence of the functional impact of alternative splicing
remains largely anecdotal, and for the vast majority of genes
functional comparisons between alternatively spliced vari-
ants are yet to be performed. At present, the extent to which
alternative splicing contributes to functional protein diversity
remains a matter of speculation. Exon-specific RNA interfer-
ence [66] may finally allow this question to be addressed in a
systematic manner.
We used the new microarray platform to estimate the extent
of sex-specific production of alternative transcripts in the
Drosophila genome. Approximately 22% of multi-transcript
genes showed significant evidence that alternative transcripts
were present in different ratios in males versus females. Some
of these results might be experimental artifacts due to techni-
cal differences between probes, or mistakes in the current
gene annotation. To address this concern, we used identified
multiple probes that were predicted to hybridize to the same
target transcripts as controls. Significant interactions
between sex and probe will provide an estimate of the maxi-
mum proportion of significant tests that might be due to dif-
ferences among probes, or problems with annotation. We
found this proportion to be less than 10%, suggesting that at
least 12% of all genes that produce alternative transcripts do
so in a sex-specific manner. qPCR with primer pairs flanking
alternative exon junctions confirmed sex-biased splicing for
eight out of nine tested genes, indicating that exon-specific
microarray probes provide a reliable means of detecting vari-
ation in the relative abundance of alternative transcripts. As
in the case of sex-biased transcription, we suspect that much
of the sex-specific splicing may be accounted for by reproduc-
tive tissues, and that most differences between males and
females are likely to be quantitative rather than qualitative.
Despite these qualifications, the prevalence of sexual differ-
ences in the production of alternative transcripts may have
important functional consequences, and needs to be investi-
gated in greater detail.
The Drosophila genome contains a number of RNA-binding
proteins that function as splicing regulators in vivo [67].
Importantly, some of these proteins appear to be required for
alternative splicing. In particular, several of them are essen-
tial components of protein complexes that carry out sex-spe-
cific splicing of dsx and Sxl [68-71], while RNAi-induced
knock-down of the pasilla and mub genes disrupts the splic-
ing of specific exons in the para and Dscam transcripts [67].
Thus, it is easy to envision a mechanism for sex-, tissue-, and
stage-specific regulation of alternative splicing through dif-
ferential expression of RNA-binding proteins. Indeed, we
found that 95% (35 out of 37) of splicing regulators previously
characterized [67] are expressed at significantly different
levels in males and females at a FDR of 0.05 (Table 5). This
proportion is much greater than the overall frequency of sex-
biased gene expression in the Drosophila genome (approxi-
mately 53% in this study). We hypothesize that sex-specific
expression of splicing regulators contributes to the preva-
lence of sex-specific production of alternative transcripts
observed in our experiments. One attractive use of the new
microarray platform would be to jointly monitor the expres-
sion of splicing regulators and the alternative transcripts of
their target loci in different developmental contexts (tissues,
sexes, and stages) and in different lines.
Materials and methods
Transcript clustering and probe design
Our goal was to design microarray probes capable of distin-
guishing alternative transcripts, as well as members of multi-
gene families. In order to maximize probe specificity, we first
examined sequence similarity among all known and pre-
dicted transcripts of D. melanogaster. Sequences of 18,187
transcripts, including 16,064 transcripts annotated in Fly-
Base [36] and 2,123 predicted transcripts [72], were obtained
in the fall of 2004, and 440 additional transcripts in the
Spring of 2005 (FlyBase version 3.1). Gene and transcript
identity was tracked through all following analyses using their
CG numbers - unique identifiers assigned by the FlyBase [36].
We identified and removed 160 duplicate transcripts. The
remaining 18,027 transcripts were compared among them-
selves using BLAT v29 [73] to identify regions of sequence
similarity. This clustering resulted in a division of the tran-
scriptome into two groups - 'singletons' and 'clusters'. The
former group consisted of 13,069 transcripts that did not
show sequence similarity to any other transcript, while the
latter consisted of 4,958 transcripts that showed sequence
similarity to at least one other transcript. We deliberately did
not exclude paralogous genes from this clustering, as we
wished to design probes targeting the most diverged regions
of such genes. Each transcript cluster was aligned using Clus-
talW v1.8 [74]. Sequences that were shared by two or more
transcripts were designated as 'common' regions, while
regions that showed no similarity to other transcripts were
designated as 'unique'. There were many possible scenarios
for the alignment of transcripts within a cluster, some of
which are illustrated in Figure 3. Some clusters displayed
more complex relationships, including cases where the tran-
scripts had no single region that was common to all of them,
but did have several regions that were each shared by a differ-
ent subset of transcripts. In these and other difficult cases,
sequence alignments were performed manually. No a priori
information about the exon/intron structure of the genes was
used during cluster alignment. The overall set of 4,958 clus-
tered transcripts contained 2,720 common and 2,545 unique
regions. For most transcript clusters, common and unique
regions identified by sequence alignment correspond to con-
stitutively and alternatively spliced exons, respectively. Some
examples of this correspondence are shown in Figure 1.
Genome Biology 2006, Volume 7, Issue 8, Article R79 McIntyre et al. R79.11
comment reviews reports refereed researchdeposited research interactions information
Genome Biology 2006, 7:R79
For each singleton transcript, and each unique and common
region of clustered transcripts, we designed at least one 60-
mer oligonucleotide probe. For 1,929 common regions of suf-
ficient length to support non-overlapping probes that fit our
design criteria, we designed two probes per region. To select
the probes, we examined all possible 60-mers for each of the
target regions, and scored each candidate based on several
criteria, including GC content, OligoArray 2.1 score [75],
homopolymer length, dimer formation, and self-complemen-
tarity. Probes that satisfied all optimality criteria could be
designed for all but 312 target regions. For those regions,
multiple non-optimal probes were selected. All probes were
examined to verify that they matched only the expected
regions in the current version of Drosophila genome annota-
tion, and subjected to a final BLAT verification. In particular,
probes that were designed for singletons or unique regions
were checked to make sure they did not match any other tran-
scripts, whereas probes that were designed to represent com-
mon regions were confirmed to match only the expected set of
transcripts.
The resulting microarray design included 12,994 probes that
targeted singleton transcripts (Table 6). If the current Fly-
Base annotation is correct, these transcripts represent genes
that are not subject to alternative splicing. Most of these tran-
scripts (12,912) were each represented by a single probe,
while 37 were represented by multiple probes (for a total of 82
probes). Clustered transcripts were subdivided into two fur-
ther categories. The smaller category consisted of 177 clusters
where at least one probe matched more than one CG number
in the latest FlyBase annotation. Each of these clusters was
assumed to represent a paralogous 'gene family', and probes
Examples of transcript clusteringFigure 3
Examples of transcript clustering. Transcripts were clustered by BLAT and then aligned in ClustalW. Some of the more common clustering patterns are
depicted. (a) Two transcripts, each with a unique region of at least 80 bases and a common region of at least 80 bases; (b) two transcripts, each with a
unique region of at least 80 bases, and a common region between 40 and 79 bases; (c) two transcripts with a common region of at least 80 bases, a unique
region of at least 80 bases and a unique region of at least 50 bases; (d) two sequences with a gapped alignment.
Sequence #2
Sequence #1
A 60-mer probe unique to sequence #1 is
designed from this region.
A 60-mer probe unique to the common
overlap is designed from this region.
A 60-mer probe unique to sequence #2 is
designed from this region.
80+ bases
80+ bases
80+ bases
Sequence #2
Sequence #1
A 60-mer probe unique to sequence #1 is
designed from this region.
A 60-mer probe unique to the extended
(10 bp from either side) overlap is
designed from this region.
A 60-mer probe unique to sequence #2 is
designed from this region.
40-79 bases
80+ bases
50-79 bases
Sequence #2
Sequence #1
A 60-mer probe unique to sequence #1 is
designed from this region.
A 60-mer probe unique to the overlap is
designed from this region.
A 60-mer probe unique to
sequence #2 is designed from
this extended region.
80+ bases
Sequence #2
Sequence #1
Common design regions.
Seq. #2 design region.
80+ bases
80+ bases
Seq #2 does not exist in this
region
80+ bases
80+ bases
Seq. #1 design regions.
80+ bases
(a)
(b)
(c)
(d)
R79.12 Genome Biology 2006, Volume 7, Issue 8, Article R79 McIntyre et al. />Genome Biology 2006, 7:R79
targeting common and unique sequences were designed for
each such cluster for a total of 566 probes. In the larger
category, 2,768 clusters represented by 7,207 probes each
consisted of multiple transcripts designated by the same CG
number in FlyBase, and thus corresponded to the same gene
(Table 6). We refer to such genes as 'alternative transcripts',
as in some cases the production of multiple transcripts is due
not to differential splicing, but rather to utilization of differ-
ent transcription initiation or termination sites. The alterna-
tive transcripts were targeted by probes belonging to two
distinct types. Again, 'common' probes represent sequences
found in more than one transcript, while 'unique' probes rep-
resent sequences found in only one transcript. Probes com-
mon to all transcripts in a cluster were designated as 'global',
while those representing only a subset of transcripts, or a sin-
gle transcript, were designated as 'local'.
We used the human genome to design 20 negative control
probes according to the same criteria as the Drosophila
probes. These probes were compared to the Drosophila
genome sequence to verify that they had no sequence similar-
ity to any D. melanogaster genes. Five of these negative con-
trols were randomly chosen for printing, and each was placed
on the microarray one hundred times. At the end of the design
there were an additional 3 spots available upon which nega-
tive controls were placed, for a total of 503 negative control
spots. These negative controls allow us to estimate the distri-
bution of signal intensities for probes that fail to hybridize,
and to make present/absent calls for each transcript.
The microarray printed according to our design by Agilent
Technologies had a total of 22,575 spots, including 20,768
spots representing Drosophila transcripts, 503 negative con-
trol spots, and 1,304 Agilent controls (Table 6). These chips
can be ordered from Agilent directly by quoting the AMADID
number 012798.
Annotation and update procedure
Genome annotation changes as gene prediction methods
improve and more experimental data become available. To
allow the microarrays to be regularly updated to reflect these
changes, we have written an automated annotation program
that tracks the identity of each probe in the current version of
FlyBase, and reports how many transcripts match this probe
and whether this set is concordant with the expected design.
We output all matches between probes and transcripts and
then reduce this information to one row per probe, with a col-
umn that lists all matches for that probe. Detailed annotation
is extracted for the first match, using CG numbers to identify
which gene(s) are targeted by each probe. Other columns
enumerate the number of transcripts predicted for that CG in
the current annotation, the number of transcripts the partic-
ular probe matches, the number of probes for that CG in the
current microarray design, and whether the probe aligns with
the gene with which it was originally designed to align. In this
last column, four different designations may be given: 'match'
(probe aligns with the same CG as expected), 'mismatch' (a
different CG than expected), 'extended' (same CG as
expected, but the probe hits more transcripts of that CG than
expected), and 'not found' (no matches to any transcripts in
the current FlyBase). Since the initial design includes pre-
dicted but unconfirmed genes, we expect that some probes
will not be found in the current database. Additionally, probes
are categorized into one of the following groups: 'singletons'
(one match per probe), 'gene families' (match to more than
one CG number), 'alternative transcripts' (one CG number
represented by multiple common and unique regions), and
'pseudo-clusters' (more than one probe representing a single
transcript). If two or more probes in an alternative transcript
or gene family hit the same target region in the current anno-
tation file, these probes were considered part of a 'set'. Each
such set can then be classified as 'global' (expected hybridiza-
tion to all transcripts of a particular transcript identified by a
CG designation), or 'local' (expected hybridization to a subset
of alternative transcripts of a specific CG designation).
Drosophila lines and RNA sample preparation
Experiments were conducted on flies from two standard lab-
oratory strains of D. melanogaster: OregonR [76] and 2b
[77], and six randomly chosen recombinant inbred (RI) lines
derived from these parental lines [78]. Each of the 8 lines was
grown in 4 separate replicates of small mass-matings contain-
Table 6
Microarray design
Total number of probes Total number of genes Probes detected Genes detected
Singletons 1 probe 12,912* 12,912 8,265 8,265
Singletons >1 probe82374527
Gene families 566 177 436 162
Alternative transcripts 7,207 2,768 5,128 2,479
Negative controls 503 5 - -
Agilent controls 1304 - - -
Total 22,574 15,894 13,874 10,933
The total number of probes and genes in each of the main categories, as well as the number of probes and genes detected in our experiment, are
shown. *One singleton probe (of the same sequence) was printed in two duplicate spots.
Genome Biology 2006, Volume 7, Issue 8, Article R79 McIntyre et al. R79.13
comment reviews reports refereed researchdeposited research interactions information
Genome Biology 2006, 7:R79
ing, on average, 20 adults, with a sex ratio of 1:1. Bottles were
maintained at 25°C with a 12:12 hour light:dark cycle, and the
parents were removed after 3 days. We collected 20 virgin
males and females within 24 hours from each replicate, trans-
ferred separately to fresh vials, and maintained for 3 days.
After the maturation period, the virgin adult females and
males were snap-frozen in liquid nitrogen for total RNA
extraction.
RNA was extracted from each sample using Trizol reagent
(Invitrogen Carlsbad, California, USA) according to the man-
ufacturer's instructions, and purified using RNAeasy Kit
(Qiagen, Valencia, CA, USA). RNA concentration was deter-
mined using NanoDrop Spectrophotometer (NanoDrop
Technologies, Inc. Wilmington, DE USA), and the sample
quality was examined using the Agilent 2100 Bioanalyzer
(Agilent Technologies, Inc. Palo Alto, CA USA). We used 500
ng of RNA from each sample for the microarray experiment.
Microarray hybridization and signal detection
Fluorescent cRNA was synthesized using the Aglient low RNA
input fluorescent linear amplification kit following the manu-
facturer's protocol. Briefly, first and second strand cDNA was
synthesized from 500 ng total RNA using an oligo dT-pro-
moter primer and reverse transcriptase. Next, cRNA was syn-
thesized using a T7 RNA polymerase, which simultaneously
incorporates cyanine 3- or cyanine 5-labeled CTP. Labeled
RNA was cleaned using Qiagen RNeasy columns and cRNA
yield was quantified on a NanoDrop ND-1000 spectropho-
tometer. We pooled 750 ng of each labeled sample and
hybridized to the arrays following the manufacturer's proto-
col. Hybridizations were performed with males and females
of the same line labeled in contrasting dyes and hybridized to
the same chip. We analyzed four independent biological rep-
licates for each line and sex combination. For two of these
replicates, males were labeled with Cy3 and females with Cy5,
whereas for the other two the dyes were reversed. No techni-
cal replicates were performed as reliability of the Agilent plat-
form is, on average, above 90% (unpublished data by LMM,
MLW, SVN, LH, AK). This design maximizes the ability to test
for sex effects (NIH project 5R24GM065513), and ensures
that effects of sex remain balanced in the event of chip failure.
Microarray experiments were carried out at the Interdiscipli-
nary Center for Biotechnology Research Microarray Core,
University of Florida. Hybridization occurred for 17 hours at
60°C in accordance with the manufacturer's instructions, and
arrays were scanned using an Agilent Microarray scanner.
There were seven technical failures, which were unrelated to
the platform, leaving 25 successful hybridizations. Addition-
ally, Agilent reported a manufacturing error that affected
2,310 spots on each chip, including 150 of the 503 negative
controls. The failed chips and defective spots were removed
from further consideration.
Images were analyzed using Imagene software version 6.0 at
the Purdue University Genomics Database Facility. Spots
were individually quantified, and the mean intensities and
mean background signal corresponding to each spot were
exported into .csv files. As with other chip analysis software,
in Imagene, the units are a function of pixel intensity. Individ-
ual files were collated for analysis at the Purdue University
Genomics Database Facility. Transcript abundance was esti-
mated as the natural log of the spot mean minus the mean of
the local background.
All spots on the array were compared between pairs of biolog-
ical replicates to determine the reproducibility of RNA labe-
ling and hybridization. Weighted kappa values ranged from
0.754 to 0.906, with a median of 0.85 (Table 4), indicating
that our platform had high repeatability; in general, weighted
kappa values above 0.75 are considered excellent [79]. Fol-
lowing this overall assessment, we examined repeatability for
subsets of probes to determine whether any of the known var-
iables (including GC content, Tm, Oligoarray score, the
number of probes per CG, the number of transcripts per
probe, and whether the probe hybridized to multiple CGs)
affected the reproducibility of hybridization. For most com-
parisons, these variables had little to no impact on the con-
cordance among replicates. Additionally, the few probes that
were designed outside of the usual stringent criteria did not
perform worse than the optimally designed probes (median
weighted kappa of 0.83). However, there were three large
clusters of alternative transcripts (consisting of 11, 16, and 26
transcripts) that produced inconsistent results across
replicates.
We then examined the distribution of signal intensities for the
353 negative control spots. These spots form the null distribu-
tion of intensity values for a given slide and dye combination
in the absence of hybridization. Individual Drosophila probes
were declared to have hybridized if the intensity of that spot
was greater than the intensity of 95% of the negative controls
for that slide and dye combination. Probes were considered to
be detected for a particular treatment (that is, line/sex com-
bination) if they hybridized in 50% or more of the replicates
of that treatment. Probes that were not detected in at least
one treatment were considered uninformative, and not con-
sidered further. The 20,265 available spots represented three
groups of probes: Agilent controls (1,172 spots), negative
hybridization controls (353 spots), and Drosophila probes
(18,740 spots). There were 13,874 Drosophila probes (74%)
found to hybridize in at least one treatment, including 187 of
the 311 suboptimal probes (Table 6). Of the 2,156 probes
designed for predicted genes, 963 showed detectable hybrid-
ization, confirming the existence of predicted transcripts. Of
the 13,874 probes that were detected in at least one treat-
ment, 5,128 represented alternative transcripts (2,479
genes), 436 represented gene families (162 genes), 45 repre-
sented pseudo-clusters (27 genes), and 8,265 represented
singleton transcripts (8,265 genes). The data discussed in this
R79.14 Genome Biology 2006, Volume 7, Issue 8, Article R79 McIntyre et al. />Genome Biology 2006, 7:R79
publication have been deposited in NCBIs Gene Expression
Omnibus and are accessible through GEO Series accession
number GSE4976.
Statistical analyses
For genes that had more than one informative transcript, the
following ANOVA model for multiple transcripts was fitted
for each CG:
Y
ijkl
= µ + d
i
+ t
j
+ p
k
+ tp
jk
+ ε
ijkl
where Y
ijkl
is the transcript abundance for dye i, treatment j,
probe set k, and replicate l; µ is the overall mean of the tran-
script abundance for that CG; d is the dye effect; p is the effect
of probe set; and ε is the error. A treatment (t) in this case is a
combination of line and sex, and there were a total of 16 treat-
ments since we examined 2 sexes for each of 8 lines. The
ANOVA modeling approach compares means among groups,
and determines whether the means are significantly different
given the observed level of variation. To test whether a partic-
ular effect was statistically significant, we used the FDR
approach [80], which is common in genomic research [81-85]
(an introduction can be found in [86]). Briefly, the false dis-
covery rate controls the proportion of false positives in the
total list of tests rejected. Thus, if 100 tests are rejected, and
the FDR is set to 0.05, the expected number of false positives
is 5. First, we tested the main effect of treatment (t
j
). That is,
we tested whether the means were different among any of the
16 line/sex combinations (treatments). If this test was signif-
icant at FDR = 0.05, we declared this gene significant and
investigated further whether the differences were due to sex,
line, or interaction between sex and line effects at a very strict
FDR of 0.05/3. To determine whether the relative amounts of
alternative transcripts differed among sexes or lines, we
tested the interaction between probe set and treatment (tp
jk
)
and, if it was significant at FDR = 0.05, we further examined
whether this was due to interaction between probe and sex or
probe and line effects. For cases where the main effect of
probe set (p
k
) was significant, we compared the effect of 'glo-
bal' probes to each 'local' probe. The multiple transcript
model was also fitted for gene families.
Significant probe-by-sex or probe-by-line interactions might
arise not only as a consequence of genetic variation in alter-
native transcript production, but also as an artifact of intrin-
sic differences between probes. In order to estimate the rate
of such artifacts, we used the model above to examine sets of
probes that were expected to hybridize to the same transcript
or group of transcripts (that is, the same unique region or the
same common region). For such sets of probes, their relative
intensities should, in principle, be identical in all treatments,
and thus no significant probe by treatment interactions
should be observed. By measuring the actual proportion of
the control probe sets for which probe by treatment interac-
tion is significant, we can estimate the rate of putative false
positives. However, it should be noted that the expected
hybridization targets of the probe sets are defined based on
the current annotation, and it is possible that some of the
probes are in fact hybridizing to different transcripts or sets of
transcripts. Thus, this approach will probably over-estimate
the number of false positives.
For genes that had a single informative transcript, the follow-
ing ANOVA model for single transcripts was fitted for each
transcript individually:
Y
ijl
= µ + d
i
+ t
j
+ ε
ijl
Where Y
ijl
is the transcript abundance for dye i, treatment j,
and replicate l; µ is the overall mean of the transcript abun-
dance for that transcript; d is the dye effect; and ε is the error.
As above, a treatment (t) in this case is a combination of line
and sex, and there were a total of 16 treatments since we
examined two sexes for each of 8 lines. [87-92]. Significance
testing was performed as described above. All analyses were
performed using SAS software version 9.1 (SAS Institute,
Cary, NC, USA).
Quantitative PCR analysis for data validation
Total RNA was isolated from whole virgin adults of the Ore-
gon-R line as described above. For each sex, we used three
biological replicates of four individuals each. To correct for
differences in transcript abundance between sexes, samples
were equalized by evaporation and resuspension in DEPC-
treated water (DEPC: Diethyl pyrocarbonate). DNase I diges-
tion (NEB, Ipswich, MA, USA) was carried out for 30 minutes
at 37°C. Reverse transcription was performed on 5 µg of total
RNA using oligo(dT)
16
, as described by the manufacturer
(Applied Biosystems, Foster City, CA, USA). qPCR was per-
formed on 100 ng of cDNA product in a total volume of 25 µl
using TaqMan PCR Mix (Applied Biosystems). Primers for
qPCR were designed to amplify either constitutive or alterna-
tive exon junctions of specific transcripts listed in Additional
file 6. PCR amplification was detected using SYBR
®
Green I
dye chemistry and ABI Prism 7900 Real Time PCR system
(Applied Biosystems). CTs were determined using the
AB7900 system SDS software and defined as the fluorescence
intensity significantly above background during the exponen-
tial phase of amplification for all reactions. For each gene, CT
values were analyzed using the ANOVA model:
Y
ijk
= µ + s
i
+ p
j
+ sp
ij
+ ε
ijk
where Y
ij
is cycle count for the i
th
sex and j
th
transcript for rep-
licate k; µ is the overall mean for that gene and ε is the random
error. Specifically, we tested whether the sex by transcript
interaction effect was significant at a nominal level of 0.05.
All programs developed during this work [93] as well as the
oligonucleotide sequences [94] are freely available.
Genome Biology 2006, Volume 7, Issue 8, Article R79 McIntyre et al. R79.15
comment reviews reports refereed researchdeposited research interactions information
Genome Biology 2006, 7:R79
Additional data
The following additional data are available with the online
version of this paper. Additional data file 1 includes the
microarray results for several sets of genes for which we had
a priori expectations of sex-biased expression. Additional
data file 2 includes the processed microarray data used for
analysis, as well as annotation from FlyBase from our AAP
program. Actual_set_id is the unique identifier for each
probe that hybridizes to the same set of transcripts, and
actuals_cluster_id is a unique identifier that groups probes
based upon CG number. Probeuid is the unique identifier for
that probe sequence. Additional data file 3 provides results of
the analysis, as well as annotations from FlyBase. The P val-
ues obtained from the ANOVA are given with the notation
p<effect>. The CG number is given in actuals and the model
used for analysis (Single transcript/multiple transcript) is
given in the final column. Additional data file 4 gives the
results of analysis based upon the probe level, as well as anno-
tations from FlyBase. Additional data file 5 provides the
probe-by-probe analysis of alternatively spliced genes ana-
lyzed using ANOVA model for multiple transcripts. The col-
umns are, in order: probe ID; gene name; whether
hybridization signal detected by that probe is greater in males
or females; log-transformed female/male expression ratio for
each probe; probe set ID; class of probe (global or local); P
value for the sex by probe set interaction; and the list of tran-
scripts targeted by each probe. See text for further details.
Additional data file 6 includes the qPCR validation of sex-spe-
cific splicing. We give the probe sequences used, all qPCR
results as well as the original array results to facilitate com-
parison. The P values of the likelihood ratio test (LRT) for a
significant probe-sex interaction are also given. Note that for
genes where only one transcript was tested, the test of the
interaction between transcript and sex is not applicable (NA).
Additional data file 1Microarray results for several sets of genes for which we had a pri-ori expectations of sex-biased expressionMicroarray results for several sets of genes for which we had a pri-ori expectations of sex-biased expressionClick here for fileAdditional data file 2Processed microarray data used for analysis, as well as annotation from FlyBase from our AAP programActual_set_id is the unique identifier for each probe that hybrid-izes to the same set of transcripts, and actuals_cluster_id is a unique identifier that groups probes based upon CG number. Probeuid is the unique identifier for that probe sequence.Click here for fileAdditional data file 3Results of the analysis, as well as annotations from FlyBaseThe P values obtained from the ANOVA are given with the notation p<effect>. The CG number is given in actuals and the model used for analysis (Single transcript/multiple transcript) is given in the final column.Click here for fileAdditional data file 4Results of analysis based upon the probe level, as well as annota-tions from FlyBaseResults of analysis based upon the probe level, as well as annota-tions from FlyBaseClick here for fileAdditional data file 5Probe-by-probe analysis of alternatively spliced genes analyzed using ANOVA model for multiple transcriptsThe columns are, in order: probe ID; gene name; whether hybridi-zation signal detected by that probe is greater in males or females; log-transformed female/male expression ratio for each probe; probe set ID; class of probe (global or local); P value for the sex by probe set interaction; and the list of transcripts targeted by each probe. See text for further details.Click here for fileAdditional data file 6qPCR validation of sex-specific splicingWe give the probe sequences used, all qPCR results as well as the original array results to facilitate comparison. The P values of the Likelihood Ratio Test for a significant probe-sex interaction are also given. Note that for genes where only one transcript was tested, the test of the interaction between transcript and sex is not applicable (NA).Click here for file
Acknowledgements
This work was supported by an NIH-GLUE grant 5R24GM065513 to SVN,
LMM, MLW, LH, AK, and by the Purdue University Genomics Database
Facility.
References
1. Arbeitman MN, Fleming AA, Siegal ML, Null BH, Baker BS: A
genomic analysis of Drosophila somatic sexual differentiation
and its regulation. Development 2004, 131:2007-2021.
2. Klebes A, Sustar A, Kechris K, Li H, Schubiger G, Kornber TB: Reg-
ulation of cellular plasticity in Drosophila imaginal disc cells
by the Polycomb group, trithorax group and lama genes.
Development 2005, 132:3753-3765.
3. Reeves N, Posakony JW: Genetic programs activated by prone-
ural proteins in the developing Drosophila PNS. Dev Cell 2005,
8:413-425.
4. Stathopoulos A, Van Drenth M, Erives A, Markstein M, Levine M:
Whole-genome analysis of dorsal-ventral patterning in the
Drosophila embryo. Cell 2002, 111:687-701.
5. Stathopoulos A, Levine M: Whole-genome analysis of Drosophila
gastrulation. Curr Opin Genet Dev 2004, 14:477-484.
6. Cirelli C, Lavaute TM, Tononi G: Sleep and wakefulness modu-
late gene expression in Drosophila. J Neurochem 2005,
94:1411-9.
7. Duffield GE: DNA microarray analyses of circadian timing: the
genomic basis of biological time. J Neuroendocrinol 2003,
15:991-1002.
8. Whitfield CW, Cziko AM, Robinson GE: Gene expression profiles
in the brain predict behavior in individual honey bees. Science
2003, 302:296-299.
9. Meiklejohn CD, Parsch J, Ranz JM, Hartl DL: Rapid evolution of
male-biased gene expression in Drosophila. Proc Natl Acad Sci
USA 2003, 100:9894-9899.
10. Ranz JM, Namgyal K, Gibson G, Hartl DL: Anomalies in the
expression profile of interspecific hybrids of Drosophila mela-
nogaster and Drosophila simulans. Genome Res 2004, 14:373-379.
11. Michalak P, Noor MAF: Association of misexpression with ste-
rility in hybrids of Drosophila simulans and D. mauritiana. J Mol
Evol 2004, 59:277-282.
12. Nuzhdin SV, Wayne ML, Harmon KL, McIntyre LM: Common pat-
tern of evolution of gene expression level and protein
sequence in Drosophila. Mol Biol Evol 2004, 21:1308-1317.
13. Wayne ML, Pan Y-J, Nuzhdin SV, McIntyre LM: Additivity and
trans-acting effects on expression in male Drosophila
simulans. Genetics 2004, 168:1413-1420.
14. Stern DL: Perspective: Evolutionary developmental biology
and the problem of variation. Evolution 2000, 54:1079-1091.
15. Anholt RRH, Mackay TFC: The genetic architecture of odor-
guided behavior in Drosophila melanogaster. Behav Genet 2001,
31:17-27.
16. Rockman MV, Wray GA: Abundant raw material for cis-regula-
tory evolution in humans. Mol Biol Evol 2002, 19:1991-2004.
17. Coffman CJ, Wayne ML, Nuzhdin SV, Higgins LA, McIntyre LM: Iden-
tification of co-regulated transcripts affecting male body size
in Drosophila. Genome Biol 2005, 6:R53.
18. Mackay TFC, Heinsohn SL, Lyman RF, Moehring AJ, Morgan TJ, Roll-
mann SM: Genetics and genomics of Drosophila mating
behavior. Proc Natl Acad Sci USA 2005, 102:6622-6629.
19. Harbison ST, Chang S, Kamdar KP, Mackay TFC: Quantitative
genomics of starvation stress resistance in Drosophila.
Genome Biol 2005, 6:R36.
20. Brett D, Hanke J, Lehmann G, Haase S, Delbruck S, Krueger S, Reich
J, Bork P: EST comparison indicates 38% of human mRNAs
contain possible alternative splice forms. FEBS Letters 2000,
474:83-86.
21. Modrek B, Resch A, Grasso C, Lee C: Genome-wide detection of
alternative splicing in expressed sequences of human genes.
Nucleic Acids Res 2001, 29:2850-2859.
22. Gupta S, Zink D, Korn B, Vingron M, Haas SA: Genome wide iden-
tification and classification of alternative splicing based on
EST data. Bioinformatics 2004, 20:2579-2585.
23. Johnson JM, Castle J, Garrett-Engele P, Kan ZY, Loerch PM, Armour
CD, Santos R, Schadt EE, Stoughton R, Shoemaker DD: Genome-
wide survey of human alternative pre-mRNA splicing with
exon junction microarrays. Science 2003, 302:2141-2144.
24. Mironov AA, Fickett JW, Gelfand MS: Frequent alternative splic-
ing of human genes. Genome Res 1999, 9:1288-1293.
25. Xu A, Park SK, D'Mello S, Kim E, Wang Q, Pikielny CW: Novel
genes expressed in subsets of chemosensory sensilla on the
front legs of male Drosophila melanogaster. Cell Tissue Res 2002,
307:381-392.
26. Baker BS, Nagoshi RN, Burtis KC: Molecular genetic-aspects of
sex determination in Drosophila. Bioessays 1987, 6:66-70.
27. Belote JM, Handler AM, Wolfner MF, Livak KJ, Baker BS: Sex-spe-
cific regulation of yolk protein gene-expression in Drosophila.
Cell 1985, 40:339-348.
28. Burtis KC, Baker BS: Drosophila Doublesex gene controls
somatic sexual-differentiation by producing alternatively
spliced messenger-RNAs encoding related sex-specific
polypeptides. Cell 1989, 56:997-1010.
29. Chapman KB, Wolfner MF: Determination of male-specific
gene-expression in Drosophila accessory-glands. Dev Biol 1988,
126:195-202.
30. Wolfner MF: Tokens of love: Functions and regulation of Dro-
sophila male accessory gland products. Insect Biochem Mol Biol
1997, 27:179-192.
31. Wolfner MF, Harada HA, Bertram MJ, Stelick TJ, Kraus KW, Kalb JM,
Lung YO, Neubaum DM, Park M, Tram U: New genes for male
accessory gland proteins in Drosophila melanogaster. Insect
Biochem Mol Biol 1997, 27:825-834.
32. Carvalho AB, Lazzaro BP, Clark AG: Y chromosomal fertility fac-
tors kl-2 and kl-3 of Drosophila melanogaster encode dynein
heavy chain polypeptides. Proc Natl Acad Sci USA 2000,
R79.16 Genome Biology 2006, Volume 7, Issue 8, Article R79 McIntyre et al. />Genome Biology 2006, 7:R79
97:13239-13244.
33. Dibenedetto AJ, Lakich DM, Kruger WD, Belote JM, Baker BS, Wolf-
ner MF: Sequences expressed sex-specifically in Drosophila
melanogaster adults. Dev Biol 1987, 119:242-251.
34. Schafer U: Genes for male-specific transcripts in Drosophila
melanogaster. Mol General Genet 1986, 202:219-225.
35. Bell LR, Maine EM, Schedl P, Cline TW: Sex-lethal, a Drosophila
sex determination switch gene, exhibits sex-specific RNA
splicing and sequence similarity to RNA-binding proteins.
Cell 1988, 55:1037-1046.
36. FlyBase []
37. Jin W, Riley RM, Wolfinger RD, White KP, Passador-Gurgel G, Gib-
son G: The contributions of sex, genotype and age to tran-
scriptional variance in Drosophila melanogaster. Nat Genet
2001, 29:389-395.
38. Gibson G, Riley-Berger R, Harshman LG, Kopp A, Nuzhdin SV,
Wayne ML: Extensive sex-specific non-additivity in gene
expression in Drosophila melanogaster. Genetics 2004,
167:1791-1799.
39. Ranz JM, Castillo-Davis CI, Meiklejohn CD, Hartl DL: Sex-depend-
ent gene expression and evolution of the Drosophila tran-
scriptome. Science 2003, 300:1742-1745.
40. Parisi M, Nuttall R, Naiman D, Bouffard G, Malley J, Andrews J, East-
man S, Oliver B: Paucity of genes on the Drosophila X chromo-
some showing male-biased expression. Science 2003,
299:697-700.
41. Parisi M, Nuttall R, Edwards P, Minor J, Naiman D, Lu JN, Doctolero
M, Vainer M, Chan C, Malley J, et al.: A survey of ovary-, testis-,
and soma-biased gene expression in Drosophila melanogaster
adults. Genome Biol 2004, 5:R40.
42. Arbeitman MN, Furlon EE, Imam F, Johnson E, Null BH, Baker BS,
Krasnow MA, Scott MP, Davis RW, White KP: Gene expression
during the life cycle of Drosophila melanogaster. Science 2002,
297:2270-2275.
43. Jiang M, Ryu J, Kiraly M, Duke K, Reinke V, Kim SK: Genome-wide
analysis of developmental and sex-regulated gene expres-
sion profiles in Caenorhabditis elegans. Proc Natl Acad Sci USA
2001, 98:218-223.
44. Reinke V, Smith HE, Nance J, Wang J, Van Doren C, Begley R, Jones
SJM, Davis EB, Scherer S, Ward S, et al.: A global profile of germ-
line gene expression in C. elegans. Mol Cell 2000, 6:605-616.
45. Reinke V, Gil IS, Ward S, Kazmer K: Genome-wide germline-
enriched and sex-biased expression profiles in Caenorhabditis
elegans. Development 2004, 131:311-323.
46. Rinn JL, Rozowsky JS, Laurenzi IJ, Petersen PH, Zou KY, Zhong WM,
Gerstein M, Snyder M: Major molecular differences between
mammalian sexes are involved in drug metabolism and renal
function. Dev Cell 2004, 6:791-800.
47. Baker BS, Ridge KA: Sex and the single cell.1. On the action of
major loci affecting sex determination in Drosophila
melanogaster. Genetics 1980, 94:383-423.
48. Swain A, Lovell-Badge R: Mammalian sex determination: a
molecular drama. Genes Dev 1999, 13:755-767.
49. Graveley BR: Alternative splicing: increasing diversity in the
proteomic world. Trends Genet 2001, 17:100-107.
50. Brett D, Pospisil H, Valcarel J, Reich J, Bork P: Alternative splicing
and genome complexity. Nat Genet 2002, 30:29-30.
51. Roberts GC, Smith CWJ: Alternative splicing: combinatorial
output from the genome. Curr Opin Chem Biol 2002, 6:375-383.
52. Zavolan M, Kondo S, Schonbach C, Adachi J, Hume DA, Hayashizaki
Y, Gaasterland T: Impact of alternative initiation, splicing, and
termination on the diversity of the mRNA transcripts
encoded by the mouse transcriptome. Genome Res 2003,
13:1290-1300.
53. Nagoshi RN, McKeown M, Burtis KC, Belote JM, Baker BS: The con-
trol of alternative splicing at genes regulating sexual-differ-
entiation in Drosophila melanogaster. Cell 1988, 53:229-236.
54. Bell LR, Horabin JI, Schedl P, Cline TW: Positive autoregulation of
sex-lethal by alternative splicing maintains the female deter-
mined state in Drosophila. Cell 1991, 65:229-239.
55. McKeown M: Sex differentiation: The role of alternative
splicing. Curr Opin Genet Dev 1992, 2:299-303.
56. Anand A, Villella A, Ryner LC, Carlo T, Goodwin SF, Song HJ, Gailey
DA, Morales A, Hall JC, Baker BS, et al.: Molecular genetic dissec-
tion of the sex-specific and vital functions of the Drosophila
melanogaster sex determination gene fruitless. Genetics 2001,
158:1569-1595.
57. Goeke S, Greene EA, Grant PK, Gates MA, Crowner D, Aigaki T,
Giniger E: Alternative splicing of lola generates 19 transcrip-
tion factors controlling axon guidance in Drosophila. Nat
Neurosci 2003, 6:917-924.
58. Hess NK, Bernstein SI: Developmentally regulated alternative
splicing of Drosophila myosin heavy-chain transcripts - in vivo
analysis of an unusual 3'-splice site. Dev Biol 1991, 146:339-344.
59. Horiuchi T, Giniger E, Aigaki T: Alternative trans-splicing of con-
stant and variable exons of a Drosophila axon guidance gene,
lola. Genes Dev 2003, 17:2496-2501.
60. Kramerova IA, Kramerov AA, Fessler JH: Alternative splicing of
papilin and the diversity of Drosophila extracellular matrix
during embryonic morphogenesis. Dev Dyn 2003, 226:634-642.
61. Tsitilou SG, Grammenoudi S: Evidence for alternative splicing
and developmental regulation of the Drosophila mela-
nogaster Mgat2 (N-acetylglucosaminyltransferase II) gene.
Biochem Biophys Res Comm 2003, 312:1372-1376.
62. Friggi-Grelin F, Iche M, Birman S: Tissue-specific developmental
requirements of Drosophila tyrosine hydroxylase isoforms.
Genesis 2003, 35:260-269.
63. Schmucker D, Clemens JC, Shu H, Worby CA, Xiao J, Muda M, Dixon
JE, Zipursky SL: Drosophila Dscam is an axon guidance recep-
tor exhibiting extraordinary molecular diversity. Cell 2000,
101:671-684.
64. Zhan XL, Clemens JC, Neves G, Hattori D, Flanagan JJ, Hummel T,
Vasconcelos ML, Chess A, Zipursky SL: Analysis of Dscam diver-
sity in regulating axon guidance in Drosophila mushroom
bodies. Neuron 2004, 43:673-686.
65. Chen BE, Kondo M, Garnier A, Watson FL, Puettmann-Holgado R,
Lamar DR, Schmucker D: The molecular diversity of Dscam is
functionally required for neuronal wiring specificity in Dro-
sophila. Cell 2006, 125:607-620.
66. Celotto AM, Lee JW, Graveley BR: Exon-specific RNA interfer-
ence: A tool to determine the functional relevance of pro-
teins encoded by alternatively spliced mRNAs. Methods Mol
Biol 2005, 309:273-282.
67. Park JW, Parisky K, Celotto AM, Reenan RA, Graveley BR: Identifi-
cation of alternative splicing regulators by RNA interference
in Drosphila. Proc Natl Acad Sci USA 2004, 101:15974-15979.
68. Deshpande G, Samuels ME, Schedl PD: Sex-lethal interacts with
splicing factors in vitro and in vivo. Mol Cell Biol 1996,
16:5036-5047.
69. Lynch KW, Maniatis T: Assembly of specific SR protein com-
plexes on distinct regulatory elements of the Drosophila dou-
blesex splicing enhancer. Genes Dev 1996, 10:2089-2101.
70. Salz HK, Flickinger TW: Both loss-of-function and gain-of-func-
tion mutations in snf define a role for snRNP proteins in reg-
ulating Sex-lethal pre-mRNA splicing in Drosophila
development. Genetics 1996, 144:95-108.
71. Tian M, Maniatis T: A splicing enhancer complex controls alter-
native splicing of doublesex pre-mRNA. Cell 1993, 74:105-114.
72. Hild M, Beckmann B, Haas SA, Koch B, Solovyev V, Busold C, Fellen-
berg K, Boutros M, Vingron M, Sauer F, et al.: An integrated gene
annotation and transcriptional profiling approach towards
the full gene content of the Drosophila genome. Genome Biol
2003, 5:R3.
73. Kent WJ: BLAT - The BLAST-like alignment tool. Genome Res
2002, 12:656-664.
74. Thompson JD, Higgins DG, Gibson TJ: Clustal-W - improving the
sensitivity of progressive multiple sequence alignment
through sequence weighting, position-specific gap penalties
and weight matrix choice. Nucleic Acids Res 1994, 22:4673-4680.
75. Rouillard JM, Zuker M, Gulari E: OligoArray 2.0: design of oligo-
nucleotide probes for DNA microarrays using a thermody-
namic approach. Nucleic Acids Res 2003, 31:3057-3062.
76. Lindsley DL, Zimm G: The Genome of Drosophila melanogaster.
San Diego: Academic Press, Inc; 1992.
77. Pasyukova EG, Nuzhdin SV: Doc and Copia instability in an iso-
genic Drosophila melanogaster stock. Mol General Genet 1993,
240:302-306.
78. Nuzhdin SV, Pasyukova EG, Dilda CL, Zeng ZB, Mackay TFC: Sex-
specific quantitative trait loci affecting longevity in Dro-
sophila melanogaster. Proc Natl Acad Sci USA 1997, 94:9734-9739.
79. Fleiss JL: Statistical Methods for Rates and Proportions New York: John
Wiley and Sons; 1981.
80. Benjamini Y, Hochberg Y: Controlling the false discovery rate -
a practical and powerful approach to multiple testing. J Roy
Stat Soc B Methodol 1995, 57:289-300.
81. Weller JI, Song JZ, Heyen DW, Lewin HA, Ron M: A new approach
Genome Biology 2006, Volume 7, Issue 8, Article R79 McIntyre et al. R79.17
comment reviews reports refereed researchdeposited research interactions information
Genome Biology 2006, 7:R79
to the problem of multiple comparisons in the genetic dis-
section of complex traits. Genetics 1998, 150:1699-1706.
82. Tusher VG, Tibshirani R, Chu G: Significance analysis of micro-
arrays applied to the ionizing radiation response. Proc Natl
Acad Sci USA 2001, 98:10515-10515.
83. Storey JD, Tibshirani R: Statistical significance for genomewide
studies. Proc Natl Acad Sci USA 2003, 100:9440-9445.
84. Sabatti C, Service S, Freimer N: False discovery rate in linkage
and association genome screens for complex disorders.
Genetics 2003, 164:829-833.
85. Peng JH, Ronin Y, Fahima T, Roder MS, Li YC, Nevo E, Korol A:
Domestication quantitative trait loci in Triticum dicoc-
coides, the progenitor of wheat. Proc Natl Acad Sci USA 2003,
100:2489-2494.
86. Verhoeven KJF, Simonsen KL, McIntyre L: Implementing false dis-
covery rate control: increasing your power. Oikos 2005,
109:208-208.
87. Wayne ML, McIntyre LM: Combining mapping and arraying: An
approach to candidate gene identification. Proc Natl Acad Sci
USA 2002, 99:14903-14906.
88. Wolfinger RD, Gibson G, Wolfinger ED, Bennett L, Hamadeh H,
Bushel P, Afshari C, Paules RS: Assessing gene significance from
cDNA microarray expression data via mixed models. J Comp
Biol 2001, 8:625-637.
89. Oleksiak MF, Churchill GA, Crawford DL: Variation in gene
expression within and among natural populations. Nat Genet
2002, 32:261-266.
90. Singh AK, McIntyre LM, Sherman LA: Microarray analysis of the
genome-wide response to iron deficiency and iron reconsti-
tution in the cyanobacterium Synechocystis sp PCC 6803.
Plant Physiol 2003, 132:1825-1839.
91. Kerr MK, Churchill GA: Experimental design for gene expres-
sion microarrays. Biostatistics 2001, 2:183-201.
92. Kerr MK, Churchill GA: Statistical design and the analysis of
gene expression microarray data. Genetical Res 2001,
77:123-128.
93. Design of a Whole Genome Drosophila Chip [http://
www.genomics.purdue.edu/services/droschip/]
94. Agilent Annotation Program [
due.edu/services/software/aap.shtml]