Báo cáo y học: "The human urinary proteome contains more than 1500 proteins, including a large proportion of membrane proteins" pptx
Bạn đang xem bản rút gọn của tài liệu. Xem và tải ngay bản đầy đủ của tài liệu tại đây (526.34 KB, 16 trang )
Genome Biology 2006, 7:R80
comment reviews reports deposited research refereed research interactions information
Open Access
2006Adachiet al.Volume 7, Issue 9, Article R80
Research
The human urinary proteome contains more than 1500 proteins,
including a large proportion of membrane proteins
Jun Adachi
*†‡
, Chanchal Kumar
*
, Yanling Zhang
*§
, Jesper V Olsen
*†
and
Matthias Mann
*†
Addresses:
*
Department of Proteomics and Signal Transduction, Max-Planck Institute for Biochemistry, Am Klopferspitz, D-82152
Martinsried, Germany.
†
Center for Experimental Bioinformatics, University of Southern Denmark, Campusvej, DK-5230 Odense M, Denmark.
‡
Current address: Graduate School of Global Environmental Studies, Kyoto University, Yoshida-Honmachi Sakyo-Ku, Kyoto, Japan.
§
Beijing
Institute of Genomics, Chinese Academy of Sciences, Beijing 101300, China.
Correspondence: Matthias Mann. Email:
© 2006 Adachi et al.; licensee BioMed Central Ltd.
This is an open access article distributed under the terms of the Creative Commons Attribution License ( which
permits unrestricted use, distribution, and reproduction in any medium, provided the original work is properly cited.
The urinary proteome<p>A high confidence set of proteins in urine from healthy donors is described as a reference urinary proteome.</p>
Abstract
Background: Urine is a desirable material for the diagnosis and classification of diseases because
of the convenience of its collection in large amounts; however, all of the urinary proteome catalogs
currently being generated have limitations in their depth and confidence of identification. Our
laboratory has developed methods for the in-depth characterization of body fluids; these involve a
linear ion trap-Fourier transform (LTQ-FT) and a linear ion trap-orbitrap (LTQ-Orbitrap) mass
spectrometer. Here we applied these methods to the analysis of the human urinary proteome.
Results: We employed one-dimensional sodium dodecyl sulfate polyacrylamide gel
electrophoresis and reverse phase high-performance liquid chromatography for protein separation
and fractionation. Fractionated proteins were digested in-gel or in-solution, and digests were
analyzed with the LTQ-FT and LTQ-Orbitrap at parts per million accuracy and with two
consecutive stages of mass spectrometric fragmentation. We identified 1543 proteins in urine
obtained from ten healthy donors, while essentially eliminating false-positive identifications.
Surprisingly, nearly half of the annotated proteins were membrane proteins according to Gene
Ontology (GO) analysis. Furthermore, extracellular, lysosomal, and plasma membrane proteins
were enriched in the urine compared with all GO entries. Plasma membrane proteins are probably
present in urine by secretion in exosomes.
Conclusion: Our analysis provides a high-confidence set of proteins present in human urinary
proteome and provides a useful reference for comparing datasets obtained using different
methodologies. The urinary proteome is unexpectedly complex and may prove useful in biomarker
discovery in the future.
Published: 1 September 2006
Genome Biology 2006, 7:R80 (doi:10.1186/gb-2006-7-9-r80)
Received: 30 May 2006
Revised: 11 July 2006
Accepted: 1 September 2006
The electronic version of this article is the complete one and can be
found online at />R80.2 Genome Biology 2006, Volume 7, Issue 9, Article R80 Adachi et al. />Genome Biology 2006, 7:R80
Background
Urine is formed in the kidney by ultrafiltration from the
plasma to eliminate waste products, for instance urea and
metabolites. Although the kidney accounts for only 0.5% of
total body mass, a large volume of plasma (350-400 ml/100 g
tissue/min) flows into the kidney, generating a large amount
of ultrafiltrate (150-180 l/day) under normal physiologic con-
ditions [1,2]. Components in the ultrafiltrate such as water,
glucose, amino acids, and inorganic salts are selectively reab-
sorbed, and less than 1% of ultrafiltrate is excreted as urine.
Serum proteins are filtered based on their sizes and charges at
the glomeruli [3]. After passing through glomeruli, abundant
serum proteins such as albumin, immunoglobulin light chain,
transferrin, vitamin D binding protein, myoglobin, and recep-
tor-associated protein are reabsorbed, mainly by endocytic
receptors, megalin, and cubilin in proximal renal tubules [4-
8]. Thus, protein concentration in normal donor urine is very
low (less than 100 mg/l when urine output is 1.5 l/day), and
normal protein excretion is less than 150 mg/day. This is
about a factor 1000 less compared with other body fluids such
as plasma. Excretion of more than 150 mg/day protein is
defined as proteinuria and is indicative of glomerular or rea-
bsorption dysfunction.
Urine can be collected in large amounts fully noninvasively.
Therefore, despite the low protein concentration, more than
adequate amounts of material (at least 0.5 mg) can be col-
lected from a single sample, although protein in urine must be
concentrated. This advantage of urine as a body fluid for diag-
nosis also allows collection of samples repeatedly over
lengthy time periods. Furthermore, normal urinary proteins
generally reflect normal kidney tubular physiology because
the urinary proteome contains not only plasma proteins but
also kidney proteins [7,9-13]. Thus, urine is good material for
the analysis of disease processes that affect proximal organs,
such as kidney failure resulting from high blood pressure and
diabetic nephropathy, which is the most frequent cause of
renal failure in the Western world [14].
Urinary proteomics has been conducted by combining vari-
ous protein concentration and protein separation methods as
well as mass spectrometry (MS) technology. In many studies,
two-dimensional gel electrophoresis was employed for pro-
tein separation. One of these studies, that conducted by
Pieper and coworkers [11], identified 150 unique proteins
using two-dimensional gel electrophoresis and both matrix-
assisted laser desorption ionization time-of-flight MS and liq-
uid chromatography (LC)-tandem mass spectrometry (MS/
MS or MS
2
). However, one-dimensional and two-dimen-
sional chromatographic approaches have been used in several
recent studies, resulting in further protein identifications.
Pisitkun and coworkers [9] reported identification of 295
unique proteins from the exosome fraction using one-dimen-
sional gel electrophoresis and LC-MS/MS. Sun and col-
leagues [12] identified 226 unique proteins using one-
dimensional gel electrophoresis plus LC-MS/MS and multidi-
mensional liquid chromatography (LC/LC)-MS/MS. Wang
and coworkers [13] applied concanavalin A affinity purifica-
tion for the enrichment of N-glycoprotein in urine and identi-
fied 225 proteins using one-dimensional gel electrophoresis
plus LC-MS/MS and LC/LC-MS/MS. Recently, Castagna and
colleagues [10] exploited beads coated with a hexametric pep-
tide ligand library for urinary protein concentration and
equalization, and identified 383 unique gene products by LC-
MS/MS using a linear ion trap-Fourier transform (LTQ-FT)
instrument. These researchers combined their set of urinary
proteins with others derived from the literature to yield a total
of about 800 proteins.
Some of these five largest urinary proteome catalogues con-
tain proteins with single peptide identification (>30% of total
identified proteins reported by Pisitkun and coworkers [9])
and lack an assessment of false-positive ratios. Moreover,
proteins identified in these studies seem to be the tip of the
iceberg of the urinary proteome, because nearly 1000 protein
spots separated by two-dimensional gel remain unidentified
[11]. These studies suggest that three steps are especially
important for deep analysis: protein concentration from
urine with minimal loss; protein separation to reduce the
complexity of the protein mixture and remove abundant pro-
teins; and peptide sequencing with high mass accuracy and
rapid scanning.
In the present study, we employed a simple and straightfor-
ward method, namely ultrafiltration, for protein concentra-
tion. For protein separation, one-dimensional gel
electrophoresis or reverse phase column chromatography
was used. For peptide sequencing, we employed methods
recently developed in our laboratory involving the LTQ-FT
and linear ion trap-orbitrap (LTQ-Orbitrap), which have
extremely high mass accuracy [15,16]. The LTQ facilitates
accumulation of a greater number of charges than is possible
with traditional three-dimensional ion traps, and it is suffi-
ciently fast to enable two consecutive stages of mass spectro-
metric fragmentation (MS/MS/MS or MS
3
) on a
chromatographic time scale. The Fourier transform-ion
cyclotron resonance (FTICR) part of the instrument provides
a very high resolution of 100,000 and mass accuracies in the
sub-ppm (parts per million) range using selected ion moni-
toring (SIM) scans. For complex protein samples, the LTQ-FT
was shown to increase the number of high-confidence identi-
fications compared with an LCQ instrument [17]. Together,
high mass accuracy and MS
3
result in dramatically increased
confidence for peptide identification [15] and allow 'rescue' of
protein identifications by single peptides. A novel hybrid
mass spectrometer, the LTQ-Orbitrap [18] also provides a
high mass resolving power of 60,000 and high-accuracy mass
measurements (sub-ppm on average) using a lock mass strat-
egy, even without SIM scans [15].
These techniques enabled us to identify 1543 proteins in urine
from an in-depth study from a single individual and pooled
Genome Biology 2006, Volume 7, Issue 9, Article R80 Adachi et al. R80.3
comment reviews reports refereed researchdeposited research interactions information
Genome Biology 2006, 7:R80
urine obtained from nine individuals, while virtually elimi-
nating false-positive identifications. In the LTQ-FTICR data-
set 337 proteins (26.3% of the total identified proteins) were
identified with single unique peptide using MS
2
and MS
3
.
Around a third of all characterized proteins are annotated as
extracellular proteins. In the total data set we found 488 pro-
teins to be annotated as membrane proteins (47% of all pro-
teins with localization information). Of these proteins, 225
proteins were annotated as plasma membrane proteins
(21.6%). These proteins include water, drug, sodium, potas-
sium, and chloride transporters that are localized in the kid-
ney and regulate homeostasis of body fluids. This high-
confidence collection of proteins present in human urine can
serve as a reference for future biomarker discovery.
Results
Identification of urinary proteins
Normal total protein concentration in urine is very low and
usually does not exceed 10 mg/100 ml in any single specimen
(normal protein excretion is less than 150 mg/day). To con-
centrate and de-salt urinary proteins, various sample prepa-
ration procedures such as ultrafiltration, centrifugation,
reverse-phase separation, dialysis, lyophilization, enrich-
ment of proteins by affinity column or beads, and precipita-
tion using organic solvents have been used [9-13,19-21]. As
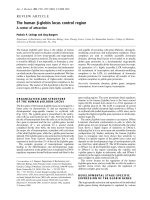
shown in Figure 1, we used an ultrafiltration unit, because it
allows us to concentrate and desalt urine samples in a stand-
ardized way and to minimize protein loss. Furthermore, the
molecular weight cut-off of the ultrafiltration membrane is 3
kDa, leading to removal of low-molecular-weight polypep-
tides, which are abundant in human urine samples [22,23].
Using the ultrafiltration unit, urine was concentrated about
50-fold. Concentrated protein from single urine sample was
separated by one-dimensional sodium dodecyl sulfate (SDS)-
polyacrylamide gel electrophoresis (PAGE) and reverse phase
high-performance liquid chromatraphy (HPLC). We applied
crude concentrates to one-dimensional SDS-PAGE (Figure
2a) and cut the gel into 14 or 10 pieces. Protein mixtures were
subjected to in-gel tryptic digestion (in-gel 1 and in-gel 2 sub-
sets). We also applied crude concentrates to a novel macropo-
rous reversed phase column (mRP-C18 high-recovery protein
column), but resolution was poor initially (data not shown).
We therefore depleted human serum albumin from the urine
concentrates using an immuno-affinity column and applied
the albumin-depleted protein mixture to the column, result-
ing in a good resolution with 22 fractions (Figure 2b). Sepa-
rated proteins were denatured by 2,2,2-trifluoroethanol
(TFE) [24,25] or urea and thiourea, and were subsequently
digested as described in the Materials and methods section
(below; in-solution 1 and in-solution 2 subsets). Concentrated
urinary protein from pooled samples was separated by one-
dimensional SDS-PAGE, and excised in 10 slices (pool sub-
set). Digests from each set were desalted and concentrated on
reversed-phase C
18
StageTips [26] and analyzed by LC online
coupled to electrospray MS.
For the single urine sample sets, LC gradients lasted for either
100 or 140 min. The mass spectrometer (LTQ-FTICR) was
programmed to perform survey scans of the whole peptide
mass range, select the three most abundant peptide signals,
and perform SIM scans for high mass accuracy measure-
ments in the FTICR. Simultaneously with the SIM scans, the
linear ion trap fragmented the peptide, obtained an MS/MS
spectrum, and further isolated and fragmented the most
abundant peak in the MS/MS mass spectrum to yield the MS
3
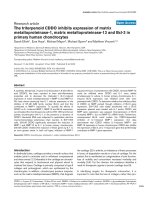
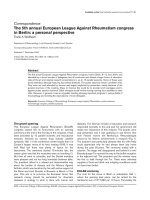
spectrum. Figure 3a shows a spectrum of eluting urine pep-
tides. A selected peptide was measured in SIM mode (Figure
3a) and fragmented (MS
2
; Figure 3b). The most intense frag-
ment in the MS/MS spectrum was selected for the second
round of fragmentation (Figure 3c). As can be seen in the fig-
ure, high mass accuracy, low background level, and additional
peptide sequence information obtained from MS
3
spectra
yielded high-confidence peptide identification. Peak list files
obtained from fractions in each subset were merged and the
peptide sequences were identified from their tandem mass
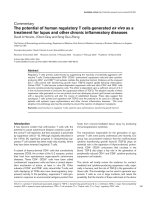
An overview of the procedure used for analysis of the urinary proteomeFigure 1
An overview of the procedure used for analysis of the urinary proteome.
1D, one-dimensional; HPLC, high-performance liquid chromatography;
HSA, human serum albumin; MW, molecular weight; LC, liquid
chromatography; MS, mass spectrometry; SDS, sodium dodecyl sulfate.
Urine 50 - 100 mL
(single or pooled sample)
Centrifugation
(2000 g, 10 min)
Supernatant
Concentration & desalting
Ultrafiltration unit?
M.W. cutoff 3 kDa
(Cenriprep, Millipore)
Protein
separation
1D SDS gel
AGE 4-12% Bis-Tris Gel, invitrogen)
Reverse phase HPLC
(mRP-C18 Column, Agilent)
HSA removal
(Human albumin depletion kit, VIVA science)
In-gel digestion
In-solution digestion
Nano LC-MS/MS/MS
(LTQ-FT and LTQ-Orbitrap, Thermo Electron)
Data analysis
(Mascot, matrix science)
(MSQUANT)
(ProteinCenter, Proxeon)
(peptide database)
R80.4 Genome Biology 2006, Volume 7, Issue 9, Article R80 Adachi et al. />Genome Biology 2006, 7:R80
spectra using a probability based search engine, namely
Mascot [27]. Database searches were performed on 15,919,
16,238, 16,312 and 12,180 MS/MS spectra from in-gel 1, in-
gel 2, in-solution 1 and in-solution 2, respectively (Table 1).
Identified MS
3
spectra were automatically scored with in-
house developed open source software, MSQUANT [15,28].
As described in Materials and methods (below), proteins were
identified using criteria corresponding to a level of false posi-
tives of P = 0.0005 when at least two peptides were identified,
and of P = 0.001 when one peptide was identified. We also
manually checked MS
2
and MS
3
spectra for all proteins iden-
tified by a single peptide.
To test experimentally the false-positive rate in our dataset,
we performed a decoy database search [29]. In this approach
peptides are matched against the database containing for-
ward-oriented normal sequences and the same sequences
with their amino acid sequences reversed. When requiring
the stringent criteria mentioned above, we found no false-
positive protein hits. We therefore conclude that our search
criteria exclude essentially all false positives.
Using the criteria established here, our analysis of four data-
sets, two sets employing in-gel digestion and another two sets
employing in-solution digestion, resulted in the identification
of 8041 unique peptides. In total, 1281 proteins were identi-
fied after the removal of contaminants (keratins, trypsin, and
endoproteinase Lys-C) and redundant proteins.
For the pooled urine sample, 10 slices from a one-dimen-
sional SDS gel separation were analyzed three times per slice
using the LTQ-Orbitrap. A 140 min LC gradient was
employed for each analysis. The mass spectrometer was oper-
ated in the data-dependent mode. Survey full scan MS spectra
(from m/z 300 to 1600) were acquired in the orbitrap and the
most intense ions (up to five, depending on signal intensity)
were sequentially isolated and fragmented in the linear ion
trap (MS/MS). Peak list files obtained from 10 fractions were
processed separately and the peptide sequences were identi-
fied as described above. Proteins were identified with criteria
corresponding to a level of false positives of P = 0.0025 or 1 in
400, which is lower than the total number of proteins in each
slice. In this way, independent analysis of the 10 slices
allowed us to employ a lower threshold without false-positive
identifications, as judged by the decoy database. Altogether,
we identified 1055 proteins from 10 slices for the pooled urine
sample (Table 2).
Of the 8041 peptides identified from urine sample of the sin-
gle person, 772 (9.6%) were found in all four datasets, 856
(10.6%) were found in three of the four datasets, 2089
(26.0%) were found in two of the four datasets, and the
remaining 4324 (53.8%) were found in only one of the four
input datasets (Figure 4). Overlaps between in-gel datasets
and in-solution datasets were deeper than those between in-
gel datasets and an in-solution datasets. Hydrophobicity
value of identified peptides in each subset was calculated
using the Kyte and Doolittle model [30]. Comparing in-gel
specific with in-solution specific peptides, the hydrophobicity
values were -0.24 versus -0.54, with an overall
hydrophobicity of -0.33 in all datasets. The difference
between in-gel and in-solution datasets was not significant
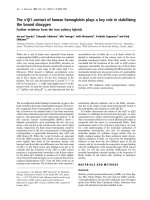
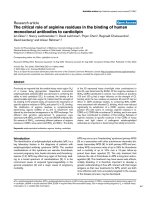
Urinary protein separation by one-dimensional SDS gel and reverse-phase HPLCFigure 2
Urinary protein separation by one-dimensional SDS gel and reverse-phase HPLC. (a) 150 µg urinary protein (25 µg/lane) from single sample and pooled
sample were applied on a 4-12% Bis-Tris gel. Gel was stained by colloidal Coomassie and cut into 14 pieces (in-gel 1 set) or 10 pieces (in-gel 2 set) for
single urine sample, and cut into 10 pieces for pooled urine sample. (b) 250 µg of urinary protein was applied to Vivapure Anti-HSA Kit to deplete serum
albumin. The albumin-depleted protein mixture was dissolved in 6 mol/l urea and 1.0% acetic acid solution, and separated on mRP-C18 High-Recovery
protein column at 80°C using linear multi-segment gradient, as described in the Materials and Methods section. HPLC, high-performance liquid
chromatography; SDS, sodium dodecyl sulfate.
3
6
14
17
28
38
49
62
98
188
(kDa)
(a)
(b)
eniru delooPe
n
iru e
lgn
i
S
14
19
28
39
51
64
97
191
(kDa)
Genome Biology 2006, Volume 7, Issue 9, Article R80 Adachi et al. R80.5
comment reviews reports refereed researchdeposited research interactions information
Genome Biology 2006, 7:R80
but shows the tendency for peptides identified only in in-gel
datasets to be more hydrophobic than those identified only in
in-solution datasets.
As described above the urinary proteome of a single person
was investigated in great depth and with different methods.
Because the urinary proteome is variable, even from the same
individual at different time points, we wished to determine
whether the individual urinary proteome was typical. Thus,
we compared the overall features of the urinary proteins
between single and pooled specimens. As shown in Figure 5,
there was deep overlap between the two samples, and the bulk
properties in terms of molecular weight and predicted cellular
localization were also very similar.
Characterization of the urinary proteome via Gene
Ontology annotation
The identified proteins were functionally categorized based
on universal Gene Ontology (GO) annotation terms [31] using
the Biological Networks Gene Ontology (BiNGO) program
package [32,33]. In total, 1041, 1191, and 1118 proteins were
linked to at least one annotation term within the GO cellular
component, molecular function, and biological process cate-
gories, respectively. In total, 214 and 67 terms exhibited sig-
nificance (P < 0.001) as overrepresented and
underrepresented terms compared with the entire list of
International Protein Index (IPI) entries (IPI_Human, ver-
sions 3.13, 57050 protein sequences). As shown in Figures 6
and 7, in the cellular component category, GO terms related
to extracellular proteins such as extracellular region (308
proteins found), extracellular space (94), and extracellular
matrix (82) were overrepresented, as was expected. In the
sample preparation step, we removed cells and debris from
the urine by centrifugation, and so GO terms related to intra-
cellular proteins including cell (824), intracellular (442),
intracellular organelle (302), nucleus (74), and ribosome (7)
were underrepresented. However, unexpectedly, GO terms
related to plasma membrane proteins (225) and lysosome
proteins (62) were overrepresented. These findings suggest
that shed epithelial cells and blood cells are not the main
source of the plasma membrane and lysosome proteins iden-
tified in our study, but implicate the presence of excretion
pathway(s) specific for these proteins.
In the molecular function category, 57 GO terms were
enriched (Figure 8). Those terms are categorized to four
groups: signal transducer, peptidase, enzyme inhibitor, and
others. Signal transducer activity (275 proteins found) was
unexpected because it was not enriched in an analysis of
investigations into a related body fluid, the plasma proteome
[34]. Receptor binding (80) is the major subcategory. In par-
ticular, growth factor binding (24), including 11 insulin-like
growth factor binding proteins, three latent transforming
growth factor binding proteins, and five interleukin recep-
tors, was overrepresented. Furthermore, transmembrane
receptor protein kinase activity (22) and transmembrane
receptor protein tyrosine phosphatase activity (18) were also
overrepresented. GTP binding (55) and guanyl nucleotide
binding (55) were also enriched terms and shared the same
set of proteins, including Ras, Rab, Rho, Arf, and Ras-related
proteins.
A total of 109 proteins were annotated within the peptidase
activity category. Both endopeptidase (76) and exopeptidase
(26) activities were overrepresented. We identified 36 serine-
type endopeptidases such as kallikreins, thrombins, trans-
membrane proteases, and nine proteasome subunits.
Two consecutive stages of mass spectrometric fragmentation (MS
3
)Figure 3
Two consecutive stages of mass spectrometric fragmentation (MS
3
). The
precursor of peptide DVPNSQPEMVEAVK (a; see insert) was selected for
fragmentation from a full scan of mass to charge ratio range. The doubly
charged y
12
fragment ion (b) was subsequently fragmented. Characteristic
pattern for charged directed fragmentation is observed in MS
3
spectra (c)
and confirms the identification of the above peptide. See Steen and Mann
[65] for an introduction to peptide sequencing and confidence of peptide
identification. MS, mass spectrometry.
400 600 800 1000 1200 1400 1600
m/z
Relative abundance
535.79
841.94
720.36
1143.53
507.26
551.28
771.5 772.0 772.5 773.0 773.5
m/z
Relative Abundance
771.88
772.38
772.88
772.98
200 400 600 800 1000 1200 1400
m/z
Relative abundance
664.91
b13
MS
MS/MS
b6
y8
y12
y4
y
*++12
y++12
y9
b10
y10
b
0
6
y
0
++12
b*5
b*4
y3
200 400 600 800 1000 1200
m/z
Relative abundance
MS/MS/MS
b11
y4
y8
y10
y5
y9
b3
y11
y7
b9
b7
y6
b4
b2
(a)
(b)
(c)
R80.6 Genome Biology 2006, Volume 7, Issue 9, Article R80 Adachi et al. />Genome Biology 2006, 7:R80
Peptidase inhibitors are necessary to regulate these enzymes,
and consequently endopeptidase inhibitor activity (63) was
enriched with high significance (P < 4.73 × 10
-29
). Of these, 40
proteins belong to the term of serine endopeptidase inhibitor
activity. Serine protease inhibitors are important in control-
ling enzyme activity of activated coagulation factors in the
blood. The urinary trypsin inhibitor bikunin (AMBP protein)
is among the serine protease inhibitors and is an important
anti-inflammatory substance in urine [35]. Extracellular
matrix-related terms such as sugar binding, polysaccharide
binding, glycosaminoglycan binding, and heparin binding
were also overrepresented. In contrast, 29 terms were under-
represented (Figure 9). Most of these were related to intracel-
lular function. DNA binding (24 proteins found) was
underrepresented in the urinary proteome; curiously, it was
found to be overrepresented in the plasma proteome [34].
Overrepresented and underrepresented GO terms in the bio-
logical process category are shown in Figure 10 and 11,
respectively. 128 GO terms were enriched and 15 of them were
related to immune response (Figure 10). It is reasonable that
urine contains many immune response proteins such as
chemokines, adhesion molecules, and proinflammatory
cytokines because many proteins involved in immune
response are known to be present in blood, and the urinary
tract is under the same constant threat of infection with intes-
tinal microbiota [36,37]. Enrichment of cell adhesion was the
most statistically significant finding (P < 4.60 × 10
-32
) in this
category. A total of 144 proteins were found in this term and
43 of these proteins belong to cell-cell adhesion, such as cad-
herins and intracellular adhesion molecules.
Discussion
Characteristics of the urinary proteome
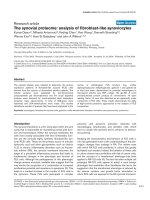
We identified 1543 proteins in urine from ten healthy donors
in this study. Figure 12 shows the overlap of urinary proteins
identified in the previous five largest studies [9-13] and our
study. In order to compare the different protein identifiers,
protein IDs in each dataset were converted to gene symbols
Table 1
Experimental conditions and statistics on database searches of four individual experiments using a single urine sample
In-gel 1 In-gel 2 In-solution 1 In-solution 2
Urinary protein 150 µg 150 µg 125 µg125 µg
Albumin removal - - + +
Protein separation Invitrogen NuPAGE 4-12% Bis-Tris 1D gel Agilent mRP-C18 column
Number of fraction 14 10 22 22
Digestion In-gel In-gel In-solution In-solution
Denaturant 50% Trifluoroethanol 6 mol/l Urea + 2 mol/l thiourea
LC gradient time 100 min 140 min 100 min 100 min
Identified IT-MS
2
spectra by Mascot
a
16,219 10,535 13,367 10,175
Number of unique peptides
a
4504 3853 3164 2637
Number of identified proteins
a
759 815 656 580
Total number of unique peptides
a
8041
Total number of identified proteins
a
1281
a
Applied criteria are described in the Materials and methods section. 1D, one-dimensional; LC, liquid chromatography; MS, mass spectrometry.
Table 2
Experimental conditions and statistics on database searches of 10 slices of pooled urine sample
Pooled
1
Pooled
2
Pooled
3
Pooled
4
Pooled
5
Pooled
6
Pooled
7
Pooled
8
Pooled
9
Pooled
10
Protein separation Invitrogen NuPAGE 4-12% Bis-Tris 1D Gel
Digestion In-gel
LC gradient time 140 min
Identified IT-MS
2
spectra by Mascot 42,578 36,288 46,328 42,664 48,938 46,529 48,101 50,654 26,607 26,817
Number of unique peptides
a
777 1133 1841 1114 1591 2493 2179 878 1671 2006
Number of identified proteins
a
125 186 290 186 229 302 239 96 206 153
Total number of unique peptides
a
9737
Total number of identified proteins
a
1055
a
Applied criteria are described in the Materials and methods section.
Genome Biology 2006, Volume 7, Issue 9, Article R80 Adachi et al. R80.7
comment reviews reports refereed researchdeposited research interactions information
Genome Biology 2006, 7:R80
using ProteinCenter (Proxeon Bioinformatics, Odense, Den-
mark). The total sum of unique gene products reported previ-
ously is 730. Of those, 520 (71.2%) were also found in our
dataset, whereas 210 and 879 gene products were found only
in the previous reports or in our study, respectively.
Our study achieved a much higher degree of confidence than
did most previous investigations while reporting many more
proteins; therefore, the overlap with those studies is surpris-
ingly high. In contrast, previously reported plasma proteomes
overlapped barely at all [38].
One of the problems in body fluid proteomics is the tremen-
dous variation in individual protein abundance, which can be
as high as 10
10
or more in serum and plasma. Thus, depletion
of abundant proteins is a standard approach to in-depth anal-
ysis of the plasma proteome in the Human Proteome Organi-
zation's Plasma Proteome project. In the case of urine, we
found this problem to be not as severe. For example, we
identified both highly abundant proteins such as serum albu-
min and low abundance proteins such as growth factors.
These proteins span at least three orders of magnitude in con-
centration, ranging from 1.0-3.3 µg/l (insulin-like growth fac-
tor II [39] and platelet-derived growth factor [40]) to 2.2-3.3
mg/l (serum albumin [41]) in normal urine. We concentrated
urine samples 50 times, so the concentration of serum albu-
min in the concentrated sample would be 0.11-0.165 g/l,
which is more than 200 times lower than the concentration in
plasma (usually 35-50 g/l). The apparently more even distri-
bution of proteins in the urinary proteome makes it possible
to identify more than 1000 proteins, a majority of them with-
out depletion of abundant proteins (in-gel samples 1 and 2,
and pooled sample).
Origin of proteins in the urine
Our analysis revealed that extracellular proteins, plasma
membrane proteins, and lysosomal proteins are enriched in
the urine, whereas other intracellular proteins are not
enriched. It was expected that urine would contain many
extracellular proteins (by definition); however, the presence
of plasma membrane proteins and lysosomal proteins were
not expected. These results suggest that there are specific
transport pathways for plasma membrane proteins and lyso-
some proteins.
The excretion pathway of renal apical plasma membrane pro-
teins through the process of exosome formation was previ-
Diagram of peptides found in multiple datasetsFigure 4
Diagram of peptides found in multiple datasets. All overlaps of peptides
are shown (two way, three way, and four way) for all four input datasets:
in-gel 1 (green), in-gel 2 (yellow), in-solution 1 (blue), and in-solution 2
(red). Numbers represent the number of shared peptides in the respective
overlapping areas.
772
290
997
1510
1233
231 117
115
393
950
348
218
631
138
76
In-gel 1
In-gel 2
In-solution 1
In-solution 2
4504
3853
2637
3164
Total: 8041
Comparison of identified proteins in urine of a single person and pooled urine from nine personsFigure 5
Comparison of identified proteins in urine of a single person and pooled
urine from nine persons. (a) Overlapping proteins, (b) molecular weight
distribution, and (c) cellular localization were compared. The ratio of
membrane, plasma membrane, lysosome, and extracellular region proteins
in each dataset were calculated using BiNGO, as described in the Materials
and Methods section. GO, Gene Ontology.
488 794 261
Pooled sample
Single sample
(a)
0
50
100
150
200
250
300
Molecular weight (kDa)
Number of identified protein
s
Pool
Single
(b)
0-10
10-20
20-30
30-40
40-50
50-60
60-70
70-80
80-90
90-100
100-110
110-120
120-130
130-140
140-150
>150
00.10.20.30.40.5
Ex
tr
ac
ellula
r
reg
i
on
L
y
soso
me
Plasma
membrane
Membrane
Pool
Single
All GO annotated proteins
(c)
R80.8 Genome Biology 2006, Volume 7, Issue 9, Article R80 Adachi et al. />Genome Biology 2006, 7:R80
ously suggested [42] and was recently demonstrated
rigorously using electron microscopy [9]. In our data we iden-
tified membrane transporters localized in the kidney. These
transporters are involved in water (aquaporin [AQP]1, AQP2,
and AQP7), drug (multidrug resistance protein 1), sodium,
potassium, and chloride transport (solute carrier family 12
members 1, 2, and 3; sodium/potassium-transporting
ATPase gamma chain; potassium voltage-gated channel sub-
family E member 3; and amiloride-sensitive sodium channel
gamma-subunit [also a copper serum amine oxidase]). These
proteins, except potassium voltage-gated channel subfamily
E member 3 and amiloride-sensitive sodium channel gamma-
subunit, were found in the gel bands that correspond to the
molecular weight of the intact forms of these proteins; fur-
thermore, peptides localized in both the extracellular and
intracellular regions were detected. Thus, our data strongly
suggest that plasma membrane proteins were transported to
the urine in an intact form. Furthermore, we identified three
aquaporins, namely AQP1, AQP2 and AQP7, which are all
aquaporins known to localize to the apical plasma membrane
in the kidney, whereas we did not identify any aquaporins
that are known to be expressed on the basolateral plasma
membrane [43,44]. This finding further supports the notion
that the excretion pathway of apical plasma membrane pro-
teins through the process of exosome formation is the domi-
nant pathway and that whole cell shedding plays a minor role.
This latter point is also supported statistically by our finding
that GO terms related to intracellular 'household' functions
Significantly over-represented GO cellular component terms for the set of identified urinary proteinsFigure 6
Significantly over-represented GO cellular component terms for the set of identified urinary proteins. The set of identified urinary proteins was compared
with the entire list of IPI entries (IPI_Human, version 3.13, 57050 protein sequences), and significantly over-represented and underrepresented GO terms
(P < 0.001) are shown. The ratio shown is the number of urinary and entire IPI proteins annotated to each GO term divided by the number of urinary and
entire IPI proteins linked to at least one annotation term within the indicated GO cellular component, molecular function, and biological process
categories. GO, Gene Ontology; IPI, International Protein Index.
Human urinary protein list
All entries
Cellular component
overrepresented
0 0.05 0.1 0.15 0.2 0.25 0.3 0.35 0.4 0.45 0.5
Membrane attack complex
Fibrillar collagen
Anchored to plasma membrane
Anchored to membrane
Organelle lumen
ER-Golgi intermediate compartment
Proteasome core complex (sensu Eukaryota)
Basement membrane
Extrinsic to membrane
Collagen
Endosome
Cell surface
Soluble fraction
Cytosol
Lytic vacuole
Lysosome
Vacuole
Extracellular matrix (sensu Metazoa)
Extracellular matrix
Cell fraction
Extracellular space
Integral to plasma membrane
Intrinsic to plasma membrane
Plasma membrane
Extracellular region
Cytoplasm
Integral to membrane
Intrinsic to membrane
Membrane
Genome Biology 2006, Volume 7, Issue 9, Article R80 Adachi et al. R80.9
comment reviews reports refereed researchdeposited research interactions information
Genome Biology 2006, 7:R80
are significantly underrepresented in urine. Direct proteomic
comparisons of apical and basolateral proteomes would be
interesting in this regard [45].
It has been shown that lysosomes can undergo exocytosis
[46,47]. This process plays a physiological role in repair of
wounds of the plasma membrane and was recently confirmed
to occur in mouse primary kidney cells [48]. In this process,
stored material in lysosomes was released to the medium
(extracellular space), whereas lysosomal membrane protein
(LAMP)-1 was shown to be redistributed to the plasma mem-
brane [48]. We identified not only lysosomal enzymes but
also lysosomal membrane proteins such as LAMP-1, LAMP-2
and LAMP-3, and lysosomal acid phosphatase. The excretion
pathway of these membrane proteins cannot be explained by
this lysosomal exocytosis model, but there is a possibility that
redistributed lysosomal membrane proteins were excreted
through the process of exosome formation.
Urine as diagnostic material
Urine is clearly a suitable material for the diagnosis of dis-
eases that are related to the kidney and urologic tract. Urine
proteome analysis for disease biomarker identification has
already been applied to prostate cancer [49], renal cell carci-
noma [11,50], bladder cancer [51,52], urothelial carcinoma
[53], renal Fanconi syndrome [19], transitional cell carci-
noma [54], type 1 diabetes [55], and acute rejection of renal
allograft [56,57]. Several biomarker candidates for these
diseases have been reported. However, most studies employ
two-dimensional gel electrophoresis, and so the identified
proteins were limited to soluble and abundant protein
classes. In the future it will be necessary to characterize the
variation in normal protein concentration levels because the
urinary proteome is thought to be variable even from one
individual at different time points. If high throughput and
quantitative mass spectrometric techniques (for review see
[58]) are combined with the methods we employed in the
present study, then the rich catalog of urinary proteins now
accessible should result in ample opportunity to discover
disease biomarkers. In order to facilitate this process, we have
made the urinary proteome data accessible at the Max-Planck
Unified Proteome database (MAPU) [59].
Conclusion
Confidence and comprehensiveness are conflicting factors,
but employing strategies that achieve very high mass accu-
racy and two stages of mass spectrometric fragmentation
allowed us to establish a high-confidence set of human
urinary proteins consisting of 1543 proteins. Our analysis
provides the largest and most certain set of proteins present
in human urine proteomes and provides a useful reference for
comparing datasets obtained using different methodologies.
Furthermore, comprehensive GO analysis revealed surpris-
ing insights into the physiology of this body fluid, most nota-
bly the presence of many membrane proteins. If a
quantitative aspect is added [58], then urinary proteomics
could contribute to the diagnosis and classification of disease
in the future.
Materials and methods
Human urine protein concentrates
A single urine sample was obtained from a healthy male indi-
vidual. A pooled urine sample was collected from nine healthy
volunteers who underwent a medical check-up by the doctor
of our institute. Personal information on these individuals is
given in Additional file 3.
Significantly under-represented GO cellular component, molecular function and biological process terms for the set of identified urinary proteinsFigure 7
Significantly under-represented GO cellular component, molecular function and biological process terms for the set of identified urinary proteins. Each
term was selected as described in the legend to Figure 6. GO, Gene Ontology.
Human urinary protein list
All entries
Cellular component
underrepresented
0 0.1 0.2 0.3 0.4 0.5 0.6 0.7 0.8 0.9 1
Ribosome
Ribonucleoprotein complex
Nucleus
Intracellular non-membrane-bound organelle
Non-membrane-bound organelle
Protein complex
Intracellular membrane-bound organelle
Membrane-bound organelle
Organelle
Intracellular organelle
Intracellular
Cell
R80.10 Genome Biology 2006, Volume 7, Issue 9, Article R80 Adachi et al. />Genome Biology 2006, 7:R80
Significantly over-represented GO molecular function terms for the set of identified urinary proteinsFigure 8
Significantly over-represented GO molecular function terms for the set of identified urinary proteins. Each term was selected as described in the legend
for Figure 6. GO, Gene Ontology.
Human urinary protein list
All entries
Molecular function
overrepresented
0 0.05 0.1 0.15 0.2 0.25 0.3 0.35 0.4 0.45
Aldo-keto reductase activity
Retinoid binding
Isoprenoid binding
Oxidoreductase activity, acting on the CH-CH group of donors, NAD or NADP as acceptor
Phospholipase inhibitor activity
Transmembrane receptor protein tyrosine phosphatase activity
Transmembrane receptor protein phosphatase activity
Fatty acid binding
Sulfuric ester hydrolase activity
Ferric iron binding
Hyaluronic acid binding
Threonine endopeptidase activity
Interleukin binding
Cysteine protease inhibitor activity
Insulin-like growth factor binding
Intramolecular oxidoreductase activity
Protein homodimerization activity
Carboxypeptidase activity
Antioxidant activity
Cytokine binding
Transmembrane receptor protein tyrosine kinase activity
Hydrolase activity, acting on carbon-nitrogen (but not peptide) bonds
Lipid transporter activity
Heparin binding
Transmembrane receptor protein kinase activity
Growth factor binding
Extracellular matrix structural constituent
Oxidoreductase activity, acting on the CH-OH group of donors, NAD or NADP as acceptor
Oxidoreductase activity, acting on CH-OH group of donors
Exopeptidase activity
Hydrolase activity, hydrolyzing O-glycosyl compounds
Glycosaminoglycan binding
Polysaccharide binding
Hydrolase activity, acting on glycosyl bonds
GTPase activity
Pattern binding
Serine-type endopeptidase activity
Electron transporter activity
Sugar binding
Lipid binding
Serine-type endopeptidase inhibitor activity
Antigen binding
Serine-type peptidase activity
GTP binding
Guanyl nucleotide binding
Endopeptidase inhibitor activity
Protease inhibitor activity
Carbohydrate binding
Endopeptidase activity
Enzyme inhibitor activity
Receptor binding
Enzyme regulator activity
Peptidase activity
Calcium ion binding
Hydrolase activity
Signal transducer activity
Protein binding
Genome Biology 2006, Volume 7, Issue 9, Article R80 Adachi et al. R80.11
comment reviews reports refereed researchdeposited research interactions information
Genome Biology 2006, 7:R80
Immediately after urine collection, one protease inhibitor
cocktail tablet (Complete™; Roche Diagnostics, Mannheim,
Germany) was added per 50 ml urine to avoid proteolysis in
the sample, and 5 ml of each sample was pooled together
(pooled sample). We also collected a first morning urine sam-
ple from a healthy male individual in 100 ml volumes (single
sample). These samples were stored on ice prior to centrifu-
gation at 2000 × g for 10 min at 4°C. The removal of cells was
confirmed by microscopic examination (Additional data file
4). The supernatant was transferred to Centriprep YM-3
membrane concentrators (Millipore, Billerica, MA, USA) and
spun at 3000 × g to reduce the volumes to about 1 ml for
pooled sample and 2 ml for single sample. The protein
amounts in urine concentrates were measured using the
Coomassie Protein Assay Kit (Pierce, Rockford, IL, USA) and
concentrates were frozen at -80°C.
One-dimensional SDS-PAGE and in-gel digest of
human urinary proteins
Protein (150 µg) was applied on a 4-12% Bis-Tris gel (Novex;
Invitrogen, Carlsbad, CA, USA) using 2-(N-morpholino)-
ethanesulfonic acid or 3-(N-morpholino)propanesulphonic
acid SDS running buffer (Invitrogen), in accordance with the
manufacturer's instructions. After staining by colloidal
Coomassie (Invitrogen), the gel lane was cut into 10 or 14
pieces and subjected to in-gel tryptic digestion, essentially as
described by Wilm and coworkers [60]. Briefly, the gel pieces
were de-stained and washed, and, after dithiothreitol reduc-
tion and iodoacetamide alkylation, the proteins were digested
with porcine trypsin (modified sequencing grade; Promega,
Madison, WI, USA) overnight at 37°C. The resulting tryptic
peptides were extracted from the gel pieces with 30%
acetonitrile, 0.3% trifluoroacetic acid (TFA), and 100%
acetonitrile. The extracts was evaporated in a vacuum centri-
fuge to remove organic solvent, and then de-salted and con-
centrated on self-made reverse phase C18 StageTips, as
described previously [26].
Reverse phase HPLC and in-solution digest of human
urinary proteins
Protein (250 µg) was applied to Vivapure Anti-HSA Kit
(Vivascience, Hanover, Germany) to deplete serum albumin.
Urea and acetic acid were added to the albumin-depleted pro-
tein mixture and the final concentrations were adjusted to 6
mol/l and 1.0%, respectively. The albumin-depleted protein
mixture was separated on a reverse phase HPLC column (4.6
mm internal diameter × 50 mm long column; mRP-C18 High-
Recovery protein column, Agilent Technologies, Palo Alto,
Significantly under-represented GO molecular function terms for the set of identified urinary proteinsFigure 9
Significantly under-represented GO molecular function terms for the set of identified urinary proteins. Each term was selected as described in the legend
of Figure 6. GO, Gene Ontology.
Molecular function
underrepresented
Human urinary protein list
All entries
0 0.05 0.1 0.15 0.2 0.25
Olfactory receptor activity
Guanyl-nucleotide exchange factor activity
Nucleotidyltransferase activity
Helicase activity
Potassium channel activity
Transcription factor activity
Cation channel activity
Protein serine/threonine kinase activity
GTPase regulator activity
Transcription regulator activity
Structural constituent of ribosome
Ion channel activity
Channel or pore class transporter activity
Alpha-type channel activity
RNA binding
Rhodopsin-like receptor activity
G-protein coupled receptor activity
DNA binding
Protein kinase activity
Phosphotransferase activity, alcohol group as acceptor
Kinase activity
Transferase activity, transferring phosphorus-containing groups
Nucleic acid binding
Zinc ion binding
ATP binding
Adenyl nucleotide binding
Transferase activity
Transition metal ion binding
Nucleotide binding
R80.12 Genome Biology 2006, Volume 7, Issue 9, Article R80 Adachi et al. />Genome Biology 2006, 7:R80
Figure 10 (see legend on next page)
Biological process
overrepresented
Human urinary protein list
All entries
0 0.05 0.1 0.15 0.2 0.25 0.3 0.35
Copper ion homeostasis
Neuron recognition
Regulation of proteolysis
Fibrinolysis
Negative regulation of blood coagulation
Regulation of blood coagulation
Aldehyde metabolism
Regulation of coagulation
Negative regulation of coagulation
Defense response to fungi
Cytolysis
Platelet activation
Regulation of neurogenesis
Complement activation, alternative pathway
Symbiosis, mutualism through parasitism
Interaction between organisms
Symbiotic interaction between host and other organism
Acute-phase response
Complement activation, classical pathway
Receptor mediated endocytosis
Iron ion homeostasis
Glycosaminoglycan metabolism
Aminoglycan metabolism
Digestion
Transition metal ion homeostasis
Response to oxidative stress
Angiogenesis
Blood vessel morphogenesis
Blood vessel development
Vasculature development
Glycolysis
Cell migration
Lipid binding
Complement activation
Epidermis development
Defense response to bacteria
Oxygen and reactive oxygen species metabolism
Ectoderm development
Innate immune response
Glucose catabolism
Hexose catabolism
Monosaccharide catabolism
Anti-apoptosis
Alcohol catabolism
Circulation
Transmembrane receptor protein tyrosine kinase
Response to bacteria
Humoral defense mechanism (sensu vertebrata)
Di-, tri-valent inorganic cation homeostasis
Metal ion homeostasis
Negative regulation of apoptosis
Negative regulation of programmed cell death
Cation homeostasis
Cell ion homeostasis
Glucose metabolism
Ion homeostasis
Growth
Main pathways of carbohydrate metabolism
Homophilic cell adhesion
Cell homeostasis
Blood coagulation
Coagulation
Cellular carbohydrate catabolism
Carbohydrate catabolism
Tissue development
Inflammatory response
Hexose metabolism
Monosaccharide metabolism
Energy derivation by oxidation of organic compounds
Hemostasis
Endocytosis
Wound healing
Regulation of body fluids
Enzyme linked receptor protein signaling pathway
Humoral immune response
Organ morphogenesis
Homeostasis
Regulation of cell proliferation
Cellular morphogenesis
Cell-cell adhesion
Alcohol metabolism
Amine metabolism
Vesicle-mediated transport
Nervous system development
System development
Locomotion
Localization of cell
Cell motility
Locomotory behavior
Nitrogen compound metabolism
Cell differentiation
Response to chemical stimulus
Behavior
Apoptosis
Programmed cell death
Carboxylic acid metabolism
Organic acid metabolism
Cellular macromolecule catabolism
Response to abiotic stimulus
Macromolecule catabolism
Cellular carbohydrate metabolism
Protein transport
Cell proliferation
Establishment of protein localization
Cell death
Death
Protein localization
Organ development
Negative regulation of physiological process
Response to wounding
Negative regulation of biological process
Morphogenesis
Response to pest, pathogen or parasite
Carbohydrate metabolism
Response to external biotic stimulus
Cellular catabolism
Catabolism
Proteolysis
Response to external stimulus
Cell adhesion
Response to stress
Immune response
Defense response
Response to biotic stimulus
Development
Organismal physiological process
Response to stimulus
Cell communication
Genome Biology 2006, Volume 7, Issue 9, Article R80 Adachi et al. R80.13
comment reviews reports refereed researchdeposited research interactions information
Genome Biology 2006, 7:R80
CA, USA) at 80°C using linear multi-segment gradient. Fol-
lowing a 10 min wash with 97% solvent A (water in 0.1% TFA)
and 3% solvent B (acetonitrile in 0.08% TFA), a linear gradi-
ent to 15% solvent B at 12 min, to 35% at 40 min, to 100% at
46 min, to 100% at 51 min, and to 3% at 55 min was achieved
using a flow rate of 750 µl/min. Fraction collection was
performed by time, collecting 2 min time slices starting at 10
min and continuing to 54 min (total 22 fractions). Each frac-
tion was divided into halves and dried using a vacuum centri-
fuge and subjected to in-solution tryptic digestion using urea
and 2,2,2-trifluoroethanol (TFE; Sigma-Aldrich, St Louis,
MO, USA) as a denaturant, respectively.
In-solution digestion using urea was done essentially as
described previously by Foster and coworkers [61]. Briefly,
fractionated proteins were resolved in a buffer containing 6
mol/l urea and 2 mol/l thiourea, and reduced, alkylated, and
digested. To reduce disulfide bonds, 0.5 µg of DTT was added
in the protein solutions and incubated for 0.5 hours at room
temperature. The free thiol (-SH) groups were subsequently
alkylated with 2.5 µg iodoacetamide for 30 min at room tem-
perature in the dark. The reduced and alkylated protein mix-
tures were digested with 0.5 µg endoproteinase Lys-C (Wako
Biochemicals, Osaka, Japan) for 3 hours and with 0.5 µg
sequence grade-modified trypsin for overnight at 37°C after
dilution to 1.5 mol/l urea with 50 mmol/l NH
4
HCO
3
(pH 8.0).
Proteolysis was quenched by acidification of the reaction mix-
tures with TFA.
In-solution digestion using TFE was done essentially as
described previously by Meza and coworkers [24,25]. Briefly,
fractionated proteins were resolved in a buffer containing
50% TFE and reduced, alkylated, and digested. DTT was
added to a final concentration of 10 mmol/l in the protein
solutions and incubated for 20 min at 90°C. Then, iodoaceta-
mide (50 mmol/l final concentration) was added for alkyla-
tion and the solution was incubated for 60 min at room
temperature in the dark. Excess iodoacetamide was quenched
by DTT (10 mmol/l final concentration) for 60 min at room
temperature in the dark. The protein mixtures were diluted to
5% TFE with 20 mmol/l NH
4
HCO
3
(pH 8.0) and digested
with 1.0 µg of sequence grade-modified trypsin for overnight
at 37°C. Proteolysis was stopped by acidification with TFA.
Finally, the resulting peptide mixtures were desalted on
reverse phase C18 StageTips and diluted in 0.1% TFA for
nano-HPLC-MS analysis.
Significantly over-represented GO biological process terms for the set of identified urinary proteinsFigure 10 (see previous page)
Significantly over-represented GO biological process terms for the set of identified urinary proteins. Each term was selected as described in the legend of
Figure 6. GO, Gene Ontology.
Significantly under-represented GO biological process terms for the set of identified urinary proteinsFigure 11
Significantly under-represented GO biological process terms for the set of identified urinary proteins. Each term was selected as described in the legend of
Figure 6. GO, Gene Ontology.
Biological process
underrepresented
Human urinary protein list
All entries
0 0.1 0.2 0.3 0.4 0.5 0.6 0.7
Sensory perception of chemical stimulus
Sensory perception of smell
Transcription from rna polymerase ii promoter
Transcription, dna-dependent
Regulation of transcription, dna-dependent
Regulation of transcription
Transcription
Dna metabolism
Regulation of nucleobase, nucleoside, nucleotide and nucleic acid metabolism
Protein amino acid phosphorylation
Protein biosynthesis
Macromolecule biosynthesis
Regulation of cellular metabolism
G-protein coupled receptor protein signaling pathway
Regulation of metabolism
Protein modification
Biopolymer modification
Nucleobase, nucleoside, nucleotide and nucleic acid metabolism
Biopolymer metabolism
Regulation of cellular physiological process
Regulation of physiological process
Regulation of cellular process
Regulation of biological process
Primary metabolism
Cellular metabolism
Metabolism
R80.14 Genome Biology 2006, Volume 7, Issue 9, Article R80 Adachi et al. />Genome Biology 2006, 7:R80
Nanoflow LC-MS
2
or MS
3
All nanoflow LC-MS/MS and MS
3
experiments were per-
formed on a 7-Tesla Finnigan LTQ-FT mass spectrometer and
a LTQ-Orbitrap (Thermo Electron, Bremen, Germany)
equipped with a nanoelectrospray ion source (Proxeon Bio-
systems, Odense, Denmark), basically as described previ-
ously [15,16,62]. Data were acquired in data-dependent mode
using Xcalibur software. In the case of LTQ-FTICR, the pre-
cursor ion scan MS spectra (m/z 300-1575) were acquired in
the FTICR with resolution R = 25,000 at m/z 400 (number of
accumulated ions: 5 × 10
6
). The three most intensive ions
were isolated and fragmented in the linear ion trap by
collisionally induced dissociation using 3 × 10
4
accumulated
ions. They were simultaneously scanned by FTICR-selected
ion monitoring with 10 Da mass range, R = 50000, and 5 ×
10
4
accumulated ions for even more accurate molecular mass
measurements. For MS
3
, the most intense ion with m/z above
300 in each MS/MS spectra were further isolated and frag-
mented. In data-dependent LC-MS/MS experiments,
dynamic exclusion was used with 30 s exclusion duration. In
the case of the LTQ-Orbitrap, the precursor ion scan MS
spectra (m/z 300-1600) were acquired in the orbitrap with
resolution R = 60000 at m/z 400 with the number of accu-
mulated ions being 1 × 10
6
. The five most intense ions were
isolated and fragmented in linear ion trap (number of accu-
mulated ions: 3 × 10
4
). The resulting fragment ions were
recorded in the orbitrap with resolution R = 15,000 at m/z
400. The lock mass option enabled accurate mass measure-
ments in both MS and MS/MS mode. The polydimethylcy-
closiloxane ions generated in the electrospray process from
ambient air (protonated (Si(CH
3
)
2
O)
6
; m/z 445.120025) were
used for internal recalibration in real time. In data-dependent
LC-MS/MS experiments dynamic exclusion was used with 30
s exclusion duration.
Data analysis
Proteins were identified via automated database searching
(Mascot; Matrix Science, London, UK) of all tandem mass
spectra against an in-house curated version of the Human IPI
protein sequence database (IPI version 3.13; 57050 protein
sequences [63]) containing all human protein entries from
Swiss-Prot, TrEMBL, RefSeq, Ensembl and H-Inv, as well as
frequently observed contaminants (porcine trypsin, endopro-
teinase Lys-C and human keratins). Carbamidomethyl
cysteine was set as fixed modification, and oxidized methio-
nine and protein N-acetylation and deamidation of asparag-
ine and glutamine were searched as variable modifications.
Initial mass tolerances for protein identification on MS peaks
were 3 ppm (LTQ-FT data) and 5 ppm (LTQ-Orbitrap data),
and on MS/MS peaks they were 0.5 Da. Two 'missed cleav-
ages' were allowed. The instrument setting for the Mascot
search was specified as 'ESI-Trap'. Identified MS
3
spectra
were automatically scored with MSQUANT (open source soft-
ware available on the internet [15,28]). Results obtained from
Mascot and MSQUANT were imported to our in-house
developed peptide-database server, and peptides and pro-
teins were identified using criteria as follows.
For LTQ-FTICR data, only peptides for which the MS
2
score
was above the 95th percentile of significance (Mascot score >
24) were included. Only fully tryptic peptides with seven
amino acids or longer were accepted for identification. Pro-
teins with at least two peptides and a MS
2
score of at least 24
(95% significance level) for one of the peptides and at least 31
(99% significance level) for the other were counted as
identified protein. For proteins identified by a single peptide,
we required the presence of an MS
3
spectrum, an MS
2
score of
at least 34 (99.5% significance level), and a combined score
for MS
2
and MS
3
of above 41 (99.9% significance level) and a
peptide delta score (score difference between first and second
candidate sequences obtained from a database search) above
5.0. MS
2
and MS
3
spectra for all proteins identified by a single
peptide were manually checked.
For LTQ-Orbitrap data, 10 fractions separated by molecular
weight of proteins were analyzed independently. The 95% sig-
nificance threshold in the database search was a MS
2
score of
25 or 26. Proteins were considered positively identified when
they were identified with at least two fully tryptic peptides of
more than six amino acid length, MS
2
score of at least 15 or 16,
and a sum of MS
2
score of at least 50 or 52 resulting in an
expected false-positive rate of 0.25% or 1 in 400.
For counting the number of identified proteins across each
experiment, redundant protein identification was removed
using Blast search function of ProteinCenter and manual
check.
Enrichment analysis of GO categories
We used BiNGO [32,33] with the Cytoscape plugin to find sta-
tistically over- or under-represented GO categories in biologic
data as the tool for enrichment analysis of our urinary pro-
teome dataset. For enrichment analysis we needed a test
dataset (which is our identified urinary proteome) and a ref-
erence set of GO annotation for the complete human pro-
teome. As per instructions on the BiNGO webpage, the
custom GO annotation for the reference set (of whole IPI
human dataset) was created by extracting the GO annotations
available for Human IPI IDs from EBI GOA Human 39.0
Comparison between proteins identified in the present study and five recently published proteomic datasetsFigure 12
Comparison between proteins identified in the present study and five
recently published proteomic datasets.
Our study Previous studies
879 520 210
Genome Biology 2006, Volume 7, Issue 9, Article R80 Adachi et al. R80.15
comment reviews reports refereed researchdeposited research interactions information
Genome Biology 2006, 7:R80
release [64]. The GOA Human 39.0 release contains annota-
tions for 28,873 proteins compiled from different sources.
The analysis was done using 'hyper geometric test', and all GO
terms that were significant with P < 0.001 (after correcting
for multiple term testing by Benjamini and Hochberg false
discovery rate corrections) were selected as over-represented
and under-represented.
Additional data files
The following additional data are included with the online
version of this article: An Excel file containing a list of identi-
fied proteins in each experiment (Additional data file 1); an
Excel file containing a list of the identified peptides in each
experiment (Additional data file 2); an Excel file containing
personal information on the individuals who provided urine
(Additional data file 3); and a pdf file summarizing the results
of the microscopic examination to confirm cell removal from
urine (Additional data file 4).
Additional data file 1An Excel file containing a list of identified proteins in each experimentAn Excel file containing a list of identified proteins in each experi-ment. The spreadsheet consists of 15 worksheets containing respec-tive proteins.Click here for fileAdditional data file 2An Excel file containing a list of the identified peptides in each experimentAn Excel file containing a list of the identified peptides in each experiment. The spreadsheet consists of 14 worksheets containing respective peptides.Click here for fileAdditional data file 3An Excel file containing personal information on the individuals who provided urineAn Excel file containing personal information on the individuals who provided urine, showing sample number, age and gender.Click here for fileAdditional data file 4A pdf file summarizing the results of the microscopic examination to confirm cell removal from urineA pdf file summarizing the results of the microscopic examination to confirm cell removal from urine.Click here for file
Acknowledgements
We thank other members of the Center for Experimental BioInformatics
(CEBI) and the Department for Proteomics and Signal Transduction for
their support for help and fruitful discussions. Dr William C Barrett
(Agilent Technologies, USA) is acknowledged for the kind provision of
mRP-C18 column, and Dr Søren Schandorff, Jesper Matthiesen and Dr
Alexandre Podtelejnikov (Proxeon Bioinformatics, Denmark) are acknowl-
edged for help with bioinformatics analysis. Work at CEBI was supported
by a generous grant by the Danish National Research foundation.
References
1. Brenner B, (editor): The Kidney Philadelphia, PA: WB Saunders; 2000.
2. Brunzel NA: Fundamentals of Urine & Body Fluid Analysis Philadelphia,
PA: Saunders; 2004.
3. Haraldsson B, Sorensson J: Why do we not all have proteinuria?
An update of our current understanding of the glomerular
barrier. News Physiol Sci 2004, 19:7-10.
4. Maunsbach AB: Absorption of I125-labeled homologous albu-
min by rat kidney proximal tubule cells. A study of microp-
erfused single proximal tubules by electron microscopic
autoradiography and histochemistry. 1966. J Am Soc Nephrol
1997, 8:323-351. discussion 327-331.
5. Burne MJ, Osicka TM, Comper WD: Fractional clearance of high
molecular weight proteins in conscious rats using a continu-
ous infusion method. Kidney Int 1999, 55:261-270.
6. Batuman V, Verroust PJ, Navar GL, Kaysen JH, Goda FO, Campbell
WC, Simon E, Pontillon F, Lyles M, Bruno J, et al.: Myeloma light
chains are ligands for cubilin (gp280). Am J Physiol 1998,
275:F246-F254.
7. Cui S, Verroust PJ, Moestrup SK, Christensen EI: Megalin/gp330
mediates uptake of albumin in renal proximal tubule. Am J
Physiol 1996, 271:F900-F907.
8. Christensen EI, Gburek J: Protein reabsorption in renal proxi-
maltubule-function and dysfunction in kidney
pathophysiology. PediatrNephrol 2004, 19:714-721.
9. Pisitkun T, Shen RF, Knepper MA: Identification and proteomic
profiling of exosomes in human urine. Proc Natl Acad Sci USA
2004, 101:13368-13373.
10. Castagna A, Cecconi D, Sennels L, Rappsilber J, Guerrier L, Fortis F,
Boschetti E, Lomas L, Righetti PG: Exploring the hidden human
urinary proteome via ligand library beads. J Proteome Res 2005,
4:1917-1930.
11. Pieper R, Gatlin CL, McGrath AM, Makusky AJ, Mondal M, Seonarain
M, Field E, Schatz CR, Estock MA, Ahmed N, et al.: Characteriza-
tion of the human urinary proteome: a method for high-res-
olution display of urinary proteins on two-dimensional
electrophoresis gels with a yield of nearly 1400 distinct pro-
tein spots. Proteomics 2004, 4:1159-1174.
12. Sun W, Li F, Wu S, Wang X, Zheng D, Wang J, Gao Y: Human urine
proteome analysis by three separation approaches. Proteom-
ics 2005, 5:4994-5001.
13. Wang L, Li F, Sun W, Wu S, Wang X, Zhang L, Zheng D, Wang J, Gao
Y: Concanavalin A captured glycoproteins in healthy human
urine. Mol Cell Proteomics 2006, 5:560-562.
14. Locatelli F, Canaud B, Eckardt KU, Stenvinkel P, Wanner C, Zoccali
C: The importance of diabetic nephropathy in current neph-
rological practice. Nephrol Dial Transplant 2003, 18:1716-1725.
15. Olsen JV, Mann M: Improved peptide identification in
proteomicsby two consecutive stages of mass spectrometric
fragmentation. Proc Natl Acad Sci USA 2004, 101:13417-13422.
16. Olsen JV, de Godoy LM, Li G, Macek B, Mortensen P, Pesch R,
Makarov A, Lange O, Horning S, Mann M: Parts per million mass
accuracy on an Orbitrap mass spectrometer via lock mass
injection into a C-trap. Mol Cell Proteomics 2005, 4:2010-2021.
17. Dieguez-Acuna FJ, Gerber SA, Kodama S, Elias JE, Beausoleil SA,
Faustman D, Gygi SP: Characterization of mouse spleen cells by
subtractiveproteomics. Mol Cell Proteomics 2005, 4:1459-1470.
18. Makarov A, Denisov E, Kholomeev A, Balschun W, Lange O, Strupat
K, Horning S: Performance evaluation of a hybrid linear ion
trap/orbitrap mass spectrometer. Anal Chem 2006,
78:2113-2120.
19. Cutillas PR, Chalkley RJ, Hansen KC, Cramer R, Norden AG, Water-
field MD, Burlingame AL, Unwin RJ: The urinary proteome in
Fanconi syndromeimplies specificity in the reabsorption of
proteins by renal proximal tubule cells. Am J Physiol Renal Physiol
2004, 287:F353-F364.
20. Thongboonkerd V, McLeish KR, Arthur JM, Klein JB: Proteomic
analysis of normal human urinary proteins isolated by ace-
tone precipitation or ultracentrifugation. Kidney Int 2002,
62:1461-1469.
21. Tantipaiboonwong P, Sinchaikul S, Sriyam S, Phutrakul S, Chen ST:
Different techniques for urinary protein analysis of normal
and lung cancer patients. Proteomics 2005, 5:1140-1149.
22. Wittke S, Fliser D, Haubitz M, Bartel S, Krebs R, Hausadel F, Hillmann
M, Golovko I, Koester P, Haller H, et al.: Determination of pep-
tides and proteins in human urine with capillary electro-
phoresis-mass spectrometry, a suitable tool for the
establishment of new diagnostic markers. J Chromatogr A 2003,
1013:173-181.
23. Haubitz M, Wittke S, Weissinger EM, Walden M, Rupprecht HD,
Floege J, Haller H, Mischak H: Urine protein patterns can serve
as diagnostic tools in patients with IgA nephropathy. Kidney
Int 2005, 67:2313-2320.
24. Meza JE, Miller CA, Fischer SM: The effect of denaturingagentson
protein identification by mass spectrometry [posterpresen-
tation]. In Excellence in Microfluidics: ABRF 2005; 5-8 February 2005
Savannah, GA. Palo Alto, CA: Agilent Technologies; 2005:P142-S.
25. Meza JE, Miller CA, Fischer SM: Improved tryptic digestion of
proteins using 2,2,2-trifluoroethanol (TFE). In The Association
of Biomolecular Resource Facilities. 2004; February 2004 Portland, OR:
Agilent Technologies; 2004.
26. Rappsilber J, Ishihama Y, Mann M: Stop and go extraction tips for
matrix-assisted laser desorption/ionization, nanoelectro-
spray, and LC/MSsample pretreatment in proteomics. Anal
Chem 2003, 75:663-670.
27. Perkins DN, Pappin DJ, Creasy DM, Cottrell JS: Probability-based
protein identification by searching sequence databases using
mass spectrometry data. Electrophoresis 1999, 20:3551-3567.
28. MSQUANT []
29. Elias JE, Haas W, Faherty BK, Gygi SP: Comparative evaluation of
mass spectrometry platforms used in large-scale proteomics
investigations. Nat Methods 2005, 2:667-675.
30. Kyte J, Doolittle RF: A simple method for displaying the hydro-
pathic character of a protein. J Mol Biol 1982, 157:105-132.
31. Ashburner M, Ball CA, Blake JA, Botstein D, Butler H, Cherry JM,
Davis AP, Dolinski K, Dwight SS, Eppig JT, et al.: Gene Ontology:
tool for the unification of biology. The Gene Ontology
Consortium. Nat Genet 2000, 25:25-29.
32. Maere S, Heymans K, Kuiper M: BiNGO: a Cytoscape plugin to
assess overrepresentation of gene ontology categories in
biological networks. Bioinformatics 2005, 21:3448-3449.
33. The Biological Networks Gene Ontology tool (BiNGO)
[ />34. Ping P, Vondriska TM, Creighton CJ, Gandhi TK, Yang Z, Menon R,
R80.16 Genome Biology 2006, Volume 7, Issue 9, Article R80 Adachi et al. />Genome Biology 2006, 7:R80
Kwon MS, Cho SY, Drwal G, Kellmann M, et al.: A functional anno-
tation of subproteomes in human plasma. Proteomics 2005,
5:3506-3519.
35. Pugia MJ, Lott JA: Pathophysiology and diagnostic value of uri-
nary trypsin inhibitors. Clin Chem Lab Med 2005, 43:1-16.
36. Mulvey MA, Schilling JD, Martinez JJ, Hultgren SJ: Badbugs andbe-
leaguered bladders: interplay between uropathogenic
Escherichia coli and innate host defenses. Proc Natl Acad Sci USA
2000, 97:8829-8835.
37. Saemann MD, Weichhart T, Horl WH, Zlabinger GJ: Tamm-Hors-
fall protein: a multilayered defence molecule against urinary
tract infection. Eur J Clin Invest 2005, 35:227-235.
38. Anderson NL, Polanski M, Pieper R, Gatlin T, Tirumalai RS, Conrads
TP, Veenstra TD, Adkins JN, Pounds JG, Fagan R, et al.: The human
plasma proteome: a nonredundant list developed by combi-
nation of four separate sources. Mol Cell Proteomics 2004,
3:311-326.
39. Tonshoff B, Blum WF, Vickers M, Kurilenko S, Mehls O, Ritz E:
Quantification of urinary insulin-like growth factors (IGFs)
and IGF binding protein 3 in healthy volunteers before and
after stimulation with recombinant human growth
hormone. Eur J Endocrinol 1995, 132:433-437.
40. Gersuk GM, Carmel R, Pattengale PK: Platelet-derived growth
factor concentrations in platelet-poor plasma and urine
from patients with myeloproliferative disorders. Blood 1989,
74:2330-2334.
41. Dyer AR, Greenland P, Elliott P, Daviglus ML, Claeys G, Kesteloot H,
Ueshima H, Stamler J: Evaluation of measures of urinary albu-
min excretion in epidemiologic studies. Am J Epidemiol 2004,
160:1122-1131.
42. Kanno K, Sasaki S, Hirata Y, Ishikawa S, Fushimi K, Nakanishi S, Bichet
DG, Marumo F: Urinary excretion of aquaporin-2 in patients
with diabetes insipidus. N Engl J Med 1995, 332:1540-1545.
43. Nielsen S, Frokiaer J, Marples D, Kwon TH, Agre P, Knepper MA:
Aquaporins in the kidney: from molecules to medicine. Phys-
iol Rev 2002, 82:205-244.
44. Takata K, Matsuzaki T, Tajika Y: Aquaporins: water channel pro-
teins of the cell membrane. Prog Histochem Cytochem 2004,
39:1-83.
45. Cutillas PR, Biber J, Marks J, Jacob R, Stieger B, Cramer R, Waterfield
M, Burlingame AL, Unwin RJ: Proteomic analysis of plasma
membrane vesicles isolated from the rat renal cortex. Pro-
teomics 2005, 5:101-112.
46. Gerasimenko JV, Gerasimenko OV, Petersen OH: Membrane
repair: Ca
2+
-elicited lysosomal exocytosis. Curr Biol 2001,
11:R971-R974.
47. Reddy A, Caler EV, Andrews NW: Plasma membrane repair
ismediated by Ca
2+
-regulated exocytosis of lysosomes. Cell
2001, 106:157-169.
48. Klein D, Bussow H, Fewou SN, Gieselmann V: Exocytosis of stor-
age material in a lysosomal disorder. Biochem Biophys Res
Commun 2005, 327:663-667.
49. Rehman I, Azzouzi AR, Catto JW, Allen S, Cross SS, Feeley K, Meuth
M, Hamdy FC: Proteomic analysis of voided urine after pros-
tatic massagefrom patients with prostate cancer: a pilot
study. Urology 2004, 64:1238-1243.
50. Thongboonkerd V, Malasit P: Renal and urinary proteomics:
current applications and challenges. Proteomics 2005,
5:1033-1042.
51. Celis JE, Wolf H, Ostergaard M: Bladder squamous cell carci-
nomabiomarkers derived from proteomics. Electrophoresis
2000, 21:2115-2121.
52. Rasmussen HH, Orntoft TF, Wolf H, Celis JE: Towards a compre-
hensive database of proteins from the urine of patients with
bladder cancer. J Urol 1996, 155:2113-2119.
53. Theodorescu D, Wittke S, Ross MM, Walden M, Conaway M, Just I,
Mischak H, Frierson HF: Discovery and validation of new pro-
tein biomarkers for urothelial cancer: a prospective analysis.
Lancet Oncol 2006, 7:230-240.
54. Zhang YF, Wu DL, Guan M, Liu WW, Wu Z, Chen YM, Zhang WZ,
Lu Y: Tree analysis of mass spectral urine profiles discrimi-
nates transitional cell carcinoma of the bladder from non-
cancer patient. Clin Biochem 2004, 37:772-779.
55. Meier M, Kaiser T, Herrmann A, Knueppel S, Hillmann M, Koester P,
Danne T, Haller H, Fliser D, Mischak H: Identification of urinary
proteinpattern in type 1 diabetic adolescents with early dia-
betic nephropathy by anovel combined proteome analysis. J
Diabetes Complications 2005, 19:223-232.
56. Wittke S, Haubitz M, Walden M, Rohde F, Schwarz A, Mengel M, Mis-
chak H, Haller H, Gwinner W: Detection of acute tubulointersti-
tial rejection by proteomic analysis of urinary samples in
renal transplant recipients. Am J Transplant 2005, 5:2479-2488.
57. Mishra J, Dent C, Tarabishi R, Mitsnefes MM, Ma Q, Kelly C, Ruff SM,
Zahedi K, Shao M, Bean J, et al.: Neutrophil gelatinase-associated
lipocalin (NGAL) as a biomarker for acute renal injury after
cardiac surgery. Lancet 2005, 365:1231-1238.
58. Ong SE, Mann M: Mass spectrometry-based proteomics turns
quantitative. Nat Chem Biol 2005, 1:252-262.
59. Max-Planck Unified Proteome Database (MAPU) [http://pro
teome.biochem.mpg.de/]
60. Wilm M, Shevchenko A, Houthaeve T, Breit S, Schweigerer L, Fotsis
T, Mann M: Femtomole sequencing of proteins from polyacr-
ylamide gels by nano-electrospray mass spectrometry.
Nature 1996, 379:466-469.
61. Foster LJ, De Hoog CL, Mann M: Unbiased quantitative pro-
teomicsof lipid rafts reveals high specificity for signaling
factors. Proc Natl Acad Sci USA 2003, 100:5813-5818.
62. Olsen JV, Ong SE, Mann M: Trypsin cleaves exclusively C-termi-
nal to arginine and lysine residues. Mol Cell Proteomics 2004,
3:608-614.
63. European Bioinformatics Institute: International ProteinIndex.
[ />64. Gene Ontology Annotation (GOA) Database [http://
www.ebi.ac.uk/GOA/]
65. Steen H, Mann M: The ABC's (and XYZ's) of peptide
sequencing. Nat Rev Mol Cell Biol 2004, 5:699-711.