Báo cáo y học: "Unraveling transcriptional control and cis-regulatory codes using the software suite GeneACT" potx
Bạn đang xem bản rút gọn của tài liệu. Xem và tải ngay bản đầy đủ của tài liệu tại đây (1.39 MB, 16 trang )
Genome Biology 2006, 7:R97
comment reviews reports deposited research refereed research interactions information
Open Access
2006Cheunget al.Volume 7, Issue 10, Article R97
Software
Unraveling transcriptional control and cis-regulatory codes using
the software suite GeneACT
Tom Hiu Cheung
*
, Yin Lam Kwan
†
, Micah Hamady
†
and Xuedong Liu
*
Addresses:
*
Department of Chemistry and Biochemistry, University of Colorado, 215 UCB, Boulder, Colorado 80309, USA.
†
Department of
Computer Science, University of Colorado, 430 UCB, Boulder, Colorado 80309, USA.
Correspondence: Xuedong Liu. Email:
© 2006 Cheung et al.; licensee BioMed Central Ltd.
This is an open access article distributed under the terms of the Creative Commons Attribution License ( which
permits unrestricted use, distribution, and reproduction in any medium, provided the original work is properly cited.
Cis-regulatory code browser<p>GENEACT, a new software suite for the detection of evolutionarily conserved transcription factor binding sites or microRNAs from dif-ferentially expressed genes from DNA microarray data, is described.</p>
Abstract
Deciphering gene regulatory networks requires the systematic identification of functional cis-acting
regulatory elements. We present a suite of web-based bioinformatics tools, called GeneACT http:/
/promoter.colorado.edu, that can rapidly detect evolutionarily conserved transcription factor
binding sites or microRNA target sites that are either unique or over-represented in differentially
expressed genes from DNA microarray data. GeneACT provides graphic visualization and
extraction of common regulatory sequence elements in the promoters and 3'-untranslated regions
that are conserved across multiple mammalian species.
Rationale
Cell type and tissue specific gene expression patterns are pri-
marily governed by the cis-regulatory sequence elements
embedded in the noncoding regions of the genome. These cis-
regulatory elements are often recognized in a sequence-spe-
cific manner by regulatory proteins or nucleic acids, which
regulate the expression of the corresponding gene. In partic-
ular, activation and repression of gene transcription typically
involves the binding of transcription factors to their cognate
binding sites. The levels of mRNA transcript can also be mod-
ulated by microRNAs (miRNA), which tend to bind specific
sequences in the 3'-untranslated region (UTR) of the tran-
script. Identification and characterization of cis-regulatory
sequence elements that control gene expression are crucial to
our understanding of the molecular basis of cell proliferation
and differentiation.
Until recently, identification of cis-regulatory sequences was
conducted experimentally on an individual gene basis, using
time-consuming procedures such as promoter cloning, chro-
matin immunoprecipitation (ChIP) assays, and reporter gene
assays using truncated and/or mutated DNA sequences.
Given that hundreds of transcription factors regulate the
expression of thousands of genes in the human genome, more
high-throughput procedures are desired. The sequencing of
several genomes, DNA microarray assays, and the rise of bio-
informatics represent major steps forward in this regard.
Sequencing of the human, mouse, and rat genomes has made
it possible to perform genome-wide analyses of regulatory
sequence motifs across these species. Such a comparative
genomics analysis is powerful because functional transcrip-
tion factor binding sites are likely to be under stronger evolu-
tionary constraints than random DNA sequences. Therefore,
reliable and effective identification of regulatory elements
could be achieved using interspecies sequence alignments of
orthologous genes [1,2]. Indeed, cross-species conservation
has been employed to predict conserved transcription factor
binding sites and to annotate promoters in mammals [3-9].
In these cases, the comparative genomics information
improved the accuracy of predicting biologically relevant
transcription factor binding sites.
Published: 25 October 2006
Genome Biology 2006, 7:R97 (doi:10.1186/gb-2006-7-10-r97)
Received: 16 June 2006
Revised: 18 September 2006
Accepted: 25 October 2006
The electronic version of this article is the complete one and can be
found online at />R97.2 Genome Biology 2006, Volume 7, Issue 10, Article R97 Cheung et al. />Genome Biology 2006, 7:R97
DNA microarray technology is used to profile relative mRNA
transcript levels between samples exposed to different exper-
imental conditions. DNA microarrays represent a high-
throughput, genome-wide experimental platform that ena-
bles analyses of differential gene expression. Differences in
transcript levels could be caused by several mechanisms,
most notably the differential activities of transcription factors
and miRNA. The interpretation of DNA microarray results
requires deciphering which transcription factors and/or
miRNA are likely to mediate the observed changes in tran-
script levels. We expect that co-expressed genes may share
similar cis-acting regulatory elements, which suggests that
such elements are likely to be over-represented in co-regu-
lated genes more than would be expected by random chance.
Flanking sequences for each gene are known from sequencing
efforts, and many of the sequences to which individual tran-
scription factors tend to bind have been determined experi-
mentally and catalogued in databases such as the
Transcription Factor Database (TFD) [10] and TRANSFAC
[11]; therefore, the systematic, high-throughput prediction of
specific cis-regulatory mechanisms important in a given bio-
logic context is now possible. Indeed, a number of computa-
tional programs have been developed to reveal transcription
factor binding sites that are statistically over-represented in
co-regulated genes [12-15].
Several deficiencies exist in currently available software for
predicting cis-regulatory elements. Most importantly, there is
no program currently available that incorporates search tools
for both transcription factor and miRNA binding sites. Recent
studies with miRNA suggest that differential miRNA expres-
sion could be responsible for differential mRNA expression
observed by DNA microarray data [16,17]. Therefore, it is
imperative to investigate both transcription factor binding
sites and miRNA binding sites in order to gain a more com-
prehensive understanding of the molecular basis of differen-
tial gene expression patterns. Second, an integrated web-
based cis-acting element browser for rapid identification of
over-represented potential transcription factor binding sites
and putative miRNA target sites has yet to be developed. The
lack of an easy-to-navigate graphical web interface has hin-
dered verification of computational predictions by experi-
mental biologists who may be less comfortable with less
accessible interfaces.
In this report we describe a suite of web-based, open source
bioinformatics software tools (GeneACT) that graphically dis-
play transcription factor binding sites and microRNA target
sites in the regulatory regions of human, mouse, and rat
genomes. In addition, we present a unique method to identify
quickly transcription factor binding sites or miRNA target
elements that are over-represented in differentially expressed
genes based on DNA microarray data. Thus, GeneACT ena-
bles the identification of putative cis-acting elements that are
evolutionarily conserved across species for a specified set of
genes, which can be used to unravel transcriptional regula-
tory networks that are likely to be involved in differential gene
expression.
Development of GeneACT
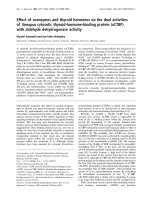
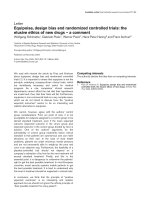
GeneACT, an overview of which is given in Figure 1, is a suite
of web-based bioinformatics tools including four useful
search interfaces: differential binding site search (DBSS),
potential binding site search (PBSS), genomic sequence
retrieval, and TFD search. All tools are designed to character-
ize the regulatory regions of a specified set of genes employing
the technique of comparative genomics. Genomic sequence
data from human (May 2004 release), mouse (May 2004
release), and rat (June 2003 release) were downloaded from
the NCBI (National Center for Biotechnology Information)
ftp site [18]. TFD [19] and ortholog information (National
Center for Biotechnology Information [NCBI] HomoloGene
build 37.2) [20] were also downloaded from the NCBI ftp sites
and employed as described below.
Detailed documentation of each of the tools in GeneACT can
be found on the GeneACT website [21]. GeneACT is mainly
written using Java and makes use of Tomcat as the web
server. The web front end communicates with the back end
via Java server page. Genomic and pre-processed data are
stored in a postgreSQL database. Tutorials for GeneACT can
be found on the website [21].
Differential binding site search
Pre-processing of sequence data underlying the GeneACT
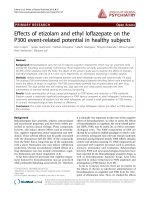
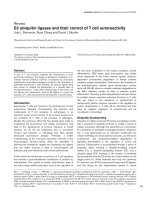
tools was carried out as follows. DBSS, the interface of which
is shown in Figure 2, offers a choice of three searchable
regions. The first region is denoted 'upstream of start codon',
and to facilitate this search we stored the occupancies of all
the binding sites in our regulatory sequence database
(approximately 7000 known binding sites) in each gene
found in a HomoloGene group that spans all three species up
to 10,000 base pairs (bp) upstream from the start codon. We
define a conserved binding site as one that is found in each of
the three species within the search region, and only those
binding sites that are conserved are stored for DBSS.
Although promoters are frequently found near the 5'-UTRs, it
is often the case that regulatory regions can be thousands of
base pairs away from the transcriptional start site (for exam-
ple, distal enhancers) [22-24]. As a result, we extended our
search region up to 10,000 bp away from the start codon in
order to cover the region of the 5'-UTR and regions that might
contain these distal enhancers.
The second option for searchable region is 'downstream of
stop codon'. Similar pre-processing was done for the down-
stream region from -2000 to +100 (2000 bp downstream of
the transcript end) with respect to the stop codon. All inci-
dences of transcription factor binding sites spanning all three
species were also stored for this region. Finally, we offer a
Genome Biology 2006, Volume 7, Issue 10, Article R97 Cheung et al. R97.3
comment reviews reports refereed researchdeposited research interactions information
Genome Biology 2006, 7:R97
search option dedicated to detecting the occurrences of
miRNA binding sites. In this case, the 3'-UTRs, defined as the
region between the stop codon and the polyA signal, were
extracted from the genome assemblies, and we employed
miRanda [25], which is an algorithm for finding miRNA tar-
gets sites in 3'-UTRs [26]. This algorithm is based on a modi-
fied version of the Smith-Waterman algorithm [27]. Instead
of building an alignment based on matching nucleotides, its
score is based on the complementarity of nucleotides; this
also allows G = U 'wobble' pairs, which are important for
RNA:RNA duplex formation [28]. In addition, free energy is
also calculated to estimate the energetics of the RNA:RNA
complexes using the Vienna library. This feature makes the
algorithm a preferred choice in searching for miRNA recogni-
tion sites because miRNAs form imperfect base pairs with the
target mRNA [26]. To provide more stringent search results,
we deposited into our database only the mature miRNA
sequences from the miRBase database [29] that are abso-
lutely conserved in all three species.
3'-UTRs from all three mammalian genomes are extracted
and individually searched for potential miRNA target sites.
Using the approach developed by Enright and coworkers
[26], we pre-processed all three genomes individually for
potential miRNA target sites. In order to count as a potential
miRNA target site, we required the miRNA target sites to be
found in each of the three genomes. Furthermore, it is specu-
lated that multiple occurrences of the same miRNA target
sequence in the 3'-UTR of a given mRNA increases the prob-
ability of it being regulated by that miRNA. Therefore, we
introduced customizable searches by filtering the target sites
into three categories based on the number of conserved
matches found. In the first case, at least one conserved match
must be present in the 3'-UTR of the target mRNA. For the
second and the third cases, at least two or three conserved
matches of the same miRNA must be present in the same tar-
get mRNA 3'-UTR, respectively. To qualify as a potential tar-
get site, the miRNA target site must be conserved across all
three genomes. Users can access the database via the Gene-
ACT web interface [30].
Potential binding site search
In order to display the presence of consensus transcription
factor binding site sequences on a promoter that spans multi-
ple species, we developed a novel Scalable Vector Graphic
Overview of the GeneACT architecture and methodFigure 1
Overview of the GeneACT architecture and method.
R97.4 Genome Biology 2006, Volume 7, Issue 10, Article R97 Cheung et al. />Genome Biology 2006, 7:R97
(SVG)-based graphical interface to display this information in
a promoter-oriented way. Using the PBSS, regulatory regions
of genes in multiple species along with the consensus TFD
binding site information can be quickly visualized. The inter-
face of PBSS is shown in Figure 3a. PBSS takes as input a set
of NCBI Entrez gene IDs or gene names and the selected
region to visualize. PBSS automatically retrieves the specified
region for each gene in the input set based on the correspond-
ing genome annotation. There are three specific regions that
can be searched: the regulatory region of a gene upstream of
the transcription start site, upstream from the start codon,
and downstream from the stop codon. Alternatively, custom
sequences can be specified. Along with the use of TFD, users
can also enter arbitrary binding site IUPAC (International
Union of Pure and Applied Chemistry) degenerate sequences.
If the 'across genomes' option is selected, then only the bind-
ing sites that span the selected genomes are reported. In addi-
tion to the SVG graphical display, users can also choose to
generate tab-delimited text, which can be readily imported
into other programs such as Microsoft Excel. A sample SVG
graphical output for the gene CDC2 (cell division cycle 2) is
shown in Figure 3b.
The benefits of the SVG graphical display of the regulatory
regions of genes, presented in a regulatory motif-oriented
fashion for each species, are numerous (Figure 3b). One
major advantage of the SVG graphical display is that it pro-
vides dynamic controls such that the user can switch on and
off the display for each binding site and change the range of
the location. Furthermore, in moving the cursor over individ-
ual binding sites, additional information, such as the binding
site sequence pattern and the location of the binding site, can
be displayed. Interestingly, the CDC2 motifs are conserved
around the -150 bp region, of which two of the binding sites
are elongation factor-2s (E2Fs). In Figure 3c, the same region
is displayed with only the E2F-binding sites highlighted.
Indeed, this regulatory region has been cloned by Zhu and
coworkers [31], and the region was shown to be responsive to
Web interface of the differential binding site searchFigure 2
Web interface of the differential binding site search. Gene IDs from control gene set (unchanged in DNA microarray data) and regulated gene set
(upregulated or downregulated from microarray data) are pasted into respective windows. The threshold of binding site ratio is defined by the user. The
user can specify a range of interest with three choices of regions (upstream from the transcription start site, upstream from the start codon, or
downstream from the stop codon). TF, transcription factor.
Genome Biology 2006, Volume 7, Issue 10, Article R97 Cheung et al. R97.5
comment reviews reports refereed researchdeposited research interactions information
Genome Biology 2006, 7:R97
E2Fs. Using the GeneACT promoter browser, the arrange-
ment of the binding sites across genomes can be easily visual-
ized. Based on this analysis, the user can identify a potential
regulatory region in a faster and more educated fashion than
the traditional method of arbitrary sequential deletion analy-
sis. The ease of use and clear presentation should be an
attractive feature for experimental biologists.
Genomic sequence retrieval and Transcription
Factor Database search
GeneACT also provides other tools to make promoter analysis
easier. The genomic sequence retrieval tool allows the user to
retrieve genomic sequences in a FASTA format using relative
position with respect to the transcription start site, start
codon, or stop codon. When the input has more than one gene
name or gene ID, sequences are returned in a concatenated
FASTA file. Information about the sequence such as the chro-
mosomal location, gene name, synonyms, and gene ID are
printed in the header of the FASTA file. For the genes that are
annotated to be on the reverse complement strand, this tool
returns the sequence on the reverse complement strand.
TFD search can be used to perform a query in the TFD dataset
for binding site sequence or transcription factor name (Figure
4). Other than transcription factor binding sites, miRNA-
binding sequences are also important for regulation of gene
expression. To keep the database contents up to date, the user
can submit putative novel binding site sequences via this tool.
All submissions will be curated and deposited into our data-
base. These new binding sites will then be included for the
next round of pre-processing for DBSS such that they will be
available for searches within all tools in GeneACT. In this
way, GeneACT will remain relevant to the current literature.
For the most in-depth information on how to use GeneACT,
help documentation is available on the website [21].
Mining gene expression data using differential
binding site search
The use of microarrays to elucidate genome-wide gene
expression patterns is now standard practice. These microar-
ray experiments generate large sets of differentially expressed
genes, but the actual mechanism that controls the differential
gene expression cannot readily be deduced using this tech-
nique alone. To ascertain the cis-regulatory elements that
could mediate the differential gene expression patterns, we
developed the DBSS tool to explore the distributions of regu-
latory sequence elements between the differentially
expressed genes compared with those of the control genes. A
corollary to the importance of cis-acting regulatory elements
to generating differential gene expression patterns is that
some of the co-expressed genes may share a common subset
of these elements, and the observed frequency of these ele-
ments in the upregulated or downregulated gene set should
be greater than in the unchanged gene set.
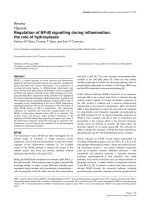
Web interface of the potential binding site searchFigure 3
Web interface of the potential binding site search. (a) Web interface of
potential binding site search. Gene IDs can be input in the form of either
gene names (synonyms supported) or NCBI Entrez gene ID. There are
currently three species to choose from (human, mouse, and rat) and it is
optional to display whether the binding site sequence goes across
genomes or to display all binding sites regardless of conservation across
species. The user can specify a range of interest with three choices of
regions (upstream from the transcription start site, upstream from the
start codon, or downstream from the stop codon). Other than binding
sites in the Transcription Factor Database (TFD), the user can input
binding site sequences using standard IUB/IUPAC nucleic acid codes. For
output option, the user can choose the visualization option for the
promoter browser or a text file output. (b) Visualization of the CDC2
upstream region using GeneACT promoter browser. CDC2 upstream
region (-500 to +100 base pairs) is shown, where +1 is the transcription
start site. Only binding site sequences that go across all genomes are
shown. Chromosomal locations of the binding site sequences and the full
sequences are available in text file format via the 'download result' and
'download FASTA file' links. (c) Visualization of elongation factor-2 (E2F)-
binding sites in the CDC2 upstream region. It is the same region as is
shown in Figure 3b, with only the E2F sites highlighted. Other binding sites
were suppressed by the toggle.
(a)
(b)
(c)
R97.6 Genome Biology 2006, Volume 7, Issue 10, Article R97 Cheung et al. />Genome Biology 2006, 7:R97
DBSS tracks the frequencies of cis-acting elements conserved
in human, mouse, and rat in a given set of genes and reveals
the over-represented cis-acting elements in comparison with
a control gene set. DBSS takes as input two sets of genes: a
control set and a regulated set. For the purposes of identifying
over-represented transcription factor binding sites in the reg-
ulated set, the regulatory regions of each gene in both sets are
searched for transcription factor binding sites that are con-
served across each genome. At present, we have pre-proc-
essed each gene that contains ortholog information in NCBI
HomoloGene for the -10,000 bp to +100 bp region centered
on the start codon and the -2000 bp to +100 bp region cen-
tered on the stop codon for the purposes of looking for
enriched transcription factor binding sites. Restricting the
binding sites solely to those that span multiple genomes is
intended to reduce background noise. However, certain short
degenerate binding site sequences may still appear as false
positives. Thus, we use the control set of genes to reduce fur-
ther the false-positive rate because these types of binding
sites are also expected to appear with high frequency in this
dataset as well.
Specifically, the DBSS calculates the frequency at which each
binding site occurs in genes from both the regulated set and
control set. The fold change in frequency of each binding site
between the regulated and control gene sets is calculated in
order to find binding sites that are enriched in the regulated
set. For binding sites that do not contribute to the regulation
of a particular gene, we expect there to be no relative change
in frequency. These genes are then filtered from the results by
specifying a lower bound for the 'binding site ratio' option on
the search interface. For example, to keep only the binding
sites that have three times the frequency in the regulated set
versus the control set, one would specify a lower bound of
three. By looking at the binding sites that have a large ratio
(fold change) between the regulated set genes and control set
genes, the binding site sequences that are potentially impor-
tant to the regulation of a given system under specific condi-
tions or treatments can quickly be determined. In this way,
the regulatory mechanism of how the transcription factors
regulate a given system can be inferred from the enriched
binding site sequences.
Discovering potential transcription factor
participants in a system using differential binding
site search
To test whether mining of DNA microarray datasets using
DBSS can generate novel insights into the key transcription
factors operating in differential gene expression, we down-
loaded a microarray dataset (GSE1692) deposited in the
NCBI Gene Expression Omnibus [32] database by Cam and
coworkers [33]. Those investigators investigated cell cycle
dependent gene expression in T98G fibrosarcoma cells. They
performed gene expression and ChIP-chip analyses of asyn-
chronous cells compared with quiescent cells prepared by
removal of serum for 3 days. To analyze the same dataset
independently, we first performed t-tests for each gene in this
dataset and set our threshold at P < 0.05 to define genes that
were differentially expressed; there were a total of 670 genes
in this regulated gene set. We chose the genes that had P > 0.7
as our controls; there were a total of 612 genes in this control
gene set. The actual P values for individual genes are reported
in Additional data file 1. Using the DBSS, we analyzed the pro-
moter regions of these genes in the -10,000 bp to +100 bp
region relative to the start codon and filtered the results to
those binding sites with a threefold change in frequency. As
shown in Table 1, E2F-related binding sites dominated the list
of search results, suggesting that the E2F family of transcrip-
tion factors may be involved in the observed difference in
gene expression profiles between quiescent and proliferating
cells. Indeed, our results were in good agreement with those
of Cam and coworkers [33].
To demonstrate independently that some of the genes
appearing in our list predicted to contain over-represented
E2F binding sites are indeed bound by E2F1 or E2F4 in vivo,
we conducted a ChIP assay. We used E2F1 and E2F4 antibod-
ies to analyze the occupancies of these two transcription fac-
tors on five different promoters in both synchronized and
quiescent T98G cells. A brief description of our ChIP method-
ology is as follows. Approximately 1 × 10
7
T98G cells were
fixed with formaldehyde (1% final concentration) at room
temperature for 10 min. Fixation was stopped by the addition
of glycine for 5 min. Cells were washed once with ice-cold
phosphate-buffered saline supplemented with protease
inhibitors (1 μg/ml phenylmethylsulfonyl fluoride, 1 μg/ml
aprotinin, 1 μg/ml pepstatin). Cells were scraped and pelleted
in the same buffer. Cell pellets were lysed in 0.5 ml lysis buffer
(1% sodium dodecyl sulfate; 10 mmol/l EDTA; 50 mmol/l
Tris-HCl [pH 8.0]). Soluble chromatin was prepared by soni-
cation of the cell lysates. Subsequent immunopreciptation
and analysis were performed essentially according to the
method proposed by Lambert and coworkers [34], except that
antibodies against E2F-1 (sc-193; Santa Cruz Biotechnology,
Santa Cruz, CA, USA) and E2F-4 (sc-1082; Santa Cruz Bio-
technology) were used; 0.1% of total input chromatin was
used in the polymerase chain reactions in the input lane.
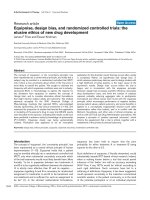
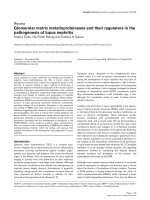
As shown in Figure 5, all five promoters are indeed targeted
by E2F1 or E2F4, although the pattern of binding varies
among these five genes. Whereas our ChIP data on DHFR,
CDC6, CDC25A, and MCM3 are consistent with published
results, binding of E2F1 and E2F4 to DUSP4 is a novel find-
ing. Thus, based on the results of DBSS, we can gain biological
insights similar to those obtained by ChIP-chip analysis.
To demonstrate the visualization capabilities of GeneACT, we
use the example of serum response factor (SRF), whose bind-
ing sites were highly enriched in the regulated gene set. The
increased presence of SRF binding sites implies that genes
containing this site might be regulated by SRF when cells
Genome Biology 2006, Volume 7, Issue 10, Article R97 Cheung et al. R97.7
comment reviews reports refereed researchdeposited research interactions information
Genome Biology 2006, 7:R97
enter G
1
from G
0
. Indeed, one of the differentially expressed
genes that contributes to the SRF ranking, namely EGR1, has
been independently shown to be activated by SRF [35]. Genes
that contain either E2F or SRF binding sites are listed in
Additional data file 3. The location of the putative E2F-bind-
ing sites can easily be tracked down using the GeneACT
graphical interface of PBSS. The promoter regions (-600 bp
to +100 bp) of MCM5 (Figure 6a) and DHFR (Figure 7a) are
shown in the promoter browser using PBSS. Figures 6b and
7b highlight just the E2F binding sites conserved in these pro-
moter regions, respectively. Taken together, our results sug-
gest that DBSS in GeneACT can be a simple but very useful
tool to gain novel insights from microarray data quickly.
Discovering potential microRNA participants in
a system using differential binding site search
If the abundance of mRNA is regulated by miRNA, then we
would expect that expression levels of miRNAs and their
authentic targets should be anti-correlated. Accordingly,
computational identification of over-represented miRNA tar-
get sites shared among co-regulated genes from DNA micro-
array data in theory should provide valuable leads to uncover
the biologically relevant miRNAs responsible for differential
gene expression. To test this hypothesis in a well character-
ized system, we downloaded and analyzed the dataset created
by Lim and coworkers [17]. This investigation was to identify
the targets of miR-1 and miR-124 in HeLa cells by overexpres-
sion of these two miRNAs independently followed by profil-
ing mRNA transcript levels by DNA microarray analysis. They
found that 96 and 174 annotated genes were downregulated
Search transcription factor binding site databaseFigure 4
Search transcription factor binding site database. (a) Custom transcription factor database based on Transcription Factor Database (TFD). Database can
be queried by sequence and name. New entries into the database can be added by the system administrator. (b) Display of the search result of a
transcription factor binding site. The literature information of the binding site is shown.
(a)
(b)
R97.8 Genome Biology 2006, Volume 7, Issue 10, Article R97 Cheung et al. />Genome Biology 2006, 7:R97
by miR-1 and miR-124, respectively. If over-representation of
miRNA target sites among co-regulated genes can be
exploited to unravel the controlling miRNAs in differential
gene expression, then searching the list of 96 or 174 genes
using the 3'-UTR search function with the DBSS tool is
expected to reveal over-representation of miR-1 or miR-124
target sites, respectively, among these two group of genes.
miR-1 and miR-124 are noted for their tissue specificity in
mammals. miR-1 is known to be preferentially expressed in
heart and skeletal muscle, whereas miR-124 is known to be
preferentially expressed in brain [36,37]. Because they are
tissue-specific miRNAs, we used each of the datasets as a con-
trol for the other.
The results are summarized in Table 2 and Additional data
file 4. As predicted, miR-124 target sites ranked among the
top of the list in the search result when the regulated gene set
input was the miR-124 overexpression experiment. As for
miR-1, we found that miR-1 was excluded from our analysis
because of the missing orthologous miR-1 mature miRNA
sequence in rat, and so it is not discussed further. We note
that the target sites for many other miRNAs were also
enriched in addition to the miR-124 target sites. This implies
that genes that are downregulated by miR-124 also contain
miRNA target sites for other miRNAs. It is possible that mul-
tiple miRNAs might act on similar sets of genes that are
downregulated by miR-124 in the HeLa cell line. Recapturing
miR-124 from the DBSS search in GeneACT using the corre-
sponding list of genes determined by DNA microarray analy-
sis suggests that this is a potentially very productive approach
to zero in on the miRNAs responsible, at least in part, for a
given expression profile.
Predicting microRNA participants in skeletal
muscle differentiation
Myogenic differentiation is a process that leads to the fusion
of muscle precursor cells (myoblasts) into multinucleated
myofibers in the animal. The C2C12 myoblast cell line serves
as a good in vitro model for studying skeletal muscle differen-
tiation because these cells are able to differentiate terminally
into myotubes when serum is withdrawn from the culture
medium [38,39]. To understand the potential involvement of
miRNAs in regulating skeletal muscle differentiation and fur-
ther test our tool, we employed DBSS to analyze a C2C12 dif-
ferentiation microarray dataset found on NCBI GEO. In this
dataset, C2C12 differentiation was studied from day 0 to day
10 of serum withdrawal [40]. Our control genes were those
that were upregulated at all time points compared with the
control undifferentiated myoblasts. We hypothesized that
these genes are less likely to be changed by the miRNA
because they are upregulated in the time course and the
nature of miRNA regulation is to downregulate the expres-
sion of mRNA. To perform the analysis, we compared the cells
at day 2 of differentiation with those at day 0 (Additional data
files 5 and 6).
The result is summarized in Table 3. Our in silico analysis of
the C2C12 microarray gene expression profile using DBSS
implied that at least 14 miRNA target sites are over-repre-
sented in downregulated mRNAs during myogenic differenti-
ation in C2C12 cells, suggesting that some of these
microRNAs may be differentially expressed during myogenic
differentiation and contribute to the mRNA expression pro-
file. Recently, Chen and colleagues [16] investigated a
number of miRNA expression profiles during C2C12 differen-
tiation using a miRNA microarray. Their miRNA array
expression data revealed that miR-133a, miR-206, and miR-
130a were ranked at the top of the list of a few miRNAs that
were upregulated upon myogenic differentiation. In compar-
ing our in silico predictions with their experimental results,
we found that our analysis recaptured miR-133a, miR-206,
and miR-130a target sites as the most enriched in differen-
tially expressed genes. Therefore, a differential miRNA target
site search can generate predictions consistent with experi-
mental results in this system.
It has previously been demonstrated in vitro that more than
two miRNA target sites in a given 3'-UTR seem to boost the
efficacy of miRNA-mediated gene repression [41]. To test
whether implementing the more stringent requirement that
at least two or three conserved sites are present on any one
mRNA will improve the accuracy of predicting the miRNA
participants in the skeletal muscle differentiation dataset, we
compared the output of the more than two target site predic-
tion with the result of the microRNA microarray experiment.
As shown in Table 3, introduction of this additional con-
straint did not improve the performance of the prediction
when compared with the experimental results. Therefore, it
remains to be determined whether multiplicity of miRNA tar-
get sites in mRNA can be used as a reliable criterion for pre-
dicting the authenticity of miRNA targets.
Discussion
GeneACT was developed to display and analyze regulatory
regions across human, mouse and rat genomes, and it enables
identification of putative cis-acting elements that are evolu-
tionarily conserved across species for all orthologous genes. A
comparative, online, web-based, graphically oriented pro-
moter browser was developed for the public domain. Using
the DBSS, insights can be gained into a particular system in
which transcription factors might be involved. GeneACT ena-
bles integration of cis-regulatory sequences identified by a
comparative genomics approach with microarray expression
profiling data to explore the underlying gene expression reg-
ulatory networks.
To illustrate the uniqueness of GeneACT, we compared Gene-
ACT with different existing software. The comparison is sum-
marized in Table 4. There are three distinct features that
separate GeneACT from other related programs, the first of
which is that GeneACT is the only open source online soft-
Genome Biology 2006, Volume 7, Issue 10, Article R97 Cheung et al. R97.9
comment reviews reports refereed researchdeposited research interactions information
Genome Biology 2006, 7:R97
ware that allows identification of over-represented miRNA
target sites from a list of genes of interest.
Second, GeneACT employs the TFD database and pattern
matching for in silico annotation or prediction of potential
transcription factor binding sites. Virtually all other pro-
Table 1
Binding site sequences that are enriched in quiescent T98G cells versus asynchronous T98G cells from DBSS
Name of binding site Transcription factor Sequence Ratio Regulated gene
frequency
Control gene
frequency
a
E2F4/DP_consensus E2F4/DP TTTSGCGCS 8.221 9 1
element_II_rs-4 element_II_rs-4 TTTCGCG 7.307 8 1
a
E2F_CS E2F TTTTSSCGS 7.307 8 1
AP-1-erk1 AP-1 CAGACTAA 6.394 7 1
m4-AP-1_site AP-1 GTGAGTAA 5.481 6 1
E1A-BS4 E1A-BS4 GTCAAAGT 5.481 6 1
a
E2F_site_(2) E2F TTTGGCGC 5.481 6 1
E1A-BS5 E1A-BS5 TCTCAGGTG 5.481 6 1
epsilon-NRA-FP2 undefined GAGATACC 5.481 6 1
HC5 HC5 CCGAAAC 4.567 10 2
TB3 NF-IL-6 AACTGGAAA 4.567 5 1
GCN4_CS1 GCN4 ATGASTCAT 4.567 10 2
MyoD-MLC_(1) MyoD CCAGCTGGC 4.567 5 1
Sp1-t-PA Sp1 ACCCCGCCC 4.567 10 2
CArG_CS SRF CCAWATWWGG 4.567 5 1
RC1/RC2-CYC RC1/RC2 TGACCGA 4.567 5 1
DHFR-undefined-site-1 DHFR-undefined-site-1 GGATTGGC 4.110 9 2
TopoII_RS Topoisomerase II RNYNNCNNGYNGKTNYCY 4.110 9 2
element_II-rs-1 element_II-rs-1 GGCGTAA 3.654 4 1
C/EBP-TTRS3 C/EBP TCTTACTC 3.654 8 2
Sp1-Vdac2 Sp1 CCTCGCCTC 3.654 4 1
glide/gcm_CS glide/gcm ATRCGGGY 3.654 4 1
spB-4bp STAT3 TTCCGGAA 3.654 4 1
C/EBP-AT-Site-C.2 C/EBP TCTTAAGC 3.654 8 2
PUT2_UAS2; PUT2_UAS.2 PUT3 GAAGCCGA 3.654 4 1
NFkB_CS2 NF-kB RGGGRMTYYCC 3.349 11 3
a
E2F_site_(3) E2F TTGGCGC 3.288 18 5
NF-E2_CS NF-E2_CS TGACTCAGC 3.197 7 2
a
E2F_CS.2 E2F SCGSGAAAA N/A 7 0
AluA AluA GGAGGCTGAGGCA N/A 6 0
a
E2F_CS.1 E2F TTTCGCGC N/A 5 0
Swi4-mdscan-motif-3 Swi6 AAACGCG N/A 5 0
E-box/ATF/CREB_site Ebox protein/ATF/CREB GTGACGCA N/A 5 0
GCN4-his3-189 GCN4 ATGACTCAT N/A 4 0
GCF-beta-actin_(2) GCF GCGCGGGCCG N/A 4 0
Sp1-XIST_(1) Sp1 GGCCACGCC N/A 4 0
rMT-III-motif-9 undefined CAGGCACCT N/A 4 0
DBP-CS DBP RTTAYGTAAR N/A 4 0
CDF1_RS CDF1 CTAAATAC N/A 4 0
alphaA-crystallin-PE2A AP-1 CTGACTCAC N/A 4 0
a
E2F-myc E2F GCGGGAAAA N/A 4 0
A selected list is shown here; see Additional data file 1 for the full list. Only binding site sequences with a fold change in frequency of occurrence of
greater than three are shown.
a
E2F-binding sites are highlighted in grey. Ratio of 'N/A' denotes binding site sequences that can only be found in either
the control or regulated gene set. DBSS, differential binding site search; E2F, elongation factor-2.
R97.10 Genome Biology 2006, Volume 7, Issue 10, Article R97 Cheung et al. />Genome Biology 2006, 7:R97
grams make use of the position weight matrix (PWM)-based
TRANSFAC [11] and related JASPAR databases [42]. Because
transcription factors tend to bind short and degenerate
sequences, the PWM-based approach provides better defini-
tion of transcription factor binding properties based on bind-
ing affinity. This method has proved to be very effective for in
silico prediction of prokaryotic transcription factor binding
sites [43,44]. However, there are significant limitations for a
PWM-based approach for analysis of mammalian transcrip-
tion factor binding sites [45,46]. A PWM assumes that the
recognition sequence is of fixed length and each base contrib-
utes independently to the total binding energy of the tran-
scription factor/DNA complex. In mammalian systems,
binding affinity may not be a reliable predictor for biologically
relevant binding sites [46]. One of the major features of tran-
scriptional regulation in eukaryotic systems is combinatorial
control featuring two or more transcription factors binding
synergistically to their target sites [47,48]. The context of the
binding site is often more important than individual binding
sites. We chose to use the TFD database because almost all of
the transcription factor binding sites documented in the data-
base were defined experimentally (for example, by reporter
assays). The TFD contains more than 7000 characterized
binding sites from a variety of biologic contexts. These bind-
ing sites are naturally selected for function during evolution.
Thus, using TFD in our in silico analysis provides an alterna-
tive and perhaps more relevant approach to identification of
putative transcription factor binding sites in the flanking
regions of genes of interest. Given the findings that no single
transcription factor binding site discovery program is supe-
rior from a number of comparative studies and that using
multiple independent programs improves the performance of
prediction [49], GeneACT is a valuable addition to existing
tools.
The third and final distinct feature that separates GeneACT
from other related programs is that the output of GeneACT is
geared toward easy visualization and pattern recognition. It is
designed to be a simple, freely available tool for experimental
biologists to navigate promoter regions and discover the sig-
nificance of a given DNA sequence based on comparative
genomic analysis and DNA microarray data. Extensive tutori-
als and help documents are available on our website help page
to guide users through different tools on this site. A major fea-
ture of GeneACT is the miRNA target site search capability.
This is crucial, given that up to one-third of human genes
could be targeted for regulation by miRNA [50], in addition to
regulation by transcription factors. It is therefore important
to investigate both transcription factors and miRNAs when
searching for critical genes that may be responsible for differ-
ential gene expression. By integrating both transcription fac-
tor binding sites and miRNA target sites into DBSS, we
provide a more comprehensive analysis of DNA microarray
datasets. Indeed, we showed that GeneACT accurately pre-
dicted the involvement of E2F during cell cycle progression
and involvement of certain miRNAs during muscle cell differ-
entiation from DNA microarray datasets.
The quality of predictions of critical cis-regulatory elements
involved in differential gene expression depends heavily on
the reliability of transcription factor recognition and miRNA
target site prediction. Accurate computational prediction of
miRNA target sites is still a very challenging task because of
insufficient experimental data [51]. For example, it is not
clear whether the length of the 3'-UTR where the putative
miRNA target sites reside contributes to the efficacy of gene
repression. A definitive answer to this question is likely to dic-
tate how to factor the length of the 3'-UTR into reliable pre-
diction scores.
GeneACT is open source online software and is relative easy
to upgrade. We expect DBSS will improve significantly as
miRNA target site prediction and transcription factor binding
site recognition becomes more reliable. Moreover, in the
future we plan to add additional genomes to GeneACT as they
become available. Even so, it is possible for researchers inter-
ested in other species to use GeneACT by taking advantage of
the input sequence feature and/or input binding site feature
of PBSS. In this way, we expect researchers from different and
diverse fields to find a valuable resource in GeneACT.
Additional data files
The following additional data are available with the online
version of this paper. Additional data file 1 is a table contain-
ing the original DNA microarray data generated by Cam and
E2F1 and E2F4 occupancies in different promoter regions predicted by differential binding site searchFigure 5
E2F1 and E2F4 occupancies in different promoter regions predicted by
differential binding site search. A chromatin immunoprecipitation
experiment was performed as described in the text. Mock experiments
were done using no antibodies (No Ab), which served as a negative
control for the experiment. Input lane represents polymerase chain
reactions using 0.1% of total input chromatin. E2F, elongation factor-2.
CDC6
CDC25A
MCM3
DHFR
DUSP4
Input
No Ab
E2F1
E2F4
Input
No Ab
E2F1
E2F4
T98G Async T98G G0
1 2 3 4 5 6 7 8
Genome Biology 2006, Volume 7, Issue 10, Article R97 Cheung et al. R97.11
comment reviews reports refereed researchdeposited research interactions information
Genome Biology 2006, 7:R97
coworkers [33] used for DBSS; the gene IDs of regulated and
control gene sets used for the search are listed. Additional
data file 2 is a table containing the full list that is summarized
in Table 1. Additional data file 3 is a table containing cell cycle
regulated genes containing E2F or SRF binding sites. Addi-
tional data file 4 is a table containing the full list that is sum-
marized in Table 2; the gene IDs of the miR-124 dataset used
for the search are listed. Additional data file 5 is a table con-
taining the original DNA microarray data generated by Tom-
czak and coworkers [40] used for the DBSS; gene IDs of
regulated and control gene sets used for the search are listed.
Graphic display of transcription binding sites in the MCM5 promoter regionFigure 6
Graphic display of transcription binding sites in the MCM5 promoter region. (a) Visualization of the MCM5 upstream region. MCM5 upstream region (-600
to +100 base pairs) is shown, where +1 is the transcription start site. Only binding site sequences that go across genomes are shown. (b) The same region
as is shown in panel a, with only the E2F sites highlighted.
(a)
(b)
R97.12 Genome Biology 2006, Volume 7, Issue 10, Article R97 Cheung et al. />Genome Biology 2006, 7:R97
Graphic display of transcription binding sites in the DHFR promoter regionFigure 7
Graphic display of transcription binding sites in the DHFR promoter region. (a) Visualization of DHFR upstream region. Same parameters were used as for
MCM5 (see Figure 6). (b) Same region as shown in panel a, with only the E2F sites highlighted. E2F, elongation factor-2.
(b)
(a)
Genome Biology 2006, Volume 7, Issue 10, Article R97 Cheung et al. R97.13
comment reviews reports refereed researchdeposited research interactions information
Genome Biology 2006, 7:R97
Additional data file 6 is a table containing the full lists sum-
marized in Table 3.
Additional data file 1Table containing the original DNA microarray data generated by Cam and coworkers [33] used for DBSSTable containing the original DNA microarray data generated by Cam and coworkers [33] used for DBSS; the gene IDs of regulated and control gene sets used for the search are listed.Click here for fileAdditional data file 2Table containing the full list that is summarized in Table 1Table containing the full list that is summarized in Table 1.Click here for fileAdditional data file 3Table containing cell cycle regulated genes containing E2F or SRF binding sitesTable containing cell cycle regulated genes containing E2F or SRF binding sites.Click here for fileAdditional data file 4Table containing the full list that is summarized in Table 2Table containing the full list that is summarized in Table 2; the gene IDs of the miR-124 dataset used for the search are listed.Click here for fileAdditional data file 5Table containing the original DNA microarray data generated by Tomczak and coworkers [40] used for the DBSSTable containing the original DNA microarray data generated by Tomczak and coworkers [40] used for the DBSS; gene IDs of regu-lated and control gene sets used for the search are listed.Click here for fileAdditional data file 6Table containing the full lists summarized in Table 3Table containing the full lists summarized in Table 3.Click here for file
Acknowledgements
We thank Rob Knight, Natalie Ahn, Jim Goodrich, Leslie Leinwand, and
members of the Liu laboratory for helpful discussions. We thank David
Clarke and Kristen Barthel for critical reading and editing of the manuscript
and Genevieve Hudak, Mai Sasaki, Jinhua Zhang, and Steve Smithwick for
the early stage development of the GeneACT project. Tom H Cheung was
supported by a predoctoral training grant from NHLBI (5T32HL07851).
This work is supported by grants from NIH (CA095527), US Army Breast
Cancer Research Program (DAMD17-02-1-0350), and WM Keck Founda-
tion Initiative in RNA science at the University of Colorado to Xuedong Liu.
References
1. Hardison RC: Conserved noncoding sequences are reliable
guides to regulatory elements. Trends Genet 2000, 16:369-372.
2. Pennacchio LA, Rubin EM: Genomic strategies to identify mam-
malian regulatory sequences. Nat Rev Genet 2001, 2:100-109.
3. Loots GG, Ovcharenko I, Pachter L, Dubchak I, Rubin EM: rVista for
comparative sequence-based discovery of functional tran-
scription factor binding sites. Genome Res 2002, 12:832-839.
4. Xie X, Lu J, Kulbokas EJ, Golub TR, Mootha V, Lindblad-Toh K,
Lander ES, Kellis M: Systematic discovery of regulatory motifs
in human promoters and 3' UTRs by comparison of several
mammals. Nature 2005, 434:338-345.
5. Dieterich C, Grossmann S, Tanzer A, Ropcke S, Arndt PF, Stadler PF,
Vingron M: Comparative promoter region analysis powered
by CORG. BMC Genomics 2005, 6:24.
6. Dieterich C, Cusack B, Wang H, Rateitschak K, Krause A, Vingron M:
Annotating regulatory DNA based on man-mouse genomic
comparison. Bioinformatics 2002, 18 (Suppl 2)():S84-S90.
7. Liu Y, Liu XS, Wei L, Altman RB, Batzoglou S: Eukaryotic regula-
tory element conservation analysis and identification using
comparative genomics. Genome Res 2004, 14:451-458.
8. Zhao F, Xuan Z, Liu L, Zhang MQ: TRED: a Transcriptional Reg-
ulatory Element Database and a platform for in silico gene
regulation studies. Nucleic Acids Res 2005, 33:D103-D107.
9. Xuan Z, Zhao F, Wang J, Chen G, Zhang MQ: Genome-wide pro-
moter extraction and analysis in human, mouse, and rat.
Genome Biol 2005, 6:R72.
10. Ghosh D: TFD: the transcription factors database. Nucleic Acids
Res 1992:2091-2093.
11. Wingender E, Dietze P, Karas H, Knuppel R: TRANSFAC: a data-
base on transcription factors and their DNA binding sites.
Nucleic Acids Res 1996, 24:238-241.
12. Aerts S, Thijs G, Coessens B, Staes M, Moreau Y, De Moor B:
Tou-
can: deciphering the cis-regulatory logic of coregulated
genes. Nucleic Acids Res 2003, 31:1753-1764.
13. Ho Sui SJ, Mortimer JR, Arenillas DJ, Brumm J, Walsh CJ, Kennedy BP,
Wasserman WW: oPOSSUM: identification of over-repre-
sented transcription factor binding sites in co-expressed
genes. Nucleic Acids Res 2005, 33:3154-3164.
14. Karanam S, Moreno CS: CONFAC: automated application of
comparative genomic promoter analysis to DNA microar-
ray datasets. Nucleic Acids Res 2004, 32:W475-W484.
15. Sharan R, Ben-Hur A, Loots GG, Ovcharenko I: CREME: Cis-Reg-
ulatory Module Explorer for the human genome. Nucleic Acids
Res 2004, 32:W253-W256.
16. Chen JF, Mandel EM, Thomson JM, Wu Q, Callis TE, Hammond SM,
Conlon FL, Wang DZ: The role of microRNA-1 and microRNA-
133 in skeletal muscle proliferation and differentiation. Nat
Genet 2006, 38:228-233.
17. Lim LP, Lau NC, Garrett-Engele P, Grimson A, Schelter JM, Castle J,
Bartel DP, Linsley PS, Johnson JM: Microarray analysis shows that
some microRNAs downregulate large numbers of target
mRNAs. Nature 2005, 433:769-773.
18. NCBI FTP Site [ />19. TFD Database [ />20. HomoloGene dataset [ />21. GeneACT help document [ />act/help.html]
22. Ahituv N, Rubin EM, Nobrega MA: Exploiting human-fish
genome comparisons for deciphering gene regulation. Hum
Mol Genet 2004, 13(Spec No 2):R261-R266.
23. Kleinjan DA, van Heyningen V: Long-range control of gene
expression: emerging mechanisms and disruption in disease.
Am J Hum Genet 2005, 76:8-32.
24. Levine M, Tjian R: Transcription regulation and animal diver-
sity. Nature 2003, 424:147-151.
25. miRanda software for microRNA target prediction [http://
www.microrna.org]
26. Enright AJ, John B, Gaul U, Tuschl T, Sander C, Marks DS: Micro-
RNA targets in Drosophila. Genome Biol 2003, 5:R1.
27. Smith TF, Waterman MS: Identification of common molecular
subsequences. J Mol Biol 1981, 147:195-197.
28. Wuchty S, Fontana W, Hofacker IL, Schuster P: Complete subop-
timal folding of RNA and the stability of secondary struc-
tures. Biopolymers 1999, 49:145-165.
29. miRBase: sequences [ />30. GeneACT software [ />31. Zhu W, Giangrande PH, Nevins JR: E2Fs link the control of G1/S
and G2/M transcription. Embo J 2004, 23:4615-26.
32. Barrett T, Suzek TO, Troup DB, Wilhite SE, Ngau WC, Ledoux P,
Table 2
Summary of the search results for the miRNA target sites enriched in the HeLa cells transfected with miR-124 vs. miR-1
miRNA name Sequence Ratio Number of miR-124 target sites Number of miR-1 target sites (control)
miR-185 UGGAGAGAAAGGCAGUUC 3.5409836 6 1
a
miR-124a UUAAGGCACGCGGUGAAUGCCA 3.5409836 12 2
miR-145 GUCCAGUUUUCCCAGGAAUCCCUU 3.5409836 6 1
miR-22 AAGCUGCCAGUUGAAGAACUGU -1 8 0
miR-337 UCCAGCUCCUAUAUGAUGCCUUU -1 7 0
miR-150 UCUCCCAACCCUUGUACCAGUG -1 6 0
miR-141 UAACACUGUCUGGUAAAGAUGG -1 6 0
miR-19b UGUGCAAAUCCAUGCAAAACUGA -1 4 0
miR-200a UAACACUGUCUGGUAACGAUGU -1 3 0
miR-9 UCUUUGGUUAUCUAGCUGUAUGA -1 3 0
miR-31 GGCAAGAUGCUGGCAUAGCUG -1 3 0
Shown here is a selected list of the most enriched miRNA target sites when HeLa cells are transfected with miR-124; see Additional data file 4 for
the full list.
a
miR-124 target sites are highlighted. DBSS, differential binding site search; miRNA, microRNA.
R97.14 Genome Biology 2006, Volume 7, Issue 10, Article R97 Cheung et al. />Genome Biology 2006, 7:R97
Rudnev D, Lash AE, Fujibuchi W, Edgar R: NCBI GEO: mining mil-
lions of expression profiles - database and tools. Nucleic Acids
Res 2005, 33:D562-D566.
33. Cam H, Balciunaite E, Blais A, Spektor A, Scarpulla RC, Young R,
Kluger Y, Dynlacht BD: A common set of gene regulatory net-
works links metabolism and growth inhibition. Mol Cell 2004,
16:399-411.
34. Lambert JR, Nordeen SK: Analysis of steroid hormone-induced
histone acetylation by chromatin immunoprecipitation
assay. Methods Mol Biol 2001, 176:273-281.
35. Christy BA, Lau LF, Nathans D: A gene activated in mouse 3T3
cells by serum growth factors encodes a protein with 'zinc
finger' sequences. Proc Natl Acad Sci USA 1988, 85:7857-7861.
36. Sempere LF, Freemantle S, Pitha-Rowe I, Moss E, Dmitrovsky E,
Table 3
Summary of the results for the miRNA target sites that are enriched in C2C12 myogenic differentiation (day 0 versus day 2) from DBSS
miRNA name Sequence Ratio Regulated frequency Control frequency
One conserved site
miR-206 UGGAAUGUAAGGAAGUGUGUGG 4.075358 26 1
miR-7 UGGAAGACUAGUGAUUUUGUUG 3.1348907 20 1
miR-301 CAGUGCAAUAGUAUUGUCAAAGC 3.1348907 20 1
miR-23a AUCACAUUGCCAGGGAUUUCC 2.8214017 18 1
miR-138 AGCUGGUGUUGUGAAUC 2.8214017 18 1
miR-211 UUCCCUUUGUCAUCCUUCGCCU 2.2727958 58 4
miR-29c UAGCACCAUUUGAAAUCGGU 2.037679 13 1
miR-133a UUGGUCCCCUUCAACCAGCUGU 1.9788998 101 8
miR-194 UGUAACAGCAACUCCAUGUGGA 1.9593067 25 2
miR-30c UGUAAACAUCCUACACUCUCAGC 1.8809344 12 1
miR-130a CAGUGCAAUGUUAAAAGGGCAU -1 18 0
miR-216 UAAUCUCAGCUGGCAACUGUG -1 12 0
miR-196b UAGGUAGUUUCCUGUUGUUGG -1 10 0
miR-140 AGUGGUUUUACCCUAUGGUAG -1 10 0
Two conserved sites
miR-324-5p CGCAUCCCCUAGGGCAUUGGUGU 2.5079126 32 2
miR-193 AACUGGCCUACAAAGUCCCAG 2.037679 13 1
miR-150 UCUCCCAACCCUUGUACCAGUG 2.037679 13 1
miR-125b UCCCUGAGACCCUAACUUGUGA -1 18 0
miR-133a UUGGUCCCCUUCAACCAGCUGU -1 17 0
miR-152 UCAGUGCAUGACAGAACUUGGG -1 11 0
miR-204 UUCCCUUUGUCAUCCUAUGCCU -1 9 0
miR-17 CAAAGUGCUUACAGUGCAGGUAGU -1 8 0
miR-211 UUCCCUUUGUCAUCCUUCGCCU -1 8 0
Three conserved sites
miR-296 AGGGCCCCCCCUCAAUCCUGU 2.037679 26 2
miR-34a UGGCAGUGUCUUAGCUGGUUGUU -1 11 0
miR-125a UCCCUGAGACCCUUUAACCUGUG -1 7 0
miR-330 GCAAAGCACACGGCCUGCAGAGA -1 7 0
miR-345 UGCUGACUCCUAGUCCAGGGC -1 6 0
miR-320 AAAAGCUGGGUUGAGAGGGCGAA -1 6 0
miR-125b UCCCUGAGACCCUAACUUGUGA -1 5 0
miR-449 UGGCAGUGUAUUGUUAGCUGGU -1 5 0
miR-150 UCUCCCAACCCUUGUACCAGUG -1 5 0
miR-133a UUGGUCCCCUUCAACCAGCUGU -1 5 0
miR-199a CCCAGUGUUCAGACUACCUGUUC -1 4 0
miR-193 AACUGGCCUACAAAGUCCCAG -1 4 0
miR-205 UCCUUCAUUCCACCGGAGUCUG -1 4 0
Selected lists are shown here; see Additional data file 6 for the full lists. Findings are subdivided into results for one conserved site, results for two
conserved sites, and results for three conserved sites. In all cases, miR-133a remained as one of the top hits. If a given miRNA target site is absent in
the control gene list, then we listed the ratio as 'N/A', which denotes the unique presence of this particular target site in the regulated gene list.
DBSS, differential binding site search; miRNA, microRNA.
Genome Biology 2006, Volume 7, Issue 10, Article R97 Cheung et al. R97.15
comment reviews reports refereed researchdeposited research interactions information
Genome Biology 2006, 7:R97
Ambros V: Expression profiling of mammalian microRNAs
uncovers a subset of brain-expressed microRNAs with possi-
ble roles in murine and human neuronal differentiation.
Genome Biol 2004, 5:R13.
37. Lagos-Quintana M, Rauhut R, Yalcin A, Meyer J, Lendeckel W, Tuschl
T: Identification of tissue-specific microRNAs from mouse.
Curr Biol 2002, 12:735-739.
38. Soulez M, Rouviere CG, Chafey P, Hentzen D, Vandromme M, Lau-
tredou N, Lamb N, Kahn A, Tuil D: Growth and differentiation of
C2 myogenic cells are dependent on serum response factor.
Mol Cell Biol 1996, 16:6065-6074.
39. Blau HM, Pavlath GK, Hardeman EC, Chiu CP, Silberstein L, Webster
SG, Miller SC, Webster C: Plasticity of the differentiated state.
Science 1985, 230:758-766.
40. Tomczak KK, Marinescu VD, Ramoni MF, Sanoudou D, Montanaro F,
Han M, Kunkel LM, Kohane IS, Beggs AH: Expression profiling and
identification of novel genes involved in myogenic differenti-
ation. Faseb J 2004, 18:403-405.
41. Bartel DP: MicroRNAs: genomics, biogenesis, mechanism,
and function. Cell 2004, 116:281-297.
42. Sandelin A, Alkema W, Engstrom P, Wasserman WW, Lenhard B:
JASPAR: an open-access database for eukaryotic transcrip-
tion factor binding profiles. Nucleic Acids Res 2004, 32:D91-D94.
43. Stormo GD, Strobl S, Yoshioka M, Lee JS: Specificity of the Mnt
protein. Independent effects of mutations at different posi-
tions in the operator. J Mol Biol 1993, 229:821-826.
44. Stormo GD: Consensus patterns in DNA. Methods Enzymol 1990,
183:211-221.
45. Frech K, Quandt K, Werner T: Finding protein-binding sites in
DNA sequences: the next generation. Trends Biochem Sci 1997,
22:103-104.
46. Roulet E, Fisch I, Junier T, Bucher P, Mermod N: Evaluation of com-
puter tools for the prediction of transcription factor binding
sites on genomic DNA. In Silico Biol
1998, 1:21-28.
47. Kato M, Hata N, Banerjee N, Futcher B, Zhang MQ: Identifying
combinatorial regulation of transcription factors and binding
motifs. Genome Biol 2004, 5:R56.
48. Remenyi A, Scholer HR, Wilmanns M: Combinatorial control of
gene expression. Nat Struct Mol Biol 2004, 11:812-815.
49. Harbison CT, Gordon DB, Lee TI, Rinaldi NJ, Macisaac KD, Danford
TW, Hannett NM, Tagne JB, Reynolds DB, Yoo J, et al.: Transcrip-
tional regulatory code of a eukaryotic genome. Nature 2004,
431:99-104.
50. Lewis BP, Burge CB, Bartel DP: Conserved seed pairing, often
flanked by adenosines, indicates that thousands of human
genes are microRNA targets. Cell 2005, 120:15-20.
51. Rajewsky N: microRNA target predictions in animals. Nat
Genet 2006, 38 Suppl():S8-S13.
Table 4
Summary of the comparison between different similar tools in the public domain to that of GeneACT
GeneACT [30] oPOSSUM [13] OTFBS [52] Clover [53] Whole Genome
rVISTA beta [3]
CRÈME [15]
Graphical user interface Web based Web based Web based Command line tool
for Linux, UNIX and
Mac OS X
Web based Web based
Genomic display Yes No No No Yes No
Type Promoter specific N/A N/A N/A Gene specific N/A
Display motifs on custom sequences Yes N/A N/A N/A N/A N/A
Allow custom sequences input Yes N/A N/A N/A N/A N/A
Source of the transcription factor binding
sites
TFD JASPAR TRANSFAC JASPAR TRANSFAC TRANSFAC
Number of binding sites in the database >7000 111 >500 111 >500 >500
Search for over-represented binding site Yes Yes Yes Yes Yes Yes
In promoter region Yes Yes Yes Yes Yes Yes
In 3'-UTR Yes No No No No No
Across genomes Human, mouse and
rat
Human and mouse No No Yes Human
Species supported (using Locuslink, Entrez
gene ID, Ensembl ID, etc.)
Human, mouse and
rat
Human and mouse No No Mouse only Human
Number of genes/sequences allowed Unlimited IDs Unlimited IDs 200 sequences Not tested Unlimited IDs Unlimited IDs
Allow custom control gene set Yes Yes No Yes No No
Correctly predicted E2F4 binding sites in
the T98G dataset
Yes No N/A N/A N/A Yes
Identified E2F-binding sites in the T98G
dataset
Yes Yes N/A N/A N/A Yes
Search for potential miRNA involved in
the dataset
Yes No No No No No
Source for the miRNA seed sequences miRbase N/A N/A N/A N/A N/A
Across genomes Human, mouse and
rat
N/A N/A N/A N/A N/A
Species supported Human, mouse and
rat
N/A N/A N/A N/A N/A
Number of genes/sequences allowed Unlimited N/A N/A N/A N/A N/A
Allow custom control gene set Yes N/A N/A N/A N/A N/A
Only programs that have web interfaces and allow unlimited Gene IDs are tested using the T98G dataset. The website addresses for each of the
programs evaluated are given in the references provided in the top row. N/A represents a category that is not available. E2F, elongation factor 2;
miRNA, microRNA; UTR, untranslated region.
R97.16 Genome Biology 2006, Volume 7, Issue 10, Article R97 Cheung et al. />Genome Biology 2006, 7:R97
52. Zheng J, Wu J, Sun Z: An approach to identify over-represented
cis-elements in related sequences. Nucleic Acids Res 2003,
31:1995-2005.
53. Frith MC, Fu Y, Yu L, Chen JF, Hansen U, Weng Z: Detection of
functional DNA motifs via statistical over-representation.
Nucleic Acids Res 2004, 32:1372-1381.