Báo cáo y học: "CellProfiler: image analysis software for identifying and quantifying cell phenotypes" potx
Bạn đang xem bản rút gọn của tài liệu. Xem và tải ngay bản đầy đủ của tài liệu tại đây (774.14 KB, 11 trang )
Genome Biology 2006, 7:R100
comment reviews reports deposited research refereed research interactions information
Open Access
2006Carpenteret al.Volume 7, Issue 10, Article R100
Software
CellProfiler: image analysis software for identifying and quantifying
cell phenotypes
Anne E Carpenter
*
, Thouis R Jones
*†
, Michael R Lamprecht
*
,
Colin Clarke
*†
, In Han Kang
†
, Ola Friman
‡
, David A Guertin
*
,
Joo Han Chang
*
, Robert A Lindquist
*
, Jason Moffat
*
, Polina Golland
†
and
David M Sabatini
*§
Addresses:
*
Whitehead Institute for Biomedical Research, Cambridge, MA 02142, USA.
†
Computer Sciences and Artificial Intelligence
Laboratory, Massachusetts Institute of Technology, Cambridge, MA 02142, USA.
‡
Department of Radiology, Brigham and Women's Hospital,
Boston, MA 02115, USA.
§
Department of Biology, Massachusetts Institute of Technology, Cambridge, MA 02142, USA.
Correspondence: David M Sabatini. Email:
© 2006 Carpenter et al.; licensee BioMed Central Ltd.
This is an open access article distributed under the terms of the Creative Commons Attribution License ( which
permits unrestricted use, distribution, and reproduction in any medium, provided the original work is properly cited.
Cell image analysis software<p>CellProfiler, the first free, open-source system for flexible and high-throughput cell image analysis is described.</p>
Abstract
Biologists can now prepare and image thousands of samples per day using automation, enabling
chemical screens and functional genomics (for example, using RNA interference). Here we describe
the first free, open-source system designed for flexible, high-throughput cell image analysis,
CellProfiler. CellProfiler can address a variety of biological questions quantitatively, including
standard assays (for example, cell count, size, per-cell protein levels) and complex morphological
assays (for example, cell/organelle shape or subcellular patterns of DNA or protein staining).
Rationale
Examining cells by microscopy has long been a primary
method for studying cellular function. When cells are stained
appropriately, visual analysis can reveal biological mecha-
nisms. Advanced microscopes can now, in a single day, easily
collect thousands of high resolution images of cells from time-
lapse experiments and from large-scale screens using chemi-
cal compounds, RNA interference (RNAi) reagents, or
expression plasmids [1-5]. However, a bottleneck exists at the
image analysis stage. Several pioneering large screens have
been scored through visual inspection by expert biologists
[6,7], whose interpretive ability will not soon be replicated by
a computer. Still, for most applications, image cytometry
(automated cell image analysis) is strongly preferable to anal-
ysis by eye. In fact, in some cases image cytometry is abso-
lutely required to extract the full spectrum of information
present in biological images, for reasons we discuss here.
First, while human observers typically score one or at most a
few cellular features, image cytometry simultaneously yields
many informative measures of cells, including the intensity
and localization of each fluorescently labeled cellular compo-
nent (for example, DNA or protein) within each subcellular
compartment, as well as the number, size, and shape of those
subcellular compartments. Image-based analysis is thus ver-
satile, inherently multiplexed, and high in information con-
tent. Like flow cytometry, image cytometry measures the per-
cell amount of protein and DNA, but can more conveniently
handle hundreds of thousands of distinct samples and is also
compatible with adherent cell types, time-lapse samples, and
intact tissues. In addition, image cytometry can accurately
Published: 31 October 2006
Genome Biology 2006, 7:R100 (doi:10.1186/gb-2006-7-10-r100)
Received: 15 September 2006
Accepted: 31 October 2006
The electronic version of this article is the complete one and can be
found online at />R100.2 Genome Biology 2006, Volume 7, Issue 10, Article R100 Carpenter et al. />Genome Biology 2006, 7:R100
measure protein texture and localization as well as cell shape
and size.
Second, human-scored image analysis is qualitative, usually
categorizing samples as 'hits' (where normal physiology is
grossly disturbed) or 'non-hits'. By contrast, automated anal-
ysis rapidly produces consistent, quantitative measures for
every image. In addition to uncovering subtle samples of
interest that would otherwise be missed, systems-level con-
clusions can be drawn directly from the quantitative meas-
ures for every image. Measuring a large number of features,
even features undetectable by eye, has proven useful for
screening as well as cytological/cytometric profiling, which
can group similar genes or reveal a drug's mechanism of
action [3,8-14].
Third, image cytometry individually measures each cell
rather than producing a score for the entire image. Because
individual cells' responses are inhomogeneous [15], multipar-
ametric single cell data from several types of instruments
have proven much more powerful than whole-population
data (for example, western blots or mRNA expression chips)
for clustering genes, deriving causal networks, classifying
protein localization, and diagnosing disease [10,16-18]. In
addition, individual cell measurements can reveal samples
that differ in only a subpopulation of cells, which would oth-
erwise be masked in whole-population measures.
Fourth, quantitative image analysis is able to detect some fea-
tures that are not readily detectable by a human observer. For
example, the two-fold difference in DNA staining intensity
that reveals whether a cell is in G1 or G2 phase of the cell cycle
are measurable by computer but are difficult for the human
eye to observe in cell images. Furthermore, small but biologi-
cally significant differences, for example, a 10% increase in
nucleus size, are not noticeable by eye. Other features, for
example, the texture (smoothness) of protein or DNA stain-
ing, are observable but not quantifiable by eye. Pathologists
have known for years that changes in DNA or protein texture
can correlate to profound and otherwise undetectable
changes in cell physiology, a fact used in diagnosis of disease
[17,19]. Even changes not visible to the human eye can reveal
disease state [20].
Fifth, image cytometry is much less labor-intensive and
higher-throughput. Appropriate software produces reliable
results from a large-scale experiment in hours, versus months
of tedious visual inspection. This improvement is more than
an incremental technical advance, because it relieves the one
remaining bottleneck to routinely conducting such experi-
ments.
Prior to the work presented here, the only flexible, open-
source biological image analysis package was ImageJ/NIH
Image [21]. This package has been successfully used by many
laboratories. Its design, however, is geared more towards the
analysis of individual images (comparable to Adobe Pho-
toshop) rather than flexible, high-throughput work. Macros
can be written in ImageJ for high-throughput work but
adapting macros to new projects requires that biologists learn
a programming language.
While not creating a general, flexible software tool, many
groups have benefited from automated cell image analysis by
developing their own scripts, macros, and plug-ins to accom-
plish specific image analysis tasks. Custom programs written
in commercial software (for example, MetaMorph, ImagePro
Plus, MATLAB) or Java have been used to identify, measure,
and track cells in images and time lapse movies [10,22,23].
Such studies clearly show the power of automated image
analysis for biological discovery. However, most of these cus-
tom programs are not modular, so combining several steps
and changing settings requires interacting directly with the
code and is simply not practical for routinely processing hun-
dreds of thousands of images or sending jobs to a cluster. The
effort expended by laboratories in creating an analysis solu-
tion with a particular software package is often lost after the
initial experiment is completed; other laboratories rarely use
the methods because they are customized for a particular cell
type, assay or even image set. Furthermore, although devel-
oping a routine for a new cell type or assay usually requires
testing multiple algorithms, it is impractical to implement
and test several published methods for a particular project.
Commercial software has also been developed, mainly for the
pharmaceutical screening market, by companies including
Cellomics, TTP LabTech, Evotec, Molecular Devices, and GE
Healthcare [24]. Development of these packages has been
guided mainly by mammalian cell types and cellular features
of pharmaceutical interest, including protein translocation,
micronucleus formation, neurite outgrowth, and cell count
[25]. The high cost and the bundling of commercial software
with hardware makes it impractical to test several programs
for a new project. The proprietary nature of the code prevents
researchers from knowing the strategy of a given algorithm
and it cannot be modified if desired. As is the case with many
laboratories, we have found commercial packages useful for
some screens in mammalian cells, but in other cases limiting
[1,5,26,27].
Furthermore, key challenges remain in image analysis algo-
rithm development itself [28]. Cell image analysis has been
described as one of the greatest remaining challenges in
screening [5,29], and as a field is "very much in its infancy"
[30] and "lag [s] behind the adoption of high-throughput
imaging technologies" [10]. Accurate cell identification is
required to extract meaningful measures from images, but
even for mammalian cell types, existing software often fails
on crowded cell samples, which has severely limited screens
thus far. Screens in most non-mammalian organisms have
been limited to visual inspection.
Genome Biology 2006, Volume 7, Issue 10, Article R100 Carpenter et al. R100.3
comment reviews reports refereed researchdeposited research interactions information
Genome Biology 2006, 7:R100
In summary, while existing software enables particular assays
for particular cell types, high throughput image analysis has,
to this point, been impractical unless an image analysis expert
develops a customized solution, or unless commercial pack-
ages are used with their built-in algorithms for a limited set of
cellular features and for a limited set of cell types. There exists
a clear need for a powerful, flexible, open-source platform for
high-throughput cell image analysis.
Here we describe the open-source CellProfiler project, our
effort to develop such a software system for the scientific
community. CellProfiler simultaneously measures the size,
shape, intensity and texture of a variety of cell types in a high
throughput manner. Note that we focus in this paper not on
the technical details of the software (which are described in
the manual), nor computational validation of the mostly pub-
lished algorithms, nor on a mechanistic study of any particu-
lar biological finding. Rather, we describe the system, validate
the software for a variety of real-world biological problems,
demonstrate the breadth of its utility (including on various
cell types and assays), and hope to stimulate ideas within the
biological community for future applications of the software.
Overview of the software system
The following can be freely downloaded from the CellProfiler
website [31]: CellProfiler for Windows, Mac, and Unix (com-
piled, not requiring MATLAB); CellProfiler's MATLAB source
code; a full technical description of CellProfiler's algorithms
and measurements in an extensive PDF formatted manual
(Additional data file 1), identical to the information found in
help buttons within CellProfiler; and pipelines to identify the
various cell types in this paper (see Additional data file 2 for a
list of the modules in each pipeline).
CellProfiler is freely available modular image analysis soft-
ware that is capable of handling hundreds of thousands of
images. The software contains already-developed methods
for many cell types and assays and is also an open-source,
flexible platform for the sharing, testing, and development of
new methods by image analysis experts. CellProfiler meets
the needs discussed in the introduction, in that it contains:
advanced algorithms for image analysis that are able to accu-
rately identify crowded cells and non-mammalian cell types;
a modular, flexible design allowing analysis of new assays and
phenotypes; open-source code so the underlying methodol-
ogy is known and can be modified or improved by others; a
user-friendly interface; the capability to make use of clusters
of computers when available; and a design that eliminates the
tedium of the many steps typically involved in image analysis,
many of which are not easily transferable from one project to
another (for example, image formatting, combining several
image analysis steps, or repeating the analysis with slightly
different parameters). CellProfiler was designed and opti-
mized for the most common high-content screening image
format, that is, two-dimensional images. It has very limited
support for time-lapse and three-dimensional image stack
analysis, although researchers interested in these areas could
build compatible modules.
Most image analysis projects, even for new cell types or
assays, can be accomplished simply by pointing and clicking
using CellProfiler's graphical user interface (Figure 1a). The
software uses the concept of a 'pipeline' of individual modules
(Figure 1b; Additional data file 2). Each module processes the
images in some manner, and the modules are placed in
sequential order to create a pipeline: usually image process-
ing, then object identification, then measurement. Over 50
CellProfiler modules are currently available (Additional data
file 3). Most modules are automatic, but the software also
allows interactive modules (for example, the user clicks to
outline a region of interest in each image). Modules are mixed
and matched for a specific project and each module's settings
are adjusted appropriately. Upon starting the analysis, each
image (or group of images if multiple wavelengths are availa-
ble) travels through the pipeline and is processed by each
module in order.
The pipeline's modules and their settings are saved and can
be used to reproduce the analysis or share with colleagues.
Many example pipelines are provided at the CellProfiler web-
site [31] to provide a starting point for new analyses. To
explain some features of CellProfiler, we describe in the sub-
sequent sections the general steps in a typical pipeline.
Image processing, including illumination
correction
One of the most critical steps in image analysis is illumination
correction. Illumination often varies more than 1.5-fold
across the field of view, even when using fiber optic light
sources, and occasionally even when images are thought to be
already illumination-corrected by commercial image analysis
software packages (TRJ, AEC, DMS, and PG, unpublished
data). This adds an unacceptable level of noise, obscures real
quantitative differences, and prevents many types of biologi-
cal experiments that rely on accurate fluorescence intensity
measurements (for example, DNA content of a nucleus, which
only varies by two-fold during the cell cycle). CellProfiler con-
tains standard methods plus our new methods [32] to address
illumination variation, allowing various methods to be com-
pared side by side and, ultimately, providing less noisy quan-
titative measures (Figure 1c,d). We use these illumination
correction methods for every high-throughput image set we
process, because using raw images degrades intensity meas-
urements and, less obviously, can preclude accurate cell iden-
tification. This adversely affects all types of measurements,
from intensity based measures (for example, DNA content
histograms [1]) to area and shape measurements (TRJ, AEC,
DMS, and PG, unpublished data). CellProfiler's other image
processing modules perform other needed adjustments prior
R100.4 Genome Biology 2006, Volume 7, Issue 10, Article R100 Carpenter et al. />Genome Biology 2006, 7:R100
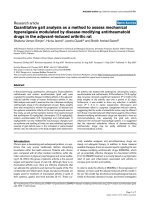
CellProfiler overview and featuresFigure 1
CellProfiler overview and features. (a) Main CellProfiler interface, with an analysis pipeline displayed. (b) Schematic of a typical CellProfiler pipeline. (c)
Image processing example: uneven illumination from the left to the right within each field of view is noticeable in this three row by five column tiled image
(left). CellProfiler's illumination correction modules correct these anomalies (right). Images were contrast-enhanced to display this effect. (d) These
corrections reduce noise in quantitative measurements, demonstrated here in DNA content measures (middle) from images of Drosophila Kc167 cells that
are improved over the raw images (left). The results are comparable to those produced by white referenced images (right), but they do not require the
error prone and often omitted step of collecting a white reference image immediately before image acquisition. (e) Outlines show the identification of
nuclei and identification of cell edges made by CellProfiler in human HT29 (left) and Drosophila Kc167 (right) cells. Cells touching the border are
intentionally excluded from analysis and images were contrast stretched for display. Scale bars = 15 μm.
original images
processed images
illumination-corrected images
identified objects (nuclei and cells)
Image processing modules
Object identification modules
Measurement modules
Illumination correction modules
Typical CellProfiler pipeline:
Measurements for every cell in every
image (location, size, shape, intensity,
texture) can be viewed by:
1. CellProfiler data tools
2. Exporting to spreadsheet
3. Exporting to database
4. Exporting to MATLAB
Raw images
White reference
illumination
correction
CellProfiler
illumination
correction
Number of cells
(thousands)
DNA content, log scale (arbitrary units)
10
5
0
10
5
0
10
5
0
Drosophila
Human
Original image
DNA
Original image
Actin
Original image
DNA
Original image
Actin
CP-outlined
nuclei
CP-outlined
nuclei
CP-outlined
cells
CP-outlined
cells
(a)
(b)
(c)
(d)
(e)
Genome Biology 2006, Volume 7, Issue 10, Article R100 Carpenter et al. R100.5
comment reviews reports refereed researchdeposited research interactions information
Genome Biology 2006, 7:R100
to identifying cells in images, for example, aligning or crop-
ping (Additional data file 3).
Cell identification
Object identification (also called segmentation) is the most
challenging step in image analysis and its accuracy deter-
mines the accuracy of the resulting cell measurements. Cell-
Profiler's object identification modules contain a variety of
published and tested algorithms for identifying cells based on
fluorescence, including work from our own group and others
(Figure 1e). In most biological images, cells touch each other,
causing the simple, fast algorithms used in some commercial
software packages to fail. The first objects identified in an
image (called primary objects) are often nuclei identified
from DNA-stained images, although primary objects can also
be whole cells, beads, speckles, tumors, and so on. Several
simple algorithms are built into CellProfiler for cases where
primary objects are well-dispersed, non-confluent, and bright
relative to the background. More importantly, to effectively
identify clumped objects, CellProfiler contains a modular
three-step strategy based on previously published algorithms
[33-37]. First, clumped objects are recognized and separated;
second, the dividing lines between objects are found; and
third, some of the resulting objects are either removed or
merged together based on their measurements, for example,
their size or shape.
After primary objects (often nuclei) are identified, the edges
of secondary objects that surround each primary object (often
cell edges) can be found more easily. Measuring cell size in
Drosophila was not previously feasible because the com-
monly used watershed method [37] often fails to find the bor-
ders between clumped cells. We have, therefore,
implemented in CellProfiler an improved Propagate algo-
rithm [38], in addition to several standard methods of sec-
ondary object identification. Other subcellular compartments
can also be identified, including the cytoplasm (the part of
each cell excluding the nucleus) and the cell or nuclear mem-
brane (the edge of the cell or nucleus).
The technical description of these algorithms is omitted here
but is available in the online help and manual, in addition to
previously published references cited therein (Additional
data file 1). The identification modules include a 'test mode'
for comparing several algorithms side by side in order to
choose the best approach. We have found that these cell iden-
tification methods are flexible to various cell morphologies.
This flexibility is convenient but, more importantly, often
allows accurate identification of cells with unusual morphol-
ogies within a population of normal cells.
Measurements and data analysis
CellProfiler measures a large number of features for each
identified cell or subcellular compartment, including area,
shape, intensity, and texture (each feature is described in
Additional data file 4). This includes many standard features
[39,40], but also complex measurements like Zernike shape
features [41], and Haralick and Gabor texture features [42-
44], which are described in detail in the online help and man-
ual. There are also modules to measure various features (for
example, intensity, texture, saturation, blur, area occupied by
a stain) of an image in its entirety. A severe limitation of most
commercial software is the inability to adapt to new biological
questions by calculating new features from identified cells
[5]. By contrast, CellProfiler's modular design and open-
source code allows quickly measuring new cellular pheno-
types as needed.
Measurements are accessible in several ways: using CellPro-
filer's built-in viewing and plotting data tools (Additional data
file 5); exporting in a tab-delimited spreadsheet format that
can be opened in programs like Microsoft Excel or OpenOffice
Calc; exporting in a format that can be imported into a data-
base like Oracle or MySQL; or directly in MATLAB.
Usability
Like most new software in the laboratory, the process of set-
ting up a CellProfiler analysis may take several days if the user
is learning the software for the first time. Several resources
help at this stage: the built-in help, the manual (Additional
data file 1), the online discussion forum [31], the 'test mode'
for the Identify modules that show results from various
options side by side, and built-in image and data tools to
interact with processed images and cell measurements (Addi-
tional data file 5). The flexible, modular design and point-
and-click interface make setting up an analysis feasible for
non-programmers. Over time, experienced users typically
require less than a day to set up an entirely new experiment
(for example, a new cell type or unusual measurement
scheme). When performing the same analysis on different
image sets where sample preparation is the only variable, we
test the analysis on a few sample images and sometimes
change one or two settings in the Identify modules. This takes
less than an hour and is essentially a quality control step.
Once a pipeline is satisfactory, analysis can be performed on
the local computer or automatically divided into smaller
batches to be sent to a cluster of computers, described in more
detail in later sections.
CellProfiler's code is open-source under the GNU public
license. Its image handling is flexible: there is no requirement
for images to have a certain naming structure and many
standard image formats plus some movie formats are sup-
ported. Its modular structure allows experts to expand the
software to new file formats or add new algorithms. The
source code was written in MATLAB because it is a powerful,
easy to learn language, commonly used for scientific applica-
tions, including prototyping image analysis routines. Because
the source code is well-documented, it is understandable even
R100.6 Genome Biology 2006, Volume 7, Issue 10, Article R100 Carpenter et al. />Genome Biology 2006, 7:R100
by non-programmers. Computationally intensive tasks use
either MATLAB's native compiled functions or our own com-
piled C++ implementations to improve the speed. Analysis
times vary widely depending on the image size, the number of
objects found per image, and the number of features meas-
ured, but typical pipelines require from 20 seconds to five
minutes per image on standard desktop computers.
Validation of CellProfiler for many phenotypes
We first demonstrated that CellProfiler's methods could accu-
rately measure many different biologically important features
of cells using several cell types, including Drosophila Kc167
cells because these cells are particularly challenging to iden-
tify by automated image analysis [5,27], and they enable rapid
genome-wide screens using living cell microarrays [26].
Using the basic cell-culture methods described previously
[26], we prepared Drosophila Kc167 cells for experiments
shown in Figures 1 and 2 by pretreating the cells with double-
stranded RNA (dsRNA) against the noted genes for two days
prior to plating on plain glass slides and growing for a further
3 days in the presence of dsRNA. Specifically, 50 μg dsRNA
plus 30 μl fugene in 1 ml serum-free medium were transfected
into a 10 cm plate containing 20 million cells in 10 ml
medium. We prepared human HT29 cells (Figures 1, 2, 3) as
previously described [1].
Direct comparison of image analysis software is difficult
because results from image analysis can be heavily skewed by
how the software is tuned and commercial software packages
are numerous and expensive. Furthermore, the algorithms in
commercial software are proprietary and so cannot be
directly compared apart from the entire software package,
including preprocessing methods. The best practical compar-
ison, therefore, is for software developers to release the
results of their software on standard image sets or versus gold
standards (visual inspection, Coulter particle counters, and
so on). In subsequent sections, therefore, we present such
comparisons. Note that once validated, any of these experi-
ments could be expanded to a large-scale genome-wide RNAi
screen or chemical library screen.
Cell count (used to probe cell proliferation/apoptosis/death)
is a straightforward phenotype that has, nonetheless, proved
challenging for many cell types due to the poor ability of exist-
ing software to separate clumped nuclei. For human cells
(Figure 2a, left), CellProfiler's accuracy compared to manual
counting is twice that reported for a commercial software
package [25]. CellProfiler also counted the more difficult-to-
identify Drosophila Kc167 cells (Figure 2a, right). Cell size
was not previously measurable for many cell types, but Cell-
Profiler's measurements were consistent with the gold stand-
ard, a Coulter particle size counter (Figure 2b). While an
automated routine has been developed for this cell type [45],
this is, to our knowledge, the first report on the quantitative
accuracy of any software to count and measure cell size in
Drosophila Kc167 cells and the results indicate that such
screens are now feasible.
Cell count and size can at least be observed by eye even if
quantitative high throughput screening is impractical. In con-
trast, certain phenotypes, like changes in DNA content, are
impossible to discern by eye. Unlike whole population-based
methods, image cytometry measures individual cell fluores-
cence intensities so that the DNA content of DNA-stained
cells can be determined [46,47]. These measurements are
very easily degraded by anomalies in the illumination of the
field of view and poor identification algorithms (the most
common errors are counting two nearby nuclei as one nucleus
with twice the DNA content and incorrectly splitting a
nucleus into two half-nuclei). This is, therefore, a very
demanding phenotype to measure from images.
Image analysis with CellProfiler produced the expected DNA
content distributions for both human and Drosophila cell
populations (Figure 2c). As another test, we confirmed that
the green fluorescent protein (GFP)-histone content per cell
decreases by roughly half when a cell divides into two daugh-
ter cells during mitosis (Figure 2d). Classification of cells
based on 2N, 4N, and 8N DNA content is, therefore, possible
based on an image of DNA-stained nuclei (Additional data file
6). This is useful not only in studies of cell cycle per se: cell
cycle stage is a known cause of variability in biological sam-
ples, so analyzing a phenotype of interest with respect to the
cell cycle eliminates a confounding variable (for example, the
phenotype of interest could be assessed only in G1 phase cells,
which have 2N DNA content).
Further, image cytometry adds an additional level of informa-
tion about cell cycle distribution. Whereas flow cytometry
based on a DNA stain alone cannot distinguish cells in G2 and
M phase (both having the same 4N DNA content), image
cytometry reveals that these two populations differ in that
mitotic cells have smaller nuclei on average (Figure 2e, right).
The total amount of a protein or phospho-protein per cell can
be measured by analysis of fluorescent antibody staining
(Figure 2e, left), amounting to single-cell western blots. Fur-
thermore, image cytometry can determine the localization of
staining relative to other labeled cellular compartments. The
change in localization of the nuclear factor (NF)κB transcrip-
tion factor in response to tumor necrosis factor (TNF)α in
MCF7 cells can be monitored (Figure 2f). We have previously
used the software to confirm the localization of a protein pre-
dominantly at the membrane [48]. The software can also
identify, count, and measure the shape, size, and intensity of
subcellular structures such as nuclear speckles (Figure 2g).
Finally, image analysis can probe other phenotypes that are
not otherwise easily measured, such as shape and texture/
smoothness. Cell morphology has not often been quantita-
tively measured, despite its importance in normal cellular
Genome Biology 2006, Volume 7, Issue 10, Article R100 Carpenter et al. R100.7
comment reviews reports refereed researchdeposited research interactions information
Genome Biology 2006, 7:R100
physiology and in disease diagnosis [6,17,19,49]. Many of the
shape and texture measurements for wild-type cells show
non-Gaussian distributions (Additional data file 7). There-
fore, independently measuring every cell by image analysis is
particularly valuable because the population cannot be accu-
rately described by reduction to a few parameters like mean
and standard deviation. We found that changes in cell shape
and actin texture induced by gene-specific RNAi were meas-
urable (Figure 3), opening up the possibility for high-
throughput screens for these and other morphologies.
Cytological profiling to reveal pathways targeted
by drugs
Having demonstrated CellProfiler's ability to measure a large
number of relevant phenotypes, we applied it to a publicly
available dose-response image set of a Forkhead-EGFP cyto-
plasm to nucleus translocation assay in human cells grown in
multi-well plates (Figure 4a). First, we ran a CellProfiler pipe-
line (Additional data file 2, part E) to calculate an illumina-
tion correction function for each of the five slides and each of
the two channels (<10 minutes processing time per slide on a
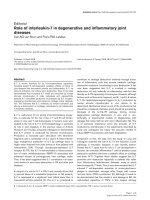
Validation of CellProfiler for many cellular phenotypesFigure 2
Validation of CellProfiler for many cellular phenotypes. (a) Cell count: for a set of 6 images of wild-type human HT29 cells (left), two researchers' counts
varied by 11%, and CellProfiler's counts were within 6% of their average. For images of Drosophila Kc167 cells with various genes knocked down by RNAi
(right), the two researchers' counts varied by 16% and CellProfiler's counts were within 17% of their average. Example images and CellProfiler outlines for
these cell types are shown in Figure 1e. (b) Cell size: CellProfiler's cell area measurements are comparable to those of a Coulter particle counter for
Drosophila Kc167 cells, for wild-type (no dsRNA) and RNA-interference induced samples. The SEM is too small to show error bars. (c) DNA content in
cell populations: measurements are shown for human HT29 cell populations (1 image for each RNAi condition, left) and for Drosophila Kc167 cell
populations (1,750 images for each RNAi condition were combined, right). The cell cycle distributions are as expected, with the 2N peak being
predominant in the wild-type human sample, whereas most wild-type Drosophila nuclei are known to have 4N DNA content [62]. RNAi-targeted samples
were also as expected for Aurora kinase B (polyploid), Mad2 (fairly normal cell cycle distribution), String (4N-enriched), and Anillin and Cyclin A (both
polyploid). (d) Chromatin content in time lapse movies: GFP-histone H4 (S. cerevisiae) or GFP-histone H2B (HeLa and C. elegans) content is shown near
each nucleus in arbitrary intensity units. The histone content is decreased by roughly half in each daughter nucleus after division. For C. elegans, only the
boxed region of interest was analyzed. Scale bars: C. elegans, unknown; human HeLa = 20 μm; S. cerevisiae = 10 μm. (e) Phospho-protein content: human
HT29 cells treated with RNAi reagent against Polo kinase have an increased percentage of nuclei with high phospho-H3 staining compared to wild-type
cells, consistent with a mitosis-stalled phenotype (left). Wild-type human HT29 nuclei that stain positively for phospho-histone H3 tend to be smaller than
phospho-H3-negative cells (right). (f) Protein localization: the mean intensity of NFκB staining in the cytoplasm and the nucleus is shown in response to
TNFα in human MCF7 cells (top). Totals do not equal 100% due to slight overlap between compartments. (g) Speckles: fluorescent foci of phospho-
Histone2AX induced by 2 Gy of irradiation in human U2OS cells disappear at timepoints as the cells recover. Scale bar = 10 μm. The SEM is too small to
show error bars.
$ &HOOFRXQW % &HOOVL]H '*)3KLVWRQHFRQWHQW
LQWLPHODSVHPRYLHV
& '1$FRQWHQWLQFHOOSRSXODWLRQV
H
J
D
P
,
HJDP
,
H
J
D
P,
H
J
D
P,
H
J
D
P,
H
J
DP
,
WQXRFOOH&
HJDPLUHS
&HOO3URILOHU
0DQXDO 0DQXDO
(UMAN
VQD
J
HOH&
BEFOREDIVISIONAFTERDIVISION
D
/H+QDPX+
HDLVLYHUHF6
V
O
O
H
FI
R
UHEP
X1
V
G
QD
V
XR
KW
'1$FRQWHQWORJVFDOHDUELWUDU\XQLWV
QRGV51$
0DG
6WULQJ
$QLOOLQ
&\FOLQ $
SH#ONTROL
SLLECFOSR
EBMU.
$.! CONTENTLOGSCALEARBITRARYUNITS
SH!52+"
.
.
.
.
.
.
(UMAN
$ROSOPHILA
$
15
VGR
Q
GD
0
JQ
L
UW6
QL
O
O
L
Q
$
$
Q
L
O
F\
&
WQXRFOOH&
HJDPLUHSHJD
U
H
YD
&HOO3URILOHU
0DQXDO
0DQXDO
$ROSOPHILA
7LPHKRXUV
IRUHEPXQ
HJDUH
Y$
HJ
D
P,UHSLFRI
* 6SHFNOHV(3KRVSKRSURWHLQFRQWHQW
VOOHFIRWQHFUH3
1XFOHDUDUHD
DUELWUDU\XQLWV
VOO
HFIRU
H
E
P
X
1
&RQWURO
3ROR
SKRVSKR+FRQWHQWORJVFDOH
RI
QXFOHL
DUH
S+
RI
QXFOHL
DUH
S+
1XFOHXV &\WRSODVP
&RQWURO 71)A
O
R
U
WQ
R&
D
)
17
)3URWHLQORFDOL]DWLRQ
0ERCENTAGEOFPROTEIN
INCOMPARTMENT
&RXOWHU&RXQWHU
&HOO3URILOHU
#OULTER#OUNTERMEAN
CELLAREAARBITRARYUNITS
#ELL0ROFILERMEAN
CELLAREAARBITRARYUNITS
NODS2.!
-AD
3TRING
!NILLIN
#YCLIN!
S+
S+
R100.8 Genome Biology 2006, Volume 7, Issue 10, Article R100 Carpenter et al. />Genome Biology 2006, 7:R100
single computer). We then used another CellProfiler pipeline
(Additional data file 2, part A) to load each image, correct its
illumination using the pre-calculated functions, identify
nuclei, identify cell edges, and use the nucleus and cell out-
lines to define the cytoplasmic region of each cell, thereby
defining three compartments for each cell: nucleus, cell, and
cytoplasm. For each slide, we tested the pipeline on several
random test images and fine-tuned settings in the identifica-
tion modules as needed. Modules in the pipeline were
included to measure: multiple features describing the area
and shape of each compartment for each cell; multiple fea-
tures describing the intensity and texture of each channel
within each compartment, including several scales of texture;
and the overall intensity, the percent saturation and the
amount of blur for the entire image, for quality control pur-
poses. The analysis was run on a desktop computer at a rate
of >1 image/minute.
The translocation was easily quantified by many features
(Figure 4b; Additional data file 8), the best of which achieved
the highest published scores for assay quality yet (Figure 4c),
indicating this software's improved ability to identify samples
of interest in screens versus algorithms in commercial soft-
ware [50,51].
Existing commercial software for this assay typically meas-
ures translocation only, but we wondered whether the broad
spectrum of measurements recorded by CellProfiler (the cyto-
logical profiles) could reveal further insights. We noticed that
certain features of nuclear shape change in response to
increasing doses of wortmannin but, interestingly, not the
other positive control drug in this assay, LY294002 (Figure
4d). These subtle changes were seen at all doses at and above
the EC50 of wortmannin but at none of the doses of
LY294002, even those that clearly are sufficient for transloca-
tion of Forkhead, the main readout of this screen. Because
wortmannin and LY294002 target an overlapping set of pro-
teins, this result indicates that using this software in a pri-
mary screening assay would allow classification of any
positively scoring samples as being wortmannin-specific or
not, immediately narrowing down the potential pathways
involved. While billions of samples have been scored using
translocation assays, this is, to our knowledge, the first report
Identifying mutant shapes and texturesFigure 3
Identifying mutant shapes and textures. In each case, four images of each sample were quantitatively analyzed and images were adjusted using Adobe
Photoshop auto levels for display only. Scale bars = 15 μm. (a) The unusual cell shape induced by an RNAi reagent against Myo3A in human HT29 cells is
quantitatively distinguishable from wild-type control cells. (b) The unusual cell shape induced by an RNAi reagent against PTPN21 in human HT29 cells is
quantitatively distinguishable from wild-type control cells. (c) The unusual actin texture induced by an RNAi reagent against DUSP19 in human HT29 cells
is quantitatively distinguishable from wild-type control cells. The images are pseudocolored to show the actin staining texture. The biological basis of these
morphological changes and the specificity of the RNAi reagents remain to be determined.
0
20
40
0 0.2 0.4 0.6 0.8
Control
shDUSP1
Cytoplasmic actin
texture (Sum avg/mean)
Original image Pseudocolored actin Original image Pseudocolored actin
Control shDUSP19
sllec
f
o
tnec
r
eP
(c)
0
15
30
0.5 0.6 0.8 1.0
Control
shMyo3A
Cell solidity (shape)
sllec fo tnecreP
Control
shMyo3A
Original image Outlined cell shapes Original image Outlined cell shapes
(a)
(b)
Original image Outlined cell shapes Original image Outlined cell shapes
0
15
30
0 0.3 0.6 0.9
Control
shPTPN21
Percent of cells
Cell form factor (shape)
Control shPTPN21
Genome Biology 2006, Volume 7, Issue 10, Article R100 Carpenter et al. R100.9
comment reviews reports refereed researchdeposited research interactions information
Genome Biology 2006, 7:R100
of the ability to sub-classify samples based on morphological
changes using primary screening data.
Cluster computing
We routinely run CellProfiler on large image sets (more than
45,000 four-color images) using a cluster of computers. To do
this, we add modules to the end of a pipeline to enable
processing batches of images on the cluster and exporting
data into a database. We then process the first image on a
desktop computer, after which CellProfiler automatically
divides the remainder of the large image set into groups and
creates the files needed to submit each group to a computing
cluster. We then use simple commands, outside of CellPro-
filer, to submit the jobs to our cluster of computers and export
the resulting measurements to a database. Each of these steps
is described in the CellProfiler help for batch processing, and
researchers without a computing cluster can now rent one
remotely and inexpensively. Given that a typical image analy-
sis takes approximately two minutes, a single CPU can proc-
ess 30 images/hour and a 100 CPU cluster processes 3,000
images/hour. This is a much faster rate than existing image
acquisition instruments, such that image analysis is not a bot-
tleneck.
Broad applicability
Here we have shown that CellProfiler is useful for measuring
a number of cell features, including cell count, cell size, cell
cycle distribution, organelle number and size, cell shape, tex-
ture, and the levels and localization of proteins and phospho-
proteins. Unlike previously existing software, CellProfiler is
effective in a number of cell types and organisms, such that
new avenues of research in both standard and high-through-
put biology laboratories can now be pursued.
CellProfiler is already being used by laboratories worldwide
studying a variety of biological processes in other cell types
and organisms, including Drosophila (S2R+ cells, epithelial
tissue), human (TOV21G, biopsied prostate gland tissue,
adult mesenchymal stem cells, H1299 lung carcinoma),
mouse (NIH/3T3, neural precursor cells derived from
embryos, lung tissue sections, isolated germ cells), and rat
(H9c2 cells) [1,26,48,52-54] (KA Hartwell, personal commu-
nication). We have also modified CellProfiler to measure
yeast colonies, yeast growth patches, wounds in scratch
assays, and tumors [55].
Importantly, the only successfully completed Drosophila
screen using automated image analysis, to date, has been a
cell-count/object-count screen in the S2 line whose appear-
ance is comparable to human cell lines [56]. We are currently
using CellProfiler to analyze screens using the clumpy Dro-
sophila Kc167 cell type (AEC, TRJ, MRL, DB Wheeler, PG,
DMS, unpublished data). Given the power of RNA interfer-
ence and genetic tools in Drosophila and the demand for
screening in its community [57], this is an area that can now
move past tedious visual analysis of thousands of images,
accelerating the rate of discovery.
Future development
We hope that computer vision researchers will contribute
new algorithms to the project so that their theoretical work
can be applied to practical biological problems. For example,
while CellProfiler can currently analyze each slice of a time-
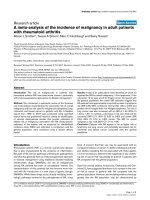
CellProfiler analysis of a Forkhead (FOXO1A) cytoplasm-nucleus translocation assayFigure 4
CellProfiler analysis of a Forkhead (FOXO1A) cytoplasm-nucleus
translocation assay. (a) Example images from the high throughput image
set in human U2OS osteosarcoma cells, showing no treatment (left) and
150 nM Wortmannin (right) after 1 hour treatment, scale unknown. (b)
Translocation scored as the fraction of cells whose ratio of GFP in the
cytoplasm versus the nucleus was above a threshold. Error bars = SEM.
(c) Statistical analysis using Z' and non-logistic-fit V factors, which are
standard measures of assay quality (>0.4 is considered screenable and 1 is
an ideal assay) [63-65]. (d) Nuclei change shape in response to
wortmannin but not LY294002, as judged by three shape features. Error
bars = SEM; *p < 0.05.
Dose of wortmannin (nM)
Fraction of cells
with cytoplasmic GFP
0
0.5
1
0 1 4 16 63 250
EC
50
=
9.0 nM
Normalized
shape measure
0.92
0.96
1
1.04
None EC50 Max None EC50 Max
Eccentricity Extent Form factor
*
**
*
*
*
wortmannin LY294002
Z' factor (overall) 0.91
V factor (wortmannin) 0.86
V factor (LY294002) 0.84
(a)
(b)
(c)
(d)
R100.10 Genome Biology 2006, Volume 7, Issue 10, Article R100 Carpenter et al. />Genome Biology 2006, 7:R100
lapse movie or three-dimensional image set independently,
implementation of algorithms specifically designed to take
advantage of the extra context information present in this
type of data would be necessary for most experiments using
these image types. Furthermore, CellProfiler is currently
being integrated with the open-source Open Microscopy
Environment project (OME) [58], which would provide a
complete open-source infrastructure for organizing and ana-
lyzing images from high-throughput experiments.
With the successful application of sophisticated image analy-
sis methods, the bottleneck of image-based genome-wide
screens is now moving downstream to data visualization,
exploration, and statistical analysis in order to accommodate
the number and richness of measurements that result from
image-based genome-wide assays [32]. Fully exploiting these
rich data sets will reveal cellular signaling networks and lead
to the unprecedented rich annotation of hundreds of genes in
parallel.
Additional data files
The following additional data are available with the online
version of this paper. Additional data file 1 is the CellProfiler
manual. Additional data file 2 shows the CellProfiler pipelines
for experiments shown in this paper, listing the modules in
the order used. Additional data file 3 is a table listing CellPro-
filer modules by category, with their descriptions. Additional
data file 4 is a table listing the measurements made by Cell-
Profiler modules. Additional data file 5 lists the data and
image tools in CellProfiler, with their descriptions. Additional
data file 6 is a figure showing an example from CellProfiler
analysis of DNA content (cell cycle) in Drosophila Kc167 cells.
Additional data file 7 is a figure showing histograms of shape
and texture features for wild-type cells. Additional data file 8
is a table listing measures for the cytoplasm-nucleus translo-
cation assay (Figure 4) for which the Z' factor is above 0.5.
Additional data file 1CellProfiler manualCellProfiler manualClick here for file
Additional data file 2CellProfiler pipelines for experiments shown in this paper, listing the modules in the order usedCellProfiler pipelines for experiments shown in this paper, listing the modules in the order usedClick here for fileAdditional data file 3CellProfiler modules by category, with their descriptionsCellProfiler modules by category, with their descriptionsClick here for fileAdditional data file 4Measurements made by CellProfiler modulesMeasurements made by CellProfiler modulesClick here for fileAdditional data file 5Data and image tools in CellProfiler, with their descriptionsData and image tools in CellProfiler, with their descriptionsClick here for fileAdditional data file 6Example from CellProfiler analysis of DNA content (cell cycle) in Drosophila Kc167 cellsExample from CellProfiler analysis of DNA content (cell cycle) in Drosophila Kc167 cellsClick here for fileAdditional data file 7Histograms of shape and texture features for wild-type cellsHistograms of shape and texture features for wild-type cellsClick here for fileAdditional data file 8Measures for the cytoplasm-nucleus translocation assay (Figure 4) for which the Z' factor is above 0.5Measures for the cytoplasm-nucleus translocation assay (Figure 4) for which the Z' factor is above 0.5Click here for file
Acknowledgements
We gratefully thank the researchers providing images for this study: Steve
N Bailey (Whitehead Institute, Figure 1c), Scott Floyd (MIT, Figure 2g),
Kirsten Hagstrom (C. elegans, Figure 2d[59]), Ruth Brack and Horst Wolff
(GSF-Institute for Molecular Virology, Neuherberg, Germany, HeLa, Figure
2d[60]), Dominic Hoepfner, Arndt Brachat and Peter Philippsen (Universi-
tat Basel, Switzerland, Saccharomyces cerevisiae, Figure 2d), Ilya Ravkin (Vitra
CNT, Figure 2f and BioImage CNT, Figure 4[61]). We are grateful to
Wayne Rasband for his work on the open-source NIH Image/ImageJ pack-
age and for advice from Zach E Perlman, both of whom served to inspire
this project. We appreciate Ilya Ravkin's work to provide test images for
the community; those who provided technical assistance, Dianne Carpen-
ter, Biao Luo, Nora Taylor, Susan Ma, and James Whittle; those who con-
tributed to the software, Steve Lowe; and those who provided helpful
comments, Doug Wheeler, Tamar Resnick and Kimberly Hartwell. This
work was supported by a Merck/CSBi postdoctoral fellowship (AEC), a
Novartis fellowship from the Life Sciences Research Foundation (AEC), a
Society for Biomolecular Screening Academic grant (AEC), the MIT EECS/
Whitehead/Broad Training Program in Computational Biology (NIH grant
DK070069-01) supporting TRJ, a Damon Runyon Cancer Research Foun-
dation fellowship (DAG), an NSERC postdoctoral fellowship (JM), DOD
TSC research program grant W81XWH-05-1-0318-DS (DMS), NIH grant
R01 GM072555-01 (DMS), and the Keck Foundation (DMS).
References
1. Moffat J, Grueneberg DA, Yang X, Kim SY, Kloepfer AM, Hinkle G,
Piqani B, Eisenhaure TM, Luo B, Grenier JK, et al.: A lentiviral RNAi
library for human and mouse genes applied to an arrayed
viral high-content screen. Cell 2006, 124:1283-1298.
2. Dasgupta R, Perrimon N: Using RNAi to catch Drosophila genes
in a web of interactions: insights into cancer research. Onco-
gene 2004, 23:8359-8365.
3. Carpenter AE, Sabatini DM: Systematic genome-wide screens of
gene function. Nat Rev Genet 2004, 5:11-22.
4. Vanhecke D, Janitz M: Functional genomics using high-through-
put RNA interference. Drug Discov Today 2005, 10:205-212.
5. Echeverri CJ, Perrimon N: High-throughput RNAi screening in
cultured cells: a user's guide. Nat Rev Genet 2006, 7:373-384.
6. Kiger A, Baum B, Jones S, Jones M, Coulson A, Echeverri C, Perrimon
N: A functional genomic analysis of cell morphology using
RNA interference. J Biol 2003, 2:27.
7. Kim JK, Gabel HW, Kamath RS, Tewari M, Pasquinelli A, Rual JF,
Kennedy S, Dybbs M, Bertin N, Kaplan JM, et al.: Functional
genomic analysis of RNA interference in C. elegans. Science
2005, 308:1164-1167.
8. Mitchison TJ: Small-molecule screening and profiling by using
automated microscopy. Chembiochem 2005, 6:33-39.
9. Perlman ZE, Mitchison TJ, Mayer TU: High-content screening and
profiling of drug activity in an automated centrosome-dupli-
cation assay. Chembiochem 2005, 6:145-151.
10. Perlman ZE, Slack MD, Feng Y, Mitchison TJ, Wu LF, Altschuler SJ:
Multidimensional drug profiling by automated microscopy.
Science 2004, 306:1194-1198.
11. Taylor DL, Giuliano KA: Multiplexed high content screening
assays create a systems cell biology approach to drug discov-
ery. Drug Discov Today: Technologies 2005, 2:149-154.
12. Abraham VC, Taylor DL, Haskins JR: High content screening
applied to large-scale cell biology. Trends Biotechnol 2004,
22:15-22.
13. Bjorklund M, Taipale M, Varjosalo M, Saharinen J, Lahdenpera J,
Taipale J: Identification of pathways regulating cell size and
cell-cycle progression by RNAi. Nature 2006, 439:1009-1013.
14. Ohya Y, Sese J, Yukawa M, Sano F, Nakatani Y, Saito TL, Saka A,
Fukuda T, Ishihara S, Oka S, et al.: High-dimensional and large-
scale phenotyping of yeast mutants. Proc Natl Acad Sci USA 2005,
102:19015-19020.
15. Levsky JM, Singer RH: Gene expression and the myth of the
average cell. Trends Cell Biol 2003, 13:4-6.
16. Sachs K, Perez O, Pe'er D, Lauffenburger DA, Nolan GP: Causal
protein-signaling networks derived from multiparameter
single-cell data. Science 2005, 308:523-529.
17. Gil J, Wu H, Wang BY: Image analysis and morphometry in the
diagnosis of breast cancer. Microsc Res Tech 2002, 59:109-118.
18. Chen X, Murphy RF: Objective clustering of proteins based on
subcellular location patterns. J Biomed Biotechnol 2005,
2005:87-95.
19. Doudkine A, Macaulay C, Poulin N, Palcic B: Nuclear texture
measurements in image cytometry. Pathologica 1995,
87:286-299.
20. Guillaud M, Adler-Storthz K, Malpica A, Staerkel G, Matisic J, Van
Niekirk D, Cox D, Poulin N, Follen M, Macaulay C: Subvisual chro-
matin changes in cervical epithelium measured by texture
image analysis and correlated with HPV. Gynecol Oncol 2005,
99:S16-23.
21. Abramoff MD, Magalhaes PJ, Ram SJ: Image processing with
ImageJ. Biophotonics International 2004, 11:36-42.
22. Zhou X, Cao X, Perlman Z, Wong ST: A computerized cellular
imaging system for high content analysis in Monastrol sup-
pressor screens. J Biomed Inform 2006, 39:115-125.
23. Lindblad J, Wahlby C, Bengtsson E, Zaltsman A: Image analysis for
automatic segmentation of cytoplasms and classification of
Rac1 activation. Cytometry A 2004, 57:22-33.
24. Garippa RJ: A multi-faceted approach to the advancement of
cell-based drug discovery. Drug Discovery World 2004, 6:43-55.
25. Harada JN, Bower KE, Orth AP, Callaway S, Nelson CG, Laris C,
Hogenesch JB, Vogt PK, Chanda SK: Identification of novel mam-
Genome Biology 2006, Volume 7, Issue 10, Article R100 Carpenter et al.
comment reviews reports refereed researchdeposited research interactions information
Genome Biology 2006, 7:R100
malian growth regulatory factors by genome-scale quantita-
tive image analysis. Genome Res 2005, 15:1136-1144.
26. Wheeler DB, Bailey SN, Guertin DA, Carpenter AE, Higgins CO,
Sabatini DM: RNAi living-cell microarrays for loss-of-function
screens in Drosophila melanogaster cells. Nat Methods 2004,
1:127-132.
27. Armknecht S, Boutros M, Kiger A, Nybakken K, Mathey-Prevot B,
Perrimon N: High-throughput RNA interference screens in
Drosophila tissue culture cells. Methods Enzymol 2005,
392:55-73.
28. Price JH, Goodacre A, Hahn K, Hodgson L, Hunter EA, Krajewski S,
Murphy RF, Rabinovich A, Reed JC, Heynen S: Advances in molec-
ular labeling, high throughput imaging and machine intelli-
gence portend powerful functional cellular biochemistry
tools. J Cell Biochem 2002, 39(Suppl):194-210.
29. Eggert US, Mitchison TJ: Small molecule screening by imaging.
Curr Opin Chem Biol 2006, 10:232-237.
30. Murphy RF, Meijering E, Danuser G: Special issue on molecular
and cellular bioimaging. Ieee T Image Process 2005, 14:1233-1236.
31. CellProfiler Project []
32. Jones TR, Carpenter AE, Sabatini DM, Golland P: Methods for high-
content, high-throughput image-based cell screening. Pro-
ceedings of the Workshop on Microscopic Image Analysis with Applications
in Biology held in association with MICCAI06 (Medical Image Computing
and Computer-Assisted Intervention) held in Copenhagen, Denmark, Octo-
ber 5, 2006 :65-72.
33. Wahlby C: Algorithms for Applied Digital Image Cytometry.
In Acta Universitatis Upsaliensis Volume 896. Comprehensive Summa-
ries of Uppsala Dissertations from the Faculty of Science and Tech-
nology Uppsala; 2003:75.
34. Malpica N, de Solorzano CO, Vaquero JJ, Santos A, Vallcorba I, Gar-
cia-Sagredo JM, del Pozo F: Applying watershed algorithms to
the segmentation of clustered nuclei. Cytometry 1997,
28:289-297.
35. Wahlby C, Sintorn IM, Erlandsson F, Borgefors G, Bengtsson E: Com-
bining intensity, edge and shape information for 2D and 3D
segmentation of cell nuclei in tissue sections. J Microsc 2004,
215:67-76.
36. Ortiz de Solorzano C, Rodriguez EG, Jones A, Pinkel D, Gray JW,
Sudar D, Lockett SJ: Segmentation of confocal microscope
images of cell nuclei in thick tissue sections. J Microsc Oxford
1999, 193:212-226.
37. Meyer F, Beucher S: Morphological segmentation. J Visual Com-
munication Image Representation 1990, 1:21-46.
38. Jones TR, Carpenter AE, Golland P: Voronoi-based segmentation
of cells on image manifolds. In ICCV Workshop on Computer Vision
for Biomedical Image Applications Volume 2005. Springer-Verlag, Berlin;
2005:535-543.
39. Boland MV, Murphy RF: A neural network classifier capable of
recognizing the patterns of all major subcellular structures
in fluorescence microscope images of HeLa cells. Bioinformat-
ics 2001, 17:1213-1223.
40. Rodenacker K, Bengtsson E: A feature set for cytometry on dig-
itized microscopic images. Anal Cell Pathol 2003, 25:1-36.
41. Boland MV, Markey MK, Murphy RF: Automated recognition of
patterns characteristic of subcellular structures in fluores-
cence microscopy images. Cytometry 1998, 33:366-375.
42. Haralick RM, Shanmuga K, Dinstein I: Textural features for image
classification. Ieee T Syst Man Cyb 1973, SMC3:610-621.
43. Gabor D: Theory of communication. J Institute Electrical Engineers
1946, 93:429-441.
44. Turner MR: Texture discrimination by Gabor functions. Biol
Cybern 1986, 55:71-82.
45. Zhou X, Liu KY, Bradley P, Perrimon N, Wong ST: Towards auto-
mated cellular image segmentation for RNAi genome-wide
screening. Med Image Comput Comput Assist Interv Int Conf Med
Image Comput Comput Assist Interv 2005, 8:885-892.
46. Lockett SJ, Jacobson K, Herman B: Quantitative precision of an
automated, fluorescence-based image cytometer. Anal Quant
Cytol Histol 1992, 14:187-202.
47. Poulin NM, Matthews JB, Skov KA, Palcic B: Effects of fixation
method on image cytometric measurement of DNA content
and distribution in cells stained for fluorescence with propid-
ium iodide. J Histochem Cytochem 1994, 42:1149-1156.
48. Bailey SN, Ali SM, Carpenter AE, Higgins CO, Sabatini DM: Microar-
rays of lentiviruses for gene function screens in immortalized
and primary cells. Nat Methods 2006, 3:117-122.
49. Porter KR: Changes in cell topography associated with trans-
formation to malignancy. Adv Pathobiol 1975, 1:29-47.
50. BioImageA/S: Assay Application Note 21: Image analysis using
Definiens Cellenger, Version 1. January 2005. .
51. Ravkin I, Temov V: Poster PO2025: Comparison of Several
Classes of Algorithms for Cytoplasm to Nucleus Transloca-
tion. Society for Biomolecular Screening Annual Meeting: 2005 2005.
52. Cowen LE, Carpenter AE, Matangkasombut O, Fink GR, Lindquist S:
Genetic architecture of Hsp90-dependent drug resistance.
Eukaryot Cell in press.
53. Baltus AE, Menke DB, Hu YC, Goodheart ML, Carpenter AE, de Rooij
DG, Page DC: In germ cells of mouse embryonic ovaries, the
decision to enter meiosis precedes premeiotic DNA replica-
tion. Nat Genet in press.
54. Sigal A, Milo R, Cohen A, Geva-Zatorsky N, Klein Y, Alaluf I, Swerdlin
N, Perzov N, Danon T, Liron Y, et al.: Dynamic proteomics in
individual human cells uncovers widespread cell-cycle
dependence of nuclear proteins. Nat Methods 2006, 3:525-531.
55. Lamprecht M, Sabatini DM, Carpenter AE: CellProfiler: free, ver-
satile software for automated biological image analysis. Bio-
techniques in press.
56. Philips JA, Rubin EJ, Perrimon N: Drosophila RNAi screen reveals
CD36 family member required for mycobacterial infection.
Science 2005, 309:1251-1253.
57. Flockhart I, Booker M, Kiger A, Boutros M, Armknecht S, Ramadan
N, Richardson K, Xu A, Perrimon N, Mathey-Prevot B: FlyRNAi:
the Drosophila RNAi screening center database. Nucleic Acids
Res 2006, 34:D489-494.
58. Swedlow JR, Goldberg I, Brauner E, Sorger PK: Informatics and
quantitative analysis in biological imaging. Science 2003,
300:100-102.
59. Genes & Development [ />full/16/6/729/DC1]
60. Carl Zeiss MicroImaging Gallery [ />C12567BE0045ACF1/Contents-Frame/
FDE18DAAE4583A5CC1256C3D004831FF]
61. Invitation to Participate in the Comparison of Image Analy-
sis Algorithms for Intracellular Screening [http://
www.ravkin.net/SBS/Invitation.htm]
62. Stevens B, Alvarez CM, Bohman R, O'Connor JD: An ecdysteroid-
induced alteration in the cell cycle of cultured Drosophila
cells. Cell 1980, 22:675-682.
63. Zhang JH, Chung TD, Oldenburg KR: A simple statistical param-
eter for use in evaluation and validation of high throughput
screening assays. J Biomol Screen 1999, 4:67-73.
64. Ravkin I: Quality measures for imaging-based cellular assays.
Society Biomol Screen Conference Posters 2004:#P12024 [http://
www.ravkin.net/posters/P12024-Quality Measures for Imaging-based
Cellular Assays.pdf].
65. Ravkin I, Temov V, Nelson AD, Zarowitz MA, Hoopes M, Verhovsky
Y, Ascue G, Goldbard S, Beske O, Bhagwat B, et al.: Multiplexed
high-throughput image cytometry using encoded carriers.
Proc SPIE 2004, 5322:52-63.