Báo cáo y học: "Metabolic network driven analysis of genome-wide transcription data from Aspergillus nidulan" docx
Bạn đang xem bản rút gọn của tài liệu. Xem và tải ngay bản đầy đủ của tài liệu tại đây (416.93 KB, 16 trang )
Genome Biology 2006, 7:R108
comment reviews reports deposited research refereed research interactions information
Open Access
2006Davidet al.Volume 7, Issue 11, Article R108
Research
Metabolic network driven analysis of genome-wide transcription
data from Aspergillus nidulans
Helga David
*
, Gerald Hofmann
†
, Ana Paula Oliveira
†
, Hanne Jarmer
‡
and
Jens Nielsen
†
Addresses:
*
Fluxome Sciences A/S, Diplomvej, DK-2800 Kgs, Lyngby, Denmark.
†
Center for Microbial Biotechnology, BioCentrum-DTU,
Technical University of Denmark, Søltofts Plads, DK-2800 Kgs, Lyngby, Denmark.
‡
Center for Biological Sequence Analysis, BioCentrum-DTU,
Technical University of Denmark, Kemitorvet, DK-2800 Kgs, Lyngby, Denmark.
Correspondence: Jens Nielsen. Email:
© 2006 David et al.; licensee BioMed Central Ltd.
This is an open access article distributed under the terms of the Creative Commons Attribution License ( which
permits unrestricted use, distribution, and reproduction in any medium, provided the original work is properly cited.
A. nidulans metabolism<p>Genome-wide transcription analysis of <it>Aspergillus nidulans</it> grown on different carbon sources and a reconstruction of the complete metabolic network of this filamentous fungi are presented.</p>
Abstract
Background: Aspergillus nidulans (the asexual form of Emericella nidulans) is a model organism for
aspergilli, which are an important group of filamentous fungi that encompasses human and plant
pathogens as well as industrial cell factories. Aspergilli have a highly diversified metabolism and,
because of their medical, agricultural and biotechnological importance, it would be valuable to have
an understanding of how their metabolism is regulated. We therefore conducted a genome-wide
transcription analysis of A. nidulans grown on three different carbon sources (glucose, glycerol, and
ethanol) with the objective of identifying global regulatory structures. Furthermore, we
reconstructed the complete metabolic network of this organism, which resulted in linking 666
genes to metabolic functions, as well as assigning metabolic roles to 472 genes that were previously
uncharacterized.
Results: Through combination of the reconstructed metabolic network and the transcription data,
we identified subnetwork structures that pointed to coordinated regulation of genes that are
involved in many different parts of the metabolism. Thus, for a shift from glucose to ethanol, we
identified coordinated regulation of the complete pathway for oxidation of ethanol, as well as
upregulation of gluconeogenesis and downregulation of glycolysis and the pentose phosphate
pathway. Furthermore, on change in carbon source from glucose to ethanol, the cells shift from
using the pentose phosphate pathway as the major source of NADPH (nicotinamide adenine
dinucleotide phosphatase, reduced form) for biosynthesis to use of the malic enzyme.
Conclusion: Our analysis indicates that some of the genes are regulated by common transcription
factors, making it possible to establish new putative links between known transcription factors and
genes through clustering.
Published: 15 November 2006
Genome Biology 2006, 7:R108 (doi:10.1186/gb-2006-7-11-r108)
Received: 14 July 2006
Revised: 25 September 2006
Accepted: 15 November 2006
The electronic version of this article is the complete one and can be
found online at />R108.2 Genome Biology 2006, Volume 7, Issue 11, Article R108 David et al. />Genome Biology 2006, 7:R108
Background
Aspergillus represents a large and important genus of fila-
mentous fungi comprising human pathogens such as A. fumi-
gatus, plant pathogens such as A. flavus, and important cell
factories such as A. niger, A. oryzae, and A. terreus. Further-
more, A. nidulans has been extensively used as a model
organism for eukaryotic cells. Despite their importance as
human and plant pathogens and their extensive use in food,
chemical, and pharmaceutical production, it was only
recently that an initiative was undertaken to sequence the
genomes of several Aspergillus spp. Thus, the genomes of
three Aspergillus spp. have been published (A. nidulans [1],
A. oryzae [2], and A. fumigatus [3]), and complete genomic
sequencing of several other species has been finished or is
ongoing. This has enabled analysis of the function of these
important organisms at the genome level.
Aspergilli are natural scavengers and hence they have a very
flexible metabolism that enables consumption of a wide range
of carbon and nitrogen sources. Considering the high degree
of flexibility in the metabolism of aspergilli, it is interesting to
evaluate the function of the metabolic network in these
organisms during growth on different carbon sources. We
therefore undertook a study of the metabolism of A. nidulans
at the genome level during growth on three different carbon
sources: glucose, glycerol, and ethanol. These three carbon
sources enter the central carbon metabolism at different loca-
tions, and they have been reported to result in widely differ-
ent regulatory responses [4-8].
Our study involved genome-wide transcription analysis using
in situ synthesized oligonucleotide arrays containing probes
for 9,371 out of the 9,541 putative genes in the genome of A.
nidulans [9]. In order to map the effects of carbon source on
transcription, we used well controlled bioreactors to grow the
cells. In recent years a few large-scale transcription studies
have been conducted in A. nidulans, but so far none has cov-
ered the complete set of predicted genes in the genome. Sims
and coworkers [10] used spotted DNA arrays to interrogate
2,080 open reading frames (ORFs) within the genome of A.
nidulans, using as probes polymerase chain reaction (PCR)
products from expressed sequence tags (ESTs), as well as
gene sequences deposited in GenBank. The arrays were ini-
tially used in connection with an ethanol-to-glucose upshift
batch experiment with a reference strain [10], and subse-
quently modified to study the effect of recombinant protein
secretion on gene expression in A. nidulans by comparing the
transcription profiles of a recombinant and a reference strain
grown in chemostat cultures [11]. For other species of
Aspergillus, a few studies on transcription profiling using
microarray technology have been reported in the literature.
These made use of spotted DNA arrays fabricated from EST
sequences of selected genes (for example, A. oryzae [12], A.
flavus [13-15], and A. parasiticus [15]) and other types of
arrays (for example, for A. terreus [16]). Furthermore, studies
similar to ours (aiming to map differences in gene expression
during batch growth on different carbon sources, in particu-
lar glucose and ethanol) have been performed with other
organisms, such as the filamentous fungi A. oryzae [12] and
Trichoderma reesei [17], and the yeast Saccharomyces cere-
visiae (many studies, with the first being that of DeRisi and
coworkers [18]), with only the latter covering the complete
genome.
In this work transcriptome data were analyzed using a
recently developed consensus clustering algorithm [19]. Clus-
tering of transcription data is valuable with respect to assign-
ing function to genes, and this is particularly pertinent to A.
nidulans because less than 10% of the 9,541 putative genes
have been assigned a function (more than 90% of the 9,541
putative genes are called hypothetical or predicted proteins),
based on automated gene prediction tools [9]. Using consen-
sus clustering, we identified genes specifically relevant to the
metabolism of the different carbon sources and, of particular,
interest we identified nearly 200 genes that were significantly
upregulated only during growth on glycerol versus growth on
glucose and ethanol.
In order to study further the transcriptional response to
growth on different carbon sources at the level of the metab-
olism, we used the transcription data to evaluate the opera-
tion of the metabolic network. For this purpose, we
reconstructed the metabolic network of A. nidulans at the
genome level, based on detailed metabolic reconstructions
previously developed for A. niger [20], S. cerevisiae [21], and
Mus musculus [22], as well as information on the genetics,
biochemistry, and physiology of A. nidulans. The metabolic
network reconstructed for A. nidulans contains 1,213 reac-
tions and links 666 genes to metabolic functions. In the proc-
ess of reconstruction, we assigned metabolic functions to 472
ORFs that had not previously been annotated, by employing
tools of comparative genomics based on sequence similarity
and using public databases of genes and proteins of estab-
lished function. The metabolic reconstruction provided a
framework for the analysis of transcriptome data. In particu-
lar, the metabolic network was used in combination with a
recently developed algorithm [23] to identify global regula-
tory responses of the metabolism to variations in carbon
source.
Results
Reconstruction of the metabolic network and ORF
annotation
The metabolic network of A. nidulans was reconstructed
using a pathway-driven approach, which resulted in the
assignment of metabolic roles to 472 ORFs that had not pre-
viously been annotated (Table 1). The reconstructed meta-
bolic network linked a total of 666 genes to metabolic
functions, including 194 previously annotated ORFs in the
Aspergillus nidulans Database [9]. The resulting network
comprises 1,213 metabolic reactions, of which 1095 are
Genome Biology 2006, Volume 7, Issue 11, Article R108 David et al. R108.3
comment reviews reports refereed researchdeposited research interactions information
Genome Biology 2006, 7:R108
biochemical transformations and 118 are transport processes
(Table 1), as well as 732 metabolites. Out of the 1,213 reac-
tions there are 794 that are unique (681 unique biochemical
conversions and 113 unique transport processes), indicating
that 419 of the reactions in the metabolic network are redun-
dant. All the reactions in the metabolic network are listed in
Additional data file 7 (Table S1), as are the abbreviations
assigned to the metabolite names (Table S2). The recon-
structed metabolic network is to our knowledge the largest
microbial network reported to date [24].
Transcriptional responses to changes in the carbon
source
In order to be able to identify primarily the effect of carbon
source on transcription, we grew the cells in well controlled
bioreactors, which enabled us to perform very reproducible
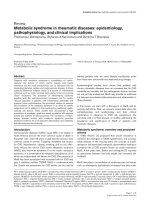
fermentations. Figure 1 shows the biomass and substrate pro-
files for growth on glucose, glycerol, and ethanol. For the fer-
mentations with glucose and glycerol as the carbon sources,
the carbon recoveries were above 90% (>98% for glycerol),
whereas it was only about 64% for growth on ethanol because
of evaporation of the substrate. The batch fermentations were
carried out in three replicates on each of the carbon sources
investigated (for standard deviations, see Figure 1). For all of
the cultivations, the samples for transcriptome analysis were
taken in the early exponential phase of growth, with the bio-
mass concentration being in the range of 1 to 1.5 g dry weight/
kg. At this stage, dispersed filamentous growth was observed
in all cultivations.
Identification of differentially expressed genes in pair-wise
comparisons
The expression data for the three biological replicates on the
three carbon sources were normalized (Additional data file 8
[Tables S3 to S5]) and compared in a pair-wise manner, in
order to detect genome-wide transcriptional changes in
response to a change in carbon source. Differentially
expressed genes for each of the comparisons were identified
by applying a significance statistical test (see Materials and
methods, below) and considering a significance level (or cut-
off in P value) of 0.01. Table 2 shows the total number of sig-
nificantly regulated genes within the genome of A. nidulans
for the three possible pair-wise comparisons between carbon
sources, as well as the number of upregulated and downregu-
lated genes. Because the change in carbon source is expected
to result in changes in carbon metabolism, the number of dif-
ferentially expressed genes that were comprised in the meta-
bolic reconstruction for A. nidulans is also presented for each
case. It is observed that there is an over-representation of
metabolic genes that exhibit significant changes in expression
(metabolic genes only comprise about 7% of the total number
of genes). The complete list of genes whose expression was
significantly changed in the pair-wise comparisons can be
found in Additional data file 9 (Tables S6 to S8; they are also
partly illustrated in Figures S1 to S3 in Additional data files 1,
2 and 3, respectively). The differentially expressed genes were
functionally classified based on Gene Ontology (GO) assign-
ments provided by CADRE [25] (Additional data file 10
[Tables S9 and S10]).
Gene clustering
The genes were arranged in clusters, according to their
expression profiles. In order to reduce the noise in the expres-
Table 1
Biochemical conversions and transport processes, and number of ORFs associated with the metabolic reactions
Part of metabolism Number of metabolic reactions Number of previously annotated ORFs
a
Number of newly annotated ORFs Total number of ORFs
Biochemical reactions 1,095 (681
b
) 188 468 656
C-compound metabolism 463 (220) 96 166 262
Energy metabolism 20 (17) 14 40 54
Aminoacid metabolism 238 (171) 40 125 165
Nucleotide metabolism 144 (114) 10 44 54
Lipid metabolism 175 (122) 13 97 110
Secondary metabolism 42 (25) 16 14 30
Nitrogen and sulphur
metabolism
8 (7) 2 3 5
Polymerization, assembly and
maintenance
5 (5)
Transport processes 118 (113) 6 3 9
Total 1,213 (794) 194 472 666
Shown are the total number of biochemical conversions and transport processes included in the metabolic reconstruction for A. nidulans (number of
unique reactions are given in parenthesis), and the number of ORFs (previously and newly annotated) associated with the metabolic reactions. The
total number of unique ORFs in the metabolic network may be different from the sum of the number of ORFs in the different parts of the
metabolism, because there are ORFs that encode functions in several parts of the metabolism.
a
Aspergillus nidulans Database [9].
b
Six nonenzymatic
steps are included. ORF, open reading frame.
R108.4 Genome Biology 2006, Volume 7, Issue 11, Article R108 David et al. />Genome Biology 2006, 7:R108
sion data before clustering analysis, an analysis of variance
(ANOVA) test was performed that considered normalized
transcriptome data from all of the replicated experiments on
the different carbon sources (Additional data file 11 [Table
S11]). The complete list of statistically significant genes for
different significance levels is presented in Additional data
file 11 (Table S12). For a significance level (or cutoff in P
value) of 0.05, it was observed that the expression levels of
1,534 genes were significantly changed, of which 251 repre-
sented metabolic genes. Clustering analysis was applied to
these 1,534 genes, and a total of eight clusters were identified
(along with an additional cluster that included discarded
genes). These clusters are represented in Figure 2, and the
genes belonging to each group are listed in Additional data
file 12 (Table S13). The GO annotation available in CADRE
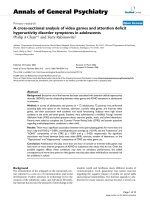
Biomass and substrate profiles for the different batch cultivations carried out with A. nidulansFigure 1
Biomass and substrate profiles for the different batch cultivations carried out with A. nidulans. (a) Cultivation with glucose as carbon source. (b)
Cultivation with glycerol as carbon source. (c) Cultivation with ethanol as carbon source. For all cultivations, the time of sampling, the biomass
concentration at the time of sampling, and the maximum specific growth rate for the culture are given.
Time of
sampling
[h]
Biomass
concentration
[g DW/kg]
Maximum
specific growth
rate [h
-1
]
(a)
0
2
4
6
8
10
0 3 6 9 12 15 18 21 24 27 30 33 36
Fermentation time (h)
Substrate concentration
(g/L)
0
1
2
3
4
5
6
7
Biomass concentration (g
DW/kg)
19.8 ± 0.7 1.39 ± 0.14 0.218 ± 0.004
(b)
0
2
4
6
8
10
0 3 6 9 12 15 18 21 24 27 30 33 36
Fermentation time (h)
Substrate concentration
(g/L)
0
1
2
3
4
5
6
7
Biomass concentration (g
DW/kg)
24.2 ± 0.4 1.20 ± 0.04 0.143 ± 0.001
(c)
0
2
4
6
8
10
0 3 6 9 12 15 18 21 24 27 30 33 36
Fermentation time (h)
Substrate concentration
(g/L)
0
1
2
3
4
5
6
7
Biomass concentration (g
DW/kg)
28.3 ± 0.4 1.23 ± 0.20 0.152 ± 0.013
Table 2
Genes that are differentially expressed in the different pair-wise
comparisons possible between the categories
Comparison Total genes (up/down) Metabolic genes (%)
Ethanol versus glucose 418 (249/169) 103 (25%)
Ethanol versus glycerol 206 (92/114) 58 (28%)
Glycerol versus glucose 71 (57/14) 12 (17%)
Shown are the number of genes that are differentially expressed in the
different pair-wise comparisons possible between the categories, for a
cutoff P value in the logit-t test of 0.01. The total number of genes is
presented along with the number of upregulated (up) and
downregulated (down) genes (shown in parenthesis). The number (and
percentage) of metabolic genes identified within the differentially
expressed genes is also shown.
Genome Biology 2006, Volume 7, Issue 11, Article R108 David et al. R108.5
comment reviews reports refereed researchdeposited research interactions information
Genome Biology 2006, 7:R108
[25] was also used for functional classification of the genes
included in the different clusters (Table 3). The transcrip-
tional patterns of these 1,534 differentially expressed genes
were also used for hierarchical cluster analysis (data not
shown), and it was observed that the replicated experiments
clustered together, as expected.
Identification of metabolic subnetworks
In order to map overall metabolic responses to alterations of
the carbon source, we applied the algorithm proposed by Patil
and Nielsen [23] to identify the so-called reporter metabolites
and to search for highly correlated metabolic subnetworks for
each of the three pair-wise comparisons. This analysis relied
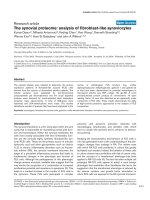
Representation of the eight clusters of genes identifiedFigure 2
Representation of the eight clusters of genes identified. The numbers of genes in each cluster are as follows: 280 in cluster 1, 146 in cluster 2, 184 in
cluster 3, 206 in cluster 4, 92 in cluster 5, 125 in cluster 6, 254 in cluster 7, and 212 in cluster 8. The x-axis represents the different carbon sources
investigated: 1, glucose; 2, ethanol; and 3, glycerol. The y-axis represents normalized intensities, according to Grotkjær and coworkers [19]. Cluster 9
contains discarded genes, with low assignment to any of the other clusters.
Clstr. 1: 280 Clstr. 2: 146 Clstr. 3: 184 Clstr. 4: 206
Clstr. 5: 92 Clstr. 6: 125 Clstr. 7: 254 Clstr. 8: 212
Clstr. 9: 35
1
0.5
0
-0.5
-1
1
0.5
0
-0.5
-1
1
0.5
0
-0.5
-1
1 2 3 1 2 3 1 2 3
1 2 3
R108.6 Genome Biology 2006, Volume 7, Issue 11, Article R108 David et al. />Genome Biology 2006, 7:R108
on the reconstructed genome-scale metabolic network of A.
nidulans, and hence we demonstrated how this metabolic
network could be used to map global regulatory structures in
A. nidulans. The top 15 high-scoring reporter metabolites for
each of the cases are listed in Table 4 (also see Additional data
files 4, 5 and 6 [Figures S4 to S6, respectively]).
To identify metabolic subnetworks with co-regulated expres-
sion patterns we began by finding high-scoring subnetworks,
using the whole reaction set in the reconstructed metabolic
network for A. nidulans, and subsequently we repeated the
algorithm to identify smaller subnetwork structures. The rep-
etition of the algorithm resulted in more robust solutions and
in the identification of smaller networks, as demonstrated
earlier for yeast data [23]. Table 5 shows the list of enzymes
and transporters comprising the 'small' subnetworks for each
of the pair-wise comparisons between the three carbon
sources investigated (also see Additional data files 4, 5 and 6
[Figures S4 to S6, respectively]). Figure 3 shows key enzymes
and transporters comprising the 'small' subnetwork for the
glucose versus ethanol comparison. The 'large' subnetworks
are given in Additional data file 13 (Tables S14 to S16). The
genes in each of the 'small' subnetworks were classified
according to the GO-terms assigned, and the results are pre-
sented in Additional data file 14 (Table S17).
Discussion
Enzyme complexes
In the process of reconstructing the metabolic network we
identified several multi-enzyme complexes (for example, the
F
0
F
1
ATP synthase complex or the pyruvate dehydrogenase
complex, which consist of several different proteins), and we
used the transcriptome data to assess whether there was coor-
dinated control of the expression of genes encoding the pro-
teins of these complexes. Thus, for each enzyme complex
included in the metabolic reconstruction of A. nidulans, we
investigated whether the corresponding subunits had similar
expression profiles. This was checked by verifying whether
the genes encoding proteins within each enzyme complex
were assigned to the same clusters. Furthermore, we calcu-
lated the Pearson correlations for all possible combinations
within each enzyme complex (data not shown), in order to
evaluate how well the corresponding expression levels corre-
lated to each other. Calculation of Pearson correlations also
enabled analysis of genes whose expression did not change
significantly in the conditions studied. Based on the cluster-
ing and Pearson correlation analyses, we observed that, for
about 30% (8/27) of the enzyme complexes considered, the
expression profiles of the genes encoding all of the subunits of
each enzyme complex were similar. Furthermore, in 11% (3/
27) of the cases, the transcription of at least 50% (and <100%)
of the subunits within an enzyme complex were highly
correlated.
We performed the same analyses for S. cerevisiae using tran-
scription data for similar conditions [26]. Here we observed
Table 3
Classification of the genes in each cluster into GO categories
Cluster Number of genes in cluster Biological processes Molecular functions
Cluster 1 280 Ribosome biogenesis
Cytoplasm organization and biogenesis
Ribosome biogenesis and assembly
RNA binding
SnoRNA binding
Nucleic acid binding
Cluster 2 146 Alcohol metabolism
Monosaccharide metabolism
Monosaccharide catabolism
Translation elongation factor activity
Carbohydrate kinase activity
Thryptophan synthase activity
Cluster 3 184 Karyogamy
Karyogamy during conjugation with cellular fusion
Glucan metabolism
DNA binding
Protein kinase regulator activity
Kinase regulator activity
Cluster 4 206 Peroxidase activity
Oxidoreductase activity, acting on peroxide as acceptor
Cluster 5 92 Oxidoreductase activity
Pyruvate dehydrogenase activity
Pyruvate dehydrogenase (acetyl transferring) activity
Cluster 6 125 Generation of precursor metabolites and energy
Energy derivation by oxidation of organic compounds
Fatty acid β-oxidation
Oxidoreductase activity
Triose-phosphate isomerase activity
Allophanate hydrolase activity
Cluster 7 254 Cofactor metabolism
Coenzyme metabolism
Generation of precursor metabolites and energy
Hydrogen ion transporter activity
Monovalent inorganic cation transporter activity
Lyase activity
Cluster 8 212 Protein biosynthesis
Cellular biosynthesis
Macromolecule biosynthesis
Structural constituent of ribosome
Structural molecule activity
Peptidyltransferase activity
The genes in each cluster are classified into GO categories (provided by CADRE), according to the three most important biological processes and
molecular functions. The fields with fewer than three categories correspond to cases in which the P values were above the cutoff selected in the GO
term analysis. The sum of the number of genes in each cluster is not equal to the total number of differentially expressed genes (1,534) because 35
genes were discarded in the clustering analysis (see Analysis of transcriptome data, under Materials and methods).
Genome Biology 2006, Volume 7, Issue 11, Article R108 David et al. R108.7
comment reviews reports refereed researchdeposited research interactions information
Genome Biology 2006, 7:R108
that for about 21% (4/19) of the enzyme complexes included
in the metabolic model for yeast [21], all of the corresponding
subunits had similar expression patterns. Moreover, for 11%
(2/19) of the enzyme complexes there was high correlation for
at least 50% (and <100%) of the genes encoding for the com-
plexes. Despite co-regulation of enzyme complexes in both A.
nidulans and yeast, there does not appear to be any conserva-
tion in terms of transcriptional regulation of enzyme com-
plexes, because only 7% (2/27) of enzyme complexes in A.
nidulans with co-regulation on different carbon sources
(either all components or 50% of the components) were also
found to be co-regulated in yeast.
Ethanol utilization
The catabolism of ethanol, as well as regulation of the genes
involved in this process, is presumably one of the best studied
systems in A. nidulans (see Felenbok and coworkers [27] for
a recent review). Two genes are responsible for the break-
down of ethanol into acetate via acetaldehyde, namely the
genes encoding alcohol dehydrogenase I (alcA; AN8979.2)
and aldehyde dehydrogenase (aldA; AN0554.2). The activa-
tion of this catabolic pathway is dependent on the transcrip-
tional activator alcR (AN8978.2) [28]. Interestingly, a whole
gene cluster composed of seven genes that are responsive to
ethanol (or, more specifically, the gratuitous inducer methyl
ethyl ketone) has previously been reported [29]. This cluster
includes alcA and alcR, as well as five other transcripts (alcP
[AN8977.2], alcO, alcM [AN8980.2], alcS [AN8981.2], and
alcU [AN8982.2]), whose molecular functions have not yet
been identified. In particular, one of these genes (alcO) has
not been annotated in the genome sequence of A. nidulans,
and similarity searches or gene prediction programs using the
DNA sequence of the putative location of this gene were
unsuccessful. Because our array design was based on
annotated ORFs in the genome, this putative gene was not
included in our analysis. However, all of the other genes of
this cluster were found to be significantly upregulated on eth-
anol (alcP, alcR, alcA, alcM, and alcS were found in cluster 7,
and alcU was found in cluster 6). Further positional analysis
showed that there were no other gene clusters that were
significantly regulated under any of the conditions studied
(data not shown).
The subnetwork analysis clearly pointed to a coordinated
expression of genes involved in ethanol metabolism upon
shift from glucose to ethanol (Figure 3), and the response was
to a large extent the same in the shift from glycerol to ethanol
(Table 5). Ethanol is converted to acetate and is further cat-
abolyzed to acetyl-coenzyme A (CoA), which then enters the
mitochondria where it is oxidized (Figure 3). The subnetwork
identified (Table 5) includes methylcitrate synthase (encoded
by mcsA; AN6650.2), which was upregulated during growth
on ethanol. This may point to a role of this enzyme in the
catabolism of acetyl-CoA, in addition to the mitochondrial
citrate synthase (encoded by citA; AN8275.2), which is
expressed during growth both on glucose and ethanol. This is
consistent with earlier reports in which it was found that this
enzyme also possesses some citrate synthase activity [30].
Table 4
Highly regulated or reporter metabolites for the three possible pair-wise comparisons between the different carbon sources
Ethanol versus glucose Ethanol versus glycerol Glycerol versus glucose
Reporter metabolite nP Reporter metabolite nP Reporter metabolite nP
Acetyl coenzyme A
(mitochondrial)
12 2.1E-06 Oxaloacetate 13 7.6E-05 N-Carbamoyl-L-aspartate 3 1.0E-03
Coenzyme A (mitochondrial) 14 2.6E-06 Coenzyme A (mitochondrial) 14 1.2E-04 Carbamoyl phosphate 5 1.7E-03
Glyoxylate (glyoxysomal) 3 1.8E-05 Glyoxylate (glyoxysomal) 3 2.1E-04 2-(Formamido)-N1-(5'-phosphoribosyl)acetamidine 2 2.8E-03
Oxaloacetate 13 9.4E-05 Acetyl coenzyme A (mitochondrial) 12 2.7E-04 Glycogen 2 2.8E-03
Acetyl coenzyme A
(glyoxysomal)
2 1.1E-04 Acetyl coenzyme A (glyoxysomal) 2 4.2E-04 Maltose 6 2.9E-03
Coenzyme A (glyoxysomal) 2 1.1E-04 Coenzyme A (glyoxysomal) 2 4.2E-04 Maltose (extracellular) 6 2.9E-03
Oxaloacetate (mitochondrial) 11 4.4E-04 Oxaloacetate (mitochondrial) 11 4.3E-04 L-glutamine 16 3.1E-03
Carnitine 2 4.9E-04 2-Oxoglutarate (mitochondrial) 9 4.9E-04 α-D-glucose 1-phosphate 4 3.4E-03
O-acetylcarnitine 2 4.9E-04 Citrate 1 5.6E-04 ATP 94 3.7E-03
Propanoyl-coenzyme A 3 6.1E-04 Phosphoenolpyruvate 6 8.5E-04 (R)-3-Hydroxy-3-methyl-2-oxobutanoate
(mitochondrial)
2 4.4E-03
Maltose 6 7.0E-04 Fumarate (mitochondrial) 3 8.6E-04 (R)-2,3-dihydroxy-3-methylbutanoate
(mitochondrial)
2 4.4E-03
Maltose (extracellular) 6 7.0E-04 α-D-glucose 1-phosphate 4 9.5E-04 Carbon dioxide 42 4.7E-03
O-acetylcarnitine (mitochondrial) 2 9.0E-04 Citrate (mitochondrial) 5 1.3E-03 S-acetyldihydrolipoamide (mitochondrial) 2 5.1E-03
Carnitine (mitochondrial) 2 9.0E-04 Carnitine 2 1.9E-03 Carbon dioxide (mitochondrial) 16 6.0E-03
O-acetylcarnitine (glyoxysomal) 2 9.0E-04 O-acetylcarnitine 2 1.9E-03 ADP 64 1.2E-02
Shown are highly regulated or reporter metabolites for the three possible pair-wise comparisons between the different carbon sources, according to Patil and Nielsen [23]. 'n'
denotes the number of neighbors of the reporter metabolite (the number of reactions in which it participates).
R108.8 Genome Biology 2006, Volume 7, Issue 11, Article R108 David et al. />Genome Biology 2006, 7:R108
The list of reporter metabolites (Table 4) is consistent with
the identified subnetwork, because several components of the
subnetwork are identified as reporter metabolites (CoA,
acetyl-CoA, glyoxylate, oxaloacetate, carnitine, and O-acetyl-
carnitine).
Besides alcA or ADH I (AN8979.2), A. nidulans has two addi-
tional alcohol dehydrogenases, namely alcB or ADH II
(AN3741.2) and ADH III (AN2286.2). The former was
assigned to cluster 6, whereas the latter did not appear to be
significantly regulated in our analysis. It is interesting to
observe that several genes in the identified subnetwork are
also part of the metabolism of acetate, which is positively reg-
ulated by FacB (AN0689.2). Furthermore, facB was found to
be significantly upregulated during growth on ethanol and
assigned to cluster 7. FacB has been shown to induce directly
the transcription of genes that are involved in the catabolism
of acetate (acetyl-CoA synthetase, facA [AN5626.2]; carnitine
acetyl transferase, facC [AN1059.2]; isocitrate lyase, acuD
[AN5634.2]; malate synthase, acuE [AN6653.2]; and acetam-
idase, amdS [AN8777.2]) [5,6]. All of these genes were found
to be significantly upregulated during growth on ethanol
(assigned to cluster 7), and several of them are part of the
subnetwork identified from the pair-wise comparison
between glucose and ethanol (Table 5).
The subnetwork also included ATP:citrate oxaloacetate-lyase,
which catalyzes the formation of acetyl-CoA and oxaloacetate
from the reaction of citrate and CoA, with concomitant
hydrolysis of ATP to AMP and phosphate. This enzyme repre-
sents a major source of cytosolic acetyl-CoA during growth on
glucose, which is a precursor for lipid biosynthesis. In A.
nidulans, ATP:citrate oxaloacetate-lyase appears to be regu-
lated by the carbon source present in the medium, with high
Table 5
Enzymes and transporters in subnetworks
Ethanol versus glucose (26 reactions) Ethanol versus glycerol (33 reactions) Glycerol versus glucose (34 reactions)
6-Phosphofructokinase 1,3-β-Glucan synthase 5'-Phosphoribosylformyl glycinamidine synthetase
Acetyl-CoA hydrolase Acetyl-CoA hydrolase 8-Amino-7-oxononanoate synthase
Aconitate hydratase (mitochondrial) Acetyl-CoA synthase Aldehyde dehydrogenase
Alcohol dehydrogenase Aconitate hydratase (mitochondrial) α,α-Trehalase
Aldehyde dehydrogenase Adenylate kinase α-Glucosidase
α-Glucosidase Alanine-glyoxylate transaminase α-Glucosidase
α-Glucosidase Alcohol dehydrogenase Aspartate-carbamoyltransferase
α-Glucosidase Aldehyde dehydrogenase Aspartate-carbamoyltransferase
Aspartate transaminase (mitochondrial) Aspartate transaminase (mitochondrial) B-ketoacyl-ACP synthase
Aspartate transaminase (mitochondrial) Aspartate transaminase (mitochondrial) Carbamoyl-phophate synthetase
ATP:citrate oxaloacetate-lyase ATP:citrate oxaloacetate-lyase Citrate synthase (mitochondrial)
Carnitine O-acetyltransferase Carnitine O-acetyltransferase Dihydrolipoamide S-acetyltransferase (mitochondrial)
Carnitine O-acetyltransferase (mitochondrial) Carnitine O-acetyltransferase (mitochondrial) Dihydroxy acid dehydratase (mitochondrial)
Carnitine/acyl carnitine carrier Citrate synthase (mitochondrial) Fatty-acyl-CoA synthase
Citrate synthase (mitochondrial) Citrate synthase (mitochondrial) Fatty-acyl-CoA synthase
Formate dehydrogenase Formate dehydrogenase Fructose-bisphosphatase
Fructose-bisphosphatase Fumarate dehydratase (mitochondrial) Glucan 1,3-β-glucosidase (extracellular)
Gluconolactonase (extracellular) Glucose 6-phosphate 1-dehydrogenase Glucose 6-phosphate 1-dehydrogenase
Glucose 6-phosphate 1-dehydrogenase Glucose-6-phosphate isomerase Glycerol 3-phosphate dehydrogenase (FAD dependent)
Glyceraldehyde 3-phosphate dehydrogenase Glycerol 3-phosphate dehydrogenase (FAD dependent) Glycerol dehydrogenase
Isocitrate lyase (glyoxysomal) Glycerol dehydrogenase Glycerol kinase
Glycerol kinase Isocitrate lyase (glyoxysomal) GTP cyclohydrolase I
Mannose-6-phosphate isomerase Malate dehydrogenase (malic enzyme; NADP+) Ketol-acid reductoisomerase (mitochondrial)
Phosphoenolpyruvate carboxykinase Malate synthase (glyoxysomal) Malate dehydrogenase (malic enzyme; NADP+)
Pyruvate kinase Mannitol 2-dehydrogenase (NAD+) Mannitol 2-dehydrogenase (NAD+)
Transketolase Phosphoenolpyruvate carboxykinase Mannitol 2-dehydrogenase (NADP+)
Phosphoglucomutase Phosphoenolpyruvate carboxykinase
Phosphogluconate dehydrogenase (decarboxylating) Phosphoribosylamine-glycine ligase
Phosphorylase Phosphorylase
Pyruvate kinase Pyruvate dehydrogenase (lipoamide) (mitochondrial)
Transketolase Pyruvate kinase
UTP-glucose-1-phosphate uridylyltransferase Ribulokinase
UTP-glucose-1-phosphate uridylyltransferase
Shown is a list of the enzymes and transporters that participate in the 'small', highly correlated subnetworks for each pair-wise comparison between the three carbon sources
investigated. Enzymes common to all reactions are highlighted in bold. Some enzymes appear more than once in the table, which means that they are isoenzymes and are
encoded by different genes. CoA, coenzyme A.
Genome Biology 2006, Volume 7, Issue 11, Article R108 David et al. R108.9
comment reviews reports refereed researchdeposited research interactions information
Genome Biology 2006, 7:R108
activity in glucose-grown cells and low activity in acetate-
grown cells [31]. This may be due to the fact that, during
growth on C2 carbon sources, acetyl-CoA is formed directly in
the cytosol in connection with the catabolism of the carbon
source. The genes encoding the enzyme complex for ATP:cit-
rate oxaloacetate-lyase (AN2435.2 and AN2436.2) were
among the most significantly downregulated genes upon shift
from glucose to ethanol (decreases of 22.6-fold and 22.2-fold,
respectively; Additional data file 9 [Table S6]). Moreover, the
genes encoding ATP:citrate oxaloacetate-lyase fell into clus-
ter 2, together with another group of genes that were down-
regulated upon a shift from glucose to ethanol, namely the
major part of the enzymes in the pentose phosphate (PP)
pathway (Additional data file 12 [Table S13]). The subnet-
work also captured changes in the expression of genes partic-
ipating in gluconeogenesis, glycolysis, and the PP pathway. It
was observed that genes involved in gluconeogenesis (PEP
carboxykinase and fructose 1,6-bisphosphatase) were upreg-
ulated during growth on ethanol (assigned to clusters 7 and 6,
respectively), whereas many of the genes of the PP pathway
were downregulated (assigned to cluster 2). This suggests
that an energetically more favorable route for supply of
NADPH (nicotinamide adenine dinucleotide phosphatase,
reduced form) is used during growth on ethanol, namely
through the malic enzyme (encoded by maeA [AN6168.2]),
which was found to be upregulated during growth on ethanol
and was identified in the subnetwork for the glycerol versus
ethanol comparison. This is consistent with earlier findings
that the activity of malic enzyme is low on glucose and high on
ethanol [32], and that maeA may be weakly regulated by car-
bon catabolite repression [33].
From the above, it is clear that there is coordinated regulation
of genes in very different parts of the metabolism, which is
important for the cell to maintain homeostasis during growth
on different carbon sources. The strength of our analysis
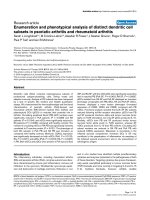
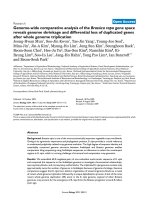
Small subnetwork identified for the shift from glucose to ethanol as carbon sourceFigure 3
Small subnetwork identified for the shift from glucose to ethanol as carbon source. Genes marked red are upregulated and genes marked green are
downregulated upon the shift. The metabolic map is simplified (many transport reactions are not included and the two steps of the glycoxylate pathway
[encoded by the genes acuD and acuE] are placed in the mitochondria even though they are really located in the glyoxysomes). Conversions that involve
several steps are indicated by dashed arrows. The metabolites are as follows: ACCOA, acetyl-CoA; ACE, acetate; ACHO, acetaldehyde; CIT, citrate;
F16BP, fructose 1,6-bisphosphate; F6P, fructose 6-phosphate; G6P, glucose 6-phosphate; GLY, glyoxylate; ICIT, isocitrate; MAL, malate; OAA,
oxaloacetate; PEP, phosphoenolpyruvate; PYR, pyruvate; SUC, succinate.
Ethanol
alcA aldA
ACAL ACE
ACCOA
facC
Glucose
G6P
gsdA
F6P
acuG
PEP
NADPH
AN2583.2
manA
AN0941.2
agdA
Glucans
agdB
Lipids
AN3223
Ethanol
alcA aldA
ACE
facC
Glucose
G6P
gsdA
F6P
acuG
FDP
PEP
NADPH
AN2583.2
manA
AN0941.2
agdA
Glucans
agdB
Lipids
AN3223
acuH
AN6279.2
CIT
OAH
mcsA
AN2435.2/
AN2436.2
OA
ACCOA
ICIT
GLY
MAL
pkiA
PYR
acuF
acuD
acuE
AN5525.2
Lipids
acuH
AN6279.2
Mitochondria
ACCOA
CIT
OAH
mcsA
AN2435.2/
AN2436.2
ICIT
GLX
SUCC
MAL
ACCOA
pkiA
PYR
acuF
acuD
acuE
AN5525.2
Lipids
Glyoxysomes
Ethanol
alcA aldA
ACAL ACE
ACCOA
facC
Glucose
G6P
gsdA
F6P
acuG
PEP
NADPH
AN2583.2
manA
AN0941.2
agdA
Glucans
agdB
Lipids
AN3223
Ethanol
alcA aldA
ACE
facC
Glucose
G6P
gsdA
F6P
acuG
FDP
PEP
NADPH
AN2583.2
manA
AN0941.2
agdA
Glucans
agdB
Lipids
AN3223
acuH
AN6279.2
CIT
OAH
mcsA
AN2435.2/
AN2436.2
OA
ACCOA
ICIT
GLY
MAL
pkiA
PYR
acuF
acuD
acuE
AN5525.2
Lipids
acuH
AN6279.2
Mitochondria
ACCOA
CIT
OAH
mcsA
AN2435.2/
AN2436.2
ICIT
GLX
SUCC
MAL
ACCOA
pkiA
PYR
acuF
acuD
acuE
AN5525.2
Lipids
Glyoxysomes
R108.10 Genome Biology 2006, Volume 7, Issue 11, Article R108 David et al. />Genome Biology 2006, 7:R108
based on the metabolic network is that these coordinated
expression patterns are clearly captured using a nonsuper-
vised algorithm.
For the ethanol versus glucose comparison, it was interesting
to note that the gene with the greatest fold change (151 times)
was that of alcS. This is relevant considering that no molecu-
lar function has been suggested for this gene so far. In silico
analysis suggests that AlcS might be a membrane bound
transporter protein (six transmembrane-helix domains; con-
served domain [PFAM01184]), indicating that AlcS could be
an acetate transporter.
Regulation of transcription factors
As mentioned above, we observed that the gene facB was
upregulated during growth on ethanol. However, we also
found that several other transcription factors were regulated
during growth on ethanol. Thus, we observed that creA
(AN6195.2), which is the major mediator of carbon catabolite
repression in A. nidulans, was located in cluster 6 and hence
was upregulated during growth on ethanol. This might seem
surprising, considering that CreA is assumed to be a tran-
scriptional repressor and most active on glucose, but our find-
ings corroborate findings reported by Strauss [34] and Sims
[11] and their coworkers, who showed that creA is regulated
at the transcriptional level when the mycelium is shifted to or
from ethanol. The low expression of creA on glucose could be
due to autoregulation, which is presumably elevated on the
de-repressing carbon source ethanol, and on the intermediate
repressing carbon source glycerol. However, our findings
clearly showed that this regulation of creA not only occurs
after changing the carbon source but is also reflected in the
mRNA abundance of creA, during balanced growth condi-
tions (it is not a transient phenomenon).
Besides the two transcriptional regulators AlcR and FacB,
another known positive regulator was found in cluster 7,
namely AreA (AN8667.2). AreA was probably the first regula-
tory gene described in A. nidulans [35], and it is a wide-
domain regulator necessary for the activation of genes for the
utilization of nitrogen sources. To our knowledge, it has not
been reported that AreA is upregulated during growth on eth-
anol as compared with glucose or glycerol (cluster 7). Our
results could indicate crosstalk between carbon repression
and nitrogen repression pathways in A. nidulans. Supporting
our findings on AreA regulation, we identified the gene uapC
(AN6730.2) in cluster 7. This gene encodes a purine permease
and has been shown to be regulated by AreA [36]. Another
transcription factor assigned to cluster 7, namely metR,
encodes a transcriptional activator for sulfur metabolism in
A. nidulans [37], and it thereby links yet another branch of
central metabolism to the regulatory network that is control-
led by the nature of the carbon source.
Glycerol utilization and polyol metabolism
Regulation of the biosynthesis and breakdown of glycerol are
less studied in comparison with the metabolism of ethanol,
but from our analysis we identified more than 200 genes that
were significantly upregulated and another 200 genes that
were significantly downregulated only during growth on glyc-
erol as compared with growth on glucose and ethanol (clus-
ters 4 and 8). It was previously described that there are two
metabolic pathways that lead to glycerol, from the glycolytic
intermediate dihydroxyacetone 3-phosphate. One of these
pathways proceeds via dihydroxyacetone kinase to
dihydroxyacetone, which is then converted into glycerol, by
the action of a glycerol dehydrogenase (NADH [nicotinamide
adenine dinucleotide] or NADPH dependent). The alternative
route, which has been suggested to be responsible for the
catabolism of glycerol [8], includes the formation of glycerol
3-phosphate (catalyzed by glycerol 3-phosphate dehydroge-
nase), and subsequently its conversion into glycerol, by the
action of glycerol 3-phosphate phosphatase.
Several of the genes encoding these enzymes have previously
been characterized, and we identified alternative candidates,
as well as the missing ones, in our reconstruction of the met-
abolic network. The data obtained from the transcriptome
analysis confirmed that the catabolic pathway via glycerol 3-
phosphate is a major route for glycerol catabolism, because a
gene putatively encoding the glycerol kinase (AN5589.2), as
well as the gene putatively encoding a FADH-dependent
glycerol 3-phosphate dehydrogenase (AN1396.2), were both
significantly upregulated on glycerol as compared with etha-
nol and glucose. Moreover, both genes were assigned to clus-
ter 4, which represents genes that are specifically upregulated
during growth on glycerol, and were identified in the subnet-
works of glycerol comparisons with the two other carbon
sources. However, the transcriptome data also showed that
the alternative pathway might be involved in the catabolism
of glycerol. In fact, a gene that was identified in the metabolic
reconstruction process as putatively encoding a NADPH-
dependent glycerol dehydrogenase (AN7193.2) was upregu-
lated on glycerol (cluster 3), as well as a gene that was identi-
fied as a putative dihydroxyacetone kinase (AN0034.2;
cluster 4). Therefore, it seems likely that both pathways are
actually involved in the utilization of glycerol. Interestingly, a
previously characterized gene encoding a NADPH-dependent
glycerol dehydrogenase (gldB; AN5563.2) [38] was also
found to be significantly regulated, but exhibited a very differ-
ent expression pattern from the putative gene encoding
NADPH-dependent glycerol dehydrogenase (AN7193.2).
Thus, because gldB was downregulated on glycerol, it was
assigned to cluster 8.
The biosynthesis of mannitol occurs through routes that are
similar to the two metabolic pathways that lead to glycerol. It
has been reported that mannitol is implicated in the stress
response to heat [39] and that it is the most abundant polyol
in conidia of A. nidulans [40]. One of the pathways that lead
Genome Biology 2006, Volume 7, Issue 11, Article R108 David et al. R108.11
comment reviews reports refereed researchdeposited research interactions information
Genome Biology 2006, 7:R108
to mannitol proceeds via mannitol 1-phosphate, from the gly-
colytic intermediate fructose 6-phosphate, and another one,
which has fructose as an intermediate. The metabolic reac-
tions interconverting these four metabolites open the possi-
bility for a cyclic reaction pathway within the cell that allows
the conversion of NADH into NADPH at the expense of one
molecule of ATP [41]. None of the genes encoding enzymes
involved in the mannitol cycle have previously been charac-
terized. However, by applying the comparative genomics
approach for the reconstruction of the metabolism, we iden-
tified putative candidate ORFs for all the reactions of the
mannitol cycle, with the exception of the mannitol 1-phos-
phate phosphatase. Interestingly, most of these ORFs identi-
fied (6/8) showed lower expression levels on ethanol, at least
when compared with glycerol (assigned to clusters 2, 3, and
4), and this could point to a role for the mannitol cycle in the
formation of NADPH during growth on glycerol. Moreover,
the gene that encodes the glucose 6-phosphate dehydroge-
nase (AN2981.2), which has been shown to be positively cor-
related with the formation of mannitol, was also assigned to
cluster 2 and significantly downregulated on ethanol. This
enzyme was identified in the subnetwork for the glucose ver-
sus glycerol comparison, and transcription of the correspond-
ing gene was lower during growth on glycerol than during
growth on glucose. This could indicate a partial shift from the
PP pathway, as the main route for NADPH supply for biosyn-
thesis, to the mannitol cycle.
Glycerol has also been shown to be involved in the response
to different osmotic conditions in A. nidulans [42], and it has
also been reported that all of the components of the high-
osmolarity glycerol (HOG) response pathway that are known
in yeast have orthologs in A. nidulans [43,44]. The analysis of
the transcriptional responses of these components to the dif-
ferent growth conditions considered in the present study
revealed that only the gene that encodes the sensor protein
SlnA (slnA; AN1800.2) was significantly regulated and this
was assigned to cluster 4 (slnA seemed to be induced when
glycerol was the sole carbon source, as compared with glucose
or ethanol).
Metabolism of reserve compounds and cell wall
polysaccharides
Another metabolite that has been reported to be related to
glycerol metabolism is trehalose. In fact, it has been shown
that trehalose, which is stored in the conidiospores, is con-
verted into glycerol upon germination [45].
The biosynthesis of trehalose occurs, via trehalose 6-phos-
phate, from glucose 6-phosphate and UDP-glucose, whereas
it is degraded directly to glucose. Our reconstruction of the
metabolic network includes six genes that might be involved
in these metabolic pathways, of which four have been
confirmed experimentally [45-48]. The cluster analysis
showed that the transcription of three of these six genes was
significantly changed, with higher levels on glucose, com-
pared with ethanol and glycerol (genes assigned to clusters 1
and 2). Because these three genes encode each of the different
steps in the biosynthesis as well as degradation of trehalose,
these observations suggest that there may be a higher turno-
ver of trehalose during growth on glucose.
Glycogen is another reserve carbohydrate, similar to treha-
lose, and interestingly the two genes putatively assigned to its
biosynthesis and degradation exhibited their highest expres-
sion levels on glycerol (clusters 3 and 4, respectively), which
might suggest an effect of this carbon source on glycogen
turnover. In this regard, it was also interesting to verify that
the GO term analysis for the pair-wise comparisons showed
that genes associated with cell wall metabolism were signifi-
cantly over-represented in the upregulated gene set as well as
in the downregulated gene set.
More detailed analysis of the genes that were upregulated on
glycerol compared with glucose, and that resulted in the over-
representation of the GO terms, revealed that all of them
putatively encode enzymes with β-1,3-glucosidase activity,
which suggests that specially the β-1,3-glucan fraction of the
fungal cell wall undergoes major rearrangements depending
on the carbon source. On the other hand, the genes that were
downregulated on glycerol and associated with GO terms for
the cell wall biosynthesis encoded α-glucosidases (AN8953.2,
AN0941.2, and AN4843.2) and were assigned to cluster 5.
These enzymes are responsible for the breakdown of α-linked
glucans into glucose, and it is therefore surprising that three
genes encoding α-glucosidases (one putatively [AN0941.2]
and two experimentally confirmed [agdA (AN2017.2) and
agdB (AN8953.2)] [49]) exhibited their highest expression
levels on glucose, which means that they are not repressed by
glucose. It could be speculated that these genes are also
involved in the remodeling of the α-glucan fraction of the cell
wall, depending on the available carbon source.
One of the α-glucosidases (AN2017.2) is part of a gene cluster
that encodes proteins responsible for the breakdown of α-glu-
cans (such as starch). This cluster contains a putative glycosyl
transferase (AN2015.2) that was significantly downregulated
on ethanol compared with glucose and glycerol (assigned to
cluster 3); the previously mentioned agdA, which encodes an
α-glucosidase; the regulatory protein amyR (AN2016.2),
which appears to be regulated in the same way as agdA (also
found in cluster 2 and significantly downregulated on ethanol
compared with glucose); and, finally, amyA (AN2018.2),
which encodes an α-amylase but which does not appear to be
significantly regulated under the conditions investigated in
the present study.
AmyR directly controls the expression of agdA by binding to
its promoter [50] and the direct correlation between the two
mRNA levels suggests that solely the quantity of AmyR within
the cell might be responsible for the regulation of agdA
, with-
out any further requirement for post-translational activation
R108.12 Genome Biology 2006, Volume 7, Issue 11, Article R108 David et al. />Genome Biology 2006, 7:R108
of AmyR. It is also interesting to note that it has previously
been shown that amyR is controlled by CreA [51], which is in
agreement with our findings (compare the expression pattern
of cluster 6, containing creA, with that of cluster 2, containing
amyR).
Ribosome biogenesis
It has been reported that the specific growth rate influences
the expression of genes encoding ribosomal proteins in S. cer-
evisiae, and that the transcription of these genes increases
with increasing specific growth rates [52]. Similarly, we
observed that the expression profiles of genes encoding ribos-
omal proteins followed the same trend as the maximal spe-
cific growth rate. In fact, in the batch cultivations carried out
with A. nidulans on the different carbon sources the cells
grew at unlimited conditions, and hence at their maximal spe-
cific growth rate possible on the given carbon source. The spe-
cific growth rates were highest for growth on glucose and
about the same on ethanol and glycerol (Figure 1). According
to the GO term analysis, cluster 1 is mainly characterized by
genes whose functions are related to ribosome biogenesis, as
can be observed in Table 3. Indeed, 59 out of the 280 genes
assigned to cluster 1 are associated with the GO term 'ribos-
ome biogenesis'. It is interesting that this cluster includes
genes that have higher expression levels during growth on
glucose, and this indicates - as observed for yeast - that these
genes might indeed be involved in the ribosome biogenesis
and that they are possibly regulated in a growth-rate depend-
ent manner.
Materials and methods
Strain
The strain used in this study was the strain Aspergillus nidu-
lans A187 (pabaA1 yA2; obtained from the Fungal Genetics
Stock Center, Kansas City, KA, USA).
Growth medium
The medium used in all batch cultivations was a chemically
defined medium as described by Agger and coworkers [53],
with the following modifications: NH
4
Cl was used as the
nitrogen source, at a concentration of 12.2 g/l, and three dif-
ferent carbon sources were tested, namely glucose, glycerol,
and ethanol (10 g/l). Yeast extract was added to the fermenter
at a concentration of 3 mg/l in order to encourage the germi-
nation of spores. Furthermore, the nutritional supplement p-
aminobenzoic acid (PABA) was added to the medium at a
concentration of 1 mg/l, as well as the antifoam agent 204
(Sigma, Brøndby, Denmark)) at a concentration of 0.05 ml/l.
Propagation of spores
The fermenters were inoculated with spores of A. nidulans
A187 previously propagated on solid minimal medium [54]
containing PABA (10 mg/l). The same stock of spores of A.
nidulans was used to inoculate all the plates. The spores were
cultivated at 37°C, during 3 to 4 days, and harvested by
adding distilled water. For the fermentations performed in
replicates, the fermenters were inoculated with the same
solution of spores, to a final concentration of 5 × 10
9
spores/l.
High concentrations of spores in the inoculum were
employed because they favor dispersed filamentous growth.
The spore solutions were vortex mixed before introduction
into the fermenters, in order to prevent agglomeration of
spores and thus pellet formation.
Batch cultivations
All aerobic batch cultivations were performed in 3 L-Braun
fermenters with a working volume of 2 l. The bioreactors were
equipped with two Rushton four-blade disc turbines and no
baffles (thereby reducing the surface available for wall
growth). Air was used to sparge the bioreactor. The concen-
trations of oxygen and carbon dioxide in the exhaust gas were
monitored using an acoustic gas analyzer (Brüel & Kjær,
Nærum, Denmark). Temperature, pH, agitation, and aeration
rate were controlled throughout the cultivations. The temper-
ature was maintained at 30°C. The pH was controlled by
automatic addition of 2 N NaOH and 2 N HCl. For the culti-
vations on glucose and glycerol, the pH was initially set to 3.0
to prevent spore aggregation; only when the spores started to
germinate was the pH gradually increased to 6.0. Because
pellet formation is unlikely to occur during growth on etha-
nol, the pH was set to 6.0 from the start, in the cultivations
performed with this carbon source. Similarly, the stirrer
speed was initially set to 100 rpm and the aeration rate to 0.01
vvm, and only after the spores started to germinate were these
parameters progressively increased to 700 rpm and 1 vvm,
respectively.
Sampling
For quantification of cell mass and extracellular metabolites,
the fermentation broth was withdrawn from the fermenter
vessel and filtered through nitrocellulose filters (pore size
0.45 μm; Pall Corporation, East Hills, NY, USA). The filter
cakes were immediately processed for determination of cell
mass, whereas the filtrates were stored at -20°C until they
were analyzed for determination of extracellular metabolites
(substrates and metabolic byproducts).
For gene expression analysis, the mycelia were harvested and
processed within half a minute. The mycelia were filtered
using Miracloth (Calbiochem, San Diego, CA, USA) and
washed with phosphate-buffered saline (PBS) solution (137
mmol/l NaCl, 2.7 mmol/l KCl, 10 mmol/l Na
2
HPO
4
, and 0.24
mmol/l KH
2
PO
4
; pH 7.4). After removal of excess PBS solu-
tion, the mycelia were frozen in liquid nitrogen and stored at
-80°C until further analysis.
Cell mass determination
Cell dry weight was determined using nitrocellulose filters
(pore size 0.45 μm; Pall Corporation). The filters were pre-
dried in a microwave oven at 150 W for 10 minutes and sub-
sequently weighed. A known volume of cell culture was
Genome Biology 2006, Volume 7, Issue 11, Article R108 David et al. R108.13
comment reviews reports refereed researchdeposited research interactions information
Genome Biology 2006, 7:R108
filtered and the filter cake was washed with 0.9% NaCl and
dried on the filter for 15 minutes in a microwave oven at 150
W. The filter was weighed again to determine the cell mass
concentration.
Analysis of extracellular metabolites
The concentrations of sugars, organic acids, and polyols in
the filtrates (thawed on ice) were determined using high-
pressure liquid-chromatography on an Aminex HPX-87Hm
column (Bio-Rad, Hercules, CA, USA). The column was kept
at 65°C and eluted at 0.6 ml/minute with 5 mmol/l H
2
SO
4
.
The compounds were detected refractometrically (410 Differ-
ential Refractometer, Waters Corporation, Milford, MA,
USA).
Extraction of total RNA
Total RNA was isolated using the Qiagen RNeasy Mini Kit
(QIAGEN Nordic, Ballerup, Denmark), according to the pro-
tocol for isolation of total RNA from animal tissues. For this
purpose, approximately 20 to 30 mg frozen mycelium was
placed in a 2 ml Eppendorf tube, precooled in liquid nitrogen,
containing three RNase-treated steel balls (two balls with a
diameter of 2 mm and one ball with a diameter of 5 mm). The
tubes were then shaken in a Retsch Mixer Mill, at 3°C, for 6 to
8 minutes, until the mycelia were ground to powder and thus
ready for extraction of total RNA. The quality and quantity of
the total RNA extracted were determined by spectrophoto-
metric analysis and by gel electrophoresis. The total RNA was
stored at -80°C until further processing.
Microarray manufacturing and design
The microarrays used for the analysis of the transcriptome of
A. nidulans were custom-made NimbleExpress™ arrays
(NimbleGen Systems Inc., Madison, WI, USA), which were
acquired through Affymetrix (Santa Clara, CA, USA). Nimble-
Express™ arrays are manufactured using a Maskless Array
Synthesizer system, which makes use of a Digital Micromirror
Device. This device consists of a system of miniature alumi-
num mirrors, which are individually controlled, enabling the
synthesis of oligomers in a similar way to the photolitho-
graphic process used in the manufacture of Affymetrix
®
GeneChip arrays. The NimbleExpress™ arrays are packaged
in an Affymetrix
®
GeneChip cartridge (49 format), and can be
used with GeneChip reagents and processed on the
GeneChip
®
Instrument System (for more information, see
[55]).
The selection of the probes for interrogating the ORFs within
the genome of A. nidulans was performed by the Affymetrix
Chip Design Group, who used the same algorithms employed
in the design of standard Affymetrix
®
GeneChip arrays. The
arrays contain only perfect match (PM) probes. Of the 9,541
putative genes identified in the genome of A. nidulans
(Aspergillus nidulans Database [9], release 3.1; Broad Insti-
tute), 9,444 were represented in the microarray
(CBS01CMBA530008N). Each ORF was interrogated with
one (8,628), two (815), or three probe sets (1), and each of
these probe sets were composed of 11 probes (whenever pos-
sible) of 25 oligomers. Different types of probe sets were rep-
resented on the array, namely type 1 (if all probes in the set
hybridized exclusively with the target sequence), type 2 (if all
probes in the set hybridized with the target sequence and
cross-hybridized with other sequences), and type 3 (mixed
probe set). In the data analysis, only probe sets of type 1 (or,
rather, probes that did not cross-hybridize with genes other
than the target) were considered, which brought the number
of putative genes investigated down to 9,371.
Preparation of biotin-labeled cRNA and microarray
processing
Biotin-labeled cRNA was prepared from approximately 10 μg
of total RNA, according to the protocol described in the
Affymetrix GeneChip
®
Expression Analysis Technical Man-
ual (2004) [56]. An additional cleanup step was performed
before fragmentation, using the Qiagen RNeasy Mini Kit
(protocol for RNA Cleanup), in order to guarantee good-qual-
ity cRNA samples for subsequent processing. The cRNA was
quantified in a spectrophotometer (Amersham Pharmacia
Biotech, GE Healthcare Bio-Sciences AB, Uppsala, Sweden)
and its quality was assessed by gel electrophoresis and using
a bioanalyzer (Agilent Technologies Inc., Santa Clara, CA,
USA). The biotin-labeled cRNA was then fragmented and
approximately 13 μg of fragmented cRNA was hybridized to
the custom-made NimbleExpress™ array
(CBS01CMBA530008N), as described in the Affymetrix
GeneChip
®
Expression Analysis Technical Manual (2004)
[56]. The array was further processed on a GeneChip
®
Fluid-
ics Station FS-400 (fluidics protocol EukGE-WS2v4) and on
an Agilent GeneArray
®
Scanner. The scanned probe array
images (.DAT files) were converted into .CEL files using the
GeneChip
®
Operating Software (Affymetrix).
Reconstruction of the metabolic network and gene
annotation
The metabolic network of A. nidulans was reconstructed by
employing a pathway-driven approach described elsewhere
[57] and comparative genomics tools based on sequence sim-
ilarity. The metabolism of A. nidulans was reconstructed
using as templates detailed metabolic reconstructions previ-
ously developed for A. niger [20], Saccharomyces cerevisiae
[21], and Mus musculus [22]. Pathway prediction in A. nidu-
lans was supported by available information on its genetics,
biochemistry, and physiology. Thereby, it was possible to
identify metabolic functions without a gene associated in the
genome of A. nidulans, and thus candidate ORFs for encod-
ing those functions, by employing similarity-based tools of
comparative genomic analysis (BLAST [Basic Local
Alignment Search Tool]) and using public (nonredundant)
databases of genes and proteins of established function [58].
R108.14 Genome Biology 2006, Volume 7, Issue 11, Article R108 David et al. />Genome Biology 2006, 7:R108
Analysis of transcriptome data
Raw probe intensities were preprocessed by applying the
RMA (robust multiarray average) method for background
correction (based on PM probe information) [59], and were
subsequently normalized using the qspline method [60].
Gene expression index values were calculated using the
method developed by Li and Wong [61], using the PM-only
model. Normalized gene expression data was deposited at the
GEO database [62], with accession numbers GPL3604 (plat-
form), GSM102371-GSM102379 (samples), and GSE4578
(series).
Statistical analysis was applied to determine differentially
expressed genes between the categories of replicated experi-
ments. For all of the possible pair-wise comparisons within
the three different categories, the logit-t method [63] was
employed, whereas ANOVA was used to compare gene
expression levels among all categories. The genes whose
expression was found to be significantly changed using the
ANOVA test were further arranged into clusters, by applying
ClusterLustre, a Bayesian consensus clustering method
recently developed and available in the Matlab application
[19].
Furthermore, reporter metabolites (metabolites around
which the most significant changes in transcription occur)
and highly correlated metabolic subnetworks (sets of con-
nected genes with significant and coordinated transcriptional
response to a perturbation) were identified for each of the
pair-wise comparisons possible within the three categories,
as described by Patil and Nielsen [23]. For this purpose,
information on the topology of the reconstructed metabolic
network of A. nidulans was used in combination with the P
values from the logit-t test performed for each of the pair-wise
comparisons of expression data.
Data deposition
Normalized gene expression data were deposited at the GEO
database [62], with accession numbers GPL3604 (platform),
GSM102371-GSM102379 (samples), and GSE4578 (series).
Additional data files
The following additional data are available with the online
version of this paper. Additional data file 1 illustrates genes
whose expression was significantly changed in the pair-wise
comparison: glucose versus ethanol. Additional data file 2
illustrates genes whose expression was significantly changed
in the pair-wise comparison: glycerol versus ethanol.
Additional data file 3 illustrates genes whose expression was
significantly changed in the pair-wise comparisons glucose
versus glycerol. Additional data file 4 illustrates reporter
metabolites and enzymes comprising the 'small' subnetwork
identified by comparing expression data on glucose and etha-
nol. Additional data file 5 illustrates reporter metabolites and
enzymes comprising the 'small' subnetwork identified by
comparing expression data on glycerol and ethanol. Addi-
tional data file 6 illustrates reporter metabolites and enzymes
comprising the 'small' subnetwork identified by comparing
expression data on glucose and glycerol. Additional data file 7
lists all of the reactions in the metabolic network recon-
structed for A. nidulans and gives the abbreviations assigned
to the metabolite names. Additional data file 8 lists the nor-
malized intensities for the three biologic replicates on the
three carbon sources studied. Additional data file 9 includes
complete lists of genes whose expression was significantly
changed in the pair-wise comparisons. Additional data file 10
presents the functional classification of the differentially
expressed genes based on GO assignments provided by
CADRE. Additional data file 11 provides results from the
ANOVA test performed, considering normalized transcrip-
tome data from all of the replicated experiments on the differ-
ent carbon sources. Additional data file 12 lists the genes
assigned to each gene cluster. Additional data file 13 presents
the 'large' subnetworks for each of the pair-wise comparisons
between the three carbon sources investigated. Additional
data file 14 presents the functional classification of the genes
in each of the 'small' subnetworks, based on GO assignments
provided by CADRE.
Additional data file 1Genes whose expression was significantly changed in the pair-wise comparisons: glucose versus ethanolDifferentially expressed genes in the central metabolism of A. nid-ulans between the replicated experiments on glucose and ethanol, revealed by the logit-t method (see Additional data file 9 [Table S6] for a full list of genes. Upregulated and downregulated genes are represented in red and green, respectively. Fold changes greater than 10 are highlighted in bold.Click here for fileAdditional data file 2Genes whose expression was significantly changed in the pair-wise comparisons: glycerol versus ethanolDifferentially expressed genes in the central metabolism of A. nid-ulans between the replicated experiments on glycerol and ethanol, revealed by the logit-t method (see Additional data file 9 [Table S7] for a full list of genes. Upregulated and downregulated genes are represented in red and green, respectively. Fold changes greater than 10 are highlighted in bold.Click here for fileAdditional data file 3Genes whose expression was significantly changed in the pair-wise comparisons: glucose versus glycerolDifferentially expressed genes in the central metabolism of A. nid-ulans between the replicated experiments on glucose and glycerol, revealed by the logit-t method (see Additional data file 9 [Table S8] for a full list of genes. Upregulated and downregulated genes are represented in red and green, respectively. Fold changes greater than 10 are highlighted in bold.Click here for fileAdditional data file 4Reporter metabolites and enzymes comprising the 'small' subnet-work identified by comparing expression data on glucose and ethanolReporter metabolites and enzymes comprising the 'small' subnet-work identified by comparing expression data on glucose and etha-nol (represented in blue). Also shown are the top 15 high-scoring reporter metabolites.Click here for fileAdditional data file 5Reporter metabolites and enzymes comprising the 'small' subnet-work identified by comparing expression data on glycerol and ethanolReporter metabolites and enzymes comprising the 'small' subnet-work identified by comparing expression data on glycerol and eth-anol (represented in blue). Also shown are the top 15 high-scoring reporter metabolites.Click here for fileAdditional data file 6Reporter metabolites and enzymes comprising the 'small' subnet-work identified by comparing expression data on glucose and glycerolReporter metabolites and enzymes comprising the 'small' subnet-work identified by comparing expression data on glucose and glyc-erol (represented in blue). Also shown are the top 15 high-scoring reporter metabolites.Click here for fileAdditional data file 7Reactions in the metabolic network reconstructed for A. nidulans and the abbreviations assigned to the metabolite namesTable S1 lists the reactions comprising the metabolic reconstruc-tion developed for A. nidulans. Each reaction is associated to an ORF within the genome of A. nidulans (when available), and to the EC number of the corresponding enzyme (when available). Table S2 lists metabolites, abbreviations used, and full names. (In the abbreviations, the suffixes m, g, and e stand for metabolites local-ized in the mitochondria, glyoxysomes and extracellular medium, respectively. No suffix was added to cytosolic metabolites.)Click here for fileAdditional data file 8Normalized intensities for the three biologic replicates on the three carbon sources studiedTables S3, S4, and S5 give normalized intensities considering the replicated experiments on glucose and ethanol, on glycerol and eth-anol, and on glucose and glycerol, respectively.Click here for fileAdditional data file 9Genes whose expression was significantly changed in the pair-wise comparisonsTables S6, S7 and S8 list differentially expressed genes between the replicated experiments on glucose and ethanol, revealed by the logit-t method. The genes are sorted according to ascending P value from the statistical analysis. The average fold changes of expression between ethanol and glucose (Table S6), between ethanol and glyc-erol (Table S7), and between glycerol and glucose (Table S8) are also presented (a fold change equal to 2 [-2] indicates a twofold upregulation [downregulation] in ethanol relative to glucose [Table S6], in ethanol relative to glycerol [Table S7], or in glycerol relative to glucose [Table S8]).Click here for fileAdditional data file 10Functional classification of the differentially expressed genes based on GO assignments provided by CADRETables S9 and S10 present the classifications of the upregulated and downregulated genes, respectively, given in Table 2 into GO categories (provided by CADRE), according to the three most important biological processes and molecular functions.Click here for fileAdditional data file 11Results from the ANOVA test performed, considering normalized transcriptome data from all of the replicated experiments on the different carbon sourcesTable S11 gives the normalized intensities considering all of the cat-egories of replicated experiments (glucose, glycerol, and ethanol). Table S12 provides P values from the ANOVA test between all cate-gories of replicated experiments (glucose, glycerol, and ethanol). The genes are sorted according to ascending P value.Click here for fileAdditional data file 12Genes assigned to each gene clusterTable S13 summarizes gene clusters identified by applying Cluster-Lustre to the genes that were found to be significantly changed in the ANOVA test.Click here for fileAdditional data file 13The 'large' subnetworks for each of the pair-wise comparisons between the three carbon sources investigatedTables S14, S15, and S16 provide lists of enzymes and transporters comprising the 'large' subnetwork, obtained by comparing expres-sion data on glucose and ethanol, on glycerol and ethanol, and on glucose and glycerol, respectively.Click here for fileAdditional data file 14Functional classification of the genes in each of the 'small' subnet-works, based on GO assignments provided by CADRETable S17 summarizes the classification of the genes included in the 'small' highly correlated subnetworks into GO categories (provided by CADRE), according to the three most important biological proc-esses and molecular functions.Click here for file
Acknowledgements
The authors thank Michael Lynge Nielsen for his contribution to the the
design of the array. Jesper Mogensen and Steen Lund Westergaard are
thanked for their guidance in the sample preparation and microarray
processing, and Lene Christiansen, Kristine Bøje Dahlin and Thomas Jensen
for technical assistance. Kiran Patil and Thomas Grotkjær are acknowl-
edged for helping with the data analysis. HD was funded through a research
fellowship (SFRH/BD/3110/2000) of the III Community Support Frame-
work financed by the European Social Fund and by a Portuguese National
Fund from the Ministry of Science and Technology. Much of this work was
funded by the Danish Technical Research Council through basic funding for
Center for Microbial Biotechnology.
References
1. Galagan JE, Calvo SE, Cuomo C, Ma LJ, Wortman JR, Batzoglou S, Lee
SI, Basturkmen M, Spevak CC, Clutterbuck J, et al.: Sequencing of
Aspergillus nidulans and comparative analysis with A. fumiga-
tus and A. oryzae. Nature 2006, 438:1105-1115.
2. Machida M, Asai K, Sano M, Tanaka T, Kumagai T, Terai G, Kusumoto
K, Arima T, Akita O, Kashiwagi Y, et al.: Genome sequencing and
analysis of Aspergillus oryzae. Nature 2005, 438:1157-1161.
3. Nierman WC, Pain A, Anderson MJ, Wortman JR, Kim HS, Arroyo J,
Berriman M, Abe K, Archer DB, Bermejo C, et al.: Genomic
sequence of the pathogenic and allergenic filamentous fun-
gus Aspergillus fumigatus. Nature 2005, 438:1151-1156.
4. Flipphi M, Mathieu M, Cirpus I, Panozzo C, Felenbok B: Regulation
of the aldehyde dehydrogenase gene (aldA) and its role in the
control of the coinducer level necessary for induction of the
ethanol utilization pathway in Aspergillus nidulans. J Biol Chem
2001, 276:6950-6958.
5. Todd RB, Andrianopoulos A, Davis MA, Hynes MJ: FacB, the
Aspergillus nidulans activator of acetate utilization genes,
binds dissimilar DNA sequences. EMBO J 1998, 17:2042-2054.
6. Stemple CJ, Davis MA, Hynes MJ: The facC gene of Aspergillus nid-
ulans encodes an acetate-inducible carnitine
acetyltransferase. J Bacteriol 1998, 180:6242-6251.
7. Ruijter GJ, Visser J: Carbon repression in aspergilli. FEMS Micro-
biol Lett 1997, 151:103-114.
8. Hondmann DH, Busink R, Witteveen CF, Visser J: Glycerol catab-
olism in Aspergillus nidulans. J Gen Microbiol 1991, 137:
629-636.
9. Aspergillus nidulans Database [ /> Genome Biology 2006, Volume 7, Issue 11, Article R108 David et al. R108.15
comment reviews reports refereed researchdeposited research interactions information
Genome Biology 2006, 7:R108
tion/fungi/aspergillus/index.html]
10. Sims AH, Robson GD, Hoyle DC, Oliver SG, Turner G, Prade RA,
Russell HH, Dunn-Coleman NS, Gent ME: Use of expressed
sequence tag analysis and cDNA microarrays of the filamen-
tous fungus Aspergillus nidulans. Fungal Genet Biol 2004,
41:199-212.
11. Sims AH, Gent ME, Lanthaler K, Dunn-Coleman NS, Oliver SG, Rob-
son GD: Transcriptome analysis of recombinant protein
secretion by Aspergillus nidulans and the unfolded-protein
response in vivo. Appl Environ Microbiol 2005, 71:2737-2747.
12. Maeda H, Sano M, Maruyama Y, Tanno T, Akao T, Totsuka Y, Endo
M, Sakurada R, Yamagata Y, Machida M, et al.: Transcriptional anal-
ysis of genes for energy catabolism and hydrolytic enzymes
in the filamentous fungus Aspergillus oryzae using cDNA
microarrays and expressed sequence tags. Appl Microbiol
Biotechnol 2004, 65:74-83.
13. Guo BZ, Yu J, Holbrook CC, Lee RD, Lynch RE: Application of dif-
ferential display RT-PCR and EST-microarray technologies
to the analysis of gene expression in response to drought
stress and elimination of aflatoxin contamination in corn and
peanut. J Toxicol 2003, 22:287-312.
14. Scheidegger KA, Payne GA: Unlocking the secrets behind sec-
ondary metabolism: a review of Aspergillus flavus from path-
ogenicity to functional genomics. J Toxicol 2003, 22:423-459.
15. OBrian GR, Fakhoury AM, Payne GA: Identification of genes dif-
ferentially expressed during aflatoxin biosynthesis in
Aspergillus flavus and Aspergillus parasiticus. Fungal Genet Biol
2003, 39:118-127.
16. Askenazi M, Driggers EM, Holtzman DA, Norman TC, Iverson S, Zim-
mer DP, Boers ME, Blomquist PR, Martinez EJ, Monreal AW, et al.:
Integrating transcriptional and metabolite profiles to direct
the engineering of lovastatin-producing fungal strains. Nat
Biotechnol 2003, 21:150-156.
17. Chambergo FS, Bonaccorsi ED, Ferreira AJ, Ramos AS, Ferreira Junior
JR, Abrahao-Neto J, Farah JP, El-Dorry H: Elucidation of the met-
abolic fate of glucose in the filamentous fungus Trichoderma
reesei using expressed sequence tag (EST) analysis and
cDNA microarrays. J Biol Chem 2002, 277:13983-13988.
18. DeRisi JL, Iyer VR, Brown PO: Exploring the metabolic and
genetic control of gene expression on a genomic scale. Sci-
ence 1997, 278:680-686.
19. Grotkjaer T, Winther O, Regenberg B, Nielsen J, Hansen LK: Robust
multi-scale clustering of large DNA microarray datasets
with the consensus algorithm. Bioinformatics 2006, 22:58-67.
20. David H, Akesson M, Nielsen J: Reconstruction of the central
carbon metabolism of Aspergillus niger. Eur J Biochem 2003,
270:4243-4253.
21. Forster J, Famili I, Fu P, Palsson BO, Nielsen J: Genome-scale
reconstruction of the Saccharomyces cerevisiae metabolic
network. Genome Res 2003, 13:244-253.
22. Sheik K, Forster J, Nielsen L: Modeling hybridoma cell metabo-
lism using a generic genome-scale metabolic model of Mus
musculus. Biotechnol Prog 2005, 21:112-121.
23. Patil KR, Nielsen J: Uncovering transcriptional regulation of
metabolism by using metabolic network topology. Proc Natl
Acad Sci USA 2005, 102:2685-2689.
24. Borodina I, Nielsen J: From genomes to in silico cells via meta-
bolic networks. Curr Opin Biotechnol 2005, 16:350-355.
25. CADRE - Central Aspergillus Data Repository [http://
www.cadre.man.ac.uk]
26. Westergaard SL, Oliveira AP, Bro C, Olsson L, Nielsen J: A systems
biology approach to study glucose repression in the yeast
Saccharomyces cerevisiae. Biotechnol Bioeng 2007, 96:
134-145.
27. Felenbok B, Flipphi M, Nikolaev I: Ethanol catabolism in Aspergil-
lus nidulans: a model system for studying gene regulation.
Prog Nucleic Acid Res Mol Biol 2001, 69:149-204.
28. Kulmburg P, Mathieu M, Dowzer C, Kelly J, Felenbok B: Specific
binding sites in the alcR and alcA promoters of the ethanol
regulon for the CREA repressor mediating carbon catabolite
repression in Aspergillus nidulans. Mol Microbiol 1993, 7:847-857.
29. Fillinger S, Felenbok B: A newly identified gene cluster in
Aspergillus nidulans comprises five novel genes localized in
the alc region that are controlled both by the specific
transactivator AlcR and the general carbon-catabolite
repressor CreA. Mol Microbiol 1996, 20:475-488.
30. Brock M, Fischer R, Linder D, Buckel W: Methylcitrate synthase
from Aspergillus nidulans: implications for propionate as an
antifugal agent. Mol Microbiol 2000, 35:961-973.
31. Adams IP, Dack S, Dickinson FM, Ratledge C: The distinctiveness
of ATP:citrate lyase from Aspergillus nidulans. Biochim Biophys
Acta 2002, 1597:36-41.
32. Wynn JP, Kendrick A, Hamid AA, Ratledge C: Malic enzyme: a
lipogenic enzyme in fungi. Biochem Soc Trans 1997, 25:S669.
33. Kelly JM, Hynes MJ: The regulation of phosphoenolpyruvate
carboxykinase and the NADP-linked malic enzyme in
Aspergillus nidulans. J Gen Microbiol 1981, 123:371-375.
34. Strauss J, Horvath HK, Abdallah BM, Kindermann J, Mach RL, Kubicek
CP: The function of CreA, the carbon catabolite repressor of
Aspergillus nidulans, is regulated at the transcriptional and
post-transcriptional level. Mol Microbiol 1999, 32:169-178.
35. Arst HN Jr, Cove DJ: Nitrogen metabolite repression in
Aspergillus nidulans. Mol Gen Genet
1973, 126:111-141.
36. Diallinas G, Gorfinkiel L, Arst HN Jr, Cecchetto G, Scazzocchio C:
Genetic and molecular characterization of a gene encoding
a wide specificity purine permease of Aspergillus nidulans
reveals a novel family of transporters conserved in prokary-
otes and eukaryotes. J Biol Chem 1995, 270:8610-8622.
37. Natorff R, Sienko M, Brzywczy J, Paszewski A: The Aspergillus nid-
ulans metR gene encodes a bZIP protein which activates
transcription of sulphur metabolism genes. Mol Microbiol 2003,
49:1081-1094.
38. de Vries RP, Flitter SJ, van de Vondervoort PJ, Chaveroche MK, Fon-
taine T, Fillinger S, Ruijter GJ, d'Enfert C, Visser J: Glycerol dehy-
drogenase, encoded by gldB is essential for osmotolerance in
Aspergillus nidulans. Mol Microbiol 2003, 49:131-141.
39. Noventa-Jordao MA, Couto RM, Goldman MH, Aguirre J, Iyer S, Cap-
lan A, Terenzi HF, Goldman GH: Catalase activity is necessary
for heat-shock recovery in Aspergillus nidulans germlings.
Microbiology 1999, 145:3229-3234.
40. Hallsworth JE, Prior BA, Nomura Y, Iwahara M, Timmis KN: Com-
patible solutes protect against chaotrope (ethanol)-induced,
nonosmotic water stress. Appl Environ Microbiol 2003,
69:7032-7034.
41. Singh M, Scrutton NS, Scrutton MC: NADPH generation in
Aspergillus nidulans: is the mannitol cycle involved? J Gen
Microbiol 1988, 134:643-654.
42. Beever RE, Laracy EP: Osmotic adjustment in the filamentous
fungus Aspergillus nidulans. J Bacteriol 1986, 168:1358-1365.
43. Han KH, Prade RA: Osmotic stress-coupled maintenance of
polar growth in Aspergillus nidulans. Mol Microbiol 2002,
43:1065-1078.
44. Furukawa K, Hoshi Y, Maeda T, Nakajima T, Abe K: Aspergillus nid-
ulans HOG pathway is activated only by two-component sig-
nalling pathway in response to osmotic stress. Mol Microbiol
2005, 56:1246-1261.
45. d'Enfert C, Fontaine T: Molecular characterization of the
Aspergillus nidulans treA gene encoding an acid trehalase
required for growth on trehalose. Mol Microbiol 1997,
24:203-216.
46. Fillinger S, Chaveroche MK, van Dijck P, de Vries R, Ruijter G, Theve-
lein J, d'Enfert C: Trehalose is required for the acquisition of
tolerance to a variety of stresses in the filamentous fungus
Aspergillus nidulans. Microbiology 2001, 147:1851-1862.
47. Borgia PT, Miao Y, Dodge CL: The orlA gene from Aspergillus nid-
ulans encodes a trehalose-6-phosphate phosphatase neces-
sary for normal growth and chitin synthesis at elevated
temperatures. Mol Microbiol 1996, 20:1287-1296.
48. d'Enfert C, Bonini BM, Zapella PD, Fontaine T, da Silva AM, Terenzi
HF: Neutral trehalases catalyse intracellular trehalose break-
down in the filamentous fungi Aspergillus nidulans and Neu-
rospora crassa. Mol Microbiol 1999, 32:471-483.
49. Kato N, Murakoshi Y, Kato M, Kobayashi T, Tsukagoshi N: Isomal-
tose formed by alpha-glucosidases triggers amylase induc-
tion in Aspergillus nidulans. Curr Genet 2002, 42:43-50.
50. Tani S, Itoh T, Kato M, Kobayashi T, Tsukagoshi N: In vivo and in
vitro analyses of the AmyR binding site of the Aspergillus nid-
ulans agdA promoter; requirement of the CGG direct repeat
for induction and high affinity binding of AmyR. Biosci Biotech-
nol Biochem 2001, 65:1568-1574.
51. Tani S, Katsuyama Y, Hayashi T, Suzuki H, Kato M, Gomi K, Kobayashi
T, Tsukagoshi N: Characterization of the amyR gene encoding
a transcriptional activator for the amylase genes in Aspergil-
lus nidulans. Curr Genet 2001, 39:10-15.
52. Regenberg B, Grotkjaer T, Winther O, Fausboll A, Akesson M, Bro
C, Hansen LK, Brunak S, Nielsen J: Growth-rate regulated genes
have profound impact on interpretation of transcriptome
R108.16 Genome Biology 2006, Volume 7, Issue 11, Article R108 David et al. />Genome Biology 2006, 7:R108
profiling in Saccharomyces cerevisiae. Genome Biol 2006,
14;7(11):R107.
53. Agger T, Petersen JB, O'Connor SM, Murphy RL, Kelly JM, Nielsen J:
Physiological characterisation of recombinant Aspergillus
nidulans strains with different creA genotypes expressing A.
oryzae alpha-amylase. J Biotechnol 2002, 92:279-285.
54. Fundamentals of growth, storage, genetics and microscopy
of Aspergillus nidulans [ />55. NimbleGen Systems, Inc. []
56. Affymetrix GeneChip
®
Expression Analysis Technical Man-
ual (2004) [ />expression_manual.affx]
57. Osterman A, Overbeek R: Missing genes in metabolic pathways:
a comparative genomics approach. Curr Opin Chem Biol 2003,
7:238-251.
58. NCBI - National Center for Biotechnology Inofrmation
[]
59. Irizarry RA, Hobbs B, Collin F, Beazer-Barclay YD, Antonellis KJ,
Scherf U, Speed TP: Exploration, normalization, and summa-
ries of high density oligonucleotide array probe level data.
Biostatistics 2003, 4:249-264.
60. Workman C, Jensen LJ, Jarmer H, Berka R, Gautier L, Nielser HB,
Saxild HH, Nielsen C, Brunak S, Knudsen S: A new non-linear nor-
malization method for reducing variability in DNA micro-
array experiments. Genome Biol 2002, 3:research0048.
61. Li C, Wong WH: Model-based analysis of oligonucleotide
arrays: expression index computation and outlier detection.
Proc Natl Acad Sci USA 2001, 98:31-36.
62. GEO - Gene Expression Omnibus [ />geo/]
63. Lemon WJ, Liyanarachchi S, You M: A high performance test of
differential gene expression for oligonucleotide arrays.
Genome Biol 2003, 4:R67.