Báo cáo y học: "Clustering of phosphorylation site recognition motifs can be exploited to predict the targets of cyclin-dependent kinase" potx
Bạn đang xem bản rút gọn của tài liệu. Xem và tải ngay bản đầy đủ của tài liệu tại đây (516.38 KB, 14 trang )
Genome Biology 2007, 8:R23
comment reviews reports deposited research refereed research interactions information
Open Access
2007Moseset al.Volume 8, Issue 2, Article R23
Method
Clustering of phosphorylation site recognition motifs can be
exploited to predict the targets of cyclin-dependent kinase
Alan M Moses, Jean-Karim Hériché and Richard Durbin
Address: Wellcome Trust Sanger Institute, Wellcome Trust Genome Campus, Hinxton, Cambridge, CB10 1HH, UK.
Correspondence: Alan M Moses. Email:
© 2007 Moses et al.; licensee BioMed Central Ltd.
This is an open access article distributed under the terms of the Creative Commons Attribution License ( which
permits unrestricted use, distribution, and reproduction in any medium, provided the original work is properly cited.
Cyclin-dependent kinase target prediction<p>A novel computational strategy is used to predict cyclin-dependent targets by exploiting their propensity for occurring in clusters on substrate proteins.</p>
Abstract
Protein kinases are critical to cellular signalling and post-translational gene regulation, but their
biological substrates are difficult to identify. We show that cyclin-dependent kinase (CDK)
consensus motifs are frequently clustered in CDK substrate proteins. Based on this, we introduce
a new computational strategy to predict the targets of CDKs and use it to identify new biologically
interesting candidates. Our data suggest that regulatory modules may exist in protein sequence as
clusters of short sequence motifs.
Background
Protein kinases are ubiquitous components of cellular signal-
ling networks [1]. A relatively well understood example is the
network that controls progression of the cell cycle, where cyc-
lin-dependent kinases (CDKs) couple with various cyclins
over the cell cycle to regulate critical processes [2-4]. Despite
their biological and medical importance, relatively few direct,
in vivo targets of these kinases have been identified conclu-
sively, because experimental techniques are difficult and time
consuming [1,5]. With the availability of databases of protein
sequences, computational methods provide an alternative
approach [6,7].
Kinase substrates often have short, degenerate sequence
motifs surrounding the phosphorylated residue [8]. Putative
target residues can be predicted by searching for matches to
the consensus for a particular kinase. For example, CDK sub-
strates often contain S/T-P-X-R/K where X represents any
amino acid, and S/T represents the phosphorylated serine or
threonine [9,10]. Because of the low specificity of the CDK
consensus, however, databases of protein sequences are
expected to contain large numbers of matches by chance.
Therefore, many of the matches in protein sequences are
likely to be false-positive predictions. Consistent with this,
when 553 Saccharomyces cerevisiae proteins with at least
one match to the CDK consensus were tested in a high-
throughput kinase assay, only 32% (178) were found to be
substrates [11]. Furthermore, in some cases characterized
CDK substrates are phosphorylated at residues matching only
a minimal consensus S/T-P [12]; considering these weak
matches would probably lead to even larger numbers of false
positives.
Characterized CDK targets may be phosphorylated at multi-
ple residues (for instance, see the report by Lees and cowork-
ers [13]). Recent studies of several CDK target proteins in S.
cerevisiae have shown that these multiple phosphorylations
can regulate stability [12], protein interaction [14,15], or
Published: 22 February 2007
Genome Biology 2007, 8:R23 (doi:10.1186/gb-2007-8-2-r23)
Received: 29 September 2006
Revised: 16 January 2007
Accepted: 22 February 2007
The electronic version of this article is the complete one and can be
found online at />R23.2 Genome Biology 2007, Volume 8, Issue 2, Article R23 Moses et al. />Genome Biology 2007, 8:R23
localization [16]. Motivated by these observations, we pro-
pose an alternative computational strategy to identify sub-
strates of CDKs; instead of attempting to predict individual
phosphorylation sites, we search for proteins that contain
high densities of strong and weak consensus matches that are
closely spaced in the primary amino acid sequence. (We refer
to this close spacing as 'clustering', and this should not be
confused with clustering of multivariate data.)
Taking advantage of the results of a high-throughput study
[11], we show statistically that CDK1 targets in S. cerevisiae
contain multiple closely spaced consensus matches and we
develop computational methods to identify such proteins. We
also find that these clusters tend to occur in disordered or
unfolded regions near the termini of the protein. We show
that it is possible to predict proteins that are likely to be tar-
gets of CDKs in S. cerevisiae by searching for proteins that
contain clustered matches to the CDK consensus. We also
show that human CDK targets are enriched for proteins that
contain clustered consensus matches and, by searching
human cell cycle genes, we predict several putative CDK tar-
gets, including the human orthologs of Schizosaccharomyces
pombe CDC5 (CDC5L) and S. cerevisiae Cdc20p (CDC20).
Finally, we examine co-clustering of the CDK consensus
motifs with the 'cy' or RXL motif [17], which is known to be
important in determining which CDK-cyclin complex will
phosphorylate a given substrate.
Results
Targets of Cdk1p in S. cerevisiae contain clusters of
matches to the CDK consensus
CDK substrates in S. cererevisiae are often phosphorylated at
multiple serine or threonine residues, some of which match
the full (henceforth 'strong') consensus S/T-P-X-R/K,
whereas others match a minimal (henceforth 'weak') consen-
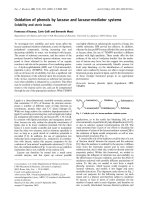
sus S/T-P. For example, the amino-terminal region of Cdc6p
(Figure 1b) is a direct target of Cdk1p (also known as Cdc28p)
[14], and contains three strong and one weak CDK consensus.
In order to test whether these observations could be used to
predict new substrates, we first compared the number of
matches of each motif per residue in a set of 12 Cdk1p targets
known from low-throughput biochemical and genetic experi-
ments (compiled by Ubersax and coworkers [11]; henceforth
referred to as 'known' targets; see Table 1 and Figure 1a) with
the number in the genome. We find a highly significant, more
than ninefold enrichment of the strong consensus (Figure 2a,
left side) but not for a scrambled version (P-R/K-X-S/T) of
the consensus (Figure 2a, right side), indicating that the
enrichment is not due to simple compositional effects. For the
weak consensus (after masking the strong consensus), we
also find enrichment over the genome and not for a scrambled
consensus (after masking the weak and strong consensus),
but it is less striking (less than twofold; Figure 2b).
Because we were concerned that the discovery of the known
targets may have been biased by the observation that they
contained many matches to the strong consensus, we also
computed these frequencies for the 18 proteins out of a set of
198 randomly chosen genes from S. cerevisiae identified as
Cdk1p targets in a high-throughput assay [11] (henceforth
referred to as 'unbiased positives'; see Table 1). We found
similar results in this unbiased positive set, although the
enrichment of strong matches was just under fourfold in this
case and the enrichment of weak matches was less than 1.5-
fold (Figure 2). That the fold enrichment is somewhat less in
this set is consistent with some of the enrichment in the
known set being due to bias in their discovery, but also with
some false-positive findings being picked up in the kinase
assay. Nevertheless, this rules out the possibility that the
enrichment of matches in bona fide CDK substrates is only
the result of a bias.
Examination of phosphorylated residues in CDK target pro-
teins reveals that they are often found 'clustered' in one region
of the primary amino acid sequence (Figure 1). We sought to
test whether this apparent clustering was due simply to a uni-
form overall enrichment of consensus matches in these pro-
teins, or whether it was a preference for the consensus
matches to occur near each other. We modeled the number of
residues until a strong or weak match was identified using a
bivariate geometric distribution (see Materials and methods,
below). We then performed a likelihood ratio test (LRT)
between the hypothesis (H
1
) that the spacings were drawn
Table 1
CDK target sets used in this study
Set Ascertainment Total Definition of target Positives
'Known' Unknown, complex 12 Low-throughput experimental characterization 12
'Unbiased' randomly chosen proteins 198 Score > 2 in high-throughput assay 18
'2+' All S. cerevisiae proteins containing two or more matches to the 'strong' CDK
consensus
385 Score > 2 in high-throughput assay 143
'1cc' All S. cerevisiae proteins containing one match to the 'strong' CDK consensus and
exhibiting cell cycle regulated transcription
137 Score > 2 in high-throughput assay 32
Four cyclin-dependent kinase (CDK) target sets from Saccharomyces cerevisiae [11]. Note that only the high-throughput data contain 'negatives'. The 'strong' CDK consensus is
S/T-P-X-R/K, where X represents any amino acid.
Genome Biology 2007, Volume 8, Issue 2, Article R23 Moses et al. R23.3
comment reviews reports refereed researchdeposited research interactions information
Genome Biology 2007, 8:R23
from a mixture of a high-density 'cluster' component and a
low-density 'background' component, and the hypothesis
(H
0
) that the spacings were simply the result of a single uni-
form density component (Figure 3). In order to compare
these models, we maximized the likelihood under each hypo-
thesis using expectation-maximization (EM) [18] (see Mate-
rials and methods, below) and computed the likelihood ratio
statistic:
Where data represents the observed spacings and corre-
sponding (strong or weak) consensus matches. Because H
0
corresponds to the case of H
1
with the parameters of the two
components constrained to be equal, we expect the LRT sta-
tistic (Λ) to be χ
2
distributed with three degrees of freedom
(see Materials and methods, below).
We therefore computed the P values for the LRT on the
known targets, the set of 'unbiased positives', the remaining
randomly chosen proteins that were found not to be targets of
Cdk1p in the assay [11] (henceforth referred to as 'unbiased
negatives'; see Table 1), and the 'known' targets using the
scrambled consensus sequences (Table 2). Consistent with
Clustering of consensus motifs in S. cerevisiae CDK targetsFigure 1
Clustering of consensus motifs in S. cerevisiae CDK targets. (a) Schematics of characterized S. cerevisiae CDK targets. Blue and green symbols indicate
matches to the strong and weak CDK consensus, respectively. The thick black bar below indicates the characterized cy motif in Orc6. The double lines
above indicate characterized nuclear localization signals. (b) Sequence of the amino-terminus of Cdc6. Blue and green boxes indicate matches to the
strong and weak CDK consensus, respectively. Bold letters indicate the region with the maximal scoring cluster according to S
BN
. We suggest that this
region may be regarded as a regulatory module (see text for details). Thick bars below the sequence indicate matches to the 'cy' motif and thin double
lines above the sequence indicate characterized nuclear localization signals. aa, amino acid; CDK, cyclin-dependent kinase.
Cdh1p
Orc2p
Sld2p
Swi5p
Orc6p
Cdc6p
Pds1p
Sic1p
Far1p
Gin4p
Cln2p
Swe1p
100 aa
MSAIPI
TPTKRIRRNLFDDAPATPPRPLKRKKLQFTDVTPESSPEKLQFGS
(a)
(b)
Λ=
⎡
⎣
⎢
⎤
⎦
⎥
2
1
0
log
(|)
(|)
,
pdata H
pdata H
R23.4 Genome Biology 2007, Volume 8, Issue 2, Article R23 Moses et al. />Genome Biology 2007, 8:R23
the model that bona fide targets contain clusters of consensus
matches, rather than a simple overall enrichment, we could
reject the overall enrichment hypothesis in the first two tests
(P = 1.2 × 10
-9
and P = 1.6 × 10
-4
, respectively), but not in the
latter two negative controls (P = 0.13 and P = 0.15, respec-
tively; see Table 2).
Methods to detect clustering in individual proteins
Having established statistical enrichment and tendency for
consensus matches to cluster in the primary sequence of bona
fide CDK targets, we developed a method to predict CDK tar-
gets based on these properties. For each protein, we sought to
compare the likelihood of the observed matches and spacings
given the genome frequencies (H
bg
) with the likelihood under
a two-component model (H
c
), in which one component is the
background genome model and the other is high-frequency
'cluster' component whose parameters are estimated from the
protein of interest. This suggests ranking genes according to
the following:
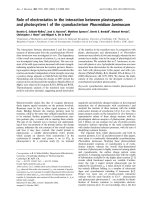
Enrichment of matches to the CDK consensus in CDK substratesFigure 2
Enrichment of matches to the CDK consensus in CDK substrates. (a) The protein sequences of well characterized ('known') CDK targets (gray bars) are
highly enriched for matches to the CDK strong consensus relative to the genome (black bars) but not for a scrambled version of the consensus. Similar
results hold for the 'unbiased positives' from a high-throughput study (unfilled bars). (b) 'Known' and 'unbiased positives' are also somewhat enriched for
the weak consensus but not for a scrambled version of it. See text for details. Frequencies are number of matches per 1000 amino acid (aa) residues. Error
bars represent plus or minus two times the standard error. CDK, cyclin dependent kinase.
0
2
4
6
8
10
12
14
0
1
2
3
4
5
6
7
8
9
10
Frequency of motif
(matches per 1000 aa)
Strong CDK Scrambled
Known
Genome
Unbiased
Weak CDK Scrambled
(S/T-P) (P-S/T)
(S/T-P-X-R/K) (P-R/K-X-S/T)
(b)(a)
Modeling the distribution of spacing distances between matches to the CDK consensusFigure 3
Modeling the distribution of spacing distances between matches to the
CDK consensus. Fit of one (black trace) or two multivariate geometric
components (blue and red traces) to the observed spacings (thin black
trace) in the 'known' targets. The 'known' targets exhibit an excess of
short spacings over what would be expected under the single geometric.
The inset shows the geometric fit (black trace) to the spacings observed
(thin black trace) in the 'unbiased negatives' and shows much better
agreement. See text for details. CDK, cyclin-dependent kinase.
0
0.01
0.02
0.03
0.04
0.05
0.06
020406080100
Length (aa)
Probability
0
0.01
0.02
0.03
0.04
020406080100
S
pdata H
pdata H
c
bg
=
⎡
⎣
⎢
⎢
⎤
⎦
⎥
⎥
log
(|)
(|)
Genome Biology 2007, Volume 8, Issue 2, Article R23 Moses et al. R23.5
comment reviews reports refereed researchdeposited research interactions information
Genome Biology 2007, 8:R23
Because the weak CDK consensus matches the specificity of
any proline-directed kinase, we were concerned that some of
our predictions would not be specific to CDKs. In order to rule
out these cases, we defined a 'nonspecific' model (H
ns
) as
above, except that the frequency of strong matches in the
high-frequency 'cluster' component was constrained to be
less than or equal to the background genome frequency. We
optimized the likelihood under each of these models for each
protein (see Materials and methods, below) and ranked them
by a classifier assuming uniform 'priors' over the various
models:
This will assign lower scores to proteins that have clusters of
only weak consensus matches. Cdc6p (Figure 1a), for exam-
ple, has S
LR
= 7.28, and ranks 22
nd
in the genome.
Identifying optimal clusters
The mixture models we have employed thus far do not
assume that the closely spaced matches fall in a single contig-
uous region of the primary sequence. We considered this
appropriate because residues may be adjacent in the struc-
ture of the protein but not in the primary sequence. Neverthe-
less, we were also interested in identifying the continuous
subregions of proteins that contain high densities of matches,
such as the amino-terminal domain of Cdc6p (Figure 1b). We
therefore also developed a method to identify the most signif-
icant 'cluster' of matches within each protein. While S
LR
(described above) measures 'clustering' in the whole protein,
this method allows identification of a single optimal 'cluster'.
This represents an alternate strategy to predict proteins that
contain clusters of consensus matches - by explicitly identify-
ing the clusters. We note that this does assume that the clus-
tered matches occur in a contiguous region, and therefore, for
example, in the case of Cdc6p (Figure 1a) the carboxyl-termi-
nal matches would not contribute to the score.
To find optimal clusters, we counted the number of matches
(n) to the strong (s) or weak (w) consensus in each possible
subregion of the protein of length l. We then computed the
probability of observing as many matches or more of each
type using the binomial distribution, and combined these P
values by multiplying them together by assigning a P value to
their product using the Q-fast algorithm [19]. We note that
the subregion with the maximal score will begin and end with
a match. There are therefore only N(N - 1)/2 possible clusters
to try, where N (= n
s
+ n
w
) is the total number of matches in
the entire protein. This means that proteins with many
matches have more chances to obtain a high scoring cluster.
We therefore correct for the total number of clusters searched
by multiplying the P value by this factor (a Bonferoni multiple
testing correction). Thus, we define the following:
where Q [ ] is the Q-fast algorithm, p(≥ x | l, f) is the binomial
probability of observing x or more in l tries when the per try
probability is f, and f
sb
and f
wb
are the per residue probabilities
of observing strong and weak matches, respectively, in the
genome. Once again we were concerned about the possibility
of nonspecific clusters and therefore, when using S
BN
to pre-
dict CDK targets, we imposed the following heuristic; to be
considered, subregions must contain at least one match to the
strong consensus per 100 residues. For example, in the case
of Cdc6p, this optimal cluster corresponds to the amino-ter-
minal domain (Figure 1b, bold residues) and has S
BN
= 8.38,
ranking 61st in the genome.
Assessing the classifiers
In order to assess whether these classifiers were capturing
useful information about the recognition of substrates by
CDKs, we computed the scores described above for each pro-
tein in S. cerevisiae and compared them to the 'phosphoryla-
tion scores' reported for the 695 S. cerevisiae proteins tested
in the high-throughput Cdk1p assay [11] (Table 1). These pro-
teins tested in that study fall into three groups: 198 randomly
chosen proteins (containing the 'unbiased positives' and
'unbiased negatives' described above, henceforth referred to
as 'unbiased'), all 385 S. cerevisiae proteins that contain two
or more matches to the strong CDK consensus (henceforth
'2+'), and finally 137 proteins that contain one match to the
Table 2
Likelihood ratio tests for spatial clustering of CDK consensus matches
Number H
0
(f
s
, f
w
)H
1
(f
1s
, f
1w
) (f
2s
, f
2w
) Λ P value
'Known' 12 6.72, 10.8 25.1, 34.3; 2.66, 5.66 44.4 1.2 × 10
-9
'Unbiased positives' 18 2.81, 8.51 19.8, 31.6; 1.53, 6.77 20.2 1.6 × 10
-4
'Unbiased negatives' 173 0.67, 6.68 2.93, 47.7; 0.65, 6.34 5.58 0.13
'Known,' scrambled 12 0.96, 6.04 4.60, 10.2; 0.00, 4.48 5.21 0.15
Comparison of a one-component versus two-component mixture of multivariate geometric distributions in different protein sets. Maximum
likelihood parameter estimates (in matches per 1,000 residues) under the two hypotheses are indicated by f. See text for descriptions of parameters.
Λ indicates the likelihood ratio test statistic, which is expected to be χ
2
distributed with three degrees of freedom. P values are computed under that
assumption. Seven low-confidence open reading frames were removed from the 'unbiased negatives', although similar results are obtained if they are
included. CDK, cyclin-dependent kinase.
S
pdata H
pdata H pdata H
LR
c
bg ns
=
+
⎡
⎣
⎢
⎢
⎤
⎦
⎥
⎥
log
(|)
(|)(|)
S
NN
Qp n lf p n lf
BN s sb w wb
=−
−
×≥ ×≥
[]
⎡
⎣
⎢
⎤
⎦
⎥
log
()
(|,)( |,),
1
2
R23.6 Genome Biology 2007, Volume 8, Issue 2, Article R23 Moses et al. />Genome Biology 2007, 8:R23
strong consensus, and exhibit cell cycle transcript regulation
(henceforth '1cc'). We note that although the last two groups
were biased in different ways, as long as we treat them sepa-
rately (condition on the bias) the proteins in each group can
be treated as identical and independently distributed.
In the 'unbiased' and '2+' groups, we found a highly signifi-
cant correlation (R > 0.3, P < 10
-10
) between the phosphoryla-
tion score in the assay and both of the cluster-based scores
described above (Table 3), such that proteins with higher
scoring cluster are more likely to have high scores in the
kinase assay.
Because in many cases we noted that the clusters seemed to
occur near the carboxyl- or amino-terminus of the proteins
(as in the case of the Cdc6p amino-terminal domain; Figure
1), we computed the relative 'position' of the optimal cluster,
where 0.5 is the midpoint of the protein and 0 is either termi-
nus (see Materials and methods, below). Interestingly, we
found that the position was negatively correlated (R < -0.2, P
< 0.01), with the results of the kinase assay in the same two
groups of targets, such that proteins with clusters near their
termini were more likely to be positive in the assay. It has also
been noted that phosphorylation sites tend to fall in disor-
dered or unfolded regions of proteins [20]. Consistent with
this, we found a significant correlation (R ≤ -0.19, P < 0.01)
between the 'foldedness' [21,22] of the cluster and the score in
the kinase assay, such that proteins containing clusters of
matches in unfolded regions were more likely to be bona fide
substrates. In order to verify that these factors were inde-
pendently correlated with the results of the assay (and not
simply correlated with each other), we fit linear models of the
likelihood ratio score, position and 'foldedness', and found
that they all contributed significantly (P < 0.02; Table 3).
Predicting CDK substrates based on clustering of
consensus matches
The correlations we observed suggested that clustering of
consensus matches could be used to predict the targets of
Cdk1p in S. cerevisiae. Taking proteins defined as CDK tar-
gets or not in the high-throughput assay [11] as positives and
negatives, we computed receiver operating characteristic
(ROC) curves for the three groups of proteins tested in the
assay.
First, we compared the two classifiers described above to sim-
ply classifying based on the density of strong CDK matches in
the protein. We found that although all were strong classifiers
in the 'unbiased' set, the cluster-based methods performed
better than a simple density (Figure 4a). In the low false-pos-
itive range, which is of most relevance to protein database
searches, the score based on the likelihood ratio (S
LR
) seemed
most effective. We also compared the methods on the '2+' set
and found similar results (data not shown). We therefore
used S
LR
for subsequent analyses.
We next compared the predictive power of the cluster-based
classifier (S
LR
) with that of a specificity matrix-based
approach (Scansite [23]), and used the score of the best match
to the Cdc2 matrix in each protein (see Materials and meth-
ods, below) as the predictor. Both our cluster-based method
and the specificity matrix-based method were strong classifi-
ers for the 'unbiased' set (Figure 4b); since most of these pro-
teins contain no matches, many of the negatives can be ruled
out simply based on the absence of a match to the consensus.
For the '1cc' proteins, neither method has much power (Fig-
ure 4d). For the '2+' set (Figure 4c), however, we notice a con-
siderable increase in sensitivity and specificity in the low
false-positive region by using our cluster score. In the '2+'
group, at false-positive levels near 5%, the matrix-based
Table 3
Correlation between cluster score and position and phosphorylation in the kinase assay
Correlation (P value)
'Unbiased' '2+' '1cc'
S
LR
0.54 (4.21 × 10
-14
) 0.34 (1.50 × 10
-11
)0.03 (NS)
S
BN
0.56 (< 2 × 10
-16
) 0.33 (3.03 × 10
-11
) 0.27 (0.0019)
Pos -0.26 (0.00299) -0.23 (5.7 × 10
-06
) -0.02 (NS)
Foldedness -0.24 (0.00564) -0.19 (0.000137) -0.25 (0.00555)
Density 0.43 (2.62 × 10
-10
) 0.18 (0.00049) 0.05 (NS)
S
LR
+ pos 0.52 (0.00818) 0.37 (0.000552) (NS)
S
LR
+ pos + foldedness 0.51 (0.0160) 0.39 (0.00150) (NS)
We calculated the Pearson correlation between the results of the kinase assay and either likelihood ratio score (S
LR
), the minimal product of
binomial probabilities (S
BN
), the minimum distance from the either edge of the optimal cluster (identified using S
BN
) to the closest terminus (pos), the
'foldedness' of the optimal cluster, or simply the density of strong matches per residue (density). To calculate P values we used the generalized linear
models implemented in R [57]. In addition, we fit linear models to combine the S
LR
score with the position and foldedness of the cluster (S
LR
+ pos
and S
LR
+ pos + foldedness). When the variables did not all contribute significantly, we report NS (not significant). For the other sets, the P values are
for the addition of the least significant term to the model. The total numbers of proteins in each set are slightly smaller than that reported [11]
because since the time of that study proteins have been removed from the database and because scores cannot be computed for each gene for each
method.
Genome Biology 2007, Volume 8, Issue 2, Article R23 Moses et al. R23.7
comment reviews reports refereed researchdeposited research interactions information
Genome Biology 2007, 8:R23
ROC curves for prediction of CDK substrate proteinsFigure 4
ROC curves for prediction of CDK substrate proteins. (a) Comparison of classifiers suggests that cluster based methods S
LR
and S
BN
(filled squares and
triangles, respectively) perform better than the density of strong matches (filled circles). (b-d) comparison of cluster-based method S
LR
(filled squares) with
Scansite, a matrix-based method (unfilled squares). See text for details. Plotted is the fraction of positives versus the fraction of negatives passing as the
threshold is varied in the three datasets a, b ('unbiased' proteins, which were randomly chosen), c ('2+' proteins, which contain two or more matches to
the strong CDK consensus), and d ('1cc' proteins containing one match to the strong CDK consensus and whose transcripts exhibit cell-cycle regulation).
Note that the unlike conventional ROC curves, we plot the false-positive rate on a log scale, such that the expectation for a random predictor no longer
falls on the diagonal. The expectation for a random predictor is indicated in each panel by the dotted trace. CDK, cyclin-dependent kinase; ROC, receiver
operating characteristic.
0.001 0.01 0.1 1
0
0.1
0.2
0.3
0.4
0.5
0.6
0.7
0.8
0.9
1
0.001 0.01 0.1 1
(a)
True positive rate
S
LR
S
BN
Dens
y=x
S
LR
Scansite
y=x
0
0.1
0.2
0.3
0.4
0.5
0.6
0.7
0.8
0.9
1
0.001 0.01 0.1 1
S
LR
Scansite
y=x
0
0.1
0.2
0.3
0.4
0.5
0.6
0.7
0.8
0.9
1
0.001 0.01 0.1 1
False positive rate
(c)
S
LR
Scansite
y=x
(b)
(d)
R23.8 Genome Biology 2007, Volume 8, Issue 2, Article R23 Moses et al. />Genome Biology 2007, 8:R23
method performs similar to a random classifier, whereas the
cluster-based method retains some power. Because each of
these proteins has multiple matches to the consensus, most
have high matrix match scores. The proteins in which there
are multiple matches that are spatially clustered, however,
are more likely to be bona fide substrates for Cdk1p. We note
that even in this set the overall predictive power is still rela-
tively poor.
An important feature of these cluster based methods is that
we can include weak matches to the consensus in our predic-
tor. We found, however, that classifiers based on clustering
only of strong matches also performed well (data not shown).
In order to confirm that the weak matches were contributing
to the clusters, we identified optimal clusters based only on
the strong matches using a univariate version of the method
described above (S
BN
). We then compared the density of weak
matches in these regions with the density of the scrambled
weak consensus. We found enrichment of 2.1-fold and 1.4-
fold in the 'known' targets and assay positives (all groups
combined), as compared with 1.2-fold in the negatives (all
groups combined; Figure 5), indicating that weak matches are
preferentially associated with clusters of strong matches. The
size of these effects is not great, however, and therefore weak
matches may not contribute much to the classification of indi-
vidual proteins. Nevertheless, this supports the use of both
the strong and weak consensus matches in this case, and is
consistent with previous reports that weak sites can be impor-
Our aim here was not to explore the properties of these clas-
sifiers in detail, but rather to establish the potential of meth-
ods that take advantage of the propensity of the CDK motifs
to cluster (see Discussion, below).
Defining a set of proteins containing clusters of CDK
consensus sequences
Taken together, these results suggest that not all Cdk1p tar-
gets in S. cerevisiae contain clusters of consensus matches,
but that there is some subset that can be predicted in this way.
In order to estimate the number of CDK consensus cluster
containing proteins that can be recognized based on sequence
alone, we searched the genome for matches to scrambled ver-
sions of the strong and weak CDK consensus (P-R/K-X-S/T
and P-S/T, respectively) and compared the distribution of
likelihood ratio scores with those obtained using the real con-
sensus sequences. Comparison of these distributions suggests
a score threshold of 3.5 (Figure 6). This yields an excess of 50
proteins, because there are 67 proteins above the threshold
when the real consensus sequences are used, and 17 when
scrambled consensus sequences are used.
Of these 67 top predictions (ranked based only on sequence),
49 were positive in the kinase assay [11] (all groups com-
bined). This indicates at this threshold our cluster-based
method yields a positive predictive value (PPV) of 73%, but it
includes 18 false positives. Compared with the PPV of 49%
(17/35) for the proteins identified by the matrix-based
approach (Scansite [23]) at the same false-positive level, our
cluster-based approach has significantly greater PPV (P =
0.017, by Fisher's exact test), which is consistent with the
hypothesis that searching for clusters can strongly identify at
Weak CDK consensus matches co-cluster with strong matchesFigure 5
Weak CDK consensus matches co-cluster with strong matches. Gray and
unfilled bars indicate frequencies of matches to the weak CDK consensus
and to a scrambled version of it within regions identified as optimal
clusters based on only strong matches. 'Known' are well characterized
CDK substrates, and 'positives' and 'negatives' are proteins scoring greater
than and less than 2 in a high-throughput kinase assay, respectively. See
text for details. Frequencies are number of matches per 1,000 amino acid
(aa) residues. Error bars represent plus or minus two times the standard
error. CDK, cyclin-dependent kinase.
0
5
10
15
20
25
30
weak site S/T-P
scrambled P-S/T
Weak CDK (S/T-P)
Scrambled (P-S/T)
Frequency of motif
(matches per 1,000 aa)
Known Positives Negatives
Defining a set of CDK consensus cluster containing proteinsFigure 6
Defining a set of CDK consensus cluster containing proteins. Comparison
of the distribution of scores from a search of the S. cerevisiae genome using
either the real CDK consensus motifs (gray area) or scrambled versions
(unfilled area) suggests a threshold of 3.5 (dotted line). CDK, cyclin-
dependent kinase.
1
10
100
1.5 3.5 5.5 7.5 9.5 11.5
Real
Scrambled
S
LR
Number of proteins
Genome Biology 2007, Volume 8, Issue 2, Article R23 Moses et al. R23.9
comment reviews reports refereed researchdeposited research interactions information
Genome Biology 2007, 8:R23
least some subset of CDK targets. In order to examine further
the properties of the clustered matches in these proteins, we
identified the maximal scoring cluster using the method
described above (S
BN
). Consistent with our earlier observa-
tions, we found that for 36% (24/67) of these proteins the
optimal cluster ended within 5% of the protein's length from
either terminus, and that even if we masked the CDK
matches, the optimal clusters were on average significantly
less 'folded' that the whole proteins (-0.08 versus -0.0002,
respectively; P < 0.001, by Students' t-test).
Predicting CDK targets among human proteins
Regulation of cell cycle progression by CDKs is thought to be
an ancient feature of eukaryotic cells. Indeed, human CDK
homologs were first identified based on their ability to rescue
yeast mutants [24,25]. We therefore sought to test whether
clustering of consensus matches could also be used to predict
CDK targets in humans.
We found 73 human proteins (see Materials and methods,
below) that were listed as CDK, CDK1, or CDK2 targets in the
phosphoELM database [26]. Although we do not have a set of
negative proteins (as for S. cerevisiae), we can still compute
an ROC curve by using the fraction of the genome above the
threshold as an approximate false-positive rate. In doing so
we assume that the fraction of proteins that are targets in the
genome is negligible compared with the total number of pro-
teins. This analysis (Figure 7a) suggests that our method has
some predictive power at reasonably low false-positive levels;
some subset of human CDK targets may also contain clusters
of consensus matches and may therefore be predicted using
our method.
To predict novel human CDK targets, we obtained a set of 112
human cell cycle genes (see Materials and methods) and iden-
tified those containing clustered consensus matches. Of the
six proteins in this set with clusters scoring 3.5 or greater
(Figure 7b), none were included in the 73 CDK targets in
phosphoELM. Of these, BRCA2 was recently shown to be a
CDK target [27]. Of the other five, there is already evidence
that three (RANBP2, CDC20, and CDC5L) are mitotic phos-
phoproteins, and there are varying degrees of evidence that
they are bona fide CDK targets [28-30]. The other two
(CDCA5/sororin and TPX2) are both degraded by the ana-
phase-promoting complex through direct interaction with K-
E-N motifs [31,32]. Interestingly, these K-E-N motifs are
found among closely spaced CDK consensus matches in these
proteins (Figure 7c,d). It is tempting to speculate that their
anaphase promoting complex-dependent degradation is reg-
ulated through phosphorylation by CDKs, as has been sug-
gested for human CDC6 [33], and that these clusters
represent regulatory modules (see Discussion, below).
Regardless, that these human cell cycle proteins contain clus-
ters of CDK consensus sequences, and that there is some evi-
dence for CDK phophorylation for four of the six, suggests
that cluster-based methods can be used to predict CDK tar-
gets among human proteins as well.
Clusters of consensus matches and cyclin specificity
CDKs are thought to gain target specificity by pairing with
particular cyclins. For example, Cdc6p was found to be a spe-
cific target of Cdk1p:Clb5p [34] and contains cyclin specific
'cy' motifs (R/K-X-L [17]) in addition to CDK motifs (Figure
1b, filled bars). We noted that of 14 Cdk1p:Clb5p specific tar-
gets identified in a recent study [34], 72% (10) where among
our strongest S. cerevisiae predictions (S
LR
> 3.5). Because, of
the 143 proteins tested in that study, only 29% (42) were
included in this set (S
LR
> 3.5), 72% represents a highly signif-
icant enrichment (P < 0.001, Fisher's exact test; Figure 8a,
left side). Interestingly, we also found that the clb5 specific
proteins above our cutoff contained a higher proportion of
strong matches to the CDK consensus; the clb5 specific clus-
ters contained 43 strong and 18 weak matches (70% strong),
which is significantly more than in the clusters in the rest of
the proteins above the cutoff, where we find 217 strong and
Predicting CDK targets in the human genomeFigure 7
Predicting CDK targets in the human genome. (a) The fraction of proteins
in known human CDK targets versus the fraction in the human genome
(black bar) as the cutoff is varied. (b) Genes with clusters scoring more
than 3.5 from a list of human cell-cycle genes. See text for details. (c,d)
The K-E-N box (black underline) degradation signals in TPX2 (panel c) and
Sororin (panel d) are found among clustered consensus matches. The
entire optimal clusters are not shown. Strong and weak consensus
matches are indicated by black and grey boxes, respectively. The regions
of the protein shown are indicated in parentheses. CDK, cyclin-dependent
kinase.
0
0.1
0.2
0.3
0.4
0.5
0.6
0.7
0.8
0.9
1
0.01 0.1 1
(a)
Protein S
LR
(c)
S
LR
y=x
Fraction of CDK targets
Fraction of genome
RANBP2 14.36
CDC5L 13.25
CDC20 8.05
TPX2 4.52
CDCA5 4.52
BRCA2 4.46
CDCA5/Sororin (75-117)
SPRRSPRISFFLEKENEPPGRELTKEDLFKTHSVPATPTSTP
TPX2 (59-190)
TPLRKANLQQAIVTPLKPVDNTYY
KEAEKENLVEQSIPSNACSS
LEVEAAISRKTPAQPQRRSLRLSAQKDLEQKEKHHVKMKAKRCA
TPVIIDEILPSKKMKVSNNKKKPEEEGSAHQDTAEKNASSPEK
(d)
(b)
R23.10 Genome Biology 2007, Volume 8, Issue 2, Article R23 Moses et al. />Genome Biology 2007, 8:R23
343 weak (39% strong; P < 0.001, by Fisher's exact test; Fig-
ure 8a, right side). We speculate that this may be related to
the lower overall activity of the Cdk1p-Clb5p complex [34].
In order to test directly whether 'cy' motifs were associated
with the CDK clusters, we masked out the matches to the CDK
consensus and compared the frequency of matches to the cy
motif in the clb5 specific proteins with the frequency in the
rest of the proteins above the cutoff (Figure 8b). Although the
frequency of cy motifs in the entire proteins was significantly
greater in the clb5-specific targets than in the other proteins
(Figure 8b, left side; P = 0.014, by Fisher's exact test), the dif-
ference was greater and more significant when we considered
only the regions identified as optimal clusters (Figure 8b,
right side; P < 0.001, by Fisher's exact test). Futhermore, we
note that the regions defined as the optimal clusters in the
proteins that were not clb5 specific contain fewer matches to
this motif than expected based on the genome frequency, per-
haps related to the paucity of leucine residues near
phosphorylation sites [20]. These findings suggest that cy
motifs tend to cluster with CDK motifs in clb5 specific targets.
Thus, it may be possible to associate cyclin specificity with a
specific composition of motifs, analogous to the 'regulatory
codes' that have been proposed for some enhancers of tran-
scription [35] (see Discussion, below).
Discussion
We divide the discussion into two sections, the first address-
ing biologic considerations and the second methodology.
Biology
Several characterized CDK target proteins have multiple con-
sensus phosphorylation sites, often restricted to particular
regions of the protein. We confirmed that known S. cerevisiae
CDK targets are statistically enriched for CDK consensus
matches (Figure 2) and that these are closely spaced (clus-
tered) in the linear sequence of these proteins (Figure 3 and
Table 2). We showed that spatial clustering is significantly
associated with bona fide CDK substrate proteins in S. cere-
visiae (Table 3) and human (Figure 7a), and a search of
human cell cycle genes suggested several plausible CDK tar-
gets, some of which already have various degrees of support-
ing evidence (Figure 7b).
Noncoding regulatory DNA elements, such as enhancers (or
cis-regulatory modules), often contain clusters of binding
sites for transcription factors [36,37], and computational
methods have been developed to exploit this [38]. In analogy,
we suggest that the regions of proteins containing the clusters
of CDK consensus matches may be regarded as phospho-reg-
ulatory modules. As with cis-regulatory modules, they may
contain additional regulatory elements, such as the phospho-
rylation sites of other kinases, localization and degradation
signals, and other protein recognition motifs. For example,
the amino-terminal domain of S. cerevisiae Cdc6 (Figure 1b)
contains a cluster of CDK consensus matches, as well as a
nuclear localization signal [39].
As an illustration of a potential mechanistic basis for this
model, consider the case of clusters of phosphorylation sites
Clustering of CDK consensus matches and cyclin specificityFigure 8
Clustering of CDK consensus matches and cyclin specificity. (a) The left side shows that clb5-specific CDK targets (unfilled bar) are more likely to score
above the cutoff than other proteins assayed (gray bar), while the right side of panel a shows that clb5-specific CDK targets (unfilled bar) contain a higher
proportion of strong matches than do other high-scoring proteins (gray bar). See text for details (b) CDK targets specific for clb5 (unfilled bars) contain
an excess of matches to the cy motif relative to other high-scoring proteins (gray bars) in the entire protein sequence (left side), but this enrichment is
more extreme if only regions containing clustered CDK consensus matches are considered (right side). The dotted line represents the genomic frequency
of matches to the cy motif. CDK, cyclin-dependent kinase; aa, amino acids.
0
5
10
15
20
25
30
other
Clb5 specific
0
0.1
0.2
0.3
0.4
0.5
0.6
0.7
0.8
Strong matchesS
LR
> 3.5
Fraction
Frequency of cy motif
(matches per 1,000 aa)
Whole proteins Clusters
other
All tested
other
Other S
LR
> 3.5
Other S
LR
> 3.5
Genome
(a) (b)
Clb5 specific
Genome Biology 2007, Volume 8, Issue 2, Article R23 Moses et al. R23.11
comment reviews reports refereed researchdeposited research interactions information
Genome Biology 2007, 8:R23
proximal to nuclear localization signals (NLSs). Nuclear
import is often mediated through the interaction of importins
(or karyopherins) with NLSs, which are basic, hydrophilic
motifs [40]. The addition of multiple bulky, negatively
charged phosphates proximal to these motifs have the poten-
tial inhibit their function; indeed, several examples of such
inhibitory phosphorylation of nuclear localization signals
have been described (for review, see Jans and Hubner [40]),
including inhibition of the SV40 and Swi5p NLSs by phos-
phorylation of partially overlapping or proximal consensus
sites by CDKs [41,42] (Figure 1a). We suggest that such local
interactions between motifs may be a general mechanism by
which regulatory specificity can be achieved.
Additionally, characterized cy motifs, such as the cy motif in
Orc6p [43], often occur in proximity to clusters of phosphor-
ylation sites (Figure 1a). We showed that the clusters of CDK
matches in clb5-specific CDK targets contained a higher frac-
tion of strong CDK consensus matches and an excess of cy
motifs (Figure 8). These observations are consistent with the
lower activity of this CDK-cyclin combination [34] and its
known dependence on the cy motif for substrate recognition
[10]. Although the cy motif is known to interact directly with
cyclin, it is not mechanistically obvious why multiple copies of
this motif would be proximal to the CDK sites in the linear
amino acid sequence. Nevertheless, as has been suggested for
control of transcriptional regulation [35], we suggest that
these features form a regulatory 'grammar' or 'code' that pro-
duces a specific pattern of activity. To test this model further
we also examined the order of strong and weak sites in the
clusters, but we found no striking patterns (data not shown).
We suggest that as more data become available, and compu-
tational methods for the prediction of short protein motifs
continue to improve, it will be possible to identify
increasingly specific combinations of motifs associated with
particular patterns of regulation.
It is also important to note that there are additional possible
biological explanations for the large numbers of CDK consen-
sus matches, such as precise control of regulatory thresholds
[12] or highly cooperative binding [44], and that because
there are many determinants of kinase-substrate specificity,
clustering of regulatory motifs cannot be expected to reveal
all (or any) of the substrates of a particular kinase. The gen-
eral utility of the methods proposed here will depend on the
specific biology of each regulatory system.
Indeed, it is perhaps surprising that the proximity of features
of the primary amino acid sequence are predictive at all,
because these may not be reflected by the three-dimensional
structure of the protein. Interestingly, we found that the
clusters of CDK matches tend to fall in relatively disordered
regions and near the termini of target proteins (Table 2); per-
haps in these regions spatial proximity in the primary
sequence is more reflective of proximity in vivo. We suggest
that this is also consistent with the hypothesis of combinato-
rial regulation at these regions through multiple motifs; the
regions containing these clusters must be accessible to multi-
ple regulatory proteins, and therefore perhaps tend to be flex-
ible, solvent-exposed regions, rather than highly structured
domains.
Methodology
One of the main limitations of this simplistic approach to pre-
dicting CDK substrates is that we cannot distinguish between
targets of Cdk1p paired with other cyclins, other CDKs, or
other regulatory proteins with similar specificity. This means
that even our 'false positive' predictions may contain interest-
ing biologic information despite failing to show phosphoryla-
tion by Cdk1p-Clb2p in the kinase assay. For example, among
the 67 proteins that we predicted to be CDK targets in S. cer-
evisiae, 18 were not found to be targets in the high-thoughput
assay [11]. Included in these, we find CDK-cln substrates
Ste20p and Whi5p [45,46], as well as Cdc14p phosphatase
substrates Sli15p and Cdc15p [47]. These examples further
demonstrate that CDK consensus clusters often point to func-
tionally important interactions; identifying sequence features
that distinguish these different types of interactions is an area
for further research.
Despite its simplicity, spatial clustering represents a poten-
tially powerful new method for computationally identifying a
subset of CDK targets. Unlike current methods, which predict
individual phosphorylation sites, the statistical methods we
have developed identify proteins that exhibit clustering of
matches to the CDK consensus. In addition, cluster-based
methods can incorporate weak matches to the consensus, and
we showed that weak sites tend to co-cluster with strong sites
in bona fide CDK substrates. Although we have not evaluated
whether our method will be applicable to other systems, the
methods we have described search for patterns of matches
that deviate from a random (geometric) expectation. They
can therefore be applied to searches for clusters of any highly
degenerate sequence elements, without the need to specify a
window size. We suggest, however, that as more is under-
stood about the specific properties of clusters of protein
motifs, it will be possible to use more powerful statistical
methods to search for particular patterns and combinations
of motifs.
A further possible application of spatial clustering of consen-
sus motifs is to identify the functionally important residues in
CDK targets. For example, in Cdc6p (Figure 1), the 'clustered'
matches correspond to the amino-terminal domain, which is
phosphorylated and bound directly by CDKs [14]. In long pro-
teins where there are large numbers of consensus matches,
we speculate that those in clusters are more likely to represent
the critical phosphorylation sites. Finally, we suggest that
cluster-based methods could be used in combination with the
sophisticated specificity-based methods that are currently
widely used [6], or combined with other evidence, such as
structural properties [20], mass spectrometry data [48], or
R23.12 Genome Biology 2007, Volume 8, Issue 2, Article R23 Moses et al. />Genome Biology 2007, 8:R23
evolutionary conservation [49]. Indeed, given the availability
of genome sequences, comparative analysis of CDK clustering
should yield insights into the evolution of post-translational
regulation.
Materials and methods
Genes and proteins
For S. cerevisiae, we obtained the protein translations from
SGD [50]. For human, for each gene in Ensembl [51] (release
36i) we took the longest translation, which yielded 22,217
genes.
We obtained the human CDK targets from the phosphoELM
database [26] by parsing the webpage CDK, CDK1, or CDK2
to obtain uniprot IDs and then looking these up in Ensembl.
Thus, the 73 CDK targets may not include all of the CDK tar-
gets in phosphoELM. A list of 112 human genes with
described cell cycle phenotypes in human cells was obtained
from the Mitocheck database [52]. The 73 known human CDK
targets and 112 human cell cycle genes are available in Addi-
tional data file 1.
Multivariate geometric models
For a given protein sequence, we imagine counting the resi-
dues after we see a match until we observe another match to
the consensus. Once one is observed, we record the number of
residues and the type of match (strong or weak) that was
observed. We denote the match as a vector X, such that a
strong match is represented as X = (1,0) and a weak match as
(0,1). If matches occur independently, then the probability of
any particular match is given by the following.
Where m indexes the types of matches (strong or weak), f
m
is
the per residue probability of observing a match of type m,
is the probability of any match, and l is the total
number of residues observed. We note that this defines a mul-
tivariate geometric distribution and we can use the geometric
series ( ) to show the following:
This, as expected, is f
s
/(f
s
+ f
w
) or f
w
/(f
s
+ f
w
), for a strong or
weak match, respectively. The distribution of spacings, on the
other hand, is given by another geometric distribution:
In order to test the hypothesis that the matches are clustered
relative to what would be expected under a single frequency
for each class of match, we defined a two-component mixture
of multivariate geometric distributions, such that:
where f
1
and f
2
are the parameters for the two components,
ϕ
1
and
ϕ
2
are their sums, and
π
is a mixing parameter or prior
probability on which component will be observed. The likeli-
hood of the data under this model is simply the product of
terms of this form over all of the observed matches and spac-
ings. In order to obtain maximum likelihood estimates of
these parameters, we derived EM [18] update equations as
follows. The expected complete log-likelihood of the data is:
Where i indexes the observation, c indexes the two compo-
nents, angled brackets indicate expectations, and Z
ci
is an
unobserved indicator variable that denotes - for each
observed match and spacing - which component of the mix-
ture it was drawn from. The maximization step entails setting
the derivatives with respect to the parameters to zero, under
the constraint that . This yields the following:
where N is the total number of matches in the dataset respec-
tively. At the expectation step we use Bayes' theorem to calcu-
late the following, using the estimates of the parameters (f,
π
)
from the previous iteration:
We used an implementation of this algorithm to maximize the
likelihood and obtain estimates of the parameters. For a set of
input matches (characterized by spacing, l
i
, and type, X
i
) at
convergence, the algorithm produces a set of maximum
likelihood estimates of the parameters (f,
π
) with which we
compute the maximum value of the likelihood. In order to
verify that the EM optimization was reliably finding the max-
imum in the likelihood (it is only guaranteed to give a local
maximum), we re-ran the fit using five random sets of initial
parameters.
In practice, protein sequences deviate from these geometric
models in that they do not in general end with a match to the
motif. In order to account correctly for the remaining resi-
pXl f
l
m
X
m
m
(,)( ) ,=−
−
∏
1
1
ϕ
ϕ
=
∑
f
m
m
r
r
k
k=
∞
∑
=
−
0
1
1
pX pXl f
l
m
X
m
m
() (,)==
=
∞
∑
∏
1
1
ϕ
pl pXl f
X
l
m
m
l
() ( ,) ( ) ( )==−=−
∑∑
−−
11
11
ϕϕϕ
pXl f f
l
m
X
m
l
m
X
m
mm
(,) ( ) ( )( ) ,
=− +− −
−−
∏∏
πϕ π ϕ
111
1
1
12
1
2
log ( | , ) ( ) ( )pdata f Z l X f
ci
ci
ci c micm
m
ππϕ
[]
=+−−+
⎡
∑∑∑
log log log11
⎣⎣
⎢
⎢
⎤
⎦
⎥
⎥
π
c
c
=
∑
1
f
ZX
Zl N
Z
cm
ci mi
i
ci i
i
cci
i
==
∑
∑
∑
and
π
1
,
ZpZ Xl
pX l f
pX l f
ci ci i i
ciic
diid
d
== =
∑
(|,)
(,|)
(,|)
,1
π
π
Genome Biology 2007, Volume 8, Issue 2, Article R23 Moses et al. R23.13
comment reviews reports refereed researchdeposited research interactions information
Genome Biology 2007, 8:R23
dues after the final match, we combine them with the residues
before the first match. This also ensures that a given set of
matches has the same probability regardless of where it
occurs in the protein (relative to the start). Another technical
issue with the application of geometric models to proteins is
that the decision to begin 'counting' the residues from the
amino-terminus or 'left' end is arbitrary; we could equally
well have started from the carboxyl-terminus or 'right' end.
We confirmed that this makes little difference; counting from
'right' to 'left' gave qualitatively very similar results.
To use these geometric models for hypothesis testing we pro-
ceed as follows. The single-component multivariate geomet-
ric has two parameters (the densities of strong and weak
matches, f), whereas the two-component mixture has five
(two sets of densities, f
1
and f
2
, and a mixing parameter
π
). We
note that these models are nested; the single-component
model (H
0
) is a two-component mixture where the parame-
ters for the two components are constrained to be equal (f
1
=
f
2
). Because the likelihood in the single-component case (H
0
)
is independent of the mixing parameter,
π
, there is a three-
parameter difference between the two hypotheses. We there-
fore expect the distribution of the likelihood ratio statistic to
be χ
2
with three degrees of freedom [53]. To verify that the
distribution of the likelihood ratio statistic was indeed χ
2
with
three degrees of freedom, we randomly permuted the
positions of the consensus matches in the 'known' set 100
times, and computed the likelihood ratio statistic for the
comparison of the two models; we found reasonable agree-
ment with expectation (data not shown).
We compute S
LR
for each protein as follows. For each protein,
we obtain the set of matches (their positions and type, strong
or weak) and compute the likelihood under the following: H
bg
(assuming the matches were randomly drawn from the
genome frequencies); H
c
(fitting the mixture using the EM
algorithm described above, but keeping the background com-
ponent set to the genome frequencies); or H
ns
(as for H
c
, but
additionally constraining the frequency of strong matches in
the cluster component to be less than or equal to the back-
ground frequency). We combine these likelihoods as is given
in Results (above). As before, we run the EM with five random
starting points for each protein.
Position and foldedness of maximal cluster
We identified the optimal cluster using S
BN
as described
above. To compute the position of the cluster, we calculated
the distance between the start of the protein and the start of
the cluster, and between the end of the cluster and the end of
the protein. We then took the minimum of these divided by
the length of the protein to be the position. We computed the
foldedness as I
f
= 2.785 × H - |R| - 1.51 [21,22], where H is the
average hydropathy [54] per residue and |R| is the absolute
value of the charge (at pH 7.0) per residue in the cluster.
Scansite searches
We submitted the yeast protein sequences to the batch Scan-
site [55] using low stringency, which yielded 12,134 Cdc2
matches in 4,048 of the 5,889 yeast proteins. We then took
the best (lowest score) for each of those proteins.
Additional data files
The following additional data are available with the online
version of this paper. Additional data file 1 contains the S. cer-
evisiae proteins with S
LR
above 3.5, and the human CDK tar-
gets and cell-cycle proteins with associated S
LR
scores. Scripts
to calculate S
LR
and S
BN
are available on AMM's website [56].
Additional data file 1S. cerevisiae proteins with S
LR
> 3.5, and the human CDK targets and cell cycle proteins with associated S
LR
scoresThis document contains the Saccharomyces cerevisiae proteins with S
LR
greater than 3.5, and the human CDK targets and cell cycle proteins with associated S
LR
scores.Click here for file
Acknowledgements
We gratefully acknowledge Dr David Morgan for providing data and for
stimulating discussions. We thank Dr José Jimenéz for discussions and
assistance with online resources, Dr Seth Grant for interesting discussions,
Dr Noboru Komiyama for help with protein unfolding, and Dr Avril Cogh-
lan for helpful comments on the manuscript. This work was supported by
a Sanger Institute Postdoctoral Fellowship to AMM. RD and the Wellcome
Trust Sanger Institute are supported by the Wellcome Trust.
References
1. Johnson SA, Hunter T: Kinomics: methods for deciphering the
kinome. Nat Methods 2005, 2:17-25.
2. Norbury CJ, Nurse P: Control of the higher eukaryote cell cycle
by p34cdc2 homologues. Biochim Biophys Acta 1989, 989:85-95.
3. Nasmyth K: Control of the yeast cell cycle by the Cdc28 pro-
tein kinase. Curr Opin Cell Biol 1993, 5:166-179.
4. Murray AW: Cyclin-dependent kinases: regulators of the cell
cycle and more. Chem Biol 1994, 1:191-195.
5. Manning BD, Cantley LC: Hitting the target: emerging technol-
ogies in the search for kinase substrates. Sci STKE 2002,
2002:PE49.
6. Blom N, Sicheritz-Ponten T, Gupta R, Gammeltoft S, Brunak S: Pre-
diction of post-translational glycosylation and phosphoryla-
tion of proteins from the amino acid sequence. Proteomics
2004, 4:1633-1649.
7. Kobe B, Kampmann T, Forwood JK, Listwan P, Brinkworth RI: Sub-
strate specificity of protein kinases and computational pre-
diction of substrates. Biochim Biophys Acta 2005, 1754:200-209.
8. Kreegipuu A, Blom N, Brunak S, Jarv J: Statistical analysis of pro-
tein kinase specificity determinants. FEBS Lett 1998, 430:45-50.
9. Songyang Z, Blechner S, Hoagland N, Hoekstra MF, Piwnica-Worms
H, Cantley LC: Use of an oriented peptide library to determine
the optimal substrates of protein kinases. Curr Biol 1994,
4:973-982.
10. Endicott JA, Noble ME, Tucker JA: Cyclin-dependent kinases:
inhibition and substrate recognition. Curr Opin Struct Biol 1999,
9:738-744.
11. Ubersax JA, Woodbury EL, Quang PN, Paraz M, Blethrow JD, Shah K,
Shokat KM, Morgan DO: Targets of the cyclin-dependent kinase
Cdk1. Nature 2003, 425:859-864.
12. Nash P, Tang X, Orlicky S, Chen Q, Gertler FB, Mendenhall MD,
Sicheri F, Pawson T, Tyers M: Multisite phosphorylation of a
CDK inhibitor sets a threshold for the onset of DNA
replication. Nature 2001, 414:514-521.
13. Lees JA, Buchkovich KJ, Marshak DR, Anderson CW, Harlow E: The
retinoblastoma protein is phosphorylated on multiple sites
by human cdc2. EMBO J 1991, 10:4279-4290.
14. Mimura S, Seki T, Tanaka S, Diffley JF: Phosphorylation-depend-
ent binding of mitotic cyclins to Cdc6 contributes to DNA
replication control. Nature 2004, 431:1118-1123.
15. Tak YS, Tanaka Y, Endo S, Kamimura Y, Araki H: A CDK-catalysed
regulatory phosphorylation for formation of the DNA repli-
cation complex Sld2-Dpb11. EMBO J 2006, 25:1987-1996.
16. Liku ME, Nguyen VQ, Rosales AW, Irie K, Li JJ: CDK phosphoryla-
R23.14 Genome Biology 2007, Volume 8, Issue 2, Article R23 Moses et al. />Genome Biology 2007, 8:R23
tion of a novel NLS-NES module distributed between two
subunits of the Mcm2-7 complex prevents chromosomal
rereplication. Mol Biol Cell 2005, 16:5026-5039.
17. Adams PD, Sellers WR, Sharma SK, Wu AD, Nalin CM, Kaelin WG
Jr: Identification of a cyclin-cdk2 recognition motif present in
substrates and p21-like cyclin-dependent kinase inhibitors.
Mol Cell Biol 1996, 16:6623-6633.
18. Durbin R, Eddy S, Krogh A, Mitchison G: Biological Sequence Analysis:
Probabilistic Models of Proteins and Nucleic Acids Cambridge: Cambridge
University Press; 1998.
19. Bailey TL, Gribskov M: Combining evidence using p values:
application to sequence homology searches. Bioinformatics
1998, 14:48-54.
20. Iakoucheva LM, Radivojac P, Brown CJ, O'Connor TR, Sikes JG, Obra-
dovic Z, Dunker AK: The importance of intrinsic disorder for
protein phosphorylation. Nucleic Acids Res 2004, 32:1037-1049.
21. Uversky VN, Gillespie JR, Fink AL: Why are 'natively unfolded'
proteins unstructured under physiologic conditions? Proteins
2000, 41:415-427.
22. Prilusky J, Felder CE, Zeev-Ben-Mordehai T, Rydberg EH, Man O,
Beckmann JS, Silman I, Sussman JL: FoldIndex: a simple tool to
predict whether a given protein sequence is intrinsically
unfolded. Bioinformatics 2005, 21:3435-3438.
23. Yaffe MB, Leparc GG, Lai J, Obata T, Volinia S, Cantley LC: A motif-
based profile scanning approach for genome-wide prediction
of signaling pathways. Nat Biotechnol 2001, 19:348-353.
24. Lee MG, Nurse P: Complementation used to clone a human
homologue of the fission yeast cell cycle control gene cdc2.
Nature 1987, 327:31-35.
25. Elledge SJ, Spottswood MR: A new human p34 protein kinase,
CDK2, identified by complementation of a cdc28 mutation
in Saccharomyces cerevisiae, is a homolog of Xenopus Eg1.
EMBO J 1991,
10:2653-2659.
26. Puntervoll P, Linding R, Gemund C, Chabanis-Davidson S, Mattingsdal
M, Cameron S, Martin DM, Ausiello G, Brannetti B, Costantini , et al.:
ELM server: a new resource for investigating short functional
sites in modular eukaryotic proteins. Nucleic Acids Res 2003,
31:3625-3630.
27. Esashi F, Christ N, Gannon J, Liu Y, Hunt T, Jasin M, West SC: CDK-
dependent phosphorylation of BRCA2 as a regulatory mech-
anism for recombinational repair. Nature 2005, 434:598-604.
28. Favreau C, Worman HJ, Wozniak RW, Frappier T, Courvalin JC: Cell
cycle-dependent phosphorylation of nucleoporins and
nuclear pore membrane protein Gp210. Biochemistry 1996,
35:8035-8044.
29. Stukenberg PT, Lustig KD, McGarry TJ, King RW, Kuang J, Kirschner
MW: Systematic identification of mitotic phosphoproteins.
Curr Biol 1997, 7:338-348.
30. D'Angiolella V, Mari C, Nocera D, Rametti L, Grieco D: The spindle
checkpoint requires cyclin-dependent kinase activity. Genes
Dev 2003, 17:2520-2525.
31. Rankin S, Ayad NG, Kirschner MW: Sororin, a substrate of the
anaphase-promoting complex, is required for sister chroma-
tid cohesion in vertebrates. Mol Cell 2005, 18:185-200.
32. Stewart S, Fang G: Anaphase-promoting complex/cyclosome
controls the stability of TPX2 during mitotic exit. Mol Cell Biol
2005, 25:10516-10527.
33. Mailand N, Diffley JF: CDKs promote DNA replication origin
licensing in human cells by protecting Cdc6 from APC/C-
dependent proteolysis. Cell 2005, 122:915-926.
34. Loog M, Morgan DO: Cyclin specificity in the phosphorylation
of cyclin-dependent kinase substrates. Nature 2005,
434:104-108.
35. Ochoa-Espinosa A, Small S: Developmental mechanisms and cis-
regulatory codes. Curr Opin Genet Dev 2006, 16:165-170.
36. Small S, Blair A, Levine M: Regulation of even-skipped stripe 2 in
the
Drosophila embryo. EMBO J 1992, 11:4047-4057.
37. Levine M, Davidson EH: Gene regulatory networks for
development. Proc Natl Acad Sci USA 2005, 102:4936-4942.
38. Markstein M, Levine M: Decoding cis-regulatory DNAs in the
Drosophila genome. Curr Opin Genet Dev 2002, 12:601-606.
39. Luo KQ, Elsasser S, Chang DC, Campbell JL: Regulation of the
localization and stability of Cdc6 in living yeast cells. Biochem
Biophys Res Commun 2003, 306:851-859.
40. Jans DA, Hubner S: Regulation of protein transport to the
nucleus: central role of phosphorylation. Physiol Rev 1996,
76:651-685.
41. Jans DA, Ackermann MJ, Bischoff JR, Beach DH, Peters R: p34cdc2-
mediated phosphorylation at T124 inhibits nuclear import of
SV-40 T antigen proteins. J Cell Biol 1991, 115:1203-1212.
42. Moll T, Tebb G, Surana U, Robitsch H, Nasmyth K: The role of
phosphorylation and the CDC28 protein kinase in cell cycle-
regulated nuclear import of the S. cerevisiae transcription
factor SWI5. Cell 1991, 66:743-758.
43. Wilmes GM, Archambault V, Austin RJ, Jacobson MD, Bell SP, Cross
FR: Interaction of the S-phase cyclin Clb5 with an 'RXL' dock-
ing sequence in the initiator protein Orc6 provides an origin-
localized replication control switch. Genes Dev 2004,
18:981-991.
44. Lenz P, Swain PS: An entropic mechanism to generate highly
cooperative and specific binding from protein
phosphorylations. Curr Biol 2006, 16:2150-2155.
45. Oehlen LJ, Cross FR: Potential regulation of Ste20 function by
the Cln1-Cdc28 and Cln2-Cdc28 cyclin-dependent protein
kinases. J Biol Chem 1998, 273:25089-25097.
46. Costanzo M, Nishikawa JL, Tang X, Millman JS, Schub O, Breitkreuz
K, Dewar D, Rupes I, Andrews B, Tyers M: CDK activity antago-
nizes Whi5, an inhibitor of G1/S transcription in yeast. Cell
2004, 117:899-913.
47. D'Amours D, Amon A: At the interface between signaling and
executing anaphase: Cdc14 and the FEAR network. Genes Dev
2004, 18:2581-2595.
48. Peng J, Gygi SP: Proteomics: the move to mixtures. J Mass
Spectrom 2001, 36:1083-1091.
49. Budovskaya YV, Stephan JS, Deminoff SJ, Herman PK: An evolution-
ary proteomics approach identifies substrates of the cAMP-
dependent protein kinase. Proc Natl Acad Sci USA 2005,
102:13933-13938.
50. Cherry JM, Adler C, Ball C, Chervitz SA, Dwight SS, Hester ET, Jia Y,
Juvik G, Roe T, Schroeder M, Weng S, Botstein D: SGD: Saccharo-
myces Genome Database. Nucleic Acids Res 1998, 26:73-80.
51. Hubbard T, Barker D, Birney E, Cameron G, Chen Y, Clark L, Cox T,
Cuff J, Curwen V, Down T: The Ensembl genome database
project. Nucleic Acids Res 2002, 30:38-41.
52. MitoCheck [ />53. Mardia KV, Kent JT, Bibby JM: Multivariate Analysis London: Academic
Press; 1979.
54. Kyte J, Doolittle RF: A simple method for displaying the hydro-
pathic character of a protein. J Mol Biol 1982, 157:105-132.
55. Obenauer JC, Cantley LC, Yaffe MB: Scansite 2.0: proteome-wide
prediction of cell signaling interactions using short sequence
motifs. Nucleic Acids Res 2003, 31:3635-3641.
56. Alan Moses' Research [ />57. Ihaka R, Gentleman R: R: a language for data analysis and
graphics. J Comput Graph Stat 1996, 5:299-314.