check point ng vpn 1 firewall 1 advanced configuration and troubleshooting phần 10 docx
Bạn đang xem bản rút gọn của tài liệu. Xem và tải ngay bản đầy đủ của tài liệu tại đây (883.03 KB, 64 trang )
UserAuthority • Chapter 14 545
Q: Where can I install UserAuthority Server?
A: UserAuthority Server can be installed on Check Point FireWall-1 enforcement
modules and/or it can be installed on Windows domain controllers (Windows 2000
or NT 4).
Q: Where can I install the WebAccess module?
A: The WebAccess module can be installed on multiple Microsoft IIS version 4 or ver-
sion 5 Web servers.There is a beta version of the WebAccess module for the
Apache Web server on Linux.
Q: Where can I install the UserAuthority SecureAgent?
A: The UserAuthority SecureAgent can be installed on the desktop PC of your users
who authenticate to your windows domain (where the domain controller has the
UserAuthority Server installed).
Q: Why can’t I see the WebAccess tab in the SmartDashboard GUI?
A: This is not enabled by default.You need to click Policy | Global Properties |
Smart Dashboard Customization. At the bottom of the window is a check box
for Display Web Access view, which needs to be checked.
Q: How do I install a policy to the WebAccess module? It does not show up when I
attempt to install the FireWall-1 Security policy or if I try to install the User
Database.
A: You can only install the WebAccess policy from the WebAccess tab screen in the
SmartDashboard GUI. Right-click the WebSites icon and then select Install.You
can install to a specific WebAccess module only if you right-click the specific
object and click Install.
Q: When I configure SSO to a WebAccess module and log in using the SecureAgent
on a desktop host and authenticate against the PDC, then use a browser to access
www.syngress.com
Frequently Asked Questions
The following Frequently Asked Questions, answered by the authors of this book, are
designed to both measure your understanding of the concepts presented in this chapter
and to assist you with real-life implementation of these concepts. To have your questions
about this chapter answered by the author, browse to www.syngress.com/solutions and
click on the “Ask the Author” form.
259_Chkpt_VPN_14.qxd 4/3/03 1:39 PM Page 545
546 Chapter 14 • UserAuthority
the WebAccess server, the WebAccess server fails to identify my user ID. Why? My
WebAccess server does not identify my user ID, although I’m sure I have
UserAuthority working correctly on my domain controller and firewall. What
could be the problem?
A: A common cause of this problem is that the connection to the WebAccess server is
being address-translated—either by the firewall module or by another host between
yourself and the WebAccess server. Using a proxy to access the Web server will have
a similar effect.You need to avoid NAT and proxying on the connections to the
WebAccess server. If you must use a proxy, WAM can interpret an HTTP header
that identifies the original source IP address of the client, if your proxy supports that.
Q: Can I use SecureClient as a remote user and achieve SSO?
A: Yes. When you authenticate using SecureClient, you will register with the UAS on
the firewall enforcement module that your secure client module authenticated
against, and then the WebAccess server can query the module to see if you have
authenticated (or if not, the firewall module you authenticated against can use
chaining to query other firewall modules).
Q: We have personal firewalls on our internal PCs. Will this cause a problem for UA
SecureAgent?
A: Yes. SecureAgent must be able to receive queries from the domain controller UAS,
UDP port 19194.Your personal firewall must be configurable to allow this traffic.
Note that Check Point SecureClient version 4.1 cannot be configured to this level
of granularity, so it is not suitable for use with SecureAgent if the SecureClient
policy is blocking incoming connections to the client. SecureClient NG allows
finely granular polices so is fully compatible.
Q: We are running a gateway cluster. Can we run UAS on the cluster members?
A: Yes, UAS can be run on a cluster. However, the cluster mechanism will not syn-
chronize the UACM databases between the members. Check Point supplies a utility
called db_sync that will update cluster members.The synchronization must be
scheduled manually by the administrator.
www.syngress.com
259_Chkpt_VPN_14.qxd 4/3/03 1:39 PM Page 546
Firewall
Troubleshooting
Solutions in this chapter:
■
SmartView Tracker
■
SmartView Monitor
■
Using fw monitor
■
Other Tools
Chapter 15
547
; Summary
; Solutions Fast Track
; Frequently Asked Questions
259_ChkPt_VPN_15.qxd 4/3/03 1:41 PM Page 547
548 Chapter 15 • Firewall Troubleshooting
Introduction
Traffic is not flowing, the phone is ringing, and you are scrambling to figure out why.
As the administrator of your firewall, you have a large selection of tools at your disposal.
There are also a number of tools that you should have close in the event of trouble.
SmartView Monitor, SmartView Tracker, a local network sniffer—you should know
how to use all of the tools possible to ensure you can troubleshoot the problems that
you will no doubt face. We review the Check Point tools and some third-party tools
that we recommend that you have in your arsenal.
Check Point has provided the SmartView Tracker so that you can view the traffic as
it flows through the firewall.This should be the first line of troubleshooting your fire-
wall. SmartView Monitor allows you to view interfaces and links in real time.
Immediate traffic flow analysis is available to determine how the system is functioning.
Along with these tools, Check Point provides command-line utilities that expose the
FireWall-1 Kernel statistics, VPN and encryption, and other performance metrics.
Check Point also has other tools that will allow the more technical personnel to
perform fw monitor functions. Fw monitor is a command-line facility that allows you to
analyze the traffic flowing through your firewall on a systematic basis. We review the
best methods of using this utility, and how it can provide insight as to where your fire-
wall may not be functioning as you expect.
SmartView Tracker
Typically the first thing you’ll want to do when analyzing firewall behavior is to log in
to the SmartView Tracker and watch the traffic as it flows through your firewall.This
tool is installed along with the other Check Point SMART Clients on an NG FP3
Windows workstation or server by default. If you are running a pre-FP3 management
module, this same tool will be named Log Viewer.
The FP3 SmartView Tracker provides a new view into the FireWall-1 logs, with
three modes accessible via tabs (Log, Active, and Audit).As shown in Figure 15.1, you
also have several options in a drop-down menu format within each view for cus-
tomizing and searching the log records that are displayed.The nicest feature about the
FP3 interface is the modular views, where you can have multiple instances of the logs
open within the Tracker frame by selecting File | Open In New Window and
selecting the filename you wish to open.
Filtering Traffic
You can make certain selections within the SmartView Tracker to limit the log records
viewable, which can help you to isolate certain traffic and more effectively troubleshoot
your firewall.There are a number of predefined selection criteria that you can choose
www.syngress.com
259_ChkPt_VPN_15.qxd 4/3/03 1:41 PM Page 548
www.syngress.com
from in the menu display on the left.The default is to show All Records, but you can
also choose to view only FireWall-1, VPN-1, or FloodGate-1 traffic for instance by
simply right-clicking on the name and choosing Open.You can determine exactly
what is being filtered by looking for a green icon next to the column where the filter
is applied. For example, the FireWall-1 predefined filter sets the Product column to
SmartDefense and VPN-1 & FireWall-1 only; the VPN-1 filter sets the Encryption
Scheme column to IKE and FWZ; and the FloodGate-1 filter sets the Product column
to FloodGate-1 only.
If you would prefer to create your own filters, each of the columns in the frame
that displays the logs has a filter option, which you can activate by simply right-clicking
on the column and selecting Edit Filter. See Figure 15.2 for an example of the service
filter window in which we have selected SMTP as the protocol we hope to scan for in
the logs.To do this, follow these steps:
1. Log in to SmartView Tracker.
2. Ensure that All Records are displayed.
3. Right-click on the column labeled Service and choose Edit Filter.
4. Type in smtp in the selection window on the right-hand side, or scroll down
to the service you wish to choose in the list.
5. Click Add.You can add as many services as you want to see in the logs to
this window.
6. Click OK.
Firewall Troubleshooting • Chapter 15 549
Figure 15.1 SmartView Tracker Log View
259_ChkPt_VPN_15.qxd 4/3/03 1:41 PM Page 549
550 Chapter 15 • Firewall Troubleshooting
To remove a filter, simply right-click on the column and choose Clear Filter.You
can configure multiple filters and search for all SMTP from a specific source address
that was dropped also.You can then save the filters you have created as a “Custom” filter
and then load them again anytime. Use the Query menu to save customer filters and to
perform other filter operations.
Active and Audit Logs
The other tabs available to you in the SmartView Tracker are the Active and Audit logs.
The Active view shows you any active connections in your firewall(s) in real-time.The
Audit view shows you what the firewall administrators are doing, such as who logs into
the various Smart Clients and when, as well as any changes they may make while
logged in with write permission. If something suddenly stops working one day, and you
have others administering the policy, it might be a good idea to see if any changes were
made that correspond to the outage in service.The Audit view will give you such detail
as the color of an object that was changed, or new objects that were created, a policy
was installed, and so on.You can set up filters in both the Active and Audit logs the
same way you did it in the Log view.
www.syngress.com
Figure 15.2 SmartView Tracker Service Filter
GUI Administrators
It is best to use individual admin usernames instead of a generic username like
fwadmin. The problem with using a generic login ID is that you cannot prop-
erly audit the activities of the firewall administrators. It may be important for
you to know who installed the last security policy when you are trou-
bleshooting a problem. This becomes more and more important when there
are several people administering a firewall system.
It is also important to limit the activities of your administrators to only
those functions that they will need. You may not want to give an entry-level
Tools & Traps…
Continued
259_ChkPt_VPN_15.qxd 4/3/03 1:41 PM Page 550
Firewall Troubleshooting • Chapter 15 551
SmartView Monitor
SmartView Monitor is included free with all SmartCenter Pro licenses. With this
product you can receive up-to-the-minute information about your firewalls and net-
works due to status alerts, security threat alerts, and defense capabilities monitored and
reported in SmartView. In addition, SmartView Monitor can assist in long-term deci-
sion making and policy planning due to data mining, trending, and detailed analytical
tools included in SmartView.
In order to view real-time monitor data from your FP3 SmartCenter, you will need
to install the SmartView Monitor on your firewall modules, and check the box labeled
SmartView Monitor in the Check Point products list for the relevant Check Point
objects defined through SmartDashboard, and then install the security policy.You will
also require an additional license for monitoring and reporting per module if you are
not running a SmartCenter Pro. SmartView Monitor (a.k.a. Real-Time Monitoring) is
very useful for environments where troubleshooting through the firewall is common,
and SmartView Monitor can be used in lieu of other monitoring software, thereby
saving money.
Log in to the SmartView Monitor from the SMART Clients menu, and you will be
presented with a screen similar to the one shown in Figure 15.3. In this screen, you will
need to select the type of session you wish to start.You can select only one firewall or
interface to monitor at a time.You are also able to record a session and play it back later.
sys admin write access to the security policy if he will only need to managed
network objects and users. FireWall-1 is very flexible in the permissions you
can customize for each administrator, so take advantage of it.
Figure 15.3 Session Type
www.syngress.com
259_ChkPt_VPN_15.qxd 4/3/03 1:41 PM Page 551
552 Chapter 15 • Firewall Troubleshooting
The other tabs listed will depend on your selections on the Session Type tab. If you
choose Real-Time for the Session Mode, you will be able to monitor Check Point
System Counters, Traffic, or a Virtual Link. From the Settings tab, you can control
the monitor rate, which is set to 2 seconds by default, and you can choose between a
line or bar graph.You may also have the options to choose the type of measurement by
Data Transfer Rate, Packets per Second, Line Utilization (%), Percent,or
Milliseconds, and to set the scale for the graphs that you are viewing.These choices
are shown in Figure 15.4.
Monitoring Check Point System Counters
Check Point System Counters allow you to monitor and report on system resources
and other statistics for your enforcement points. Figure 15.5 shows a monitoring session
on a cluster that measures the size of the connection table in FireWall-1.This data can
be very valuable for analyzing the traffic at your site.You could possibly identify a
problem if you see the connections reaching the maximum of 25,000 at any time,
which will give you the opportunity to increase that value to better fit the needs of
your connection.
There are a number of counters categories for you to choose from in the Counters
tab in your SmartView Monitor properties window. Choose Basic: FireWall-1 from
the pull-down menu to monitor the number of active connections as shown in Figure
15.5.You could also choose to monitor dropped, rejected, and/or accepted packets,
memory and cpu, encryption parameters, security servers, and FloodGate-1 traffic.You
don’t have to choose just one setting to monitor either; you can select as many counters
www.syngress.com
Figure 15.4 Session Properties Settings
259_ChkPt_VPN_15.qxd 4/3/03 1:41 PM Page 552
Firewall Troubleshooting • Chapter 15 553
as you wish and each one will be displayed on the same graph with a different line
color. Don’t get too carried away though, or you won’t be able to read the output.
Monitoring Traffic
Using the SmartView Monitor to monitor traffic is another way to view the statistics
on your firewall. When choosing Session Type, select Traffic by: and then select from
services, Network Objects (IPs), QoS Rules, or Top Firewall Rules. If you take
the default, services, the Monitor by Services tab will be available in the SmartView
Monitor properties window, and you can select the method that you would like to
view services.You could again take the default of Top 10 Services, as shown in Figure
15.6, or you can narrow it down to a particular service that you may wish to monitor.
Monitoring by network objects is similar to monitoring by service, the default is to
display the Top 10 Network Objects, or you can select specific objects that you wish
to display instead.You can also choose if you want the object monitored in the source,
destination, or both. Top Firewall Rules allows you to choose how many (10 is the
default) firewall rules you wish to monitor.This feature may help you to better order your
rules, since you should attempt to write your policy such that the most frequently used
rules are placed closest to the top of the policy for better performance. If you are running
FloodGate-1, you can also monitor QoS Rules through the SmartView Monitor.The
Monitor by QoS Rules tab in the Session Properties window allows you to choose the
rules that you wish to display, and then you can watch how they are utilized.
www.syngress.com
Figure 15.5 Monitoring FireWall-1 Active Connections
259_ChkPt_VPN_15.qxd 4/3/03 1:41 PM Page 553
554 Chapter 15 • Firewall Troubleshooting
Monitoring a Virtual Link
To monitor a Virtual Link, you must first define one or more Virtual Links through the
SmartDashboard from the Virtual Links tab in the Objects Tree.You will need to give
the link a name and specify two firewall modules as end points. End point A must be
an internal FireWall-1 module, and end point B may be either internal or external. If
you wish to monitor the link between these modules, you must check the box to
Activate Virtual Link.You can also define SLA parameters from the Virtual Link
Properties window in the SmartDashboard to ensure that the SLA is being met.
NOTE
Check Point uses the Check Point End-to-End Control Protocol (E2ECP) service
to monitor the link between gateways in a Virtual Link configuration. You may
need a rule to allow the communication for this protocol on both end points.
E2ECP uses UDP port 18241.
Once you have selected the Virtual Link you wish to monitor in the Session
Properties window in SmartView Monitor, select the Virtual Link Monitoring tab
to choose the type of graph you wish to have displayed.You can choose to view
Bandwidth or Bandwidth Loss from point A to B, B to A, or both directions (as
shown in Figure 15.7), or you can choose Round Trip Time to monitor the total
time it takes for a packet to travel round trip between the gateways.
www.syngress.com
Figure 15.6 Monitoring Top 10 Services
259_ChkPt_VPN_15.qxd 4/3/03 1:41 PM Page 554
Firewall Troubleshooting • Chapter 15 555
Next you will need to select data type: either Application Data or Wire Data.
Application Data is monitored as the application would see it in an unencrypted and
uncompressed form. Wire Data on the other hand analyzes all data on the wire in its
encrypted and compressed form.This method should be selected to compare SLA
Guarantees, for example.
Running History Reports
You can use the SmartView Monitor to generate history reports by selecting History
Report as the Session Type. As opposed to Real-Time Monitoring, the History
report will show you static data over the last hour, day, week, and month or since the
time of installation.You can run reports on Check Point counters (see Figure 15.8 for a
monthly report on FireWall-1 connections) or traffic, however, your choices are some-
what limited from the options you had in the Real-Time mode. For traffic, your only
options for reports are:
■
Service (bytes per second)
■
Top Destinations (bytes per second)
■
Top Sources (bytes per second)
■
Top FireWall-1 Rules (bytes per second)
■
Top Services (bytes per second)
www.syngress.com
Figure 15.7 Monitoring a Virtual Link
259_ChkPt_VPN_15.qxd 4/3/03 1:41 PM Page 555
556 Chapter 15 • Firewall Troubleshooting
Using fw monitor
Fw monitor is a command-line utility that allows you to do packet captures on your fire-
wall.This tool is available on all platforms on VPN-1/FireWall-1, which means even
those running Windows can utilize it. Fw monitor comes in very handy when trou-
bleshooting particularly tricky firewall problems, like when you can’t figure out why an
FTP session is failing or whether NAT is functioning properly. By the end of this sec-
tion, you should understand how fw monitor works, how to create your own INSPECT
filters for use with the command, and how to review the output.The syntax for fw
monitor follows, see Table 15.1 for a description of each switch:
fw monitor [-d] [-D] <{-e expr}+|-f <filter-file|->> [-l len] [-m mask]
[-x offset[,len]] [-o <file>]
Table 15.1 Switches Used with fw monitor
Switch Description
-d A lower level of debugging of the INSPECT filter as it’s loading.
-D A higher level of debugging output of the INSPECT filter as it’s loading.
-e Specify an INSPECT filter on the command line.
-f Load the INSPECT filter from a file.
-l Length of the packet to be displayed.
www.syngress.com
Figure 15.8 Reporting on FireWall-1 Active Connections
Continued
259_ChkPt_VPN_15.qxd 4/3/03 1:41 PM Page 556
Firewall Troubleshooting • Chapter 15 557
-m Mask the inspection points to be captured. You can use any of the
inspection points i, I, o, or O as described in Table 15.2. The default, if
this switch is not used, is to capture from all.
-o Output file where the captured packet data will be logged. You will
need to use a network protocol analyzer to view the output of the file.
-x Hex dump of IP and protocol information can be displayed with con-
sole output only using this switch.
How It Works
The fw monitor command works by first loading an INSPECT filter, which analyzes and
matches packets as they pass through each interface of your firewall both in the
inbound and outbound direction.This filter is similar to the one compiled from your
Security Policy. If you run the command without any arguments, all packets will be
captured and printed to standard output (text printed on the screen), and each packet
will be displayed four times, two for each interface and direction. See Figure 15.9 and
Table 15.2 for an explanation of inspection points.
www.syngress.com
Table 15.1 Switches Used with fw monitor
Switch Description
Figure 15.9 Interface Direction Inspection Points
Physical interface = eth0
Operating System
Physical interface = eth1
VPN-1/FireWall-1 kernel inspection
VPN-1/FireWall-1 kernel inspection
i = inbound
before inspection
I = Inbound
after inspection
o = outbound
before inspection
O = Outbound
after inspection
The arrow represents the direction a
packet is flowing through your firewall.
259_ChkPt_VPN_15.qxd 4/3/03 1:41 PM Page 557
558 Chapter 15 • Firewall Troubleshooting
Table 15.2 Interface Direction Inspection in fw monitor
Inspection
Point Description
i Before VPN-1/FireWall-1 kernel inspection in the inbound direction
I After VPN-1/FireWall-1 kernel inspection in the inbound direction
o Before VPN-1/FireWall-1 kernel inspection in the outbound direction
O After VPN-1/FireWall-1 kernel inspection in the outbound direction
Writing INSPECT Filters for fw monitor
If you don’t want to just dump every packet to the terminal, which is the default if you
give fw monitor no arguments, you may wish to set up some specific filters for capturing
certain traffic.A simple fw monitor filter like this, fw monitor –e “accept;” –o monitor.out will
capture every packet, but will save the output to a file.Then you will need some kind of
network protocol analyzer that can interpret and read packet capture data, such as snoop or
Ethereal. See the following section,“Reviewing the Output,” for more information.
The accept action that you specify means only that you want the filter to accept and
match on packets as you specify them, it doesn’t mean that you want to see only
packets that the firewall has accepted. It’s also important to remember to use the semi-
colon at the end of the filter, otherwise it won’t load. If you successfully compile an fw
monitor filter, you will see the following output (as the last line explains, simply press
Ctrl-C when you want to stop capturing packets):
tampagw[admin]# fw monitor -e "accept;"
monitor: getting filter (from command line)
monitor: compiling
monitorfilter:
Compiled OK.
monitor: loading
Feb 28 09:24:46 tampagw [LOG_CRIT] kernel: FW-1: monitor filter loaded
monitor: monitoring (control-C to stop)
Before we get into some of the other filtering options, let’s discuss how an IP
packet header is put together, so you can better understand the syntax used in the
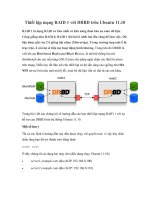
examples that follow. Figure 15.10 illustrates an IP packet header, which contains 20
total bytes, and each byte is equal to 8 bits of data. When counting the bytes in the
header, we are going to begin with zero; byte zero in the diagram contains the IP ver-
sion and header length of the packet. If we skip down to byte 9, we get the IP protocol
(for example,TCP, UDP, and so on), and byte 12 is where the source IP address begins.
www.syngress.com
259_ChkPt_VPN_15.qxd 4/3/03 1:41 PM Page 558
Firewall Troubleshooting • Chapter 15 559
When specifying INSPECT filters with fw monitor, you will be specifying the start
byte to determine what you want to capture.The syntax for specifying a specific value
is [<offset>:<length>,<order>].The offset specifies the start byte, length specifies the total
bytes to read (four bytes is the default), and order specifies either b for big endian or l for
little endian or host order (l is the default). For example, if you want to search for all
TCP traffic, you could use the command fw monitor -e “accept [9:1,b]=6;”.This expres-
sion says that if you start at the ninth byte and read the first byte, then this value should
be equal to 6, which is the protocol number for TCP. For a list of protocols and their
associated numbers, go to www.iana.org/assignments/protocol-numbers for the most
up-to-date information.The most commonly used protocols are ICMP,TCP, and UDP,
which are represented by numbers 1, 6, and 17 respectively.
If you are interested in capturing data to or from a specific IP address, you might use
the following syntax: fw monitor -e “accept [12,b]=10.10.10.1 or [16,b]=10.10.10.1;” –o
monitor.out. In this example, [12,b] represents the source IP address, which starts in the
twelfth byte of an IP packet header (starting from 0, as shown in Figure 15.10). In this
case, you do not need to specify the number of bytes to read, as in [12:4,b] since fw mon-
itor will read four bytes by default from the start byte specified. We recommend a filter
like this if you are analyzing traffic from a specific source or destination address, say for
example FTP is failing to a specific destination.You should choose the FTP server IP
address as both the source and destination in this filter, since you want to see the traffic
flowing in both directions, and your source IP address may be translated at the firewall,
so you may not capture all packets if you choose the FTP client address. Here is a step-
by-step example where we are trying to FTP to or from 192.168.0.8:
www.syngress.com
Figure 15.10 IP Packet Header
IP Version
(4 bits)
Header
Length
Type of Service (TOS) Total Packet Length (in Bytes)
16-bit Identification
Flags
13-bit Fragment Offset
Time to Live (TTL)
Protocol
(Transport Layer
Protocol)
Header Checksum
32-bit Source IP Address
32-bit Destination IP Address
3210
4567
89
10
11
12
16
13 14
17 18 19
15
259_ChkPt_VPN_15.qxd 4/3/03 1:41 PM Page 559
560 Chapter 15 • Firewall Troubleshooting
1. Run fw monitor -e “accept [12,b]=192.168.0.8 or [16,b]=192.168.0.8;”.
2. Start the FTP connection from your client and reproduce the problem.
3. When done capturing data, press Ctrl-C on the firewall to end the
fw monitor capture.
4. Review the output.
The last example of an fw monitor command filter is one in which you are looking
for a specific source or destination port number. Let’s say that you want to capture all
HTTP (TCP port 80) traffic—you might write a filter like this:
fw monitor -e "accept [20:2,b]=80 or [22:2,b]=80;" –o monitor.out
For more help with the INSPECT language, review the NG CP Reference Guide
available online at www.checkpoint.com/support/technical/documents/docs-5.0/
cp_ref_ng_sp0.pdf.
Reviewing the Output
If you use the –o option with fw monitor to save the output to a file, you will need some
kind of network protocol analyzer that can interpret and read packet capture data.You
can use tools such as snoop or Ethereal. If you don’t use the –o option, the data will be
displayed to standard output, and you can redirect the output from the command to a
text file. It’s easiest to use Ethereal to view the data since you can easily do searches and
configure filters for the output, so we use that in the following examples. Ethereal is a
freeware program that you can download at www.ethereal.com.
NOTE
To use snoop (available on most Solaris systems), use the –i switch to import
the file, as in the following examples:
■
Ex. snoop –i monitor.out
■
Ex. snoop –i monitor.cap -V -x14 tcp port ftp or tcp port ftp-data
See Figure 15.11 for an example output of fw monitor in Ethereal. In the top frame,
you can view the time elapsed in milliseconds, the source, destination and protocol, and
then in the Info field you can see the source and destination port numbers,TCP flags,
sequence number, ACK number, window, and length. If you highlight one of the
packets, you can get more detailed data in the second frame. Finally, in the third frame,
you can determine at which inspection point the packet was captured, for the example
in Figure 15.11, you can see i.eth-s4p1c0, which tells you that the packet was caught
before VPN-1/FireWall-1 kernel inspection in the inbound direction on eth-s4p1c0.
www.syngress.com
259_ChkPt_VPN_15.qxd 4/3/03 1:41 PM Page 560
Firewall Troubleshooting • Chapter 15 561
You can also use Ethereal to set up filters.You can type in a filter in the window at
the bottom, such as ip.addr == 192.168.168.3 or tcp.port == 80, then click Apply,
or you can use the Filter button on the bottom of the page to select the filter you are
interested in applying. Figure 15.12 illustrates how this is done.
1. Click on Filter.
2. Click on Add Expression….
3. Select a Field name, such as Source or Destination Address.
4. Choose a relation:
■
Is present
■
== Equal to
■
!= Not equal to
■
> Greater than
■
< - Less Than
■
>= Greater than or equal to
■
<= Less than or equal to
5. Finally, enter the IP address you wish to search for in the box provided. When
you are done, click Accept.
6. Click OK to apply the filter.
7. Click on Reset when you want to remove the filter.
www.syngress.com
Figure 15.11 Ethereal Output
259_ChkPt_VPN_15.qxd 4/3/03 1:41 PM Page 561
562 Chapter 15 • Firewall Troubleshooting
Other Tools
Several other tools are available when troubleshooting your firewall. Some of them are
available on your VPN-1/FireWall-1 system, and others are available with your oper-
ating system.
Check Point Tools
You may find that the tools mentioned previously may not be too helpful if you are
troubleshooting a performance issue or a specific system error message, especially if you
don’t have a license for the SmartView Monitor; the following sections provide more
options for your problem-solving arsenal.
www.syngress.com
Figure 15.12 Ethereal Filter
CSP Tools
If you happen to be a Check Point Certified Support Partner, you have access
to several tools that allow you to do additional troubleshooting in NG. Sorry,
only CSPs are given access to these.
■
DNS-Info Wizard Generates the dnsinfo.C file for use with
SecuRemote/SecureClient and split DNS configurations
Tools & Traps…
Continued
259_ChkPt_VPN_15.qxd 4/3/03 1:41 PM Page 562
Firewall Troubleshooting • Chapter 15 563
Log Files
Don’t forget how useful log files can be. Check Point has several useful text files (not
viewable via SmartView Tracker) in the $FWDIR/log directory, which can provide you
with additional information:
■
cpca.elg Check Point Certificate Authority logs
■
dtlsd.elg Policy Server Logging daemon logs
■
dtpsd.elg Policy Server logs
■
fwd.elg FireWall-1 daemon logs
■
fwm.elg FireWall-1 Management logs
■
mdq.elg SMTP Security Server dequeue logs
■
vpnd.elg VPN daemon logs
www.syngress.com
■
FW-Monitor GUI Uses the FireWall-1 4.0/4.1 GUI interface to gen-
erate INSPECT scripts for use with fw monitor using the –f switch.
■
IKE view If you enable IKE debugging on your firewall or in
SR/SC, you can use this tool to view the IKE.elg output file.
■
INFO tab Displays kernel table information as generated with fw
tab or cpinfo. Some kernel tables are displayed in a more readable
format for easy review.
■
Info view A robust tool that takes an input of fwinfo, cpinfo,
srinfo, and/or mipinfo files and displays them in a graphical
format; it allows you to test for certain conditions using the input
file, display the security policy, run Infotab on the kernel tables,
parse the objects file, launch IKEView, read the user database, and
verify all file builds on a firewall.
■
Lic view Provides a graphical representation of license string fea-
tures in a tree format to analyze licenses.
■
Monitor for SecuRemote Utility that is installed on a SecuRemote
client that is run to monitor a SecuRemote installation.
■
Tunnel Utility Installed on your firewall module, Tunnel Utility
manages IPSec and IKE Security Associations (SAs) allowing you to
list or delete SAs.
259_ChkPt_VPN_15.qxd 4/3/03 1:41 PM Page 563
564 Chapter 15 • Firewall Troubleshooting
fw stat
Displays VPN-1/FireWall-1 status, including the name of the last policy installed.
fw.toronto[admin]# fw stat
HOST POLICY DATE
localhost 121202 3Mar2003 16:06:24 : [>eth-s1p4c0] [>eth4c0]
[>eth2c0] [>eth3c0] [<eth3c0] [>eth1c0]
fw ctl pstat
Displays VPN-1/FireWall-1 kernel parameters and statistics, including kernel memory,
connections, and NAT information.You can use this command to gain valuable insight
into how your system is performing. Here are some of the more interesting fields:
■
Total memory allocated Displays the total amount of kernel memory
assigned to FireWall-1.
■
Total memory bytes used Displays the amount of memory used, unused,
and peak.You can use this to determine if the total memory allocated is suffi-
cient for your system. If you see that you are using all of the kernel memory
allocated, you can increase this value. For information on how to do this, see
page 365 in the Check Point Next Generation Security Administration book
(Syngress Media, Inc. ISBN: 1928994741
).
■
Allocations What you care about here are the failed allocations. If your
system is running well, you should always have 0 failed alloc displayed here.
You can also use fw ctl pstat to view information about your system if it is in a HA
configuration. If you scroll all the way to the end of the output displayed, you will see
information about sync. If sync is not configured properly, you may see that no sync
packets were received or that sync is not on.
fw.toronto[admin]# fw ctl pstat
Hash kernel memory (hmem) statistics:
Total memory allocated: 6291456 bytes in 1535 4KB blocks using 1 pool
Total memory bytes used: 369748 unused: 5921708 (94.12%) peak:
871940
Total memory blocks used: 122 unused: 1413 (92%) peak:
243
Allocations: 12101262 alloc, 0 failed alloc, 12095655 free
www.syngress.com
259_ChkPt_VPN_15.qxd 4/3/03 1:41 PM Page 564
Firewall Troubleshooting • Chapter 15 565
System kernel memory (smem) statistics:
Total memory bytes used: 13879436 peak: 14500728
Blocking memory bytes used: 1505496 peak: 1563272
Non-Blocking memory bytes used: 12373940 peak: 12937456
Allocations: 40812699 alloc, 0 failed alloc, 40812353 free, 0 failed free
Kernel memory (kmem) statistics:
Total memory bytes used: 7948424 peak: 8538800
Allocations: 12559037 alloc, 0 failed alloc, 12553085 free, 0
failed free
Kernel stacks:
0 bytes total, 0 bytes stack size, 0 stacks,
0 peak used, 0 max stack bytes used, 0 min stack bytes used,
0 failed stack calls
INSPECT:
371804 packets, 265643860 operations, 4963757 lookups,
0 record, 63361113 extract
Cookies:
25767245 total, 0 alloc, 0 free,
204 dup, 80057678 get, 624 put,
24502341 len, 0 cached len, 0 chain alloc,
0 chain free
Connections:
307750 total, 223 TCP, 14081 UDP, 293446 ICMP,
0 other, 51 anticipated, 39 recovered, 89 concurrent,
1539 peak concurrent, 3297600 lookups
Fragments:
0 fragments, 0 packets, 0 expired, 0 short,
0 large, 0 duplicates, 0 failures
NAT:
192/0 forw, 192/0 bckw, 384 tcpudp,
www.syngress.com
259_ChkPt_VPN_15.qxd 4/3/03 1:41 PM Page 565
566 Chapter 15 • Firewall Troubleshooting
0 icmp, 40-25202 alloc
sync new ver working
sync out: on sync in: on
sync packets sent:
total: 423172 retransmitted: 0 retrans reqs: 0 acks: 39
sync packets received:
total 4605511 of which 0 queued and 0 dropped by net
also received 0 retrans reqs and 19 acks to 0 cb requests
fw tab
This command will display kernel table information. If you run it with no arguments, it
will dump all the tables and their first 16 elements to standard output. If you want to
view only one table, you must specify the table name on the command line with the –t
switch.The –s switch (for short display) can be very useful also, since you can read the
#VALS column to see the total number of entries in the table, and #PEAK shows you
the maximum value the table has reached.The –x switch will completely clear out a
table, which may be useful if you need to refresh the firewall’s host count, but be careful
with this option since you don’t want to accidentally clear out your active connections
in the middle of the day. See Table 15.3 for a list of some of the fw tab options.
Usage: fw tab [-t <table>] [-s | -c] [-f] [-o <filename>] [-r] [-u | -m
<maxvals>] [[-x | -a] -e entry] [-y] [hostname]
This is an example of an fw tab output, which is a short display of the
connections table:
fw.toronto[admin]# fw tab -t connections -s
HOST NAME ID #VALS #PEAK #SLINKS
localhost connections 8158 102 1539 284
Table 15.3 fw tab Options
Option Description
-all Displays info for all targets.
-conf <filename> Displays info for the targets defined in <filename>.
-a Displays all tables.
-s Short display.
-h Displays the usage.
-f Displays in decimal format (hex is the default).
www.syngress.com
Continued
259_ChkPt_VPN_15.qxd 4/3/03 1:41 PM Page 566
Firewall Troubleshooting • Chapter 15 567
-u Do not limit the number of table entries displayed.
-m <number> For each table, display the first <number> of elements. Sixteen
entries will be displayed by default.
-t <table> Specifies the table that you wish to display.
-x Deletes/clears all table entries.
Targets Specifies that target(s) that you wish to have displayed.
Here is a list of common tables that you may find useful to review on an NG
firewall:
■
connections Contains all active connections. By default, FireWall-1 limits
the size of this table to 25,000. If you are reaching this value at peak times,
you may want to consider increasing the size of your connection table
through the SmartDashboard. Edit the firewall module object, select
Capacity Optimization, and increase the value for Maximum
concurrent connections.
■
pending Contains connections that are pending, such as FTP PASV
connections.
■
host_table Exists on systems with limited host licenses. Contains each host
that the firewall has counted towards the license.
■
IKE_SA_table Contains all active IKE Security Associations.
■
fwx_alloc Contains all ports allocated for translation.
■
fwx_auth Contains original destination and port prior to translation.
■
fwx_cntl_dyn_tab Contains currently allocated IP Pool NAT addresses for
SecuRemote users.
fw lichosts
On systems with a limited license, this command will display all hosts that the firewall
has counted towards the license. If you have exceeded your license limit, use this com-
mand to help you identify the hosts that the firewall has counted.The philosophy
Check Point uses for licensing is that anything that is not external to the firewall is
being protected by the firewall, and hence you must have a license to cover all those
devices. FireWall-1 does not count hosts by the number of objects created, but rather
by the IP addresses that it sees on its internal interfaces.
www.syngress.com
Table 15.3 fw tab Options
Option Description
259_ChkPt_VPN_15.qxd 4/3/03 1:41 PM Page 567
568 Chapter 15 • Firewall Troubleshooting
cpinfo
If you need to escalate a problem to Check Point, they will want to get a cpinfo off of
the management module and enforcement point for review.The cpinfo file replaces the
fwinfo file that used to be distributed with all Check Point systems.You can download
cpinfo from Check Point at www.checkpoint.com/techsupport/downloadsng/
utilities.html; it is not installed with your VPN-1/FireWall-1 software. Most of the
time, you will be running the command cpinfo –o <filename> to produce a file to send
to Check Point. See Table 15.4 for other options.
Table 15.4
cpinfo Options
Option Description
-o <filename> Directs output to filename
-r Obtains the entire Windows System Registry info
-v Displays version info
-t Gathers SecuRemote/SecureClient kernel tables only
-n Turns DNS resolving off
-c <cmaname>/<ctx> Fetches either a Provider-1 CMA info or a VSX CTX info
-l Include Log files
-h Help; prints usage
Operating System and Third-Party Tools
Some other useful tools for troubleshooting your firewall or network are available on
your operating system, such as ping and traceroute. If you have a Windows firewall, and
you want to have several Unix tools available at your disposal, you might want to con-
sider running a Unix shell environment on your firewall so you can use these tools,
such as Cygwin (www.cygwin.com).You can even run an SSH daemon through
Cygwin and gain remote access to your Windows system through a secure shell. Also,
don’t forget the value of system files; on Windows systems, check the System and
Application Event logs; on Unix systems, check the messages and syslog files for addi-
tional information.
Platform-Friendly Commands
The following commands are available on Unix and Windows systems:
■
ping Connectivity testing and round-trip time.
■
traceroute (tracert on Windows) allows you to see each hop that a packet goes
through to reach the destination.
www.syngress.com
259_ChkPt_VPN_15.qxd 4/3/03 1:41 PM Page 568
Firewall Troubleshooting • Chapter 15 569
■
netstat Used with the –an switch, you can view listening TCP/UDP ports
and established connections; with the –rn switch, you can see the routing
table; and –in displays interface information (input packets, output packets, col-
lisions, and errors).
■
nslookup Allows you to do DNS lookups.
■
telnet You can use telnet to connect to TCP ports other than the default 23.
For example, you can telnet to a Web site on port 80 or telnet to a mail server
on port 25 to see if you get a connection.
Unix Commands
These are some Unix commands that are available on most systems (Solaris, Linux,
and Nokia):
■
df –k Displays disk partitions and usage.
■
vmstat n Displays information about your system, including memory and
CPU utilization every n seconds.
■
top Displays system processes that are utilizing the most system resources at
the top, and refreshes periodically.
■
ps Displays system processes; use –aux switch with BSD-like systems and –ef
on Solaris or System V–like systems.
■
dig Another DNS lookup utility, which looks like it may replace nslookup in
the near future.
■
tcpdump A packet capture and analyzer utility available on Linux and Nokia
systems. Use the –i switch to specify the interface you want to listen on.
■
Snoop A packet capture and analyzer utility available on Solaris systems. Use
the –d switch to specify the interface you want to listen on.
Third-Party Tools
Sometimes the tools available on your system just aren’t enough and you really want
something more. Consider using some of these third-party tools for additional trou-
bleshooting on your firewall:
■
Netcat A robust network debugging and exploration tool that reads and
writes data across network connections.The possibilities are almost limitless
with netcat.There is a Unix as well as a Windows version for download at
www.atstake.com/research/tools/network_utilities.
www.syngress.com
259_ChkPt_VPN_15.qxd 4/3/03 1:41 PM Page 569