Báo cáo sinh học: " Genome size in Calomys laucha and Calomys musculinus (Rodentia, Cricetidae)" potx
Bạn đang xem bản rút gọn của tài liệu. Xem và tải ngay bản đầy đủ của tài liệu tại đây (1.32 MB, 11 trang )
Original
article
Genome
size
in
Calomys
laucha
and
Calomys
musculinus
(Rodentia,
Cricetidae)
MA
Ciccioli,
L
Poggio
Facultad
de
Ciencias
Exactas
y
Naturales,
De
P
artamento
de
Ciencias
Biol6gt
*
cas,
Centro
de
Investigaciones
Gen!ticas
(UNLP-CONICET-CIC),
CC4,
Llavallol,
182l,
Buenos
Aires,
Argentina
(Received
12
April
1991;
accepted
28
December
1992)
Summary -
The
DNA
content
of
2 related
species,
Calomys
laucha
Thomas
(C
1)
(2n
=
64,
fundamental
number
=
74)
and
Calomys
musculinus
Fisher
(C
m)
(2n
=
38,
fundamental
number
=
62)
was
studied
using
Feulgen
microdensitometry
using
Mus
domesticus
as
a
control.
Amounts
of
(haploid)
DNA
in
the
2
species
were
significantly
different
(Cl:
6.940
pg;
Cm:
6.202
pg;
P
<
0.05).
The
results
were
analyzed
in
relation
to:
the
total
diploid
karyotype
length
measured
from
synaptonemal
complexes
with
a
light
microscope
(Cl:
735.55
pm;
Cm:
446.30
!m;
P
<
0.0001)
and
from
mitotic
metaphase
chromosomes
(Cl:
222.074
pm;
Cm:
102.651
pm;
P
<
0.0001),
the
metacentric-submetacentric
autosome
number
(Cl:
8;
Cm:
22)
and
the
area
of
chromocenters
showing
positive
staining
with
C-banding
technique
(heterochromatin)
(Cl:
100%;
Cm:
99.66%).
The
DNA
amount
in
pg
per
unit
length
of
karyotype
(measured
from
synaptonemal
complexes)
is
higher
in
Calomys
musculinus
(0.028
pg/
M
m)
than
in
Calomys
laucha
(0.019
pg/t
t
m).
This
indicates
that
there
is
not
a
constant
amount
of
DNA
associated
with
a
given
length
of
karyotype,
which
suggests
that the
difference
between
the
2
species
may
involve
differential
packing
of
DNA.
This
could
be
due
to:
genic
differences;
differential
interactions
between
genes
and
the
cellular
environment;
and/or
alteration
of
gene
expression
following
the
formation
of
new
linkage
groups
due
to
chromosomal
rearrangements.
Calomys
musculinus
Calomys
laucha
C-value
/
karyotype
length
/
synaptonemal
complex
Résumé -
Taille
du
génome
chez
Calomys
laucha
et
Calomys
musculinus
(Rongeurs,
Cricétidés).
La
teneur
en
ADN
de
2 espèces
apparentées
Calomys
laucha
Thomas
(Cl
2n
=
64,
nombre
fondamental
=
7!!)
et
Calomys
musculinus
Fisher
(Cm
2n
=
38,
nombre
fondamental
= 62)
a
été
étudiée
par
microdensitométrie
avec
Feulgen,
en
utilisant
Mus
*
Correspondence
and
reprints
domesticus
comme
témoin.
Les
teneurs
en
ADN
(haploïde)
des
2
espèces
ont
montré
des
différences
significatives
(Cl
=
6,9l!0
pg;
Cm
=
6,202
pg;
P
<
0,05).
Les
résultats
ont
été
analysés
en
relation
avec :
la
longueur
totale
(diploïde)
du
caryotype,
mesurée
en
microscopie
optique
à
partir
des
complexes
synaptonémiques
(Cl :
735,55
!m;
Cm :
l!l!6,30
¡l
m;
P
<
0, 0001)
et
à
partir
des
chromosomes
en
métaphase
(Cl :
222,07 ¡
l
m;
Cm
:
102,65
pm j
P
<
0,0001),
le
nombre
des
autosomes
métacentriques-submétacentriques
(Cl : 8,
Cm :
22)
et
la
surface
des
chromocentres
montrant
une
coloration
positive
avec
la
technique
de
bande
C
(hétérochromatine)
(Cl :
100%;
Cm :
99,66%).
La
quantité
d’ADN
exprimée
en
picogrammes
par
unité
de
longueur
du
caryotype
(mesurée
sur
les
complexes
synaptonémiques)
est
plus
élevée
chez
Calomys
musculinus
(0,028
pg/¡tm)
que
chez
Calomys
laucha
(0,019
pg/p,m).
Cela
indique
et
suggère
que
la
différence
entre
ces
2
espèces
pourrait
impliquer
un
empaquetage
différent
de
l’ADN.
Cela
pourrait
être
dû
à des
différences
géniques,
des
interactions
différentielles
entre
les
gènes
et
le
milieu
cellulaire,
et/ou
des
expressions
de
gènes
modifiées
suite
à
la
formation
de
nouveaux
groupes
de
liaison
par
suite
de
remaniements
chromosomiques.
Calomys
musculinus
/
Calomys
laucha
/
valeur-C
/
longueur
du
caryotype
/
complexe
synaptonémique
INTRODUCTION
The
genus
Calomys
(Phyllotinae)
has
not
been
completely
studied
and
the
tax-
onomical
and
phylogenetical
relationships
between
its
species
are
still
somewhat
uncertain
(Cabrera,
1961;
Hershkovitz,
1962;
Reig,
1984).
The
ancestral
karyotype
of
the
Phyllotinae
is
2n
=
70,
fundamental
number
(NF)
=
68,
most
of
the
chromo-
somes
being
acrocentric
(Pearson
and
Patton
1976).
The
present
species
of
Calomys
exhibit
a
range
of
chromosome
numbers
from
2n
=
64
(NF
=
68)
to
2n
=
36
(NF
=
68)
(Hurtado
de
Catalfo
and
Waimberg,
1974;
Lisanti
et
al,
1976;
Pearson
and
Patton,
1976;
Gardenal
et
al,
1977;
Forcone
et
al,
1980).
’
C
laucha
and
C
musculinus are
2
cricetid
rodents,
significant
from
a
health
point
of
view
because
they
are
vectors
of
the
Junin
virus
which
causes
the
Argentine
haemorrhagic
fever
(Gardenal
et
al,
1977).
These
2
species
are
synmorphic
and
sympatric
species
(Hershkovitz,
1962;
Massoia
et
al,
1968;
Gardenal
et
al,
1977;
Reig,
1984)
and
it
is
very
difficult
to
differentiate
them
in
the
field.
However,
they
present
very
distinctive
karyotypes
since
C
laucha
has
2n
=
64
(NF
=
74)
and
C
musculinus
has
2n
=
38
(NF
=
62)
chromosomes
(Pearson
and
Patton,
1976;
Gardenal
et
al,
1977;
Ciccioli,
1988,
1991).
The
main
mechanism
involved
in
the
chromosomal
evolution
of
rodents
is
that
of Robertsonian
fusions
(White,
1973;
Capanna
et
al,
1976;
Gropp
and
Winking,
1981).
Although
this
mechanism
would
be
the
most
parsimonious
explanation
in
Calomys
(Pearson
and
Patton
1976),
other
types
of
rearrangements
are
needed
to
explain
the
karyotype
change
between
the
2
species,
such
as
superimposed
pericentric
inversions
(Forcone
et
al,
1980;
Ciccioli,
1991).
In
C
musculinus
a
double
centromeric
region
was
observed
by
electron
microscopy
(EM)
on
synaptonemal
complexes
(SC)
(Ciccioli,
1991)
in
ca
12
of
a
total
of
19
bivalents
(Ciccioli
and
Rahn,
1984;
Ciccioli,
in
preparation).
Moens
(1978)
observed
in
Neopodismopsis
that
each
of
2
submetacentric
Robertsonian
fusion
have
&dquo;a
centric
knob
which
is
double
in
size
and
structure&dquo;.
In
house
mice,
Redi
et
al
(1986)
said
that
&dquo;it
has
been
inferred
(Gropp
and
Winking,
1981)
that
Rb
translocation
occurs
with
loss
of
the
2
shortest
arms
of
the
acrocentrics
involved
in
translocation,
probably
followed
by
functional
inactivation
of
a
centromere
(Hsu
et
al,
1975)&dquo;.
This
mechanism
does
not
necessarily
imply
a
quantitative
variation
in
total
DNA
content
since
in
Mus
poschiavinus
there
is
apparently
little
or
no
quantitative
change
in
genome
size
(C-value)
(Manfredi-Romanini
et
al,
1971;
Comings
and
Avelino,
1972;
Redi
et
al,
1986).
The
difference
in
genome
size
between
C
laucha
and
C
musculinus
are
studied
by
Feulgen
microdensitometry
in
the
present
paper.
The
aim
of
this
work
is
focused
on
the
relationships
between
DNA
content
and
the
total
karyotype
length
(TKL)
(measured
on
synaptonemal
complexes
(SC)
and
on
metaphase
mitotic
chromosomes
(MMC)),
as
well
as
other
nucleotypical
parameters
(Bennett,
1987;
Grant,
1987).
Moreover,
additional
information
on
genome
size
will
be
discussed.
MATERIALS
AND
METHODS
Six
male
individuals
from
Laguna
Larga
(Province
of
C6rdoba,
Argentina)
of
each
species
(C
laucha
and
C
musculinus)
and
one
individual
of
Mus
domesticus
(Province
of
Buenos
Aires)
were
studied.
DNA
content
measurements
(Feulgen
microdensitometry)
Slides
were
prepared
by
dispersion
and
air-drying
from
specimens
which
had
not
been
pretreated.
In
C
musculinus,
slides
of
meiosis
(from
testis)
and
mitosis
(from
bone
marrow)
were
made.
In
C
laucha
and
M
domesticus ,
the
same
procedure
was
followed
using
only
bone
marrow.
Hydrolysis
was
carried
out
with
5
N
HCl
at
20°C.
Different
times
of
hydrolysis
were
tested
(10,
20,
30,
35,
40,
50
and
60
min)
and
hydrolysis
curves
were
determined.
After
hydrolysis,
the
slides
were
rinsed
3
times
with
distilled
water
for
10
min
each.
Staining
was
carried
out
with
Feulgen
stain
at
pH
2.2
for
2
h.
Slides
were
rinsed
3
times
in
S0
2
-water
for
10
min
each
time,
and
then
in
distilled
water
(10
min).
The
slides
were
air-dried
in
the
dark
and
mounted
in
Euparal.
In
slides
of
testes,
measurements
were
made
on
spermatids
and
sperm,
and
lymphocytes
were
measured
in
slides
of
bone
marrow.
The
values
obtained
were
expressed
in
arbitrary
units
(AU),
or
in
absolute
units
(pg
of
DNA)
using
Mus
domesticus
as
a
control,
the
DNA
content
of
which
is
known
by
chemical
methods
(C
=
7
pg
(Lewin,
1980)).
To
ensure
the
accuracy
of
the
measurements
in
the
case
of
C
musculinus,
the
relationships
between
DNA
content
measurements
at
prophase
(4C)
and
telophase
(2C)
was
checked
to
correspond
to
the
ratio
2:1
in
mitotic
lymphocytes
(AU
35.23
and
AU
16.85
respectively)
and
4:1
in
prophase
I
(4C)
and
telophase
II
(1C)
of
meiotic
cells
(AU
36.24;
AU
9.63).
The
amount
of
Feulgen
staining
per
nucleus
was
measured
at
a
wavelength
of
570
nm
using
the
scanning
method
in
a
Zeiss
Cytoscan.
In
both
species,
the
readings
were
made
in
the
same
individuals
in
which
synaptonemal
complexes
were
measured.
The
differences
in
DNA
content
between
species
were
tested
with
a
Student
t-test.
Synaptonemal
complexes
using
light
microscopy
(L1V1)
Synaptonemal
complexes
(SC)
were
studied
using
the
method
described
by
Solari
(1983)
for
electron
microscopy,
adapted
by
modifying
the
stain
to
50%
(W/V)
of
AgN0
3
in
distilled
water.
Two
or
3
drops
of
silver
nitrate
solution
were
placed
on
previously
air-dried
slides.
Floating
coverslips
were
put
on
the
slides,
which
were
incubated
in
a
moist
chamber
at
60°C
for
3-5h.
Staining
was
monitored
under
a
phase
contrast
objective
until
yellowish
pachytene
nuclei
were
seen
with
dark
brown
SCs.
The
process
was
stopped
by
washing
with
distilled
water.
Slides
were
air-dried
and
mounted
in
DEPEX.
The
total
karyotype
length
(TKL)
was
measured
from
optical
micro-photographs.
Five
mid-pachytene
nuclei
were
measured
for
each
species.
The
length
of
the
SC
was
measured
3
times
and
an
average
value
was
determined
for
each
autosomic
bivalent.
The
same
procedure
was
followed
for
the
lateral
elements
of
the
X
and
Y
chromosomes.
The
TKL
(SC)
was’calculated
by
doubling
the
average
value
for
each
autosome
and
adding
that
of
the
lateral
elements
of
the
sexual
pair.
All
mea-
surements
were
carried
out
using
a
Mini-Mop
(Kontron)
Image
Analyzer.
The
dif-
ferences
in
TKL
length
measured
on
SC
(LhI)
between
species
were
tested
with
a
Student
t-test.
Conventional
karyotypes
The
animals
were
injected
with
a
yeast
solution
on
2
successive
days
to
increase
the
mitotic
index
(Lee
and
Elder,
1980).
On
the
third
day
they
were
injected
with
a
colchicine
solution
(0.0025%).
Two
hours
later,
they
were
etherized
and
the
bone
marrow
extracted
according
to
routine
techniques
(Evans
et
al,
1964).
The
preparations
were
made
by
dispersion
and
air-drying.
The
karyotypes
were
described
according
to
the
nomenclature
proposed
by
Levan
et
al
(19G4)
(m,
sm
and
st:
chromosomes
with
centromeres
in
the
median,
sttbmedian
and
subterminal
region,
respectively).
The
average
centromeric
indexes,
short
arms,
long
arms,
total
chromosome
length
and
chromatid
width
were
measured
and
calculated
in
3
cells.
The
total
chromosome
volume
(TCV)
was
obtained
by
considering
each
chromosome
as
2
cylinders.
The
formula
used
was
(II
x
r2
x
h)
x
2
(r
=
half
the
chromatid
width;
h
=
chromosome
length).
Measurements
were
carried
out
using
a
Mini-Mop
(Kontron)
Image
Analyzer.
The
differences
in
TKL
length
on
mitotic
metaphase
chromosomes
between
species
were
tested
with
an
approximate
Student
t-test
(Games
and
Howell,
1976),
on
the
assumption
of
heterogeneity
of
variances
(Sokal
and
Rohlf,
1981).
C-banding
The
C-banding
technique
was
performed
on
conventionally
prepared
slides
as
follows:
a)
60%
acetic
acid
for
30
min;
b)
0.2
N
HCl
for
1
h;
c)
solution
(OH)
2
Ba
sat
in
distilled
water,
12-15
min
at
20°C;
d)
2
x
SSC
for
45-60
min
at
60°C;
e)
2%
Giemsa
in
buffer
phosphate
ph
6.8
for
10-12
min.
The
heterochromatin
area
per
interphase
nucleus
was
obtained
by
measuring
the
area
of
each
C
positive
chromocenter
within
each
nucleus.
The
total
area
of
chromocenters
from
10
nuclei
was
averaged
in
each
species.
The
values
obtained
are
expressed
in
table
I
where
C
laucha
is
given
the
100%
value.
The
measurements
were
carried
out
using
a
Wini-Mop
(Kontron)
Image
Analyzer,
working
with
photomicrographs
with
similar
exposure
time,
development
procedure
and
enlargement
in
both
species.
RESULTS
AND
DISCUSSION
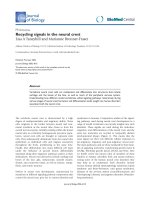
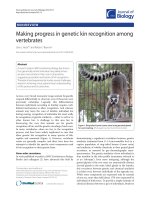
The
karyotype
of
C
laucha
(2n
=
64;
NF
=
74)
comprised
8
m-sm
(pairs
1-4)
+
54
st-t
+
X
(m)
Y
(m)
(fig
1A).
C
musculinus
(2n
=
38;
NF
=
62)
had
a
karyotype
with
22
m-sm
(pairs
1
to
11)
+
14
st
+
X(m)
Y
(m)
(fig
1B).
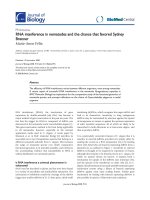
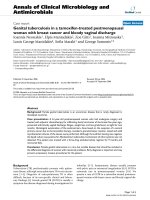
The
species
were
measured
at
their
optimum
hydrolysis
time,
ie:
C
laucha:
lym-
phocytes
30
min;
C
musculinus:
spermatids
35
min,
sperm
40
min
and
lymphocytes
35
min
(fig
2).
The
differences
related
to
hydrolysis
time
and
DNA
content
observed
between
spermatids
and
sperm
in
C
musculinus
(arbitrary
units)
are
remarkable
and
may
be
explained
by
the
higher
degree
of
chromatin
condensation
in
sperm.
This
could
be
due
to
the
chromatin
condensation
gradient
which
could
have
re-
duced
the
possibility
of
eliminating
the
depurinated
DNA
fragments
during
acid
hydrolysis
(Holmquist,
1979).
This
could
also
explain
the
small
differences
found
in
the
optimum
hydrolysis
time
between
both
species.
Table
I
shows
the
DNA
content
expressed
in
absolute
values
(pg)
in
both
species.
The
differences
in
C-values
between
C
musculinus
and
C
laucha
were
significant:
t
(46)
= 2.331,
P
=
0.0226)
(Bartlett
test
for
homogeneity
of variances,
XZ
=
1.8877,
DF
= 1,
P
=
0.1656).
The
DNA
content
and
TKL
presented
a
positive
relationship
with
chromosome
number
(table
I).
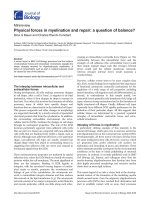
Synaptonemal
complexes
in
mid-pachytene
nuclei
of
C
laucha
and
C
musculinus
prepared
for
the
light
microscope
(L1!I)
are
shown
in
figure
3.
The
difference
in
the
total
karyotype
length
(TKL)
between
C
laucha
and
C
musculinus,
as
measured
from
SCs,
was
highly
significant:
t(8)
=
7.88,
P
=
0.000076
(Bartlett
test
for
homogeneity
of
variances
X2
=
1.3288,
DF
=
1,
P
=
0.2475)
(table
I).
Comparisons
of
TKL
based
on
SC
measurement
can
be
inaccurate,
because
of
at
least
2
possible
sources
of
error
(Anderson
et
al,
1985).
One
is
the
biological
variability
among
different
substages
of
pachytene.
This
variation
must
be
discarded
in
the
present
study
because
only
nuclei in
mid-pachytene
were
chosen.
The
other
is
the
physical
stretching
of
SCs
during
dispersion
in
the
hypotonic
hypophase.
In
the
present
work,
those
nuclei
which
showed
evidence
of
stretching
were
discarded.
Still
another
source
of
error,
when
different
species
are
compared,
involves
the
quantity
of
heterochromatin.
Compared
to
euchromatin,
heterochromatin
is,
on
average,
2
to
5
times
under-represented
in
the
length
of
pachytene
chromosomes,
due
to
its
different
condensation
state
in
pachytene
and
metaphase
(Stack
1984).
In
both
species
of
Calomys
C-banding
revealed
that
the
amount
of
heterochro-
matin
measured
in
interphasic
C+
chromocenters
is
similar
(Calomys
laucha
=
Calomys
musculinus
=
99.66%)
(table
I).
Thus,
the
effect
of
differences
in
the
quantity
of
heterochromatin
on
SC
length
between
the
species
is
negligible.
The
heterochromatin
was
expressed
in
absolute
value
and
not
in
relation
to
the
nuclear
area
of
lymphocytes
since
both
species
differ
significantly
in
this
parameter
(Cl
=
100%,
Cm
=
54.43%).
This
difference
follows
the
same
pattern
of
variation
as
the
TKL.
Such
differences
in
TKL
measured
on
mitotic
metaphase
chromosomes
are
larger
than
those
found
on
SCs
(table
I).
Differences
in
the
TKL
between
C
lauch,a
a
and
C
musculinus
measured
on
mitotic
metaphase
chromosomes
was
highly
signif-
icant:
t’(5)
=
37.27,
DF
=
4.72 .:;
5,
P
=
0.00002
(Bartlett
test
for
heterogeneity
of
variances
X2
=
4.2227,
DF
=
1,
P
=
0.0375).
The
use
of
mitotic
arresting
agents
such
as
colchicine
may
also
lead
to
errors
because
they
produce
dose-related
vari-
ation
in
chromatin
contraction.
In
the
present
work,
however,
this
should
not
be
an
important
source
of
error
since
the
same
dose
concentration
and
exposure
were
used
during
the
experiments.
Variations
in
TKL
for
both
sets
of
data
(SC,
MMC)
show
the
same
pattern
of
variation
which
suggests
that
the
highly
significant
differences
between
the
species
are
not
an
artefact
but
have
a
high
genetic
component.
Anderson
et
al
(1985)
showed
that
there
is
a
strong
correlation
between
TKL
(SC
length)
and
genome
size
in
higher
plants,
indicating
that
a
constant
amount
of
DNA
is
associated
with
a
given
length
of
SC,
at
least
when
averaged
over
the
whole
genome.
Whereas
this
statement
is
convincing
when
species
within
the
same
genus
are
compared
(eg
Allium)
indicating
that
they
have
a
similar
chromosomal
organization,
the
range
in
variation
in
DNA
content
per
unit
of
SC
length
is
much
larger
when
other
genera
are
included
(eg
Solanum
sparsi
P
ilum).
C
laucha
and
C
musculinus
also
present
a
positive
relationships
between
DNA
content
and
SC
length.
However,
in
spite
of
being
closely
related
species,
the
TKL
of
C
musculinus
is
39.3%
(SC)
and
54.3%
(l!Il!IC)
lower
than
that
of
C
laucha,
while
the
difference
in
DNA
content
is
only
10.6%.
It
may
be
worth
mentioning
that
the
difference
of
chromosome
volume
in
mitotic
chromosomes -
though
not
accurately
measured
because
chromosome
width
was
near
the
resolution
limit
of
our
Mini-Mop
Image
Analyzer -
is
of
the
same
order
(6.5%,
Cl
=
318
p,m
3
;
Cm
=
297
¡tm
3)
as
the
difference
in
DNA
content.
Consequently,
the
amount
of
DNA
per
unit
length
of
karyotype
is
much
higher
in
C
musculinus
than
in
C
laucha
(Table
I),
and
in
these
species
a
given
length
of
karyotype
does
not
contain
a
constant
amount
of
DNA.
This
may
be
explained
by
the
existence
of
different
interactions
between
the
nucleotypical
parameters
such
as
SC
length
and
DNA
amount.
This
could
indicate
that
differential
packing
of
DNA
is
an
important
difference
between
the
species,
due
to,
among
other
reasons:
a)
genetic
differences,
b)
differential
interaction
between
genes
and
the
cellular
environment,
and/or
c)
alteration
of
gene
expression
due
to
the
formation
of
new
linkage
groups
following
chromosome
rearrangements.
The
TKL
variation
pattern
is
similar
to
that
of
the
nuclear
area
(table
I).
Cavalier-Smith
(1983)
states
that
&dquo;the
nuclear
volume
is
jointly
determined
by:
1)
nuclear
DNA
content;
2)
the
degree
of
folding
of
the
DNA
and
its
pattern
of
attachment
to
the
nuclear
envelope&dquo;.
In
the
present
work,
the
main
factor
responsible
for
the
significant
differences
in
nuclear
area
and
TKL
could
be
the
degree
of
folding
as
suggested
by
the
differences
found
in
hydrolysis
times
between
the
two
species,
and
the
pattern
of
attachment
to
the
nuclear
envelope,
probably
due
to
the
decrease
in
telomere
number
in
Calomys
musculinus.
These
interactions
could
be
considered
part
of
the
genome
ecology
of
the
genus
(Bennett
1987).
ACKNOWLEDGMENTS
The
authors
are
especially
indebted
to
PE
Brandham
(Jodrell
Laboratory,
RBG,
Kew,
UK),
CA
Naranjo
for
critically
reading
the
manuscript
and
for
their
valuable
suggestions,
to
the
laboratory
of
virology
(Depto
Quimica
Biol6gica,
FCE
y
Nat,
UBA)
for
the
specimens
of
C
musculinus,
and
to
F
Kravetz
for
the
specimens
of
C
laucha
and
Mus
domesticus.
They
also
thank
R
Cabrini
for
the
use
of
a
microdensitometer
belonging
to
the
CNEA
and
the
statistician
B
Gonzalez
for
a
careful
revision
of
tests
and
data.
This
work
was
supported
by
a
CONICET
grant.
REFERENCES
Anderson
LK,
Stack
SM,
Fox
MH,
Chuanshan
Z
(1985)
The
relationship
between
genome
size
and
synaptonemal
complex
length
in
higher
plants. Exp
Cell
Res
156,
367-378
Bennett
MD
(1987)
Variation
in
genomic
form
in
plants
and
its
ecological
implica-
tions.
New
Phytol 106
(suppl),
177-200
.
Cabrera
A
(1961)
Catilogo
de
los
mamiferos
de
America
del
Sur. Rev
Mus
Arg
Cien
Nat
Bernardino
Rivadavia,
Cien
Zool 4(22),
309-732
Capanna
E,
Gropp
A,
Winking
H,
Noack
G,
Civitelli
MV
(1976)
Robertsonian
metacentrics
in
mouse.
Chromosoma
58,
341-353
Cavalier-Smith
T
(1983)
Cell
volume and
genome
size.
In:
Kew
Chromosome
Conference
II
(Brandham
PE,
Bennett
MD,
eds)
Royal
Bot
Gardens,
Kew,
London
Ciccioli
MA,
Rahn
I
(1984)
Estudios
mei6ticos
en
Calomys
musculinus
(Rodentia,
Cricetidae).
In:
XV
Congr
Arg
Genet
Corrientes,
25,
Soc
Arg
Gen6tica
Corrientes,
Argentina
Ciccioli
MA
(1988)
Cytogenetic
studies
in
Calomys
musculinus
(Rodentia,
Criceti-
dae).
Cytologia
53,
7-17
Ciccioli
MA
(1991)
Classical,
C-
and
Cd-banding
karyotypes
in
mitotic
and
meiotic
chromosomes
of
Calomys
musculinus
(Rodentia,
Cricetidae).
Caryologia
44(2),
177-
186
Comings
DE,
Avelino
E
(1972)
DNA
loss
during
Robertsonian
fusion
studies
of
the
tobacco
mouse.
Nature
(Lond)
New
Biol
237,
199
Evans
E,
Breckon
G,
Ford
C
(1964)
An
air-drying
method
for
meiotic
preparations
from
mammalian
testes.
Cytogenetics
3,
289-294
Forcone
AE,
Luna
MV,
Kravetz
FO,
Lisanti
JA
(1980)
Bandas
C
y
G
de
Calomys
musculinus
(Rodentia,
Cricetidae).
Mendeliana
4,
57-65
Games
PA,
Howell
JF
(1976)
Pairwise
multiple
comparisons
procedure
with
unequal
Ns
and/or
variances:
a
Montecarlo
study.
J
Educ
Stat
1,
113-125
Gardenal
CN,
Triay
de
Juarez
N,
Gutierrez
M,
Sabattini
MS
(1977)
Contribucion
al
conocimiento
de
tres
especies
del
g6nero
Calomys
(Rodentia,
Cricetidae).
Physis
C 36
(92)
169-178
Grant
WF
(1987)
Genome
differentiation
in
higher
plants.
In.:
Diffe.rentiation
Patterns
in
Higher
Plants
(Urbanska
KM,
ed)
Academic
Press,
New
York,
ch
1,
9-32
Gropp
A,
Winking
E
(1981)
Robertsonian
translocation:
cytology,
meiosis,
segrega-
tion
patterns
and
consequences
of
heterozygosity.
Symp
Zool
Soc
Lond
47,
141-181
Hershkovitz
P
(1962)
Evolution
of
neotropical
cricetine
rodents
(Muridae)
with
special
reference
to
the
phyllotine
group.
Fieldia!a:
Zool 46,
1-524
Holmquist
G
(1979)
The
mechanism
of
C-banding
depurination
and
;3-elimination.
Chromosoraa
72,
203-224
Hsu
TC,
Pathak
S,
Chen
TR
(1975)
The
possibility
of
latent
centromeres
and
a
proposed
nomenclature
system
for
total
chromosome
and
whole
arm
translocations.
Cytogenet
Cell
Genet
15,
41-49
Hurtado
de
Catalfo
G,
Waimberg
R
(1974)
Citogen6tica
de
Calomys
callosus
callosus
(Rengger
1830),
(Rodentia
Cricetidae).
Anllisi fi
m6trico
del
cariotipo
somatico.
Physis
C
33
(87)
215-219
Lee
MR,
Elder
F
(1980)
Yeast
stimulation
of
bone
marrow
mitosis
for
cytogenetics
investigations.
Cytogenet
Cell
Genet
26,
36-40
Levan
A,
Fredga
K,
Sandberg
AA
(1964)
Nomenclature
of centromeric
position
on
chromosomes.
Hereditas
52,
201-220
Lewin
B
(1980)
Gene
Expression
2.
Eukaryotic
Chromosorn,es.
John
Wiley
and
Sons
Inc,
New
York,
1160
Lisanti
JA,
Kravetz
FO,
Ramirez
CL
(1976)
Los
cromosomas
de
Calomys
co,lloszis
(Rengger)
(Rodentia
Cricetidae)
de
la
Provincia
de
Cordoba.
Physis
C 35,
221-230
Manfredi-Romanini
1!IGM,
Minazza
E,
Capanna
E
(1971)
DNA
nuclear
content
in
lymphocytes
from
Mus
musculus
L,
and
Mus
poschiavinus
(Fatio).
Biol
Zool 38,
321-326
Massoia
E,
Fornes
A,
Waimberg
R,
Fronza
T
(1968)
Nuevos
aportes
al
conocimiento
de
las
especies
bonaerenses
del
g6nero
Calomys
Rev
Inv
Agrop
INTA
5,
63-92
Moens
PB
(1978)
Kinetochores
of
grasshoppers
with
Robertsonian
chromosome
fusions.
Chromoso!n.a
67,
41-54
Pearson.OP,
Patton
JL
(1976)
Relationships
among
South
American
phyllotine
rodents
based
on
chromosome
analysis.
J
Mammal
57,
2,
339-350
Redi
CA,
Garagna
S,
Mazzini
G,
Winking
H
(1986)
Pericentromeric
heterochro-
matin
and
A-T
content
during
Robertsonian
fusion
in
the
house
mouse.
Chromo-
soma
94,
31-35
Reig
OA
(1984)
Significado
de
los
m6todos
citogen6ticos
para
la
distinci6n
e
interpretaci6n
de
las
especies
con
especial
referencia
a
los
mamiferos.
In:
Conf
III,
Congr
Iberoam
Zool
IV.
Peru,
Soc
Zool,
Peru
Sokal
RR,
Rohlf FJ
(1981)
Biometry.
WH
Freeman
and
Co,
New
York
Solari
AJ
(1983)
Recombination
bars
in
human
synaptonemal
complexes
spread
with
sodium
dodecyl
sulphate.
Microsc
Elec
y
Biol
Cel7(1),
1-11
1
Stack
SM
(1984)
Heterochromatin,
the
synaptonemal
complex
and
crossing-over.
J
Cell
Sci
71,
159-176
White
MJD
(1973)
Animal
Cytology
and
Evolution.
Cambridge
Univ
Press,
Cam-
bridge,
3rd
edn