Báo cáo sinh học: "Divergent selection for humoral immune responsiveness in chickens: distribution and effects of major histocompatibility complex types" ppt
Bạn đang xem bản rút gọn của tài liệu. Xem và tải ngay bản đầy đủ của tài liệu tại đây (674.94 KB, 13 trang )
Original
article
Divergent
selection
for
humoral
immune
responsiveness
in
chickens:
distribution
and
effects
of
major
histocompatibility
complex
types
M-H Pinard
1
JAM
Van
Arendonk
MGB
Nieuwland
AJ
Van
der
Zijpp
1
Department
of Animal Husbandry,
Wageningen Agricultural
University,
Wageningen;
2
Department
of Animal Breeding, - Wageningen Agricultural
University,
Wageningen;
3
DLO-Research
Institute
for
Animal
Production
Schoonoord,
Zeist,
The
Netherlands
(Received
13
April
1992;
accepted
20
November
1992)
Summary -
Chickens
were
selected
for
10
generations
for
high
and
low
antibody
response
to
sheep
red
blood
cells;
in
addition,
a
randombred
control
line
was
maintained.
All
birds
(n
=
1 602)
from
the
9th
and
10th
generations
were
typed
for
major
histocompatibility
complex
B-types.
All
identified
types
were
present
in
the
control
line
but
the
selected
lines
showed
divergent
distributions.
The
121
B-haplotype
was
predominant
in
the
high
line
in
the
form
of
121-121
B-genotype,
whereas
the
114
B-haplotype
was
most
frequent
in
the
form
of
114-114
and
114-124
B-genotypes
in
the
low
line.
To
explain
these
frequency
changes,
effects
of
B-genotypes
on
the
selected
trait
were
estimated,
using
a
mixed
animal
model.
The
B-genotypes
were
responsible
for
a
significant
part
of
variation
of
the
trait
within
lines,
but
their
effects
differed
between
lines.
These
effects
could
be
related
partly
to
the
changes
in
B-genotype
distribution.
chicken
/
immune
response
/
selection
/
animal
model / major
histocompatibility
complex
Résumé -
Sélection
divergente
sur
la
réponse
immunitaire
chez
la
poule:
distribution
et
effets
des
types
du
complexe
majeur
d’histocompatibilité.
Des
poulets
ont
été
sélectionnés
pendant
10
générations
sur
la
réponse
immunitaire
haute
et
basse
à
des
glo-
bules
rouges
de
mouton;
une
lignée
témoin
était
également
maintenue
par
accouplements
*
Correspondence
and
reprints:
MH
Pinard,
Laboratoire
de
Génétique
Factorielle,
INRA,
78352
Jouy-en-Josas
Cedex,
France
**On
leave
from
the
Laboratoire
de
Génétique
Factorielle,
Institut
National
de
la
Recherche
Agronomique,
Jouy-en-Josas,
France
au
hasard.
Tous
les
animau!
(n
=
1602)
des
générations
9
et
10
ont
été
analysés
pour
leurs
types
B
du
complexe
majeur
d’histocompatibilité.
Tous
les
types
identifiés
étaient
présents
dans
la
lignée
témoin,
alors
que
les
lignées
sélectionnées
présentaient
des
distributions
divergentes
pour
ces
types
B.
L’haplotype
B
121
était
prédominant
dans
la
lignée
haute
sous
la
forme
du
génotype
B
121-121,
alors
que
l’haplotype
B
114
était
le
plus fréquent
dans
la
lignée
basse
sous
la forme
des
génotypes
B
114-114
et
114-124.
Afin
d’expliqaer
ces
changements
de
fréquence
des
types
B,
les
effets
des
génotypes
B
sur
la
réponse
immunitaire
aux
globules
rouges
de
mouton
ont
été
estimés
à
l’aide
d’un
modèle
animal
m.i.xte.
Les
génotypes
B
étaient
responsables
d’une
part
significative
de
la
variation
du
caractère
intralignée,
mais
leurs
effets
étaient
variables
suivant
la
lignée.
Ces
effets
pouvaient
en
partie
expliquer
les
changements
de
fréquence
des
types
B.
poule
/
réponse
immunitaire
/
sélection
/
modèle
animal / complexe
majeur
d’histocompatibilité
INTRODUCTION
In
recent
years,
there
has
been
a
growing
interest in
improving
the
genetic
resistance
of
domestic
species
to
infectious
diseases.
This
improvement
may
be
accomplished
indirectly
by
selective
breeding
for
immune
responsiveiiess
and/or
for
genes
or
marker
genes
for
immune
responsiveness
and
disease
resistance
(Warner
et
al,
1987).
Moreover,
advances
in
molecular
technique
have
opened
promising
ways
for
directly
introducing
advantageous
genes
into
animals
by
genetic
engineering
(Lamont,
1989).
Successful
selection
experiments
for
high
and
low
antibody
response
to
sheep
red
blood
cells
(SRBC)
have
been
reported
in
mice
(Biozzi
et
al,
1979)
and
in
chickens
(eg
Van
der
Zijpp
et
al,
1988;
Martin
et
al,
1990).
In
the
former
experiment,
Pinard
et
al
(1992)
have
estimated
heritability
for
the
selected
trait
as
0.31.
However,
even
if
the
humoral
response
to
SRBC
is
under
polygenic
control,
some
specific
genes
might
play
a major
role,
and
the
genes
of
the
major
histocompatibility
complex
(MHC)
are
prime
candidates.
The
MHC
genes
encode
highly
polymorphic
cell
surface
proteins
that
have
been
shown
to
play
an
important
role
in
immune
responsiveness
and
disease
resistance
in
many
species
including
chickens
(Bacon,
1987;
Gavora,
1990;
Lamont
and
Dietert,
1990).
Estimation
of
MHC-type
effects
remains
a
delicate
task,
especially
in
the
framework
of
selected
outbred
lines.
Ignoring
the
relationships
between
individuals
may,
for
example,
often
lead
to
overestimation
of
the
MHC
effect
(Mallard
et
al,
1991).
The
choice
of
the
method
to
estimate
single
gene
effects
separately
from
the
background
genes
is
therefore
crucial
(Kennedy
et
al,
1992).
The
objectives
of
this
study
were
to
look
for
possible
changes
in
MHC
haplotype
and
genotype
frequencies
in
lines
of
chickens
divergently
selected
for
10
generations
for
antibody
response
to
SRBC,
and
to
estimate
the
MHC
effects
on
the
selected
trait
in
order
to
understand
the
involvement
of
MHC
in
the
regulation
of
the
immune
response.
MATERIALS
AND
METHODS
Selection
lines
The
selection
experiment
has
been
described
in
detail
elsewhere
(Van
der
Zijpp
et
al,
1988;
Pinard
et
al,
1992).
Briefly,
chickens
were
bidirectionally
selected
from
an
ISA
Warren
cross
base
population
for
10
generations.
The
selection
criterion
was
the
total
antibody
(Ab)
titer,
5
d
postprimary
immunization
with
1
ml
25%
sheep
red
blood
cells
(SRBC)
diluted
in
phosphate-buffered
saline.
Antibody
titers
measured
against
SRBC
were
expressed
as
the
log
2
of
the
reciprocal
of
the
highest
blood
plasma
giving
complete
agglutination.
In
addition
to
the
high
(H)
and
low
(L)
lines,
a
random-bred
control
(C)
line
was
maintained.
Every
generation,
there
were !
300
chicks
each
in
the
H and
L
lines
and
250
chicks
in
the
C
line,
from
which
xr
25
males
and
50
females
in
the
H and
L
lines
and ;zz
40
males
and
70
females
in
the
C
line
were
used
to
produce
the
next
generation.
In
the
9th
generation,
the
inbreeding
level
was
7.3,
3.6
and
9.4%
in
the
H,
C
and
L
lines,
respectively.
The
numbers
of
birds
in
the
H,
C
and
L
lines
of
the
ninth
and
tenth
generations
are
given
in
table
I.
Typing
for
MHC
haplotype
Major
histocompatibility
complex
haplotypes
were
determined
by
direct
haemag-
glutination,
using
alloantisera
obtained
from
the
lines.
Four
serotypes,
provisionally
called
B1l
4,
B1l9
,
B
izi
,
and
B
lz4
were
identified
in
the
tested
birds.
As
compared
to
known
reference
B-types,
none
of
the
serotypes
identified
in
the
lines
was
identical
for
both
B-F
and
B-G.
Only
B
114
and
W
19
showed
similarities
for
B-G
with
B
14
and
B
19
,
respectively,
whereas
B
12i
showed
similarities
for
B-F
with
B
21
(Pinard
et
al,
1991;
Pinard
and
Hepkema,
1992).
A
MHC
genotype
was
defined
as
the
combi-
nation
of
2
haplotypes.
Serological
typing
was
performed
on
the
parents
of
the
8th
generation,
on
all
the
females
and
the
selected
males
of
the
8th
generation,
and
on
all
the
birds
of
the 9th
and
10th
generations.
Only
the
results
of
MHC
typing
in
the
9th
and
10th
generations
were
used
in
the
analysis.
Segregation
of
the
haplotypes
was
checked
for
consistency
within
families
over
generations,
and
inconsistent
data
were
removed
from
the
analysis.
Statistical
analysis
Comparison
of
MHC
type
frequencies
between
the
lines
was
performed
by x2
tests.
Effects
of
MHC
genotype
on
the
Ab
response
were
estimated
within
lines
using
the
following
mixed
model:
Where:
Abj
kim
=
the
Ab
titer
of
the
mth
chick,
p
=
a
constant,
generation
i
=
the
fixed
effect
of
the
ith
generation
(9,
10),
sex
j
=
the
fixed
effect
of
the
jth
sex
of
the
chick,
line
k
=
the
fixed
effect
of
the
kth
line
(H,
C,
L),
MHC!1
=
the
fixed
effect
of
the
lth
MHC
genotype
within
the
kth
line,
Uijklm =
the
random
additive
genetic
effect
on
the
Ab
titer
in
the
mth
chick
and
eijklm
=
a
random
error.
The
fixed
effect
of
generation
accounted
for
environmental
differences
between
generations
9
and
10.
The
sex
effect
corrected
for
a
higher
Ab
response
to
SRBC
in
females
than
in
males.
Relationships
between
individuals
from
the
10
generations
and
Ab
data
of
the
9th
and
10th
generations
were
used
in
this
study.
The
mixed
model
was
applied
assuming
a
heritability
of
0.31,
as
estimated
previously
(Pinard
et
al,
1992).
Solutions
for
the
model
were
obtained
using
the
PEST
program
(Groeneveld,
1990;
Groeneveld
and
Kovak,
1990),
which
is
a
generalized
procedure
to
set
up
and
solve
systems
of
mixed model
equations
containing
genetic
covariances
between
observations.
Differences
between
genotypes
within
lines
were
tested
as
orthogonal
contrasts
using
the
F
test
values
as
estimated
by
PEST.
The
overall
effect
of
genotypes
in
a
line
was
estimated
by
testing,
jointly
against
the
error
variance
term
Q
e, n -
1
independent
differences
between
genotypes,
with n
being
the
number
of
genotypes
in
the
line.
Heterozygote
superiority
was
estimated
within-line
for
each
available
combina-
tion
of
haplotypes
by
testing
the
difference
between
the
heterozygote
genotypes
and
the
average
of
their
homozygous
counterparts.
The
overall
heterozygote
supe-
riority
in
a
line
was
estimated
by
testing
the
difference
between
these
heterozygote
genotypes
and
the
average
of
their
homozygous
counterparts.
The
effect
of
haplotype
i
was
estimated
within-line
by
testing
the
difference
between
genotype
combinations
comprised
of
the
haplotype
i and
their
counterparts
.
,
.,
,
.
!
rn -
Sj(Geno!-Geno!)
.)
comprised
of
a
reference
haplotype
r,
as
following:
E! (Geno2! - Geno,.! ) !
with
p
Geno
ij
,
and
Geno
rj
being
the
estimated
effects
of
MHC
genotypes
comprised
of
haplotypes
i
and
j,
and
r and
j,
respectively,
and
p
being
the
number
of
pairwise
combinations.
RESULTS
MHC
distribution
in
the
different
lines
Frequencies
of
MHC
genotypes
and
haplotypes
in
the
9th
and
10th
generations
for
the
H,
C
and
L
lines
are
given
in
tables
I
and
II,
respectively.
Frequencies
of
genotypes
and
haplotypes
were
significantly
(P
<
0.01)
different
between
lines
in
the
9th
and
in
the
10th
generation.
In
the
C
line,
all
10
possible
genotypes
were
present,
with,a
predominance
of
the
119-124
B-genotype,
and
the
119
and
124
B-haplotypes
were
prevalent.
The
distribution
of
MHC
genotype
and
of
MHC
haplotype
in
the
H
line
was
opposite
to
those
in
the
L
line The
121-121
B-genotype
predominated
in
the
H
line,
whereas
the
114-114
and
114-124
B-genotypes
were
most
frequent
in
the
L
line.
In
the
H
line,
the
121
B-haplotype
frequency
reached
79%
at
the
expense
of
the
114
B-haplotype,
which
tended
to
disappear.
On
the
contrary,
the
121
B-haplotype
disappeared
between
the
8th
and
the
9th
generation
in
the
L
line
(data
not
shown).
In
the
L
line,
the
114
B-haplotype
was
found
most
compared
to
the
124,
and
especially
the
119
B-haplotypes.
Heterozygous
birds
were
in
the
majority
in
the
C
line,
whereas
homozygous
birds
were
most
frequent
in
the
H
line
and
to
a
lesser
extent
in
the
L
line.
This
tendency
was
more
pronounced
in
the
10th
generation.
Estimation
of MHC
genotype
effects
on
the
Ab
response
Estimates
of
MHC
genotype
effects
on
the
Ab
response
to
SRBC
are
given
in
table
III.
The
overall
effect
of
MHC
genotypes
was
greater
in
the
selected
lines
than
in
the
C
line,
and
the
total
genetic
variance
explained
by
MHC
genotypes
was
greater
in
the
H and
C
lines
than
in
the
L
line.
This
high
genetic
variance
in
the
H
line
arose
from
extreme
estimate
values
of
the
114-124,
119-119
and
124-124
B-genotypes
despite
their
low
frequency
value.
The
ranking
of
genotypes
according
to
their
estimates
of
effects
on
the
Ab
titer
differed
between
lines,
especially
between
the
C
line
and
the
H
line.
No
significant
changes
in
the
estimates
were
observed
when
taking
other
input
values
for
heritability
between
0.2
and
0.4
(data
not
shown).
of heterozygote
superiority
Estimates
of
heterozygote
superiority
for
each
available
combination
and
overall
lines
are
given
in
table
IV. In
the
C
line,
a
moderately
positive
general
effect
of
heterozygous
genotypes
was
demonstrated.
This
positive
effect
appeared
in
the
119-
124
B-genotype,
and
was
marked
in
the
121-124
B-genotype.
In
the
L
line,
a
general
heterozygous
disadvantage
was
non-significant.
This
negative
effect,
however,
was
significant
only
for
the
114-124
B-genotype.
In
the
H
line,
not
all
the
heterozygous
combinations
could
be
evaluated
because
of
missing
genotypes.
In
the
H
line,
there
was
a
significant
negative
effect
of
heterozygous
genotypes
overall,
and
of
the
121-
124
and
the
119-124
B-genotypes.
’
Estimation
of MHC
haplotype
effects
on
the
Ab
response
In
the
C
and
L
lines,
all
possible
combinations
of
haplotypes
were
present.
Therefore,
in
these
lines,
the
choice
of
a
reference
haplotype
did
not
affect
either
the
ranking,
or
the
value
of
the
differences
between
haplotype
estimates.
Results
are
presented
in
table
V
taking
the
119
B-haplotype
as
the
reference.
In
the
H
line,
haplotype
effects
were
not
estimated
because
it
was
not
possible
to
write
a
linear
combination
of
genotypes,
which
would
estimate
the
difference
between
2
haplotypes.
The
estimated
Ab
titer
of
the
114
B-haplotype
was
significantly
lower
than
the
estimate
of
the
119
B-haplotype
in
the
L
line
(table
V).
In
the
C
line,
the
estimated
Ab
titer
of the
114
B-haplotype
was
significantly
lower
than
the
estimates
of
the
121
and
124
B-haplotypes
in
the
C line.
Relationship
between
the
effects
of
MHC
types
on
antibody
response
and
their
frequency
To
determine
whether
the
differences
in
MHC
genotype
and
haplotype
distribution
between
the
lines
could
be
explained
by
differences
in
genotype
or
haplotype
effect
on
the
selected
trait,
frequencies
of
MHC
types
and
their
estimated
effects
on
the
Ab
titer
were
compared.
When
not
considering
the
extreme
values
of
rare
genotypes
in
the
H
line,
remaining
genotype
estimated
effects
were
not
significantly
different
from
each
other;
therefore,
results
from
the
estimation
of
MHC
genotype
effect
on
the
Ab
response
from
the
H
line
will
not
be
considered.
The
ranking
of
estimates
of
haplotype
effects
on
the
Ab
response
in
the
L
line
(table
V),
was
in
total
agreement
with
the
distribution
of
these
haplotypes
in
the
selected
lines
(table
II).
Likewise,
the
ranking
of
the
114,
119
and
121
B-haplotype
effects
estimated
in
the
C
line
could
explain
the
haplotype
distribution
in
the
selected
lines.
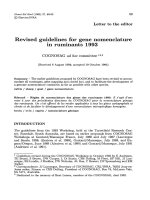
Genotypes
which
were
most
frequent
in
the
L
line
had
also,
on
the
whole,
lower
effects
on
the
Ab
response
than
genotypes
which
were
rare
in
the
L
line,
as
estimated
in
the
L
line
(fig
1)
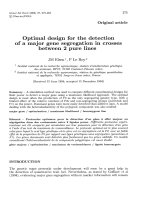
and
in
the
C
line
(fig
2).
Genotypes
which
were
most
frequent
in
the
L
line
had
globally
lower
effects
on
the
Ab
response
in
the
C
line
than
genotypes
which
were
most
common
in
the
H
line
(fig
2).
The
major
exception
was
the
121-121
B-genotype
which
was
most
frequent
in
the
H
line,
but
had
a
low
effect
on
the
Ab
response
in
the
C line
(fig
2).
In
conclusion,
estimation
on
MHC
genotype
and
haplotype
effects
on
the
Ab
response
in
the
C
and
L
line
could
explain
the
observed
distribution
of
MHC
types
in
the
L
line
and
only
partly
those
observed
in
the
H
line.
DISCUSSION
Changes
of
gene
frequency
may
be
due
to
genetic
drift,
difference
in
fitness
of
certain
genotypes,
or,
in
case
of
selection,
to
direct
effect
or
linkage
with
genes
affecting
the
selected
trait
(Falconer,
1989).
Even
after
10
generations,
genetic
drift
is
not
likely
to
explain
such
dramatic
changes
of
MHC
type
frequency
in
opposite
directions.
Moreover,
previous
genetic
analysis
of 9
generations
did
not
show
any
apparent
genetic
drift,
and
inbreeding,
which
affects
genetic
drift,
was
low
(Pinard
et
al,
1992).
Associations
between
MHC
types
and
fitness
traits
have
been
demonstrated
in
avian
(Gavora
et
al,
1986;
Nordskog
et
al,
1987)
and
mammalian
species
(Melnick
et
al,
1981;
f!stergard
et
al,
1989;
Gautschi
and
Gaillard,
1990).
Therefore,
a
possible
effect
of
natural
selection
cannot
be
excluded.
This,
however,
cannot
explain
the
opposite
changes
in
MHC
type
distributions
in
the
H and
L
lines,
as
compared
to
the
C
line.
The
significant
differences
in
effect
of
the
MHC
genotype
on
the
selected
trait
are
evidence
for
a
direct
or
closely
linked
effect
of
MHC
genes
on
the
Ab
response
to
SRBC.
The
MHC
type
frequencies
were
not
measured
in
the
initial
base
population
or
in
the
first
generations
of
selection.
However,
the
control
line
was
produced
from
the
base
population
by
random
mating
and
displayed
in
the
10th
generation
all
haplotype
combinations,
whereas
the
selected
lines
presented
divergent
distributions
.
of
MHC
types.
Given
the
relatively
low
level
of
inbreeding
in
the
C
line,
it
thus
seems
reasonable
that
the
frequencies
in
the
C
line
represent
the
distribution
of MHC
types
in
the
base
population,
and
that
the
MHC
type
frequencies
have
changed
in
the
selected
lines.
Changes
in
MHC
gene
frequency,
or
at
least,
differences
in
MHC
type
distribu-
tions
between
lines
selected
for
immune
responsiveness
or
disease
resistance
have
been
reported
(Gavora
et
al,
1986;
Heller
et
al,
1991).
In
a
similar
experiments
to
ours
with
chickens
selected
for
high
and
low
immune
response
to
SRBC,
differences
in
allelic
frequency
in
6
alloantigen
systems
including
the
B-system
were
found
in
an
analysis
of
data
from
generations
10
to
13
(Dunnington
et
al,
1984;
Martin
et
al,
1990).
Interestingly,
these
authors
reported
that
the
most
frequent
B-haplotype
in
the
H
line
was
the
21,
which
shares
B-F
antigens
with
the
121
B-haplotype,
which
was
also
predominant
in
our
H
line
(Pinard
and
Hepkema,
1992).
Typing
for
MHC
antigens
in
lines
of
mice
divergently
selected
for
Ab
response
to
SRBC
(Biozzi
et
al,
1979)
also
revealed
2
distinct
haplotypes
in
the
2
lines
(Colombani
et
al,
1979).
Estimation
of
MHC
genotype
effect
and
of
heterozygote
advantage
produced
different
results
between
the
lines.
Immune
responsiveness
to
various
antigens
like
SRBC
has
been
demonstrated
to
be
influenced
by
non-MHC
as
well
as
by
MHC
genes
(Palladino
et
al,
1977;
Gyles
et
al,
1986;
Kim
et
al,
1987;
Lamont
and
Dietert,
1990).
Significant
interactions
between
MHC
and
the
selected
background
genome
were
also
reported
in
a
similar
selection
experiment
to
ours
(Dunnington
et
al,
1989).
In
addition,
specific
heterozygote
advantage
may
result
from
genetic
complementation
between
both
MHC
and
non-MHC
genes.
In
segregating
populations,
the
estimation
of single
gene
effects
can
lead
to
biased
results
because
of
the
likely
confounding
effects
between
the
marker
gene
and
the
polygenes
(Bentsen
and
Klemetsdal,
1991).
Selection
is
an
extra
source
of bias
because
the
birds
being
selected
are
likely
sharing
advantageous
alleles
for
both
the
marker
gene
and
the
polygenes.
Kennedy
et
al
(1992)
showed
that
unbiased
estimates
of
a
single
gene
effects
can
be
obtained
by
mixed model
analysis
from
a
selected
population
if
all
the
genotypes
are
known.
In
our
experiment,
the
genotypes
were
not
determined
in
the
early
generations.
And
we
chose
to
use
the
data
complete
for
both
the
Ab
titer
and
the
genotypes
from
the
last
2
generations,
instead
of
using
data
from
all
generations
with
an
unknown
genotype.
Indeed,
Carnier
and
Arendonk
(1992)
demonstrated
by
simulation
that
including
observations
in
previous
generations
of
which
genotype
information
was
missing
resulted
in
larger
biases.
In
our
estimation,
bias
due
to
selection
could
not
be
eliminated
by
the
use
of
the
complete
relationship
matrix
only.
This
bias
might
have
contributed
to
the
differences
in
genotypic
effects
observed
between
the
lines.
The
present
and
previous
results
(Pinard
et
al,
1992)
are
in
agreement
with
a
polygenic
control
of
antibody
response
to
SRBC.
Moreover,
one
of
the
loci
involved
might
be
part
of,
or
linked
to,
the
B-complex.
However,
the
linkage
and
the
nature
of
the
interactions
between
MHC
or
MHC-linked
genes
and
other
immune
response
genes
are
not
known.
Besides,
during
10
generations
of
multiple
matings,
recombinations
between
MHC-linked
and
other
immune
response
genes
might
have
occurred,
causing
altered
linkage
(Pevzner
et
al,
1978;
Lamont;
1989).
In
conclusion,
results
of
the
estimation
of
MHC
effect
from
selected
populations
should
be
considered
with
caution,
especially
when
the
genotypes
are
not
known
in
all
the
generations.
In
our
experiment,
estimation
of
MHC
effect
may
be
obtained
from
the
control
line,
providing
a
larger
number
of
birds.
Alternatively,
one
could
study
a
F2
population
that
will
be
produced
from
the
high
and
low
lines.
REFERENCES
Bacon
LD
(1987)
Influence of
the
major
histocompatibility
complex
on
disease
resistance
and
productivity.
Poultry
Sci
66,
802-811
Bentsen
HB,
Klemetsdal
G
(1991)
The
use
of
fixed
effects
models
and
mixed
models
to
estimate
single
gene
associated
effects
on
polygenic
traits.
Genet
Sel
Evol
23,
407-419
Biozzi
G,
Mouton
D,
Heumann
AM,
Bouthillier
Y,
Stiffel
C,
Mevel
JC
(1979)
Genetic
analysis
of
antibody
responsiveness
to
sheep
erythrocytes
in
crosses
between
lines
of
mice
selected
for
high
or
low
antibody
synthesis.
Immunology
36,
427-438
Carnier
P,
Arendonk
JAM
(1992)
Estimation
of
effects
of
single
genes
on
quantita-
tive
traits
in
populations
under
selection.
A
simulation
study.
In:
Proc
43rd
Annu
Meet
EAAP.
Madrid,
13-17
September
1992
1,
156
Colombani
MJ,
Pla
M,
Mouton
D,
Degos
L
(1979)
H-2
typing
of
mice
genetically
selected
for
high
or
low
antibody
production.
Immunogenetics
8,
237-243
Dunnington
EA,
Briles
RW,
Briles
WE,
Gross
WB,
Siegel
PB
(1984)
Allelic
frequencies
in
eight
alloantigen
systems
of
chicken
selected
for
high
and
low
antibody
response
to
sheep
red
blood
cells.
Poultry
Sci
63,
1470-1472
.Dunnington
EA,
Martin
A,
Briles
RW,
Briles
WE,
Gross
WB,
Siegel
PB
(1989)
Antibody
response
to
sheep
erythrocytes
for
White
Leghorn
chickens
differing
in
haplotypes
of
the
major
histocompatibility
complex
(B). Anim
Genet
20,
213-216
Falconer
DS
(1989)
Introduction
to
Quantitative
Genetics.
Longman
Scientific
and
Technical,
New
York,
3rd
edn
Gautschi
C,
Gaillard
C
(1990)
Influence of
major
histocompatibility
complex
on
reproduction
and
production
traits
in
swine.
Anim
Genet
21,
161-170
Gavora
JS
(1990)
New
directions
in
poultry
genetics.
Disease
genetics.
In:
Poultry
Breeding
and
Genetics
(Crawford
RD,
ed)
Elsevier,
805-846
Gavora
JS,
Simonsen
M,
Spencer
JL,
Fairfull
RW,
Gowe
RS
(1986)
Changes
in
the
frequencies
of
major
histocompabitility
haplotypes
in
chickens
under
selection
for
both
high
egg
production
and
resistance
to
lVlarek’s
disease.
J
Anim
Breed
Genet
103,
218-226
Groeneveld
E
(1990)
PEST
User’s
Manual.
Illinois
Univ,
Urbana,
IL
Groeneveld
E,
Kovac
M
(1990)
A
generalised
computing
procedure
for
setting
up
and
solving
mixed
linear
models.
J
Dairy
Sci
73,
513-531
Gyles
NR,
Fallah-Moghaddam
H,
Patterson
LT,
Skeeles
JK,
Whit
f
ill
CE,
Johnson
LW
(1986)
Genetic
aspect
of
antibody
response
in
chickens
to
different
classes
of
antigens.
Poultry
Sci
65,
223-232
Heller
ED,
Uni
Z,
Bacon
LD
(1991)
Serological
evidence
for
major
histocompatibil-
ity
complex
(B
complex)
antigens
in
broilers
selected
for
humoral
immune
response.
Poultry
Sci
70,
726-732
Kennedy
BW,
Quinton
M,
van
Arendonk
JAM
(1992)
Estimation
of
effects
of
single
genes
on
quantitative
traits.
J
Anim
Sci
70,
2000-2012
Kim
CD,
Lamont
SJ,
Rothschild
MF
(1987)
Genetic
association
of
body
weight
and
immune
response
with
the
major
histocompability
complex
in
White
Leghorn
chicks.
Poultry
Sci
66,
1258-1263
Lamont
SJ
(1989)
The
chicken
major
histocompatibility
complex
in
disease
resis-
tance
and
poultry
breeding.
J
Dairy
Sci
72,
1328-1333
Lamont
SJ,
Dietert
RR
(1990)
New
directions
in
poultry
genetics.
Immunogenetics.
In:
Poultry
Breeding
and
Genetics
(Crawford
RD,
ed)
Elsevier,
Amsterdam,
497-
541
Mallard
BA,
Kennedy
BW,
Wilkie
BN
(1991)
The
effect
of
swine
leukocyte
antigen
haplotype
on
birth
and
weaning
weights
in
miniature
pigs
and
the
role
of
statistical
analysis
in
this
estimation.
J
Anim
Sci
69,
559-564
Martin
A,
Dunnington
EA,
Gross
WB,
Briles
WE,
Briles
RW,
Siegel
PB
(1990)
Production
traits
and
alloantigen
systems
in
lines
of
chickens
selected
for
high
or
low
antibody
responses
to
sheep
erythrocytes.
Poultry
Sci
69,
871-878
Melnick
M,
Jaskoll
T,
Slavkin
HC
(1981)
The
association
of
H-2
haplotype
with
implantation,
survival,
and
growth
of
murine
embryos.
Immunogenetics
14,
303-308
Nordskog
AW,
Pevzner
IY,
Lamont
SJ
(1987)
Subregions
and
functions
of
the
chicken
major
histocompatibility
complex.
Poultry
Sci
66,
790-794
0stergard
H,
Kristensen
B,
Andersen
S
(1989)
Investigations
in
farm animals
of
associations
between
the
MHC
system
and
disease
resistance
and
fertility.
Livest
Prod
Sci
22,
49-67
.
Palladino
MA,
Gilmour
DG,
Scafuri
AR,
Stone
HA,
Thorbecke
GJ
(.1977)
Immune
response
differences
between
two
inbred
chickens
lines
identical
at
the
major
histocompatibility
complex.
Immunogenetics
5,
253-259
Pevzner
IY,
Trowbridge
CL,
Nordskog
AW
(1978)
Recombination
between
genes
coding
for
immune
response
and
the
serologically
determined
antigens
in
the
chicken
B
system.
Immunogenetics
7,
25-33
Pinard
MH,
Hepkema
BG
(1992)
Biochemical
and
serological
identification
of
ma-
jor
histocompatibility
antigens
in
outbred
chickens.
In:
Selection
for
Immunore-
sponsiveness
in
Chickens:
Effects
of
the
Major
Histocompatibility
Complex
and
Resistance
to
Marek’s
Disease.
Ph
D
Diss,
Univ
Wageningen,
The
Netherlands,
43-59
Pinard
MH,
Hepkema
BG,
van
der
Meulen
MA,
Nieuwland
MGB,
van
der
Zijpp
AJ
(1991)
Major
histocompatibility
complex
haplotypes
in
chickens
selected
for
high
and
low
antibody
production.
Anim
Genet
22
(supp
1),
117-118
Pinard
MH,
van
Arendonk
JAM,
Nieuwland
MGB,
van
der
Zijpp
AJ
(1992)
Divergent
selection
for
immune
responsiveness
in
chicken:
estimation
of
realized
heritability
with
an
animal
model.
J
Anim
Sci
70:
2986-2993
Van
der
Zijpp
AJ,
Blankert
JJ,
Egberts
E,
Tilanus
MGJ
(1988)
Advances
in
genetic
disease
resistance
in
poultry.
In:
Advances
in
Animal
Breeding
(Korver
S,
van
der
Steen
HAM,
van
Arendonk
JAM,
Bakker
H,
Brascamp
EW,
Dommerholt
J,
eds)
Pudoc,
Wageningen,
The
Netherlands,
131-138
Warner
CM,
Meeker
DL,
Rothschild
1!-TF
(1987)
Genetic
control
of
immune
respon-
siveness:
a
review
of
its
use
as
a
tool
for
selection
for
disease
resistance.
J
Anim
Sci
64, 394-406