Báo cáo sinh học: "Effects of major histocompatibility complex on antibody response in F 1 and F 2 crosses of chicken lines" ppt
Bạn đang xem bản rút gọn của tài liệu. Xem và tải ngay bản đầy đủ của tài liệu tại đây (693.14 KB, 14 trang )
Original
article
Effects of
on
major histocompatibility
complex
antibody response in F and F
2
1
crosses
of chicken lines
AJ Van der
MH Pinard
Zijpp
1
2
Wageningen Agricultural University,
Departement of Animal Hv,s6andry, Wageningen;
DLO-Research Institute for Animal Production "Schoonoord",
Zeist, The Netherlands
(Received
12
May 1992; accepted
5
January 1993)
Summary - Lines of chickens selected for 9 generations for high (H) and low (L) antibody
(Ab) response to sheep red blood cells (SRBC) were crossed to produce F 761) and
(n
1
(n
2
F 1033) populations. All animals were typed for major histocompatibility complex
(MHC) B-types. Effects of MHC genotypes and haplotypes on the Ab titer to SRBC were
=
=
estimated. The MHC genotypes and remaining genotype explained 2.5% and 31% of the
total variation of the Ab titer in the F respectively. Estimates of MHC effects in the
2
2
F were similar to estimates in the selected lines. The 119 and 121 B-haplotypes were
associated with a significantly higher response than the 114 and 124 B-haplotypes. These
results confirm the hypothesis that changes in B-type distribution observed in the selected
lines could be related to a direct or closely linked effect of MHC on the immune response.
chicken
/
humoral response
/
selection
/
cross
/ major histocompatibility complex
Résumé - Effets du complexe majeur d’histocompatibilité sur la réponse en anticorps
dans des croisements F et F de lignées de poules. Des lignées de poules, sélectionnées
2
I
pendant 9 générations sur la réponse humorale haute et basse à des globules rouges de
l
2
mouton, ont été croisées afin de produire une F (n = 761) et une F (n
10,!,!). Tous
les animau! ont été analysés pour leurs types B du complexe majeur d’histocompatibilité
(CMH). Les effets des génotypes et des haplotypes du CMH sur la réponse en anticorps
aux globules rouges de mouton ont été estimés. Le génotype du CMH explique 2,5% de la
variation totale de la réponse en anticorps dans la F alors que l’héritabilité du caractère
,
2
=
*
Agronomique, Laboratoire de
correspondence and reprints should be sent
On leave from the Institut National de la Recherche
G6n6tique Factorielle, Jouy-en-Josas,
to the French address.
France:
est de
0,,!1. Les
estimations des effets du CMH dans la F sont semblables à celles obtenues
2
lignées sélectionnées. Les haplotypes B 119 et B 121 sont associés à une réponse
immunitaire significativement plus élevée que les haplotypes B 114 et 124. Ces résultats
confirment l’hypothèse que les changements de fréquence des types du CMH observés dans
les lignées sélectionnées pouvaient être dus à un effet direct ou génétiquement lié du CMH
sur la réponse immunitaire.
dans les
poule / réponse immunitaire /
compatibilité
sélection
/
croisement
/ complexe majeur
d’histo-
INTRODUCTION
There is accumulating evidence that disease resistance and immune response are
under genetic control in most species, providing the bases for an improvement
by direct selection for the trait of interest; moreover, the use of markers might
add to the efficiency of selection (Shook, 1989; Weller and Fernando, 1991).
But in the latter option, relationships between marker genes and the trait of
interest have to be clearly established. Studies on relationships between major
histocompatibility complex (MHC) types and immune traits or disease resistance
have shown variability in strength and nature of association (Schierman and Collins,
1987; Van der Zijpp and Egberts, 1989). Inconsistencies might be due to several
reasons: a) the MHC does not directly affect the trait and some crossing over
has occurred between the MHC and immune response genes, so that the apparent
effect of 1VIHC on the immune trait depends on the linkage phase between MHC
genes and immune response genes; b) the MHC is directly involved but there
are epistatic effects with other background genes and/or significant genotypeenvironment interactions; c) only a few MHC types are present per study, so
that the same haplotypes differ in relative performance (good or poor) in different
populations; d) different and even inappropriate statistical methods might have
been used, especially when animals are related.
High (H) and low (L) lines of chickens have been produced by divergent selective
breeding for primary antibody response to sheep red blood cells (SRBC) (Van der
Zijpp et al, 1988; Pinard et al, 1992). After 10 generations, the H and L lines
revealed a diverging distribution in MHC types, compared to the random control
line; moreover, MHC types were responsible for a significant part of variation of the
immune response (Pinard et al, 1993). However, MHC genotypes were not know in
early generations so that estimates of the MHC effect might be biased, even when
using all family information (Kennedy et al, 1992). Moreover, the number of animals
for some genotypes was limited. Therefore, a study involving crosses between the
H and L lines was required to confirm the MHC association.
The objectives of this experiment were to produce F and F crosses from lines
I
2
of chickens selected for high and low antibody response to SRBC, and to estimate
the MHC genotype and haplotype effects on the immune response against a random
background.
MATERIALS AND METHODS
Crossing
of selected lines
Chickens were selected from an ISA Warren cross base population, for high (H) or
low (L) total antibody (Ab) titer 5 d postprimary immunization with 1 ml 25%
sheep red blood cells (SRBC) at 37 d of age (Van der Zijpp et al, 1988; Pinard
et al, 1992). From the 9th generation, 26 males and 55 females of the H line were
mated with 53 females and 31 males of the L line, respectively, to produce 761 F
i
animals. From the F population, 243 females and 202 males were used to produce
1
1 033 F chicks. Parents of the F and F populations were chosen from as many
Z
1
Z
different families as possible, and were mated at random, providing in F2 ! 100
chicks for each of the 10 MHC genotypes (see below). Immunization with SRBC
was performed on F and F animals identically as in the selected lines, and Ab
I
2
titers against SRBC 5 d postprimary immunization were recorded. The vaccination
schedule applied to F and F chicks was identical to the one used during the
I
2
selection. However, the housing system and environment differed: birds from the H
and L lines were reared in cages of 50 per 100 em with 10 chicks maximum per
2
1
Z
cage on one farm; F and F birds were housed free on the floor on 2 different
farms, respectively.
Typing
for MHC
haplotype
Major histocompatibility complex haplotypes were determined by direct haemagglutination, using alloantisera obtained from the lines. Four serotypes, provisionally
called B B1l B and B were identified previously in the selected lines.
124
,,,
1l4 9 121
As compared to known reference B-types, none of the serotypes identified in the
lines was identical for both B-F and B-G. Only B1 and B11 showed similarities
l4
9
14
121
for B-G with B and B respectively, whereas B showed similarities for B-F
,
19
with B (Pinard et al, 1991; Pinard and Hepkema, 1992). A MHC genotype was
21
defined as the combination of 2 haplotypes. Serological typing was performed on all
the F and F chicks and segregation of the haplotypes was checked for consistency
1
2
within families; inconsistent data (3% of the data) were removed from the analysis.
Statistical
analysis
Effects of MHC genotype on the Ab response
populations, using the following mixed model:
were
estimated in the F and F
I
2
Where :
ijk
Ab
=
p
=
i
sex
=
MHC!
U2!!
e2!!
=
=
=
the Ab titer of the kth chick,
a constant,
the fixed effect of the ith sex of the chick,
the fixed effect of the jth MHC genotype,
the random additive genetic effect on the Ab titer in the kth chick and
a random error.
The sex effect corrected for a higher Ab response to SRBC in females than in
males. All relationships from the base population until the F and F crosses were
I
2
used in the analysis of the F and F data, respectively. The mixed model was
1
2
applied assuming a heritability of 0.31, as estimated previously from data of all
lines (Pinard et al, 1992). Solutions for the model were obtained using the PESTprogram (Groeneveld, 1990; Groeneveld and Kovac, 1990), which is a generalized
procedure to set up and solve systems of mixed model equations containing genetic
covariances between observations.
Differences between genotypes within lines were tested as orthogonal contrasts by
an F-value calculated by PEST, which allows use of all relations between animals.
The overall effect of genotypes was estimated by testing, jointly, n-1 independent
differences between genotypes, with n being the number of genotypes.
Heterozygote superiority was estimated for each available combination by testing the difference between the heterozygote genotypes and the average of their
homozygous counterparts. The overall heterozygote superiority was estimated by
testing the difference between all the heterozygote genotypes and the average of
their homozygous conterparts.
The haplotype effect was estimated by 3 methods. In method I, the effect of
haplotype i was estimated by testing the difference between genotype combinations,
comprised of the haplotype i and their counterparts, comprised of a reference
.
,,
as
follows:
E,(GeTtOt,—G’eTtOr,)
E! (Geno2! - comprised
Geno,.! )
,
!
,
!
,
..
with Geno2! and Geno being the
rj
estimated effects of MHC genotypes
of haplotypes i and j, and r and j,
respectively, and p being the number of pairwise combinations. Methods II and III
were applied in the following haplotype models, as adapted from 0stergard (1989):
e
typ
lo
p
har,
where ( is the linear regression coefficient on Haplo!, which is the number of the
j
3
jth MHC haplotype (2 homozygous, 1 heterozygous or 0 absent) in the lth
k
chick, r is the linear regression coefficient on Comb which is the kth heterozygous
,
k
combination, and all the other terms are as previously described.
In the F cross, only Method I was applied, whereas all 3 methods were compared
I
in the F population, which provided all possible haplotype combinations in similar
2
numbers of animals.
=
=
=
RESULTS
Antibody
titer distribution in the
i
F and F populations
2
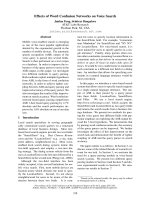
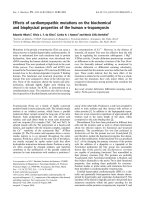
titer distributions in the H and L lines of the 9th generation and in the
crosses are shown in figure 1, and mean titers are given in table I. The F
i
cross did not show any positive heterosis effect, and the titer of the cross between
L line females and H line males was even lower (5.85) than the mean parent value
2
I
(9.06). The Ab titers appeared to be more normally distributed in the F and F
Antibody
1
F and F
2
crosses than in the selected lines, but the
variation of titers than the F cross.
1
MHC distribution in the F and F
i
2
2
F population did
not show
a
greater
populations
Numbers of animals per MHC genotype in the F, and F crosses are given in
2
table II. Sexes were equally represented in each class. It was not possible to obtain
homozygous 121-121 animals in the F, cross because the 121 B-haplotype was not
present in the L line of the 9th generation (Pinard et al, 1993).
Estimation of MHC genotype effects
on
the
antibody
response
Estimates of MHC genotype on the Ab response to SRBC in F and F animals
i
2
are given in table III. The overall effect of MHC genotypes was greater in the F
2
than in the F population. The range of estimates was higher in the F than in
1
1
the F population, but the SE of differences between genotypes were half as large
2
in the F as they were in the F cross. The ranking of genotypes according to
I
2
their Ab titer estimates did not differ greatly between the 2 populations; only the
124-124 and the 114-121 B-genotypes showed.relatively low estimates, and the 119119 B-genotype a relatively high estimate in the F compared to those in the F
I
2
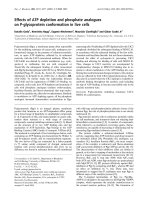
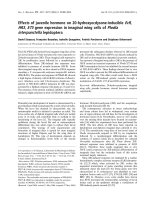
animals. No significant changes in the estimate were observed when taking other
,
2
input heritability values between 0.2 and 0.4 (data not shown). In the F the
distributions of Ab titers within genotypes were normal and ranged between those
of the 114-124 and 119-121, as shown in figure 2.
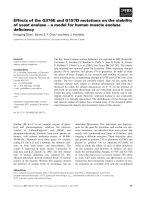
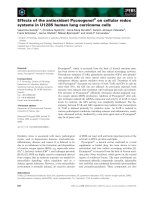
the Ab response to SRBC estimated in the
H, C and L lines (Pinard et al, 1993) are
shown in figure 3. Results obtained from the F were more in agreement with those
2
of obtained from the selected lines than from the C line.
The relative importance of the MHC genotype and the remaining genotype on
the variation of the Ab titer in the F were calculated by comparing the coefficients
2
of determination using different models (table IV). When used alone in the model,
the MHC genotype explained only 4.4% of the total variation, which could still be
the result of partial confounding effects between MHC genotype and the effects of
the sex and of U!. It is, therefore, better to look at the difference in R between a
z
full model with and without MHC effect. Including MHC effect in the full animal
model increased the variation explained by an additional 2.5%. The Rvalue of
2
Comparisons
of genotype effects
2
F with their effects estimated
on
in the
31.1 when
k
putting only U
as an
effect
was
close to the input
heritability (0.31)
as
expected.
Estimation
of heterozygote superiority
In the F population, no significant effect of heterozygote superiority, overall or
I
for any available combination, was found (data not shown). No significant effect of
overall heterozygote superiority was shown in F animals either (table V); however,
2
the 114-124 and 119-121 B-genotypes demonstrated a significant heterozygous
disadvantage and advantage, respectively.
Estimation of MHC
haplotype effects
on
the
antibody
response
Results of the estimation of MHC haplotype effect in the Ab titer in the F and F
I
2
I
populations, using Method I, are given in table VI. In the F population, the 119
B-haplotype was significantly associated with the highest estimate, whereas in
the F animals, the estimated Ab titers of the 119 and 121 B-haplotypes were
2
significantly higher than for the 114 and 124 B-haplotypes. As compared to the
results obtained with Method I, using Method II in the F population did not
2
significantly change the relative values of haplotypes. Haplotype effects estimated
by Method III were in fact equivalent to the additive effects of haplotypes, which
could be obtained from the estimated effects of the corresponding homozygous
_genotype combinations; and the specific heterozygous combination effects (Comb
)
k
were simply equal to the heterozygous effects as given in table V (data not shown).
DISCUSSION
When parental lines are crossed, the amount of heterosis shown by the F may
1
be defined as its deviation from the mid-parent value (Falconer, 1989). Crossing
effects are due to differences in the allelic frequencies between the 2 parental
lines. In this experiment, the 2 lines that were crossed came from the same base
population. However, after 9 generations of selection, they differed greatly for MHC
haplotype frequency and probably for other immune response genes associated with
the response to SRBC (Pinard et al, 1993). No heterosis was demonstrated here.
Nevertheless, the reciprocal crosses showed similar Ab titer values although their
respective mid-parent values differed, indicating maternal or sex-linked effects.
When crossing lines of mice at their selection limit for Ab response to SRBC,
positive heterosis was shown and was interpreted as partial dominance of the
character high responder (Biozzi et al, 1979). In a similar experiment with White
Leghorn chickens, crossing of lines, which were selected for high and low Ab response
SRBC, showed a positive heterosis effect after 3 generations of selection (Siegel
and Gross, 1980), but no heterosis effect was shown after 9 generations (Ubosi et
al, 1985). In our lines, environmental effects were responsible for more than 2 titer
points of variation in Ab titer during the selection (Pinard et al, 1992). Therefore,
selected lines and F should not be compared on their phenotypic values because
I
to
they
were
kept
in 2
separate environments.
bias in estimates of genotype effects from selected lines
et al, 1993), an F was produced. In fact, results
2
of estimation of genotype effects in the F were more similar to the estimated
2
effects in the selected lines than in the C line (fig 3), giving credibility to the
analysis performed in the selected lines. The average genetic value of the C line, as
measured by the mean estimated breeding value, did not change during the selection
,
2
(Pinard et al, 1992) and the C line displayed, as the F a random background.
However, the F background had a relatively great frequency of high and low
2
immune response genes, whereas the C background had low, average, and high
genes from the base population. Thus, besides the fact that estimation of genotype
effects in the C line could be hampered by low numbers of animals, differences of
effects between the F and the C line may be interpreted as interaction between
2
MHC and other immune response genes. Moreover, linkage disequilibrium created
in the selected lines between MHC genes and linked immune response genes may
not have disappeared completely in the F
.
2
How do the results of the F contribute to the understanding of the role played
2
by MHC haplotypes during selection? In the Biozzi lines of mice at their selection
2
limit, analysis of the F cross showed that MHC haplotypes found in the H and the L
lines segregated, respectively, with a higher and a lower immune response (Mouton
et al, 1979). In our experiment, a selection limit was not reached. Nevertheless,
the MHC haplotypes most frequent in the L line (114 and 124) and in the H line
2
(119 and 121) were associated in the F with the lowest and highest Ab titer,
respectively. These results confirm the previous assumptions (Pinard et al, 1993)
that the changes of MHC type frequency observed in the selected lines were not the
result of chance, but could be explained by a direct or closely linked effect of MHC
types on the selected Ab response. However, the magnitude of MHC effects (2.5%
of the total variation) could not fully explain the interline difference.
Associations between MHC genes and the Ab response to SRBC have already
been shown in chickens (Scott et al, 1988; Loudovaris et al, 1990), mice (Mouton
et al, 1979) and miniature pigs (Mallard et al, 1989). Immunological knowledge of
MHC can support the hypothesis of a direct involvement: when injected, the Tdependent SRBC antigens are phagocytized and processed by macrophages, and
finally presented to T-helper cells, inducing, in collaboration with B-cells, the
production of Ab against SRBC (Biozzi et al, 1984). The T - B cell interaction
has been shown in chickens, as in mammalian species, to be MHC class II (B-L)
restricted as is the presentation of processed peptides to T-cells (Vainio et al, 1987).
Efficiency of the response may be related to the varied ability of MHC molecules
to bind and present antigens to T-cell receptors (Watts and Me Connell, 1987;
Buus et al, 1987), as combined to the T-cell repertoire (Grey et al, 1989). Finally,
Kaufman and Salomonsen (1992) proposed some models for a possible role of class
IV (B-G) genes in the selection of B-cells. Positive and negative complementation
Because of
(Kennedy
et
a
possible
al, 1992; Pinard
paths could explain, respectively, the heterozygous advantage and
observed for the combinations of the 2 best (119 and 121) and the 2
disadvantage
worst (114 and 124) B-haplotypes, regarding their effect on antibody response to
SRBC.
In the case of non-additivity of some MHC-linked genes, a genotype model should
be preferred because it is the most complete and allows parallel estimations of
the general and specific heterozygous effects. In the F all possible haplotype
,
2
combinations were present in a balanced design. This is often not the case; a
genotype model should be, then, also used to avoid the risk of having haplotype
effects completely dominated by one genotype. However, it can be of practical
interest to search for favorable alleles, for example in cattle breeding where only
sires are MHC-typed and extensively used, by using haplotype models such as type
II or adapted from this method (Batra et al, 1989; Lunden et al, 1990). Bentsen and
Klemetsdal (1991) proposed a haplotype model including a general heterozygous
effect but it is obvious that this hypothesis should be tested before being applied.
In the case of additivity, all 3 haplotype models would give the same estimate;
otherwise, the differences between models I and II will depend on the relative value
of heterozygous genotypes.
In conclusion, selecting for higher immune response may be achieved by choosing
the best specific haplotype combination in a particular genetic stock or line crosses.
In many species, it is not easy to utilize the non-additive genetic variation in
practice. The typical multiple-line cross, which is used in commercial poultry
breeding may, however, provide the necessary tool.
in these different
ACKNOWLEDGMENTS
The authors are grateful to M Nieuwland for his excellent technical
Arendonk for his useful comments on the manuscript.
help and thank J
van
REFERENCES
TR, Lee AJ, Gavora JS, Stear MJ (1989) Class I alleles of the bovine major
histocompatibility system and their association with economic traits. J Dairy Sci
Batra
72, 2115-2124
Bentsen HB, Klemetsdal G (1991) The use of fixed effects models and mixed models
to estimate single gene associated effects on polygenic traits. Genet Sel Evol 23,
407-419
Biozzi G, Mouton D, Heumann Am, Bouthillier Y, Stiffel C, Mevel JC (1979)
.Genetic analysis of antibody responsiveness to sheep erythrocytes in crosses between
lines of mice selected for high or low antibody synthesis. Immunology 36, 427-438
Biozzi G, Mouton D, Stiffel C, Bouthillier Y (1984) A major role of the macrophage
in quantitative genetic regulation of immunoresponsiveness and antiinfectious immunity. Adv Immvnol 36, 189-234
Buus S, Sette A, Colon SM, Miles C, Grey HM (1987) The relation between
major histocompatibility complex (MHC) restriction and the capacity of Ia to bind
immunogenic peptides. Science 235, 1353-1358
Falconer DS (1989) Introduction to Quantitative Genetics. Longman Scientific and
Technical, New York, 3rd edn
Grey HM, Sette A, Buus S (1989) How T cells see antigen. Sci Am Nov, 38-46
Groeneveld E (1990) PEST User’s Manual. Illinois Univ, Urbana, IL
Groeneveld E, Kovac M (1990) A generalised computing procedure for setting up
and solving mixed linear models. J Dairy Sci 73, 513-531
Kaufman J, Salomonsen J (1992) B-G: We know what it is, but what does it do?
Immunol Today 13, 1-3
Kennedy BW, Quinton M, van Arendonk JAM (1992) Estimation of effects of single
genes on quantitative traits J Anim Sci 70, 2000-2012
Loudovaris T, Brandon MR, Fahey KJ (1990) The major histocompatibility complex and genetic control of antibody response to sheep red blood cells in chickens.
Avian Pathol 19, 89-99
Lunden A, Sigurdard6ttir, Edfors-Lilja I, Danell B, Rendel J, Andersson L (1990)
The relationship between bovine major histocompatibility complex class II polymorphism and disease studied by use of bull breeding values. Anim Genet 21, 221232
Mallard BA, Wilkie BN, Kennedy BW (1989) Genetic and other effects on antibody
cell mediated immune response in swine leucocyte antigen (SLA)-defined miniature
pigs. Anim Genet 20, 167-178
Mouton D, Heumann AM, Bouthillier Y, Mevel JC, Biozzi G (1979) Interaction of
H-2 and non H-2 linked genes in the antibody response to a threshold dose of sheep
erythrocytes. Immunogenetics 8, 475-486
0stergard H, Kristensen B, Andersen S (1989) Investigation in farm animals of
associations between the MHC system and disease resistance and fertility. Liv Prod
Sci 22, 49-67
Pinard M-H, Hepkema BG (1992) Biochemical and serological identification of major histocompatibility antigens in outbred chickens. In: Selection for immunoresponsiveness in chickens: effects of the major histocompatibility complex and resistance
to Marek’s disease. Ph D diss, Univ Wageningen, The Netherlands, 43-59
Pinard M-H; Hepkema BG, van der Meulen MA, Nieuwland MGB, van der Zijpp
AJ (1991) Major histocompatibility complex haplotypes in chickens selected for
high and low antibody production. Anim Genet 22 (suppl 1), 117-118
Pinard M-H, van Arendonk JAM, Nieuwland MGB, van der Zijpp AJ (1992)
Divergent selection for immune responsiveness in chicken: estimation of realized
heritability with an animal model. J Anim Sci 70, 2986-2993
Pinard M-H, van Arendonk JAM, Nieuwland MGB, van der Zijpp AJ (1993)
Divergent selection for humoral immune responsiveness in chickens: distribution
and effects of major histocompatibility complex types. Genet Sel Evol 25, 191-203
Schierman LW, Collins WM (1987) Influence of the major histocompatibility
complex on tumor regression and immunity in chickens. Poult Sci 66, 812-818
Scott TR, Oduho GM, Glick B, Hagan F, Briles WE, Yamamoto Y (1988)
Erythrocyte alloantigen diversity and some immunological effects of the B system
in related New Hampshire strains. Poult Sci 67, 1210-1217
Shook GE (1989) Selection for disease resistance. J Dairy Sci 72, 1349-1362
Siegel PB, Gross WB (1980) Production and persistence of antibodies in chickens
to sheep erythrocytes. 1. Directional selection. Poult Sci 59, 1-5
Ubosi CO,
Siegel PB, Gross WB (1985) Divergent selection of chickens for antibody
production to sheep erythrocytes: age effect in parental lines and their crosses. Avian
Dis 29, 150-158
Vainio 0, Toivanen P, Toivanen A (1987) Major histocompatibility complex and
cell cooperation. Poult Sci 66, 795-801
Van der Zijpp AJ, Egberts E (1989) The major histocompatibility complex and
diseases in farm animals. Immunol Today 10, 109-111
1
Van der Zijpp AJ, Blankert JJ, Egberts E, Tilanus MGJ (1988) Advances in genetic
disease resistance in poultry. In: Advances in Animal Breeding (Korver S, van der
Steen HAM, van Arendonk JAM, Bakker H, Brascamp EW, Dommerholt J, eds)
Pudoc, Wageningen, The Netherlands, 131-138
Watts TH, Me Connel HM (1987) Biophysical aspects of antigen recognition by T
cells. Annu Rev Immunol, 5, 461-475
Weller JI, Fernando RL (1991) Strategies for the improvement of animal production
using marker-assisted selection. In: Gene-Mapping Techniques and Applications
(Schook LB, Lewin HA, McLaren DG, eds) Marcel Dekker Inc, NY, 305-328
.
ERRATUM
Pinard
MH, Van Arendonk JAM, Nieuwland MGB, Van der Zijpp AJ (1993)
Divergent selection for humoral immune responsiveness in chickens: distribution
and effects of major histocompatibility complex types. Genet Sel Evol 25(2), 191203.
On page 196, table II, frequency (in %) of the 124 B-haplotype in generation 10 of
the low (L) line should be 27.5, instead of 27.75 as printed.