Báo cáo sinh học: "Probability statements about the transmitting ability of progeny-tested sires for an all-or-none trait with an application to twinning in cattle" pptx
Bạn đang xem bản rút gọn của tài liệu. Xem và tải ngay bản đầy đủ của tài liệu tại đây (908.38 KB, 18 trang )
Original
article
Probability
statements
about
the
transmitting
ability
of
progeny-tested
sires
for
an
all-or-none
trait
with
an
application
to
twinning
in
cattle
J.L.
Foulley
S.
Im
2
Institut
National
de
la
Recherche
Agronomique,
station
de
génétique
quantitative
et
appliquée,
centre
de
recherches
de
Jouy,
78350
Jouy-en-Josas;
Institut
National
de
la
Recherche
Agronomique,
laboratoire
de
biométrie,
centre
de
recherches
de
Toudouse
BP
27,
31326
Castanet-Tolosan
Cedex,
France
(received
20
September
1988,
accepted
17
April
1989)
Summary -
This
paper
compares
three
statistical
procedures
for
making
probability
statements
about
the
true
transmitting
ability
of
progeny-tested
sires
for
an
all-or-none
polygenic
trait.
Method
I
is
based
on
the
beta
binomial
model
whereas
methods
II
and
III
result
from
Bayesian
approaches
to
the
threshold-liability
model
of
Sewall
Wright.
An
application
to
lower
bounds
of
the
transmitting
ability
of
superior
sires
with
a
high
twinning
rate
in
their
daughter
progeny
is
presented.
Results
of
different
methods
are
in
good
agreement.
The
flexibility
of
these
different
methods
with
respect
to
more
complex
structures
of
data
is
discussed.
genetic
evaluation -
all-or-none
traits -
beta
binomial
model -
threshold
model -
Bayesian
methods
Résumé -
Enoncés
probabilistes
relatifs
à
la
valeur
génétique
transmise
de
pères
testés
sur
descendance
pour
un
caractère
tout-ou-rien
avec
une
application
à
la
gémellité
chez
les
bovins.
Cet
article
compare
3
procédures
statistiques
en
vue
de
la
formulation
d’énoncés
probabilistes
relatifs
à
la
valeur
génétique
transmise
de
pères
testés
sur
descendance
pour
un
caractère
polygénique
tout-ou-rien.
La
méthode
I
repose
sur
le
modèle
bêta
binômial
alors
que
les
méthodes
II
et
III
découlent
d’approches bayésiennes
du modèle
à
seuils
de
S.
Wright.
Une
application
concernant
la
borne
inférieure
de
la
valeur
génétique
transmise
de
pères
d’élite
présentant
un
taux
de
gémellité
élevé
chez
leurs
filles
est
présentée.
Une
bonne
concordance
des
résultats
entre
méthodes
est
observée.
La
flexibilité
de
ces
différentes
méthodes
vis-à-vis
de
structures
de
données
plus
complexes
est
abordée
en
discussion.
évaluation
génétique -
caractères
tout-ou-rien -
modèle
bêta
binômial -
modèle
à
seuils -
méthodes
bayésiennes
INTRODUCTION
Genetic
evaluation
for
all-or-none
traits
is
usually
carried
out
via
Henderson’s
mixed
model
procedures
(Henderson,
1973)
having
optimum
properties
for
the
Gaussian
linear
mixed
model.
Even
though
a
linear
approach
taking
into
account
some
specific
features
of
binomial
or
multinomial
sampling
procedures
can
be
worked
out
in
multi-population
analysis
(Schaeffer
&
Wilton,
1976;
Berger
&
Freeman,
1976;
Beitler
&
Landis,
1985;
Im
et
ad.,
1987),
these
methods
suffer
from
severe
statistical
drawbacks
(Gianola,
1982;
Meijering
&
Gianola,
1985;
Foulley,
1987).
Especially
as
distribution
properties
of
predictors
and
of
prediction
errors
are
unknown
for
regular
or
improved
Blup
procedures
applied
to
all-or-none
traits,
it
would
therefore
be
dangerous
to
base
probability
statements
on
the
property
of
a
normal
spread
of
genetic
evaluations
or
of
true
breeding
values
given
the
estimated
breeding
value.
The
aim
of
this
paper
is
to
investigate
alternative
statistical
methods
for
that
purpose.
Emphasis
will
be
placed
on
making
probability
statements
about
true
transmitting
ability
(TA)
of
superior
sires
progeny-tested
for
some
binary
characteristic
having
a
multifactorial
mode
of
inheritance.
Numerical
applications
will
be
devoted
to
sires
with
a
high
twinning
rate
in
their
daughter
progeny.
METHODS
The
methods
presented
here
are
derived
from
statistical
sire
evaluation
procedures
which
are
based
on
specific
features
of
the
distribution
involved
in
the
sampling
processes
of
such
binary
data.
Three
methods
(referred
to
as
I,
II
and
III)
will
be
described
in
relation
to recent
works
in
this
area.
The
first
method
is
based
on
the
beta
binomial
model
(Im,
1982)
and
the
two
other
ones
on
Bayesian
approaches
(Foulley
et
al.,
1988)
to
the
threshold-liability
model
due
to
Wright
(1934
a
and
b).
All
three
methods
assume
a
conditional
binomial
distribution
B
(n,
T
r)
of
binary
outcomes
(i.e.
n
progeny
performance
of
a
sire)
given
the
true
value
7r
of
a
probability
parameter
(here
the
sire’s
true
breeding
value
or
transmitting
ability).
The
three
methods
differ
in
regard
to
the
modelling
of
7r
itself,
either
directly
(beta
binomial)
or
indirectly
(threshold-liability
model),
and
consequently
in
describing
the
prior
distributions
of
parameters
involved,
v.i.z.
!r
itself
or
location
parameters
on
an
underlying
scale.
Method
I
’
Let
y
ij
=
0 or
1
be
the
performance
of
the
jth
progeny
( j
=
1, 2, ,
ni)
out
of
the
ith
sire
(i
=
1, 2,
, q)
and
ni
unrelated
dams.
Let
Jri
designate
the
true
transmitting
ability
(7ri
)
of
sire
i.
A
priori,
the
7r
i
’s
are
assumed
to
be
independently
and
identically
distributed
(i.i.d.)
as
beta
random
variables
with
parameters
(a&dquo;0).
Conditional
on
true
value
-7r
i,
the
distribution
of
binary
responses
among
progeny
of
a
given
sire
is
taken
as
binomial
B
(n
i,
7ri
).
These
distributions
are
conditionally
independent
among
sires
so
that
the
likelihood
is
the
product
binomial
where
the
circle
stands
for
a
summation
over
the
corresponding
subscript
(here
y
2o
=
Ej
Y
ij)
and
capital
letters
indicate
random
variables.
As
the
prior
and
the
likelihood
are
conjugate
(Cox
&
Hinkley,
1974,
p.
308),
the
posterior
distribution
remains
in
the
beta
family
and
can
be
written
as:
! ,
¡’
,
I
with
normalizing
constant
The
density
in
(3)
is
a
product
of
q
independent
beta
densities.
Ignoring
subscripts,
the
posterior
density
for
a
given
sire
is:
This
Beta
distribution
B
(a,
b)
can
be
conveniently
expressed
with
a
reparame-
terization
in
terms
of
a
prior
mean
7
r,,
=
a/(a
+
!3),
an
intra
class
correlation
pb
=
(a +,3 +
1)-
1
and
the
observed
frequency
p
=
y
o/n.
The
conditional
distribu-
tion
of
7r
given
n,
p,
1r
and
pb
is
then
with
expectation
which
will
be
noted
7r
so
as
to
reflect
both
its
interpretation
as
a
Bayesian
estimator
of
1f
as
well
as
its
equivalence
with
the
best
linear
predictor
or
selection
index
(Henderson,
1973).
Using
7r
and
letting
ab
=
pb
1
-
1
with
Àb
interpretable
as
a
ratio
of
within
to
between
sire
components
of
variances,
the
distribution
in
(4b)
can
be viewed
as
a
function
of
n,
7r
and
Ab,
that
is,
conditional
on
n,
!6
and
1?,
the
distribution
of
7r
is:
with
expectation
and
variance
Probability
statements
about
true
values
of
TA
given
the
data
(n
and
p
or
7i’)
and
values
of
the
hyperparameters
(!ro
and p
b
or
ab)
can
be
easily
made
using
expressions
(4b)
or
(5)
of
the
posterior
density
of
-7r.
Notice
that
formula
(6a)
also
represents
the
probability
of
response
Pr(Y
ik
=
1
ni,
pi)
for
a
future
progeny
(k)
out
of
sire
(i)
with
an
observed
frequency
of
response
pi
in
ni
offspring.
These
probability
statements
can
be
made
for
specific
sires
given
their
progeny
test
data
(n,
p
or
11’)
and
the
characteristics
of
the
corresponding
population,
such
as
the
mean
incidence
1f
and
the
intraclass
coefficient
pb
as
a
parameter
of
genetic
diversity.
To
allow
for
comparisons
among
methods,
this
pb,
or
equivalently
the
ratio
Ab,
will
be
expressed
according
to
Im’s
(1987)
results
which
relate
intraclass
coefficients
on
the
binary
(p
b)
and
underlying
(p)
scales
in
a
population
in
which
the
incidence
of
the
trait
is
7
r,,
(see
next
paragraph).
In
the
case
of
twinning,
interest
is
usually
in
superior
sires
having
estimated
transmitting
ability
(ETA)
values
above
the
mean
7ro.
Attention
will
then
be
devoted
to
the
lower
TA
bound
1fm
which
is
exceeded with
a
probability
a
i.e,
to
1fm,
such
that:
This
involves
computing
x
E
[0,
1]
values
of
the
so-called
incomplete
beta
function
defined
as,
in
classical
notations
Details
about
numerical
procedures
used
to
that
respect
are
given
in
appendix
A.
In
addition,
more
general
results
can
be
produced
for
instance
in
terms
of
(n,
1?)
values
such
that
formula
(7)
holds
for
given
values of
a&dquo;
t
(TA
lower
bound)
and
a
(probability
level):
see
appendix
A.
Method
11
This
method
is
derived
from
genetic
evaluation
procedures
for
discrete
traits
introduced
recently
by
several
authors.
All
these
procedures
postulate
the
Wright
threshold
liability
concept.
We
restrict
our
attention
here
to
Bayesian
inference
approaches
proposed
independently
by
Gianola
&
Foulley
(1983),
Harville
&
Mee
(1984),
Stiratelli
et
al.
(1984)
and
Zellner
&
Rossi
(1984).
Although
the
methodology
is
very
general
vis-a-vis
data
structures,
for
the
sake
of
simplicity
only
its
unipopulation
version
(p
model)
will
be
considered
in
this
paper.
Let
l
ij
be
a
conceptual
underlying
variable
associated
with
the
binary
response
y2!
of
the
jth
progeny
of
the
ith
sire.
The
variable
12!
is
modelled
as:
.
where
1
/i
is
the
location
parameter
associated
with
the
population
of
progeny
out
of
sire
i
and
the
e
ij’s
are
NID
(0,
o,’)
within
sire
deviations.
Conditional
on
q
j,
the
probability
that
a
progeny
responds
in
one
of
the
two
exclusive
categories
coded
[0]
and
[1]
respectively
is
written
as:
where
T
is
the
value
of
the
threshold,
a
the
within
sire
standard
deviation
and
4)(.)
the
normal
CDF
evaluated
at
(r -1}i)/ae’
It
is
convenient
to
put
the
origin
at
the
threshold
and
set
ue
to
unity,
i.e.
&dquo;standardize&dquo;
the
threshold
model
(Harville
&
Mee,
1984)
the
expression
for
7r
i[o]
can
be
written
as
and
that
for
7r
i[l]
as:
In
what
follows,
and
to
simplify
notation,
Jrjpj
will
be
referred
to
as
7
ri .
Letting
tt
=
fail
be
an
(q
x
1)
vector,
a
natural
choice
for
the
prior
distribution
of IL
under
polygenic
inheritance,
is:
where
A
is
equal
to
twice
Malecot’s
genetic
relationship
matrix
for
the
q
sires
(A
=
I
in
method
I),
U2
is
the
sire
component
of
variance
and
po
the
general
phenotypic
mean
in
the
underlying
scale.
These
parameters
po
and
u2
are
linked
to
the
overall
incidence
7r
via:
- . -
,
or,
equivalently,
defining
Q2
=
0
-;
+
U2
with
Qe
=
1,
Similarly,
the
sire
variance
Q!6
in
the
binary
scale
can
be
related
to
the
underlying
distribution
via
where
!2(x,
y; r)
is
the
standardized
bivariate
cumulative
density
function
with
mean
0
and
correlation
r, jl
poj
+
Q
u)i/2
and
p
in
(13b)
is
the
intraclass
correlation
coefficient
p
=
a;/a2.
The
variance
in
(13b)
can
be
obtained
directly
by
a
probability
argument
or
as
the
limit
of
a
formula
given
by
Foulley
et
al.
(1988)
for
the
variance
of
the
observed
frequency
pi
when
the
progeny
group
size
n
tends
to
infinity.
Notice
also
that
it
differs
from
the
classical
expression
<p2(jí,)a;
proposed
by
Dempster
&
Lerner
(1950),
0(.)
designating
the
standardized
normal
density
function,
which
is
a
first
order
Taylor
expansion
of
(13b)
about
p
=
0.
The
likelihood
function
has
the
same
form
(v.i.z.
product
binomial)
as
in
method
I
(formula
2)
so
that
the
posterior
density
reduces
to:
where
z!
is
a
(1
x
m)
row
vector
having
1
in
the
ith
column
and
0
elsewhere.
The
logposterior
density
L
(p.;
y,
!Co,
a2)
can
be
minimized
with
respect
to
p.
by
a
scoring
algorithm
of
the
general
form
The
value
of t
L
in
the
t-th
iteration
can
be
computed
by
solving
the
non-linear
system
where
W and
v
are
an
(n
x
n)
diagonal
matrix
and
an
(n
x 1)
vector
respectively
having
elements
Define
A
=
Œ; / Œ;
=
1/ Œ;
and
u= (L -
pol
as
an
(m
x 1)
vector
of
sire
deviations.
Then
the
system
to
be
solved
A
IL
=
A u
becomes
An
interesting
feature
of
the
posterior
distribution
in
(14)
is
its
asymptotic
normality
where
(.1.
*
is
the
mode
of
the
posterior
density
of IL
in
(14)
and
I
(IL)
is
defined
as
lim
[I
(E
t)
/
no!-1
can
be
replaced
for
test
statistics
by
a
consistent
estimator
such
as
-no[I(!*)!-1
where
I
(t
L)
is
evaluated
at t
L
_
tL*.
The
variance
of
the
limiting
normal
distribution
is
usually
taken
to
be
(Berger,
1985,
p.
224)
The
form
shown
in
(18a
and
b)
applies
as
well
to
the
asymptotic
variance
since
both
of
them
tend
to
the
same
limit
as
no
=
En
i
tends
to
infinity.
This
involves
the
use
of
the
following
large
sample
distribution:
where
wi
stands
for
wi
evaluated
at
the
mode
/-Li.
*
Letting
pm
_
<I>-l (
1I
&dquo;
m)
be
the
parameter
value
in
the
underlying
scale
cor-
responding
to
1I
&dquo;
m
in
(7),
the
probability
that
the
true
sire
TA,
pz
of
sire
i
(ETA
=
tt*)
exceeds
tt
(or
equivalently
!r
>
1I
&dquo;
m)
can
be
expressed
as
For
given
values
of
n,
p
(or
7?)
and
Àb( 7f 0,
011
),
this
probability
can
be
computed,
given
7fm
,
and
compared
to
the
corresponding
probability
level
obtained
with
the
beta
binomial
model.
Alternatively,
one
can
determine
the
lower
bound
7f m
such
that
Pr
(7ri
>
7fm)
=
a
fixed,
by
taking
pm
=
f
-Li -
Î
;/
2
ép-l(0:).
Notice
that
computing
the
probability
in
(20),
based
on
the
posterior
distribution
of
the
true
TA,
f
(p
n,
p,
po,
A)
is
equivalent
to
computing
Pr
(7r
>
7fm
)
over
the
distribution of
the
probability
of
response
7r
=
4)(,U)
for
a
future
progeny
of
sires
having
an
ETA
equal
to
tt
*
and
a
true
TA
distributed
according
to
(19).
This
distribution
in
the
observed
scale
would
probably
be
more
appealing
for
practitioners.
This
is
especially
clear
as
far
as
ETA’s
are
concerned
and
one
may
alternatively
to
tt
*,
consider
as
a
sire
evaluation,
the
expectation
of !r =
!(!)
with
respect
to
the
density
of
A
in
(19),
say
!!2.
This
expectation
is:
However,
the
whole
distribution
of
7r
=
4b(/,t)
remains
less
tractable
numerically
than
that
of p
in
(19)
due
to
its
following
form:
Method
III
This
method
is
also
derived
from
the
threshold
liability
model
but
employs
asymptotic
properties
at
an
earlier
stage.
Let
us
consider,
as
previously,
the
observed
frequency
of
response
pi
in
ni
progeny
of
sire
i.
Conditionally
to
the
true
TA,
(7ri
),
pi
has
an
asymptotic
normal
distribution,
i.e.:
The
normit
transformed
of p
i,
mi
=
4
D-
1
(p
i)
has
a
conditional
distribution
which
is
also
asymptotically
normal.
Following
a
classical
theorem
in
asymptotic
theory
(see
for
instance,
formula
6a.23,
page
386
in
Rao,
1973)
and
knowing
that:
one
has,
given
ai
Assuming
as
in
section
II
B
that,
a
priori,
the
f-Li’S
are
i.i.d
!N
(p.!,
oD
leads
to
a
posterior
for
f
-L
i
with
is
also
normally
distributed.
The
expectation
(jiz)
and
variance
(ci)
of the
distribution
in
(25)
can
be
easily
expressed
analytically
as
(see
for
instance
Cox
&
Hinkley,
1974,
formula
22,
page
373).
with
Alternative
formulae
can
be
derived
so
as
to
mimic
usual
selection
index
expressions,
which
are,
ignoring
subscripts
,- - !
where
CD
is
given
by
the
usual
formula
for
the
coefficient
of
determination,
i.e.
CD
=
n/n
+
k)
where
the
scalar k
is
defined
as:
In
method
II
and
with
a
definition
of
CD
restricted
to
var
(f-Lly,a-;) = (1- C D)a;,
this
coefficient
is:
Notice
that
k
can
be
interpreted
as
in
selection
index
theory
as
the
ratio
of
a
within
sire
to
a
sire
variance,
since
p(l -
p)/(p2(.)
is
the
asymptotic
variance
of
the
normit
transformation
of
the
frequency
of
response
in
progenies
of
a
given
sire,
conditionally
on
the
sire’s
true
underlying
TA.
Substituting
jiz
and
ci
for
(26a
and
b)
or
(27
a
and
b)
for
p*
and
Ii
respectively
in
(20)
enables
us
either
to
determine
1rm
for
a
given
a
probability
level
knowing
po,
ufl
(or
equivalently
7
r,,
and
!),
p
and
n,
or
to
compute
the
probability
level
a
such
that
p.
i
exceeds
a
given
threshold
Again,
the
distribution
of
7r
=
iI?(f-L)
in
the
observed
scale
corresponding
to
the
density
of p,
in
(25)
can
be
obtained
using
the
formula
(22).
Its
expectation
has
the
same
expression
as
in
(21)
with Îii
and
ci
replacing
f-Li
and
7z
respectively.
NUMERICAL
APPLICATION
Procedures
described
in
this
paper
are
applied
to
the
problem
of
screening
superior
sires
with
a
high
twinning
rate
in
their
female
progeny.
There
are
relatively
large
differences
among
cattle
populations
with
respect
to
the
prevalence
-7r,,
of
twinning
(see
for
instance
Maijala
&
Syvajarvi,
1977).
Two
values
of
7
r,,,
say
2.5
and
4%
are
considered
in
this
application.
These
values of
twinning
rate
are
those
observed
in
2nd
and
mature
(3rd
to
7th)
calvings
respectively
in
such
breeds
as
Charolais
and
Maine-Anjou
(Frebling
et
al.,
1987).
The
first
value
of
1ro
(0.025)
can
be
viewed
as
a
progeny
test
of
young
bulls
based
on
second
calvings.
Twinning
in
heifers
was
not
considered
because
of
its
extremely
low
rate
(0.007).
The
second
value
(0.04)
is
an
illustration
of
an
evaluation
system
of
service
sires
based
on
mature
calvings.
Genetic
variation
for
occurrence
of
multiple
births
in
cattle
was
assumed
to
have
an
heritability
coefficient
in
the
underlying
scale
equal
to
0.25,
according
to
estimates
published
by
Syrstad
(1974).
In
this
study,
h2
values
of
the
underlying
continuous
variable
are
higher
than
those
in
the
observed
scale
and,
especially
more
stable
over
parities
as
theoretically
expected
for
such
binary
traits.
Using
this
value
in
(13a
and
b)
leads
to
!o
equal
to
-2.0242
and
-1.8081,
and
h2
in
the
binary
scale
equal
to
0.0394
and
0.053
for
7!
-o
equal
to
0.025
and
0.04,
respectively.
Notice,
as
already
pointed
out
by
Im
(1987)
that
h2
values
reported
here
are
slightly
higher
than
those
which
would
be
obtained
(0.0350
and
0.0483)
from
the
classical
formula
of
Dempster
&
Lerner
(1950).
First
application
The
first
application
deals
with
5
specific
sires
known
for
their
high
twinning
rate
in
daughters.
Table
I
shows
lower
bounds
(
TTm)
of
the
TA
in
twinning
of
these
5
sires
knowing
their
progeny
test
performance
(!,, p)
in
mature
calvings
at
2
different
probability
levels,
a
=
0.90
and
0.95.
In
both
cases,
results
are
in
good
agreement
across
methods
with,
as
expected
due
to
asymptotic
approximations,
higher
values
of
7r m
being
obtained
with
method
II
and,
to
a
larger
extent
with
III.
Differences
between
I
and
II,
however,
are
of
little
importance
given
the
large
values
of
n.
Differences
among
methods
are
also
reflected
in
ETA
values
on
the
observed
scale
with
values
for
methods
II
and
III
very
slightly
less
regressed
towards
the
mean
incidence
7r
=
0.04
than
in
method
I.
On
the
other
hand,
this
is
a
good
example
of
a
change
of
ranking
according
to
criteria
used.
B and
C
have
close
ETA
and
!r,&dquo;,,
values
although
they
differ
largely
in
frequency
(p).
E
is
lower
than
D
in
p,
close
to
D
in
ETA
but
larger
in
Tfm
due
to
a
greater
number
of
progeny.
Second
application
For
the
two
7r
frequencies,
tables
II
and
III
show
the
values
of
progeny
group
size
(n)
which
provides
an
a
=
0.9
probability
level
for
different
combinations
of
!r&dquo;t,
the
TA
taken
as
a
minimum
and
7i’,
the
ETA
value
according
to
formulae
(5b)
and
(6).
Minimum
TA
and
ETA
values
were
expressed
in
percent
as
well
as,
for
practical
purposes,
deviations
from
7r
in
Q
ub
units
(uu
b
=
1
standard
deviation
in
true
TA
in
the
0 —
1 scale).
Results
are
shown
in
tables
II
and
III
for
!&dquo;,,
varying
from
+0.25
to
+2.75
Qub
and
ETA
from
+1.00
to
3.00
ou
b
with
an
elementary
increment
of
0.25.
The
higher
the
ETA’s,
the
lower
are
progeny
numbers
for
a
given
value
of
Tfm-
For
instance,
for
7ro
=
0.025
and
!r&dquo;,,
=
0.048
(or
equivalently
+1.50o-it
t
,)
progeny
numbers
providing
a
0.9
probability
level
are
5199,
1291,
546,
279,
152
and
81
when
the
ETA
goes
from
+
1.75
to
3.00
uu
b.
Corresponding
figures
are
3631, 895,
375,
188,
100
and
51
respectively
when 7r
o
=
0.04,
i. e.
about
60-70%
of
previous
quantities.
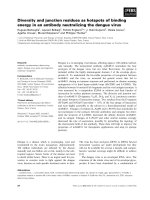
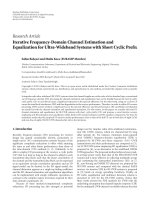
This
special
case
is
illustrated
for
7r
=
0.025
in
figure
1
with
a
graph
of
the
beta
prior
density
and
posterior
distributions
corresponding
to
7
rm
=
0.048
and
n
varying
from
81
to
1291.
a
given
ETA
value,
the
closer
this
value
to
7
r,
n,
the
higher
the
progeny
group
size
needed
to
reach
a
probability
level
of
0.9.
For
such
a
difference
(ETA
minus
7rm)
taken
as
fixed
in
uu
b
units,
variations
in
the
progeny
number n
are
rather
less
pronounced.
These
variations
(An)
in
n
are
proportional
to
variations
(A£)
in
ETA
within
the
range
of values
considered.
For
instance,
for
7?
-
7r m
=
0.75
uu
b,
An
=
504 -
330
=
174
when
7?
varies
from
+
1.00
to
+
2.00
uu
b
at
7
r,
=
0.025
and
An
=
671 -
504
=
167
with
7?
going
from
+
2.00
to
+
3.00
(
TUb
.
Clearly,
these
variations
result
from
the
dependency
of
the
posterior
variance
on
ETA
as
reflected
in
formula
(6b)
contrarily
to
what
happened
in
the
Gaussian
linear
model. For
?!-
!
=
0.025
and h
2
=
0.25
and
a
=
0.9,
73
to
167,
157
to
325, 330
to
671,
904
to
1663
and
4041
to
7062
progeny
are
required
to
exceed
a
minimum
TA
value
equal
to
ETA
minus
1.25,
1.00, 0.75, 0.50
and
0.25
(
TUb
,
respectively.
Corresponding
figures
can
be
found
in
table
III
for
7r
=
0.04.
Coming
back
to
the
case
of
twinning,
practical
interest
will
be
for
7rm
values
around
+1.50
Qub.
This
corresponds
to
sires
having
an
ETA
equal
to
2.25
to
2.50
(
TUb
(A
difference
ETA
-7rm
of
1.00
to
1.25
Qub
seems
reasonable
in
practice).
A
progeny
number
of
279
to
546
and
188
to
375
is
needed
depending
on 7? -
7r!
for
7
r
=
0.025
and
0.04,
respectively.
For
each
n,
7
rn
t,
ETA,
Àb(7ro)
combination,
the
corresponding
probability
that
the
true
TA
(pj)
of
sire
i
exceeds
f-
Lm =
!-1(!’&dquo;,)
given
n,
p
=
1?
+
Àb(
1? -
7ro
)/n
and
A
is
calculated
for
methods
II
and
III
according
to
formula
(20).
As
a
matter
of
fact,
methods
I,
II
III
can
be
compared
only
when
using
the
same
amount
of
information,
v.i.z.
the
same
n and
p
values
on
the
one
hand,
and
the
same
prior
expectations
and
variances
(formulae
13a
and
b)
on
the
other
hand.
Probability
values
for
methods
II
and
III
are
shown
in
Tables
II
and
III.
The
agreement
between
the
3
methods
is
generally
good,
especially
between
the
beta,
binomial
model
and
the
Bayesian
approach
of
the
threshold
model. For
71&dquo;
m
<
+2.00
and
ETA <
+2.25
uub ,
the
difference
between
the
2
probabilities
never
exceeds
0.01.
As
pointed
out
previously
(first
application),
distributions
employed
to
make
probability
statements
in
II
and
III
are
both
asymptotically
normal
on
the
underlying
scale,
and
consequently
underestimate
the
real
posterior
variance
and
overestimate
the
probability
that
the
true
TA
is
higher
than
71
&dquo;
m.
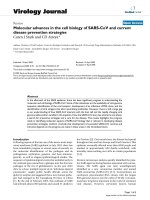
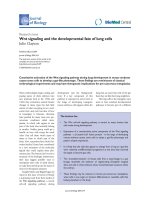
Clearly,
this
drawback
is
more
severe
for
method
III
than
method
II,
especially
for
high
values
of
the
ETA
as
shown
in
Tables
II
and
III
and
in
figure
2
with
the
graph
of
distributions
corresponding
to
Jro
=
0.025,
hz
=
0.25, n
=
38
and
p
=
5/38.
DISCUSSION-CONCLUSION
Adaptation
for
other
practical
situations
The
situation
adressed
in
this
paper
was
to
make
probability
statements
about
the
true
TA
of
&dquo;superior&dquo;
sires
vis-a-vis
a
minimum
(
71
&dquo;
m)
value
for
a
rare
interesting
cha,racteristic.
The
procedure
described
can
also
be viewed
as
making
probability
statements
about
TA’s
of
&dquo;inferior&dquo;
sires
vis-h-vis
an
upper
TA
limit
for
a
frequent
unfavourable
trait.
This
is
likely
to
occur
in
practical
animal
breeding,
especially
for
the
so-called
secondary
traits
(e.g.
fertility
or
dystocia
in
cattle)
where
selection
usually
operates
against
the
poorest
sires
and
dams.
In
some
instances
for
such
detrimental
traits
at
a
low
prevalence,
interest
might
be
towards
the
occurrence
of
TA’s
in
the
lower
tail
of
the
distribution.
The
procedure
reported
here
can
be
easily
accomodated
for
this
case
in
changing
the
inequality
sign
in
formula
(7)
and
in
taking
an
opposite
argument
for
«1>(.)
in
(20).
Threshold
liability
concept
and
beta
binomial
approaches
In
the
example
studied
and
within the
range
of
parameters
considered,
probability
statements
made
by
methods
I
and
II
were
very
similar
as
clearly
illustrated
by
figure
2.
This
may
help
reconcile
the
beta
binomial
approach
praised
by
statisticians
(see,
among
others
Im,
1982)
with
the
threshold
liability
concept
put
ahead
by
quantitative
geneticists
especially
those
working
in
human
genetics
(see
for
instance
Curnow
&
Smith,
1975;
Falconer,
1965;
Fraser,
1980),
even
under
complex
segregation
patterns
(Lalouel
et
al.,
1983).
However,
the
threshold
liability
model
offers
more
flexibility
than
the
beta
binomial.
In
particular,
it
can
be
easily
adapted
to
mixed model
structures
involving
a
multipopulation
analysis
as
well
as
several
random
sources
of
variation.
Foulley
et
al.
(1988)
highlighted
how
inferential
issues
in
such
structures
can
be
handled
from
a
unified
perspective
using
the
Bayesian
paradigm.
Thus,
taking
into
account
several
records
per
animal
(e.g.
multiple
vs
single
births
at
different
parities)
can
be
achieved
with
this
methodology
using
either
a
repeatibility
model
or
a
multiple
trait
approach
(H6schele
et
al.,
1986)
with
possible
missing
data
patterns
(Foulley
&
Gianola,
198G)
as
well
as
correlated
information
on
normal
continuous
traits
(Foulley
et
al.,
1983).
Unfortunately,
the
beta
binomial
model
in
its
present
state
of
development
remains
confined
to
a
single
population
analysis
with
one
random
factor
(Williams,
1988).
Gilmour’s
approach
Although
the
approach
of
Gilmour
et
al.,
(1985)
to
the
threshold
model
has
its
own
rationality
via
its
connection
to
the
methodology
of
generalized
linear
models
and
quasi-likelihood,
its
justification
for
predicting
breeding
values
as
compared
to
Bayesian
methods
is
still
questionable
(Foulley
et
al.,
1988;
Knuiman
&
Laird,
1988).
This
is
especially
true
with
respect
to
distribution
properties
of
TA
predictors
or
those
of
prediction
errors
for
which
no
formal
statistical
properties
can
be
claimed
for
Gilmour’s
method.
Distribution
properties
Distribution
properties
of
the
true
TA
given
the
data
were
derived
in
this
study
under
the
implicit
assumption
that
the
beta
binomial
model
is
true
in
method
I
and
the
threshold
concept
is
also
true
in
methods
II
and
III.
Another
issue
on
comparing
these
methods
is
to
investigate
which
is
the
best.
Ways
of
challenging
models
is
a
difficult
topic
which
is
beyond
the
scope
of
this
paper
(see
for
instance
Smith,
1986).
For
categorical
data
and
in
an
animal
breeding
context,
suggestions
on
how
to
compare
non-nested
models
were
made
by
Foulley
(1987),
which
are
based
on
the
predictive
distribution
of
a
future
data
set
given
the
data
observed
at
present.
Genetic
charges
The
reasoning
followed
throughout
this
paper
is
a
conditional
view
knowing
the
progeny
test
data
information
on
sires.
This
leads
to
probability
statements
about
the
true
TA
of
specific
sires.
Discussing
progeny
group
numbers
for
a
planned
progeny
test
programme
can
involve
a
different
approach
(e.g.
Curnow,
1984)
especially
when
looking
a
priori
at
this
issue
with
no
specific
progeny-test
results.
One
could
make
some
statements
about
a
distributional
form
for
ETA’s
and
values
of
the
selection
differential
and
point
of
truncation.
As
pointed
out
by
Hill
(1977),
genetic
change
due
to
selecting
superior
sires
on
their
ETA’s
under
extra
constraints
with
respect
to
such
factors
as
inbreeding
levels,
testing
facilities
and
other
costs
appears
to
be
a
natural
approach
(e.g.
Curnow,
1984).
Response
(R)
to
one
generation
of
upward
truncation
selection
on
1?
(1
?
>
1
?s
)
is
a
random
variable
1r
having
in
the
beta
binomial
model
the
following
conditional
density
given
7T
>
1rs.
A
similar
expression
can
be
written
when
postulating
a
threshold
model
(Foulley,
1987).
Clearly,
the
problem
becomes
more
complex
since
we
have
to
take
into
account,
not
only
the
posterior
density
of
7r
given
progeny
test
results
but
also
the
marginal
density
of
the
ETA’s
and
integrate
7r
out
in
the
latter
and
their
product
over
the
selection
space.
These
are
not
easy
manipulations
from
an
analytical
point
of
view,
especially
with
the threshold
model.
More
research
is
therefore
needed
to
derive
original
results
in
that
area.
ACKNOWLEDGEMENTS
The
authors
are
grateful
to
Mr
Dan
Waldron
(University
of
Illinois
at
Urbana)
and
Mrs
Annick
Bouroche
(Unite
de
documentation,
Jouy-en-Josas)
for
their
English
revision
of
the
manuscript.
Thanks
are
also
extented
to
the
three
anonymous
referees
for
their
helpful
comments.
REFERENCES
Abramowitz
M.
&
Stegun
I.A.
(1972)
Handbook
of
mathematical
functions.
9th
ed.
Dover
publications,
New
York
Beitler
P.
&
Landis
J.R.
(1985)
A
mixed-effects
model
for
categorical
data.
Biometrics
41,
991-1000
Berger
J.O.
(1985)
Statistical
decision
theory
and
bayesian
analysis.
2nd
edition.
Springer-Verlag,
New
York
Berger
J.P.,
Freeman
A.E.
(1978)
Prediction
of
sire
merit
for
calving
difficulty.
J.
Dairy
Sci.
61,
1146-1150
Cox
D.R.
&
Hinkley
D.V.
(1974)
Theoretical
statistics
Chapman
&
Hall,
London
Curnow
R.N.
(1984)
Progeny-testing
for
all-or-none
traits
when
a
multifactorial
model
applies.
Biometrics
40,
375-382
Curnow
R.N.
&
Smith
C.
(1975)
Multifactorial
models
for
familial
diseases
in
man.
J.R.
Statist.
Soc.
A,
138,
131-169
Dempster
E.R.
&
Lerner
I.M.
(1950)
Heritability
of
threshold
characters.
Genetics
35, 212-236
Falconer
D.S.
(1965)
The
inheritance
of
liability
to
certain
diseases
estimated
from
the
incidence
among
relatives.
Ann.
Hum.
Genet.
29,
51-76
Foulley
J.L.
(1987)
Methodes
d’evaluation
des
reproducteurs
pour
des
caractères
discrets
a
d6terminisme
polyg6nique
en
s6lection
animale.
These
d’Etat.
Universite
de
Paris-Orsay
Foulley
J.L.
&
Gianola
D.
(1986)
Sire
evaluation
for
multiple
binary
responses
when
information
is
missing
on
some
traits.
J.
Dairy
Sci.
69,
2681-2695
Foulley
J.L.,
Gianola
D.
&
Thompson
R.
(1983)
Prediction
of
genetic
merit
from
data
on
binary
and
quantitative
variates
with
an
application
to
calving
difficulty,
birth
weight
and
pelvic
opening.
Genet.
Sel.
Evod.
15,
401-424
Foulley
J.L.,
Gianola
D.
&
Im
S.
(1988)
Genetic
evaluation
for
discrete
polygenic
traits
in
animal
breeding.
In:
Advances
in
Statistical
Methods
for
Genetic
Im-
prove!rcent
of
Livestock.
February
16-20, 1987,
Armidale.
Australia.
Springer
Verlag
(forthcomin.g)
Fraser
F.C.
(1980)
The
William
Allan
Memorial
Award
Adress:
Evolution
of
a
palatable
multifactorial
threshold
model.
Am.
J. Hum.
Genet.
32,
796-813
Frebling
J.,
Gillard
P.
&
Menissier
F.
(1987)
Resultats
pr6liminaires
sur
l’aptitude
naturelle
a
la
gemellite
dans
un
troupeau
de
vaches
Charodaises
et
Maine-Anjou
et
de
leur
filles.
INRA,
mimeo
Gianola
D.
(1982)
Theory
and
analysis
of
threshold
characters.
J.
Anim.
Sci.
54,
1079-1096
Gianola
D.
&
Foulley
J.L.
(1983)
Sire
evaluation
for
ordered
categorical
data
with
a
threshold
model.
Genet.
Sel.
Evol.
15,
201-224
Gilmour
A.R.,
Anderson
R.D.
&
Rae
A.L.
(1985)
The
analysis
of
binomial
data
by
a
generalized
linear
mixed
model.
Biometrika
72,
593-599
Harville
D.A.
&
Mee
R.W.
(1984)
A
mixed
model
procedure
for
analyzing
ordered
categorical
data.
Biometrics
40,
393-408
Henderson
C.R.
(1973)
Sire
evaluation
and
genetic
trends.
Proceedings
of the
animal
breeding
and
genetics
symposium
in
honor
of
Dr.
J.L.
Lush.
American
society
of
animal
science
and
american
dairy
science
association,
Champaign,
Illinois,
10-41
Hill
W.G.
(1977)
Comments
on
statistical
efficiency
in
bull
progeny
testing
for
calving
difficulty.
Livest.
Prod.
Sci.
4,
203-207
H6schele
I.,
Foulley
J.L.
&
Gianola
D.
(1986)
Genetic
evaluation
for
multiple
binary
responses.
Genet.
Sel.
Evol.
18,
299-321
Im
S.
(1982)
Contribution
d
1’etude
des
tables
de
contingence
d
param!tres
aleatoires:
utilisation
en
biom6trie.
These
3e
cycle,
Universite
Paul-Sabatier,
Toulouse
Im
S.
(1986)
Mutual
independence
in
a
mixed
effects
model
letter
to
the
editor.
Biometrics
42,
997
Im
S.
(1987)
A
note
on
heritability
of
a
dichotomous
trait.
Biom.
J.
4,
407-411
Im
S.,
Foulley
J.L.,
&
Gianola
D.
(1987)
A
linear
model
for
genetic
evaluation
on
categorical
traits.
82nd
Annual
Meeting
of
the
American
Dairy
Science
Association
Columbia
Missouri,
June
21-24.
J.
Dairy
Sci.
70,
Suppl.
1,
124
abstract
Johnson
N.L.
&
Kotz
S.
(1972)
Distributions
in
Statistics
Continuous
Univariance
Distributions,
vol.
3.
John
Wiley
&
Sons,
New
York
Knuiman
M.W.
&
Laird
N.M.
(1988)
Parameter
estimation
in
variance
component
models
for
binary
response
data.
In:
Advances
in
Statistical
Methods
for
Genetic
Improvement
of
Livestock.
February
16-20,
1987,
Armidale.
Australia.
Springer
Verlag
(forthcoming)
Lalouel
M.,
Rao
D.C.,
Morton
N.E.
&
Elston
R.C.
(1983)
A
unified
model.
J. Hum.
Genet.
35,
816-826
Maijala
K.
&
Syvajarvi
(1977)
On
the
possibility
of
developing
multiparous
cattle
by
selection.
Z.
Tierz.
Zuechtungsbiol.
94,
136-150
Meijering
A.
&
Gianola
D.
(1985)
Observations
on
sire
evaluation
with
categorical
data
using
heteroscedastic
mixed
linear
models.
J.
Dairy
Sci,
68,
1226-1232
Pearson
K.
(1968)
Tables
of
the
incomplete
beta
function.
2nd
ed.
Cambridge
University
Press,
Cambridge
Rao
C.R.
(1973)
Linear
statistical
inferences
and
its
applications.
2nd
ed.
John
Wiley
&
Sons,
New
York
Schaeffer
L.R.
&
Wilton
J.W.
(1976)
Methods
of
sire
evaluation
for
calving
ease.
J.
Dairy
Sci.
59,
544-551
Smith
A.F.M.
(1986)
Some
Bayesian
thoughts
on
modelling
and
model
choice.
The
Statistician
35,
97-102
Stiratelli
R.,
Laird
N.
&
Ware
J.H.
(1984)
Random
effects
models
for
serial
observations
with
binary
response.
Biometrics
40,
961-971
Syrstad
O.
(1974)
Inheritance
of
multiple
births
in
cattle.
Livest.
Prod.
Sci.
11,
373-380
Williams
D.A.
(1988)
Extra
binomial
variation
in
toxicology.
XIVth
International
biometric
conference,
Namur,
July
18-23,
1988,
invited
papers,
301-316
Wright
S.
(1934a)
An
analysis
of
variability
in
number
of
digits
in
an
inbred
strain
of
guinea
pig.
Genetics
19,
506-536
Wright
S.
(1934b)
The
results
of
crosses
between
inbred
strains
of
guinea
pigs
differing
in
number
of
digits.
Genetics
19,
537-551
Zellner
A.
&
Rossi
P.E.
(1984)
Bayesian
analysis
of dichotomous
quantal
response
models.
J.
Econ.
25,
365-393
APPENDIX
A:
ALGORITHM
FOR
SOLVING
EQUATION
(7)
.
Analytical
approximations
to
the
inverse
function
of
the
incomplete
data
function
are
proposed
in
calculus
books:
see,
for
instance,
formula
26.5.22,
page
945
in
Abramowitz
&
Stegun
(1972).
To
improve
the
accuracy
of
these
approximations,
we
employed
an
algorithm
based
on
finite
difference
techniques.
It
consists
in
iterating
from
(t)
to
(t
+
1)
with
Starting
values
are
xo
=
0;
Io
(a, b)
=
0 and
xl
=
value
of
the
inverse
probability
function
given
by
e.g.
Abramowitz
& Stegun.
In
this
equation,
the
incomplete
beta
function
is
calculated
from
Peizer
and
Pratt’s
approximation
as
recommended
by
Pearson
(1968,
formulae
47,
48,
49
page
XXX)
and
Johnson
&
Kotz
(1972,
vol.
III,
pp.
48,
49).
For
the
values
of
a
and
b
encountered
in
this
study,
this
approximation
is
very
accurate;
the
difference
Itrue-approximated
values)
is
less
than
10-
3
according
to
the
previous
authors.
Computationally,
solving
equation
(7)
in
terms
of
(n,1?)
requires
obtaining
the
parameter
a
=
(n
+
’x
b
)1?
of
the
incomplete
beta
function
Iz
(a, b)
=
1 -
a,
given
x
values
of
a, x
and
the
ratio
a/b
=
!r/(1 -
7r).
This
can
be
worked
out
with
an
algorithm
similar
to
[Al]
in
which
a
is
substituted
for
x.
For
the
sake
of
comparison,
n
was
predicted
in
the
fashion
described,
and
also,
using
a
second
approximation
to
the
incomplete
beta
function
(formulae
26.5.21,
page
945)
in
Abramowitz
&
Stegun
(1972).
In
the
examples
considered,
the
agreement
between
both
approximations
was
excellent;
results
obtained
differed
by
no
more
than
one
progeny.