Báo cáo sinh học: "Estimation of relatedness in natural populations using highly polymorphic genetic" docx
Bạn đang xem bản rút gọn của tài liệu. Xem và tải ngay bản đầy đủ của tài liệu tại đây (845.19 KB, 16 trang )
Original
article
Estimation
of
relatedness
in
natural
populations
using
highly
polymorphic
genetic
markers
P Capy
JFY
Brookfield
2
1
Centre
National
de
la
Recherche
Scientifique
Laboratoire
de
Biologie
et
Génétique
Evolutives
91198
Gifsur
Yvette
Cedex,
France;
2
University
of
Nottingham,
Department
of
Genetics,
Queen’s
Medical
Center,
Nottingham
NG7
2UH,
UK
(Received
7
Nlay
1990;
accepted
2
August
1991)
Summary -
This
report
addresses
3
important
questions
in
population
biology:
1),
Is
it
possible
to
determine
the
actual
kinship
between
individuals
taken
at
random
from
a
natural
population?
2),
Is
it
possible
to
estimate
an
average
degree
of
kinship
in
a
population
in
terms
of
the
probability
that
2
individuals
drawn
at
random
are
related?
3),
Is
it
possible
to
estimate
a
population’s
family
structure
in
terms
of
the
number
and
the
relative
size
of
the
different
families?
To
answer
these
questions
the
estimation
of
kinship
between
2
individuals
is
first
considered.
To
do
this,
identity
probabilities,
based
upon
2
sets
of
assumptions
concerning
the
genetic
markers
used,
were
derived
for
different
cases
of
kinship.
The
use
of
VNTRs
(variable
number
of
tandem
repeats)
shows
that
for
multilocus
probes,
all
distributions of
identity
broadly
overlap
even
when
the
number
of
loci
is
about
20.
Therefore
by
VNTRs
alone,
it is
difficult
to
define
the
true
kinship
between
2
individuals
when
only
their
DNA
fingerprints
are
compared.
More
accurate
estimations
can
be
achieved
with
monolocus
probes.
However,
to
estimate
a
population’s
structure
or
the
average
degree
of
kinship
between
individuals,
it
is
not
necessary
to
identify
precisely
each
individual
sampled,
but
rather,
only
to
determine
whether
individuals
are
related
or
not.
For
this,
it
is
necessary
to
define
a
threshold
identity
value
which
depends
on
the
common
patterns
that
can
be
observed
between
unrelated
individuals.
Below
this
value,
individuals
are
considered
to
be
unrelated
and,
above
it,
they
are
considered
to
be
related.
Finally,
a
sequential
sampling
procedure
is
proposed.
natural
populations
/
relatedness
/
genetic
marker
/
multilocus
probes
/
monolocus
probes
*
Correspondence
and
reprints
Résumé —
Estimation
de
la
parenté
au
sein
des
populations
naturelles
à
l’aide
de
marqueurs
génétiques
hautement
polymorphes.
Peut-on
déterminer
les
liens
de
parenté
entre
2 individus
pris
au
hasard
dans
une
population
naturelle ?
Peut-on
estimer
la
parenté
moyenne,
c’est-à-dire
la
probabilité
de
tirer
au
hasard
2
individus
apparentés,
au
sein
d’une
population
naturelle ?
Ou
bien
encore
peut-on
déterminer
la
structure
d’une
population,
à
savoir
le
nombre
et
la
taille
relative
des
différentes
familles
qui
la
composent ?
#
Pour
répondre
à
ces
questions,
l’estimation
de
la
parenté
entre
2 individus
a
été
tout
d’abord
envisagée.
A
partir
de
2
séries
d’hypothèses
relatives
aux
marqueurs
génétiques
utilisés,
les
probabilités
d’identité
entre
2 individus
ont
été
définies
pour
des
liens
de
parenté
simples. L’application
de
ces
2 modèles
aux
VNTR
montre
que
pour
les
sondes
multilocus,
les
distributions
des
probabilités
d’identité
se
recouvrent
très
largement,
même
lorsqu’une
vingtaine
de
locus
sont
détectés.
Par
conséquent,
il
est
difficile,
voire
impossible,
de
déterminer
précisément
la
parenté
entre
2 individus
en
se
basant
exclusivement
sur
ce
type
de
données.
Par
contre,
l’utilisation
simultanée
de
plusieurs
sondes
monolocus
permet
d’obtenir
des
estimations
plus
précises.
Pour
estimer
la
structure
d’une
population
ou
la
parenté
moyenne
entre
individus,
il
n’est
pas
nécessaire
d’identifier
précisément
chaque
individu,
mais
uniquement
de
déterminer
si
2
individus
sont
apparentés
ou
non.
Pour
cela,
un
seuil
d’identité
est
défini
en fonction
des
valeurs
d’identité
observées
entre
individus
non
apparentés.
En
deçà
de
cette
valeur
seuil,
les
individus
ne
sont
pas
considérés
comme
apparentés
et
au-delà,
il
est
admis
qu’ils
le
sont. Enfin,
une
procédure
séquentielle
d’échantillonnage
est
proposée.
population
naturelle
/
relation
de
parenté
/
marqueur
génétique
/
sonde
multilocus
/
sonde
monolocus
INTRODUCTION
In
population
genetics
many
problems
of
natural
populations
cannot
be
solved
without
a
better
knowledge
of
the
kinship
structure
at
present
and
in
a
small
number
of
generations
in
the
recent
past.
The
effective
size
of
the
population,
its
number
of
founders
and
the
possible
existence
of
groups
of
related
individuals
may
be
of
great
importance,
but
it
is
usually
very
difficult
to
obtain
such
data
or
even
to
make
accurate
estimates.
For
instance,
in
Drosophila
melanogaster,
analyses
of
enzyme
polymorphism
often
show
a
deficit
in
heterozygotes
in
natural
populations.
The
Wright
fixation
index
(Fis)
can
reach
0.6-0.7
(Danielli
and
Costa,
1977;
David
et
al,
1989;
Vouidibio
et
al,
1989).
Several
hypotheses
are
frequently
proposed
to
explain
such
results:
selection
against
heterozygotes,
inbreeding,
and/or
the
mixing
of
populations
with
different
allelic
frequencies
(Wahlund
effect).
However,
it
remains
difficult
to
determine
the
relative
importance
of
each
process.
Indeed,
in
Drosophila
species,
it
is
almost
impossible
to
estimate
the
size,
the
geographical
limits
and
the
kinship
structure
(number
of
groups
of
related
individuals
or
families)
of
a
population.
During
the
last
few
years,
new
techniques
have
been
developed
for
estimates
of
relatedness
between
two
individuals
chosen
from
a
natural
population.
These
techniques
rest
upon
the
detection
of
highly
polymorphic
DNA
sequences,
such
as
minisatellites
(Jeffreys
et
al,
1985).
Depending
on
the
species
being
studied,
the
main
problem
lies
in
finding
a
highly
polymorphic
system
or
a
combination
of
systems.
The
principal
characteristic
of
these
systems
must
allow
the
definition,
for
each
individual,
of
a
&dquo;genetic
identity
card&dquo;,
or
a
fingerprint,
sufficiently
accurate
to
avoid
2
unrelated
individuals
possessing
the
same
pattern.
Such
genetic
systems
exist
in
numerous
vertebrates.
One
example
is
the
major
histocompatibility
complex
(Dausset,
1958;
Vaiman,
1970;
Klein,
1987)
which
determines
transplant
rejection.
This
system
consists
of
4
loci,
having
an
average
of
10-20
alleles.
However,
in
several
natural
populations,
strong
linkage
disequilibria
are
found
(Dausset
and
Svejgaard,
1977).
Thus,
the
probability
that
unrelated
individuals
possess
the
same
haplotype
can
be
high.
For
invertebrates,
only
enzymatic
data
are
presently
available.
However,
these
techniques
do
not
detect
many
alleles.
For
instance,
in
Drosophila
melanogaster,
the
Amylase
locus
has
approximately
13
described
alleles
(Dainou
et
al,
1987)
and
is
among
the
most
highly
polymorphic
loci.
For
other
enzymes
such
as
Esterase-6
and
Xanthine
dehydrogenase,
it
is
often
possible
to
detect
many
more
alleles,
ie
between
20
and
30
alleles,
when
electrophoresis
conditions
like
buffer
pH
or
gel
concentration
are
modified
(Coyne,
1976;
Singh
et
al,
1976;
Modiano
et
al,
1979;
Ramshaw
et
al,
1979;
Singh,
1979;
Keith,
1983).
However,
the
geographical
distribution
of
the
alleles
is
not
homogeneous
and
it
is
rare
for
all
the
alleles
to
exist
in
a
single
region.
In
other
words,
at
a
given
place,
unrelated
individuals
may
have
similar
genotypes.
Moreover,
this
disadvantage
is
reinforced
by
the
fact
that,
in
a
given
population,
the
allele
frequencies
are
far
from
uniform
with
generally
1
or
2
frequent
alleles
and
several
alleles
at
low
frequencies.
Such
problems
can
be
partially
avoided
when
several
enzymatic
loci
are
consid-
ered
together.
This
solution
has
already
been
proposed
for
paternity
determination
(Chakraborty
et
al,
1988),
for
estimates
of
relatedness
between
colonies
of
social
insects
(Pamilo
and
Crozier,
1982;
Pamilo,
1984;
Queller
et
al,
1988;
Queller
and
Goodnight,
1989)
and
between
individuals
in
vertebrates
(Schartz
and
Armitage,
1983;
Wilkinson
and
McCraken,
1985).
However,
these
procedures
are
not
always
suitable
when
the
social
structures
of
species
are
unknown
or
not
accessible.
Recently,
several
genetic
systems,
such
as
transposable
elements
or
minisatellites
and
more
generally
RFLPs
(Restriction
Fragment
Length
Polymorphisms)
have
provided
new
ways
of
estimating
the
kinship
between
individuals
and
of
analysing
the
structure
of
relatedness
(number
of
groups
of
related
individuals)
in
natural
populations.
However,
such
systems
as
minisatellites
may
still
not
be
accurate
enough,
and
several
authors
have
already
stressed
the
limits
of
these
approaches
for
the
analysis
of
natural
populations
(Lynch,
1988;
Brookfield,
1989;
Lewin,
1989).
The
first
aim
of
the
present
work
is
to
evaluate
the
difficulties
in
estimating
the
kin
relationship
between
2
individuals
accurately
when
different
parameters
of
a
natural
population,
such
as
the
social
structure,
the
mating
system,
the
age-
classes,
the
generation
turnover,
and
the
existence
of
overlapping
generations
among
others,
are
unknown.
After
a
brief
presentation
of
the
basic
model
and
a
means
of
measuring
the
degree
of
identity
between
2
individuals,
the
distributions
of
identity
probabilities
between
2
individuals
(using
two
sets
of
assumptions
concerning
the
genetic
systems
used)
will
be
presented
for
different
kin
relationship.
Then,
their
application
to
VNTRs
(Variable
Number
of
Tandem
Repeats)
using
both
multilocus
and
monolocus
probes
will
be
discussed.
Finally,
attention
will
be
focussed
on
the
estimation
of
kinship
structure,
ie,
the
number
and
the
size
of
groups
of
related
individuals,
and
on
the
estimation
of
an
average
kinship
level,
ie
the
probability
that
2
individuals
drawn
at
random
are
related,
in
a
population
of
unknown
kinship
structure.
A
sampling
procedure
based
upon
the
model
proposed
by
Rouault
and
Capy
(1986)
and
by
Capy
and
Rouault
(1987)
will
be
proposed.
MATERIALS
AND
METHODS
Basic
model
and
identity
between
2
individuals
Each
individual
is
defined
by
a
set
of
bands
obtained
after
digestion
by
a
restriction
endonuclease(s)
of
total
DNA,
hybridisation
with
a
marked
nucleic
acid
probe
and
autoradiography.
The
resulting
set
of
bands
corresponds
to
the
individual’s
fingerprint
and
the
segregation
of
each
band
is
Mendelian.
Identity
between
2
individuals
can
be
calculated
from
the
number
of
shared
bands;
these
bands
being
identical
by
state
or
by
descent
(Lynch,
1988).
The
expression
proposed
by
Nei
and
Li
(1979)
will
be
used.
In
this,
the
identity
between
a
and
b
is:
where
na
and
nb
are
the
number
of
bands
of
individuals
a
and
b,
and
n
ab
the
number
of
bands
shared
by
a
and
b.
This
expression,
which
corresponds
to
the
proportion
of
bands
shared
between
2
individuals,
varies
from
0
(if
a
and
b
have
no
common
bands)
to
1
(if
a
and
b
share
all
their
bands).
Identity
and
relatedness
In
the
previous
definition,
the
value
of
identity
increases
with
the
relatedness
of
individuals.
Table
I
gives
some
values
of
identity
for
common
kinship.
For
all
situations
given
in
this
table,
it
is
assumed
that
parents
in
Go
do
not
share
any
band
and
are
heterozygous
at
all
their
loci.
In
these
conditions,
for
a
single
locus,
the
comparison
between
full
sibs
leads
to
the
definition
of
3
classes
of
identity
0,
1/2
and
1
with
the
respective
probabilities
4/16,
8/16
and
4/16.
For
the
comparison
between
offspring
of a bacl:cross,
4
classes
of
identity
exist
0,
1/2, 2/3
and
1
with
the
respective
probabilities
2/16,
6/16,
4/16
and
4/16.
From
these
examples,
it
is
clear
that
for
a
given
average
identity,
several
kin
relationships
may
exist.
For
instance,
the
expected
values
of
identity
between
parent/offspring
and
between
full-sibs
are
identical
(I
=
50%).
The
same
phenomenon
is
observed
for
the
expected
identities
between
F2
individuals
(offspring
of
FlxF1)
or
between
offspring
of
a
backcross
(I =
60.42%).
This
result
is
more
conclusive
when
the
distributions
of
identity
are
considered
(next
paragraph).
RESULTS
Expressions
and
distributions
of identity
probabilities
Two
simple
models
will
be
considered,
each
of
them
corresponding
to
2
different
genetic
markers
and
2
levels
of
polymorphism
detection.
As
discussion
will
be
in
terms
of
the
application
to
VNTI3s,
model
I
is
related
to
a
monolocus
system
and
model
II
to
a
multilocus
system.
In
both
cases,
to
simplify
the
presentation,
the
existence
of
an
identity
by
state
will
be
neglected.
Expressions
for
the
probabilities
and
distributions
of
identity
will
be
given
for
4
kinships
ie
parent/offspring,
full-
sibs,
half-sibs
and
unrelated
individuals.
Furthermore,
the
distribution
of
identity
between
Fl
individuals
of
a
population,
founded
by
4
unrelated
individuals
(2
males
and
2
females),
will
be
calculated.
Finally,
in
the
second
model,
to
illustrate
the
problem
posed
by
overlapping
generations,
identities
for
4
other
kinships
(grandparent/grandchildren,
uncle/nephew,
cousins
and
double
cousins)
will
be
defined.
Model
I
This
model
corresponds
to
an
idealized
situation.
It
is
assumed
that:
1),
all
loci
present
in
a
genome,
for
a
given
probe,
are
detected;
2),
all
individuals
have
the
same
number
of
loci
(T
i)
and
all
loci
are
heterozygous
(so
that
all
individuals
have
2n
bands);
3),
2
unrelated
individuals
do
not
share
any
bands.
Under
this
model,
the
probability
that
2
individuals
share
i
bands
according
to
their
kinship,
is:
Parent/offspring
(po):
Full-sibs
( f s):
where
CL
is
the
number
of
combinations
of
i
bands
among
2n
bands;
Half-sibs
(hs):
-
Unrelated
individuals
(nr):
The
probability
of
sharing
i
bands
if
the
2
individuals
(a
and
b)
compared
are
derived
from
the
first
generation
of
a
population
founded
by
F
females
and
M
males,
is
given
by:
where
P0,
P1
and
P2
are
the
probabilities
of
drawing
2
individuals
that
are,
respectively,
unrelated,
half-sibs
and
full-sibs
from
the
population.
Assuming
that
all
females
and
all
males
have
the
same
expected
number
of
offspring,
the
values
of
these
probabilities
are :
In
these
expressions
it
is
assumed
that
a
given
female
can
be
inseminated
by
several
males
and
a
given
male
can
inseminate
several
females.
When
F/M
mates
per
males
exist,
ie
monogamy
when
F
=
M,
these
probabilities
become:
According
to
this
model,
the
relationship
between
identity
(I)
and
the
number
of
shared
bands
(i)
is:
&dquo;&dquo;
Model
II
In
this
second
model,
it
is
assumed
that:
1),
the
number
of
bands
per
individual
is
not
constant;
2),
not
all
loci
are
detected;
3),
only
one
band
per
locus
is
detected,
ie
there
are
no
allelic
bands
in
the
fingerprint
of
a
given
individual;
4),
all
loci
are
heterozygous;
5)
2
unrelated
individuals
do
not
share
any
bands;
6),
the
number
of
bands
per
individual
follows
a
Poisson
distribution
with
a
mean
of
n.
Under
these
conditions,
the
probability
that
2
individuals
share
i bands
according
to
their
kin-relationship,
is:
Parent-offspring
(po):
where
P!!!
is
the
probability
that
a
parent
has
exactly
i bands,
e
is
exponential,
and
where
j
max
is
the
highest
possible
value
of j,
ie,
the
maximum
number
of
bands
for
an
individual.
The
probability
P(
j)
is
given
by:
Full-sibs
(fs):
Half-sibs
(hs):
Grandparent-grandchildren
(pc),
uncle/nephew
(un),
double-cousins
(dc):
Cousins
(co):
Unrelated
individuals
(n
T
):
Finally,
if
2
individuals
are
taken
at
random
in
the
F1
generation
of
a
population
founded
by
F
females
and
All
males,
the
probability
that
they
share
i bands
is
given
by
expression
(4).
Otherwise,
according
to
this
model,
the
relationship
between
identity
(I)
and
the
number
of
shared
bands
(i)
is:
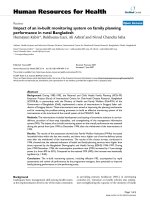
Figure
1
gives
the
theoretical
distributions
of
identities
for
the
2
models
and
for
the
first
4
kinship
relations
described
here.
It
has
been
assumed
that
exactly
10
loci
(ie
exactly
20
bands
per
individual
according
to
the
model
I)
or
an
average
of
10
loci
(ie
about
10
bands
per
individual
in
the
model
II)
can
be
detected.
It
can
be
seen
firstly,
that
the
distributions
of
full-sibs
and
of
half-sibs
are
symmetrical
in
model
I
and
asymmetrical
in
model
II.
Secondly,
in
both
cases,
the
identity
distributions
for
full-sibs
and
half-sibs
broadly
overlap.
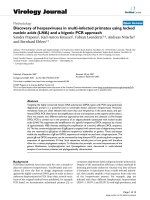
As
shown
in
figure
2,
this
overlapping
decreases
as
the
number
of
loci
increases
from
1
to
20
loci.
However,
it
remains
difficult
to
discriminate
between
the
distributions
of
half-sibs
and
full-sibs
in
the
Fl
progeny
of
a
simple
population
(see
fig
ID).
When
successive
generations
overlap,
it
becomes
more
and
more
difficult
to
estimate
the
true
kinship
between
2
individuals.
Indeed,
the
distributions
of
parent/offspring,
uncle/nephew,
grandparent/grandchildren,
cousins,
and
double-
cousins
must
all
be
considered.
Several
of
these
distributions
have
the
same
average
identity.
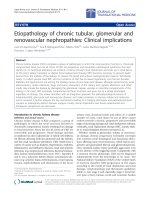
An
illustration
of
this
last
problem
is
given
by
the
analysis
of
a
simple
hypo-
thetical
genealogy
of
3
successive
generations
(fig
3).
In
this
case,
6
unrelated
pairs
of
grandparents
represent
the
first
generation.
These
pairs
each
produce
between
1
and
4
children.
These
children
(a
total
of
15
individuals)
form
the
second
genera-
tion.
The
third
generation
is
composed
of
the
offspring
(a
total
of
16
individuals)
of
the
couples
in
the
second
generation.
In
this
genealogy,
8
kinds
or
relationship
exist
and
their
relative
proportions
are
given
in
table
II.
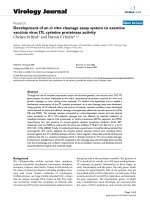
Finally,
figure
4
presents
the
distributions
of
identities
according
to
model
II.
Most
ot
the
distributions
overlap,
making
it
difficult
to
determine
the
exact
kin
relationship
between
2
individuals.
For
instance,
for
an
identity
of
0.25,
the
2
individuals
compared
can
be:
full
sibs
(3.12%),
half
sibs
(2.25%),
uncle/nephew
(35%),
parent/offspring
(3.75%),
grand-
parent/grand
children
(43.75%),
first
cousins
(8.75%),
double
cousins
(3.38%).
Application
to
VNTR
loci
Among
the
2
models
previously
described,
the
latter
seems,
a
priori,
more
realistic
according
to
the
data
obtained
with
multilocus
VNTR
probes.
Although
a
different
approach
has
been
taken,
our
conclusions
agree
with
those
of
Lynch
(1989)
in
pointing
out
the
difficulties
in
estimating
the
relatedness
between
2
individuals
taken
at
random
in
a
population
of
unknown
structure.
The
2
systems
of
probes
allow
one
to
detect
highly
polymorphic
loci
for
which
the
mutation
rate
can
be
close
to
1/100
per
generation
and
per
gamete
(Burke,
1989).
Thus,
the
polymorphism
(number
of alleles)
at
a
given
locus
should
be
much
greater
than
that
generally
observed
for
an
enzymatic
locus.
In
spite
of
this
property,
the
estimation
of
the
true
genetic
relationship
between
2
individuals
remains
hazardous
with
multilocus
probes,
but
seems
more
accurate
with
monolocus
probes.
The
primary
advantages
of
monolocus
probes
are
that:
1),
the
number
of
loci
is
known;
and
2),
the
homozygous
and
heterozygous
states
at
a
locus
can
be
defined
for
a
given
probe
(see
for
example
Nakamura
et
al,
1987).
As
regards
these
advantages,
it
appears
that
model
I,
which
was
not
realistic
with
respect
to
multilocus
probes,
becomes
more
valid
for
monolocus
probes.
Indeed,
in
this
context,
if n
monolocus
probes
are
used
simultaneously,
each
individual
will
be
defined
by
a
number
of
bands
lying
between
n and
2n,
and
at
least
50%
of
these
bands
will
be
transmitted
to
its
offspring
(table
III).
To
improve
model
I,
hypothesis
2
can
be
changed,
insofar
as
it
is
not
necessary
to
consider
that
all
loci
are
heterozygous.
This
is
particularly
important
in
small
and/or
inbred
populations
in
which
the
frequency
of
homozygous
loci
may
increase.
Thus,
for
n
monolocus
probes,
a
given
individual
(a)
will
present
na
bands
with
n <
na <
2n.
The
number
of
homozygous
loci
will
be
HO
=
2n -
na.
In
these
conditions,
the
expressions
of
identity
probabilities
are
identical
to
those
given
in
model
I.
Only
expressions
2
and
3
must
be
calculated
according
to
the
number
of
heterozygous
loci.
Thus,
if
HO
represents
the
average
number
of
homozygous
loci
per
individual
in
a
given
population,
expressions
2
and
3
become:
Full-sibs
( f s):
Half-sibs
(hs):
In
these
conditions,
the
total
number
of
shared
bands
HO
+
i will
be
associated
with
the
above
probabilities
Pfs!i!
or
P
hs
(i)’
The
overlapping
proportion,
between
the
identity
distributions
of
these
2
kin
relationships,
will
be
related
to
the
number
of
heterozygous
loci
in
their
parents.
The
greater
this
number,
the
more
the
2
distributions
will
overlap.
Estimation
of
the
average
degree
of kinship
and
of kinship
structure
The
previous
models
are
simple
cases
with
some
unrealistic
assumptions.
One
assumption
is
that
2
unrelated
individuals
do
not
share
any
bands.
Indeed,
Wetton
et
al
(1987)
and
DT
Parkin
(personal
communication)
have
shown,
using
minisatellite
sequences,
that
unrelated
birds
may
share
between
10
and
25%
of
their
bands,
which
are
probably
identical
in
state
and
not
by
descent.
For
minisatellite
profiles,
this
identity
can
be
due
to
electrophoretic
comigration,
especially
in
the
upper
part
of
the
gel
(Lynch,
1988).
Two
other
unrealistic
assumptions
are
that
all
loci
detected
are
heterozygous
and
that
in
a
fingerprint
there
are
no
allelic
bands.
For
instance,
several
allelic
bands
were
found
in
the
fingerprint
analysis
of
human
families
(Jeffreys
et
al,
1985)
in
dogs
and
cats
(Jeffreys
and
Morton,
1987),
and
in
birds
(Burke
and
Bruford,
1987).
Therefore,
a
more
realistic
model
should
consider:
1),
the
number
of
bands
varies
from
one
individual
to
another;
2),
there
are
homozygous
loci
and
pairs
of
allelic
bands
in
the
fingerprint
of
an
individual;
3),
2
unrelated
individuals
may
share
similar
bands
identical
by
state.
Under
these
assumptions,
it
is
obvious
that
an
accurate
estimate
of
kinship
between
2
individuals
will
be even
more
difficult.
This
results
from
the
increase
in
the
overlapping
proportion
of
the
different
distributions
of
identity,
mainly
due
to
identity
by
state.
However,
with
monolocus
probes
it
seems
possible
to
choose
a
sample
of
probes
which
avoid
or
minimize
these
obstacles.
In
population
genetics,
and
especially
in
the
analysis
of
natural
population
structure,
the
aim
is
not
always
to
get
accurate
estimates
of
kinship
between
different
individuals
(Gilbert
et
al,
1990;
Kuhnlein
et
al,
1990).
In
most
cases,
the
purpose
is
the
estimation
of
the
kinship
structure.
Therefore,
it
is
only
necessary
to
determine
whether
individuals
belong
to
the
same
family
or
not.
On
the
other
hand,
an
identity
in
state
may
exist,
meaning
that
2
unrelated
individuals
may
share
some
of
their
bands.
In
this
situation,
it
becomes
necessary
to
define
a
threshold
value
(TV)
of
identity
which
will
be
used
to
determine
whether
individuals
are
related
or
not.
Below
this
value,
it
will
be
impossible
to
determine
if
two
individuals
are
directly
related
or
share
a
recent
common
ancestor,
and
so
they
will
be
considered
to
be
unrelated;
above
this
value,
it
will
be
considered
that
a
kinship
relation
exists
between
these
individuals.
Of
course,
the
definition
of
TV
depends
upon
the
polymorphism
of
the
genetic
system
used
and
upon
the
population
under
study.
The
more
polymorphic
the
genetic
system
and
the
population,
the
lower
the
TV
will
be.
Estimates
of
the
TV
can
be
obtained
by
comparing
known
unrelated
individuals.
For
instance,
in
the
work
of
Wetton
et
al
(1987)
on
birds,
the
TV
could
be
chosen
between
0.044
and
0.247
(see
table
I,
p
147).
However,
when
nothing
is
known
about
the
kinship
structure
of
the
population,
the
TV
can
be
defined
from
the
identity
of
individuals
belonging
to
different
populations.
If
only
a
fixed
TV
is
defined,
errors
can
be
made
when
identities
are
very
close
to
the
TV.
For
instance,
it
will
be
possible
to
classify
as
unrelated
some
related
individuals
and
to
classify
as
related
some
unrelated
individuals.
Thus,
it
will
be
more
correct
to
define
a
zone
of
uncertainty
around
the
TV
in
which
it
will
be
not
possible
to
determine
whether
2
individuals
are
related
or
not.
Of
course,
the
TV
and
the
uncertainty
zone
will
be
defined
according
to
the
distribution
of
identity
between
unrelated
individuals.
Moreover,
with
this
procedure,
only
individuals
who
are
directly
related
(ie
parent-offspring,
full-sibs,
grandparent/grandchildren,
etc)
will
be
classed
in
the
same
family;
and
according
to
the
TV,
first
cousins,
for
whom
the
expected
identity
is
12.5%
could
be
considered
as
unrelated.
Thus,
employing
an
appropriate
TV
value,
identity
can
indeed
be
used
just
to
determine
whether
individuals
are
related
or
not.
From
an
identity
matrix,
it
is
then
possible
to
estimate
the
proportion
of
pairs
of
related
individuals.
This
corresponds
to
the
probability,
Pr,
of
drawing
at
random
2
individuals
who
share
a
common
ancestor
in
the
recent
past,
ie
in
the
previous
1
or
2
generations,
or
who
are
directly
related.
Moreover,
from
the
same
identity
matrix,
it
is
also
possible
to
define
different
groups
of
related
individuals
or
families
in
order
to
estimate
the
population
structure,
ie
the
number
of
families
and
their
respective
size.
To
get
accurate
estimates
of
Pr
and
of
population
structure,
a
sampling
procedure
similar
to
that
proposed
by
Rouault
and
Capy
(1986)
and
by
Capy
and
Rouault
(1987)
can
be
used.
This
is
a
sequential
procedure
based
on
the
relationship
between
the
sample
size,
the
parameter
estimated
and
confidence
intervals
of
proportions
and/or
a
sampling
error.
In
the
first
case,
the
proportion
of
pairs
of
related
individuals
must
be
estimated.
The
probability
of
observing
np
pairs
of
related
individuals
in
a
sample
of
n
individuals
follows
a
binomial.
Since
a
proportion
(Pr)
must
be
estimated,
the
sampling
procedure
will
be
stopped
when
the
confidence
interval
of
Pr
will
be
equal
to
or
below
a
given
value
fixed
a
priori
before
sampling.
In
the
second
case,
the
population
structure
will
be
defined
by
the
number
and
the
size
of
the
different
groups
of
related
individuals.
Thus,
the
probability
of
drawing
ni
members
of
each
family
i follows
a
multinomial
distribution.
In
this
latter
case,
the
sampling
procedure
should
be
stopped
when
the
probability
of
the
sample
and
the
confidence
interval
of
each
proportion
(here,
the
relative
proportion
of
each
family)
is
equal
to
or
below
the
parameters
defined
prior
to
starting
to
sample
(see
Capy
and
Rouault,
1987,
for
more
details).
DISCUSSION
AND
CONCLUSIONS
The
above
results
complement
those
of
Lynch
(1988)
and
Brookfield
(1989)
and
indicate
the
limits
of
the
use
of
genetic
systems
such
as
minisatellites
for
the
analysis
of
relatedness
in
natural
populations
(see
also
Lewin,
1989).
Nevertheless,
as
has
been
shown
for
birds,
such
systems
may
provide
new
information
to
complete
or
confirm
that
obtained
by
other
techniques
(Wetton
et
al,
1987;
Burke:1989;
Burke
et
al,
1989).
Without
preliminary
data
on
the
structure
of
the
population
(size,
geographical
limit,
age-classes,
etc)
and
on
the
sexual
and/or
family
behavior
of
individuals,
it
is
quite
impossible
to
estimate
the
exact
kinship
relation
between
different
individuals.
However,
if
only
the
relatedness
(without
accurate
estimates
of
the
true
kinship
relation)
between
individuals
is
considered,
it
is
possible
to
envisage
the
estimation
of
an
average
rate
of
kinship
or
of
a
population
structure.
However,
with
genetic
systems
which
show
a
high
mutation
rate
and
for
which
it
is
impossible
to
detect
the
kinship
between
individuals
having
an
identity
of
10-15%,
the
only
individuals
which
can
be
shown
to
be
related
will
be
parent/offspring,
brother-sister,
individuals
involved
in
a
backcross
or,
more
generally,
individuals
of
inbred
strains
or
families.
The
main
advantage
of
the
model
proposed
here
is
that
it
is
not
necessary
to
identify
the
different
alleles
and
their
relative
frequencies.
However,
this
can
be
done
for
monolocus
probes,
and
in
this
case
a
method
similar
to
that
proposed
by
Queller
and
Goodnight
(1989)
could
be
used
for
estimation
of
relatedness.
In
the
present
work,
only
2
kinds
of
hypothetical
genetic
systems
have
been
considered.
Among
the
different
systems
already
described,
several
could
be
used
for
such
an
analysis.
The
main
characteristics
of
a
suitable
system
would
be
the
following:
(1)
each
individual
has
a
great
number
of
bands
(from
10
to
30);
(2)
heterozygosity
must
be
high;
(3)
the
number
of
bands
shared
by
unrelated
individuals
must
be
as
low
as
possible.
With
regard
to
the
multilocus
probes
available,
most
of
them
do
not
fulfill
all
these
conditions.
The
number
of
bands
may
vary
from
2-3
to
more
than
20;
the
heterozygosity
and
the
mutation
rate
seem
to
be
variable
but
very
high
(in
some
cases, ;:
97%
for
the
heterozygosity
and
0.003
per
gamete
for
the
mutation
rate;
Jeffreys
et
al,
1988);
but
the
number
of
bands
shared
between
unrelated
individuals
may
be
large
(z
14%
in
birds;
Wetton
et
al,
1987).
With
the
development
of
monolocus
probes,
many
inconveniences
could
be
avoided
or
reduced.
Several
probes
could
be used
simultaneously,
as
different
enzymatic
loci,
with
the
advantage
that
most
loci
possess
a
high
mutation
rate
and
probably
a
uniform
distribution
of
their
respective
alleles
in
a
given
population
as
well.
Moreover,
with
such
probes
it
becomes
possible
to
minimize
the
level
of
identity
in
state
between
bands
of
2
individuals.
ACKNOWLEDGMENTS
We
thank
D
Iirane,
DL
Hartl,
A
Larson,
M
Hedin
and
2
anonymous
referees
for
helpful
comments.
REFERENCES
Burke
T
(1989)
DNA
fingerprinting
and
other
methods
for
the
study
of
mating
success.
Trends
Ecol
Evol
5,
139-144
Burke
T,
Bruford
MW
(1987)
DNA
fingerprinting
in
birds.
Nature
(Lond)
327,
149-152
Burke
T,
Davies
NB,
Bruford
MW,
Hatchwell
BJ
(1989)
Parental
care
and
mating
behaviour
of polyandrous
dunnocks
Prunella
modularis
related
to
paternity
by
DNA
fingerprinting.
Nature
(Lond)
338,
249-251
Brookfield
JF1’
(1989)
Analysis
of
DNA
fingerprinting
data
in
cases
of
disputed
paternity.
IMA
J
Math
Appl
Med
Biol 6,
11-131
Capy
P.
Rouault
J
(1987)
Estimation
of allele
number
in
a
natural
population
by
the
isofemale
line
method.
Genetics
117,
795-801
Chakraborty
R,
Meagher
TR,
Smouse
PE
(1988)
Parentage
analysis
with
genetic
markers
in
natural
populations.
I.
The
expected
proportion
of
offspring
with
unambiguous
paternity.
Genetics
118,
527-536
Co3-ne
JA
(1976)
Lack
of
genetic
similarity
between
two
sibling
species
as
revealed
by
varied
techniques.
Genetics
84,
593-607
Dainou
0,
Cariou
ML,
David
JR,
Hickey
D
(1987)
Amylase
gene
duplication:
an
ancestral
trait
in
the
Drosophila
melanogaster
species
subgroup.
Heredity
59,
245-
251
Danielli
GA,
Costa
R
(1977)
Transient
equilibrium
at
the
Est-6
locus
in
wild
population
of
Drosophila
melanogaster.
Genetica
47,
37-41
David
JR,
Alonso-Morraga
A,
Capy
P,
Munoz-Serrano
A,
Vouidibio
J
(1989)
Short
range
variations
and
alcohol
resources
in
Drosophila
melanogaster.
Symp
Evolutionary
Biology
of
Transient
Unstable
Populations
(Fontevilla
A,
ed)
Springer-
Verlag
Berlin,
130-143
Dausset
J
(1958)
Iso-leuco-anticorps.
Acta
Hematol 20,
156
Dausset
J,
Svejgaard
A
(1977)
HLA
and
Diseases.
Munksgaard,
Copenhagen
Gilbert
DA,
Lehman
N,
O’Brien
SJ,
Wayne
RK
(1990)
Genetic
fingerprinting
reflects
population
differentiation
in
the
California
Channel
Island
fox.
Nature
(Lond)
344,
764-767
Jeffreys
AJ,
Wilson
V,
Thein
SL
(1985)
Hypervariable
&dquo;minisatellite&dquo;
regions
in
human
DNA.
Nature
(Lond)
314, 67-73
Jeffreys
AJ,
Morton
DB
(1987)
DNA
fingerprints
of
dogs
and
cats.
Anim
Genet
18,
1-15
Jeffreys
AJ,
Royle
NJ,
Wilson
V,
Wong
Z
(1988)
Spontaneous
mutation
rates
to
new
length
alleles
at
tandem-repetitive
hypervariable
loci
in
human
DNA.
Nature
(Lond)
332,
278-281
Keith
TP
(1983)
Frequency
distribution
of esterase-5
alleles
in
two
populations
of
Drosophila
pseudoobscura.
Genetics
105,
135-155
Klein
J
(1987)
Natural
History
of
the
Major
Histocompatibility
Complex.
John
Wiley
and
Sons,
New
York
Kuhnlein
U,
Zadworny
D,
Dawe
Y,
Fairfull
RW,
Gavora
JS
(1990)
Assessment
of
inbreeding
by
DNA
fingerprinting:
development
of
a
calibration
curve
using
defined
strains
of
chickens.
Genetics
125,
161-165
Lewin
R
(1989)
Limits
to
DNA
fingerprinting.
Science
243,
1549-1551
Lynch
M
(1988)
Estimation
of
relatedness
by
DNA
fingerprinting.
Mol
Biol
Evol 5,
584-599
Modiano
G,
Battistuzzi
G,
Esan
GJF,
Testa
V,
Lazzato
L
(1979)
Genetic
het-
erogeneity
of
&dquo;normal&dquo;
human
erythrocyte
glucose-6-phosphate
dehydrogenase:
an
electrophoretic
polymorphism.
Proc
Natl
Acad
Sci
USA
76,
852-856
Nakamura
Y,
Leppert
M,
O’Connell
P,
Wolff
R,
Holm
T,
Culver
M,
Martin
C,
Fujimoto
E,
Hoff
M,
Kumlin
E,
White
R
(1987)
Variable
number
of
tandem
repeat
(VNTR)
markers
for
human
gene
mapping.
Science
235,
1616-1622
lVei
M,
Li
WH
(1979)
Mathematical
model
for
studying
genetic
variation
in
terms
of
restriction
endonucleases.
Proc
Natl
Acad
Sci
USA,
76,
5269-5273
Pamilo
P
(1984)
Genotypic
correlation
and
regression
in
social
groups:
multiple
alleles,
multiple
loci
and
subdivided
populations.
Genetics
107,
307-320
Pamilo
P,
Crozier
RH
(1982)
Measuring
genetic
relatedness
in
natural
populations:
methodology.
Tfieor
Popul
Biol 21,
171-193
Queller
DC,
Strassmann
JE,
Hughes
CR
(1988)
Genetic
relatedness
in
colonies
of
tropical
wasps
with
multiple
queens.
Science
242,
1155-1157
Queller
DC,
Goodnight
KF
(1989)
Estimating
relatedness
using
genetic
markers.
Evolution
43,
258-275
Ramshaw
JAM,
Coyne
JA,
Lewontin
RC
(1979)
The
sensitivity
of
gel
electrophore-
sis
as
a
detector
of
genetic
variation.
Genetics
93,
1019-1037
Rouault
J,
Capy
P
(1986)
Comment
6valuer
un
nombre
de
categories
par
6chantillonnage.
Ann
Econ
Stat 4,
111-124
Singh
RS
(1979)
Genic
heterogeneity
within
electrophoresis
&dquo;alleles&dquo;
and
the
pattern
of
variation
among
loci
in
Drosophila
pseudoobscura.
Genetics
93,
997-1018
Singh
RS,
Lewontin
RC,
Felton
AA
(1976)
Genic
heterogeneity
within
elec-
trophoretic
&dquo;alleles&dquo;
of
xanthine
dehydrogenase
in
Drosophila
pseudoobscura.
Ge-
netics
84,
609-629
Schwartz
OA,
Armitage
hB
(1983)
Problems
in
the
use
of
genetic
similarity
to
show
relatedness.
Evolution
37,
417-420
Vaiman
M,
Renard
C,
Lafage
P,
Ameteau
J,
Nizzu
P
(1970)
Evidence
for
a
histocompatibility
system
in
pig.
Transplantation
10,
155-164
Vouidibio
J,
Capy
P,
Defaye
D,
Pla
E,
Sandrin
J,
Csink
A,
David
JR
(1989)
Short
range
genetic
structure
of
Drosophila
melanogaster
populations
in
an
Afrotropical
urban
area,
and
its
significance.
Proc
Natl
Acad
Sci
USA
86,
8442-8446
Wetton
JH,
Carter
RE,
Parkin
DT,
Walters
D
(1987)
Demographic
study
of
a
wild
house
sparrow
population
by
DNA
fingerprinting.
Nature
(Lond)
327,
147-149
Wilkinson
GS,
lVIcCraken
GF
(1985)
On
estimating
relatedness
using
genetic
markers.
Evolution
39,
1169-1174