Báo cáo sinh học: " Bias and sampling covariances of estimates of variance components due to maternal effects" pdf
Bạn đang xem bản rút gọn của tài liệu. Xem và tải ngay bản đầy đủ của tài liệu tại đây (1.11 MB, 23 trang )
Original
article
Bias
and
sampling
covariances
of
estimates
of
variance
components
due
to
maternal
effects
K
Meyer
Edinburgh
University,
Institute
for
Cell,
Animal
and
Population
Biology,
West
Mains
Road,
Edinburgh
EH9
3JT,
Scotland,
UK;
Unibersity
of
New
England,
Animal
Genetics
and
Breeding
Unit,
Armidale,
NSW
2351,
Australia
(Received
13
September
1991;
accepted
26
August
1992)
Summary -
The
sampling
behaviour
of
Restricted
Maximum
Likelihood
estimates
of
(co)variance
components
due
to
additive
genetic
and
environmental
maternal
effects
is
examined
for
balanced
data
with
different
family
structures.
It
is
shown
that
sampling
correlations
between
estimates
are
high
and
that
sizeable
data
sets
are
required
to
allow
reasonably
accurate
estimates
to
be
obtained,
even
for
designs
specifically
formulated
for
the
estimation
of
maternal
effects.
Bias
and
resulting
mean
square
error
when
fitting
the
wrong
model
of
analysis
are
investigated,
showing
that
an
environmental
dam-offspring
covariance,
which
is
often
ignored
in
the
analysis
of
growth
data
for
beef
cattle,
has to
be
quite
large
before
its
effect
is
statistically
significant.
The
efficacy
of
embryo
transfer
in
reducing
sampling
correlations
direct
and
maternal
genetic
(co)variance
components
is
illustrated.
maternal
effect
/
variance
component
/
sampling
covariance
Résumé -
Biais
et
covariances
d’échantillonnage
des
estimées
de
composantes
de
variance
dues
à
des
effets
maternels.
Les
propriétés
d’échantillonnage
des
estimées
du
maximum
de
vraisemblance
restreint
des
variances-covariances
dues
à
des
effets
maternels
génétiques
additifs
et
de
milieu
sont
examinées
sur
des
données
d’un
dMpo!!<!/ e!MtK&re
et
avec
différentes
structures
familiales.
On
montre
que
les
corrélations
d’échantillonnage
en-
tre
les
estimées
sont
élevées
et
qu’un
volume
de
données
important
est
requis
pour
obtenir
des
estimées
raisonnablement
précises,
même
avec
des
dispositifs
établis
spécifiquement
pour
estimer
des
effets
maternels.
L’étude
du
biais
et
de
l’erreur
quadratique
moyenne
résultant
de
l’ajustement
d’un
modèle
incorrect
montre
qu’une
covariance
mère-fille
due
au
milieu,
souvent
ignorée
dans
l’analyse
des
données
de
croissance
des
bovins
à
viande,
doit
être
très
grande
pour
que
son
effet
soit
statistiquement
significatif.
L’efficacité
du
transfert
d’embryon
pour
réduire
les
corrélations
d’échantillonnage
entre
les
variances-covariances
génétiques
directes
et
maternelles
est
illustrée.
effet
maternel
/
composante
de
variance
/
covariance
d’échantillonnage
INTRODUCTION
The
importance
of
maternal
effects,
both
genetic
and
environmental,
for
the
early
growth
and
development
of
mammals
has
long
been
recognised.
For
post-natal
growth,
these
represent
mainly
the
dam’s
milk
production
and
mothering
ability,
though
effects
of
the
uterine
environment
and
extra-chromosomal
inheritance
may
contribute.
Detailed
biometrical
models
have
been
suggested.
Willham
(1963)
distinguished
between
the
animal’s
and
its
mother’s,
ie
direct
and
maternal,
additive
genetic,
dominance
and
environmental
effects
affecting
the
individual’s
phenotype.
Allowing
for
direct-maternal
covariances
between
each
of
the
3
effects,
this
gave
a
total
of
9 causal
(co)variance
components
contributing
to
the
resemblance
between
relatives.
Willham
(1972)
described
an
extension
to
include
grand-maternal
effects
and
recombination
loss.
Estimation
of
maternal
effects
and
the
pertaining
genetic
parameters
is
inher-
ently
problematic.
Unless
embryo
transfer
or
crossfostering
has
taken
place,
direct
and
maternal
effects
are
generally
confounded.
Moreover,
the
expression
of
mater-
nal
effects
is
sex-limited,
occurs
late
in
life
of
the
female
and
lags
by
one
generation
(Willham,
1980).
Methods
to
estimate
(co)variances
due
to
maternal
effects
have
been
reviewed
by
Foulley
and
Lefort
(1978).
Early
work
relied
on
estimating
co-
variances
between
relatives
separately,
equating
these
to
their
expectations
and
solving
the
resulting
system
of
linear
equations.
However,
this
ignored
the
fact
that
the
same
animal
might
have
contributed
to
different
types
of
covariances
and
that
different
observational
components
might
have
different
sampling
variances,
ie
combined
information
in
a
non-optimal
way.
In
addition,
sampling
variances
of
estimates
could
not
be
derived
(Foulley
and
Lefort,
1978).
Thompson
(1976)
presented
a
maximum
likelihood
(ML)
procedure
which
over-
comes
these
problems
and
showed
how
it
could
be
applied
to
designs
found
in
the
literature.
He
considered
the
ML
method
most
useful
when
data
were
balanced
due
to
computational
requirements
in
the
unbalanced
case.
Over
the
last
decade,
ML
es-
timation,
in
particular
Restricted
Maximum
Likelihood
(REML)
as
first
described
by
Patterson
and
Thompson
(1971),
has
found
increasing
use
in
the
estimation
of
(co)variance
components
and
genetic
parameters.
Especially
for
animal
breed-
ing
applications
this
almost
invariably
involves
unbalanced
data.
Recently,
analyses
under
the
so-called
animal
model,
fitting
a
random
effect
for
the
additive
genetic
value
of
each
animal,
have
become
a
standard
procedure.
To
a
large
extent,
this
was
facilitated
by
the
availability
of
a
derivative-free
REML
algorithm
(Graser
et
al,
1987)
which
made
analysis
involving
thousands
of
animals
feasible.
Maternal
effects,
both
genetic
and
environmental,
can
be
accommodated
in
animal
model
analyses
by
fitting
appropriate
random
effects
for
each
animal
or
each
dam
with
progeny
in
the
data.
Conceptually,
this
simplifies
the
estimation
of
genetic
parameters
for
maternal
effects.
Rather
than
having
to
determine
the
types
of
covariances
between
relatives
arising
from
the
data
and
their
expectations,
to
estimate
each
of
them
and
to
equate
them
to
their
expectations,
we
can
estimate
maternal
(co)variance
components
in
the
same
way
as
additive
genetic
(co)variances
with
the
animal
model,
namely
as
variances
due
to
random
effects
in
the
model
of
analysis
(or
covariances
between
them).
The
derivative-free
REML
algorithm
extends
readily
to
this
type
of
analyses
(Meyer,
1989).
As
emphasised
by
Foulley
and
Lefort
(1978),
estimates
of
genetic
parameters
are
likely
to
be
imprecise.
Thompson
(1976)
suggested
that
in
the
presence
of
maternal
effects,
sampling
variances
of
estimates
of
the
direct
heritability
would
be
increased
3-5-fold
over
those
which
would
be
obtained
if
only
direct
additive
genetic
effects
existed.
Special
experimental
designs
to
estimate
(co)variances
due
to
maternal
effects
have
been
described,
for
instance,
by
Eisen
(1967)
and
Bondari
et
al
(1978).
Thompson
(1976)
applied
his
ML
procedure
to
these
designs
and
showed
that
for
Bondari
et
al’s
(1978)
data,
estimates
of
maternal
components
had
not
only
large
standard
errors
but
also
high
sampling
correlations.
In
the
estimation
of
maternal
effects
for
data
from
livestock
improvement
schemes,
non-additive
genetic
effects
and
a
direct-maternal
environmental
covari-
ance
have
largely
been
ignored.
In
part,
this
has
been
due
to
the
fact
that
often
the
types
of
covariances
between
relatives
available
in
the
data
do
not
have
sufficiently
different
expectations
to
allow
all
components
of
Willham’s
(1963)
model
to
be
estimated.
Even
for
Bondari
et
al’s
(1978)
experiment,
providing
11
types
of
rela-
tionships
between
animals,
Thompson
(1976)
emphasised
that
only
7
parameters,
6
(co)variances
and
a
linear
function
of
the
direct
and
maternal
dominance
variance
and
the
maternal
environmental
variance,
could
be
estimated.
In
field
data,
the
contrasts
between
relatives
available
are
likely
to
be
fewer,
thus
limiting
the
scope
to
separate
the
various
maternal
components.
In
the
analysis
of
pre-weaning
growth
traits
in
beef
cattle,
components
estimated
have
generally
been
restricted
to
the
direct
additive
genetic
variance
(o, A 2 ),
the
maternal
additive
genetic
variance
(0-2 m ),
the
direct-maternal
additive
genetic
covariance
(0-
AM),
the
maternal
environmental
variance
(o-b)
and
the
residual
error
variance
(a
5)
or
a
subset
thereof;
see
Meyer
(1992)
for
a
recent
summary.
Using
data
from
an
experimental
herd
which
supplied
various
&dquo;unusual&dquo;
relationships,
Cantet
et
al
(1988)
attempted
to
estimate
all
components.
There
has
been
concern
about
a
negative
direct-maternal
environmental
covariance
(0-
EC
)
in
this
case
(Koch,
1972)
which,
if
ignored,
is
likely
to
bias
estimates
of
the
other
components
and
corresponding
genetic
parameters,
in
particular
the
direct-maternal
genetic
correlation
(rA,!r).
Summarising
literature
results
in-
and
excluding
information
from
the
dam-offspring
covariance,
the
only
observational
component
affected
by
LTEC
,
Baker
(1980)
reported
mean
values
of
r
AM
of
-0.42
and
0.0
for
birth
weight,
- 0.45
and
-0.05
for
daily
gain
from
birth
to
weaning
and
-0.72
and
-0.07
for
weaning
weight,
respectively.
While
the
modern
methods
of
analysis
together
with
the
availability
of
high
speed
computers
and
the
appropriate
software
make
it
easier
to
estimate
genetic
parameters
due
to
maternal
effects,
they
might
make
it
all
too
easy
to
ignore
the
inherent
problems
of
this
kind
of
analyses
and
to
ensure
that
all
parameters
fitted
can
be
estimated
accurately.
Unexpected
or
inconsistent
estimates
have
been
attributed
to
high
sampling
correlations
between
parameters
or
bias
due
to
some
component
not
taken
into
account
without
any
quantification
of
their
magnitude
(eg
Meyer,
1992).
The
objective
of
this
paper
was
to
examine
REML
estimates
of
genetic
parameters
due
to
maternal
effects,
investigating
both
sampling
(co)variances
and
potential
bias
due
to
fitting
the
wrong
model
of
analysis.
MATERIAL
AND
METHODS
Theory
Consider
a
mixed
liner
model,
where
y,
b,
u
and
e
denote
the
vector
of
observations,
fixed
effects,
random
effects
and
residual
errors,
respectively,
and
X
and
Z
are
the
incidence
matrices
pertaining
to
b and
u.
Let
V
denote
the
variance
matrix
of
y.
The
REML
log
likelihood
(.C)
is
then
For
the
majority
of
REML
algorithms
employed
in
the
analysis
of
animal
breeding
data,
[2]
and
its
derivatives
have
been
re-expressed
in
terms
arising
in
the
mixed
model
equations
pertaining
to
!1!.
An
alternative,
based
on
the
principle
of
constructing
independent
sums
of
squares
(SS)
and
crossproducts
(CP)
of
the
data
as
for
analyses
of
(co)variances,
has
been
described
by
Thompson
(1976,
1977).
As
a
simple
example,
he
considered
data
with
a
balanced
hierarchical
full-sib
structure
and
records
available
on
both
parents
and
offspring,
showing
that
the
SS
within
dams,
between
dams
within
sires
and
between
sires,
as
utilised
in
an
analysis
of
variance
(for
data
on
offspring
only),
could
be
extended
to
include
information
on
parents.
This
was
accomplished
by
augmenting
the
later
2
by
rows
and
columns
for
dams
and
sires,
yielding
a
2
x
2
and
a
3
x
3
matrix,
respectively,
with
the
additional
elements
representing
offspring
parent
CP,
and
SS/CP
among
parents;
see
Thompson
(1977)
for
a
detailed
description.
More
generally,
let
the
data
be
represented
by
p
independent
matrices
of
SS/CP
S!.,
each
with
associated
degrees
of
freedom
d! (k
=
1, , P).
The
corresponding
matrices
of
mean
squares
and
products
are
then
M!;
=
S!/d!
with
expected
values
V!,
and
[2]
can
be
rewritten
as
(Thompson,
1976):
In
the
estimation
of
(co)variance
components,
V
and
the
matrices
V!
are
usually
linear
functions
of
the
parameters
to
be
estimated,
A
=
f Oi
with
i
=
1, , t,
ie
REML
estimates
of
0
can
then
be
determined
as
iterative
solutions
to
(Thompson,
1976)
with
B
=
lbij
and
q
=
fq
i
for
i, j = 1, , t,
and
This
is
an
algorithm
utilising
second
derivatives
of
log
G.
At
convergence,
an
estimate
of
the
large
sample
covariance
matrix
of
6
is
given
by
-2B-
1.
As
emphasised
by
Thompson
(1976),
B
is
singular
if
a
linear
combination
of
the
matrices
F!i
is
zero
for
all
k,
which
implies
that
not
all
parameters
can
be
estimated.
This
methodology
can
be
employed
readily
to
examine
the
properties
for
REML
estimates
for
various
models.
Consider
data
consisting
of
records
for
f
independent
families.
Hence
V!;,
M!;
and
the
F!i
can
be
evaluated
for
one
family
at
a
time.
If
the
data
are
&dquo;balanced&dquo;,
ie
all
families
are
of
size
n
and
have
the
same
structure,
these
calculations,
involving
matrices
of
size n
x
n,
are
required
only
once,
ie
p
=
1.
Fitting
an
overall
mean
as
the
only
fixed
effect,
the
associated
degrees
of
freedom
of
S¡
are
then
f —
1.
’
Let
a
record y
j
for
animal j
with
dam
j’
be
determined
by
the
animal’s
(direct)
additive
genetic
value
a!,
its
dam’s
maternal
genetic
effect
mj
,,
its
dam’s
maternal
environmental
effect
Cj’
and
a
residual
error
e!,
ie:
with a
denoting
the
overall
mean.
Assume
with
all
remaining
covariances
equal
to
zero.
Letting,
in
turn,
maternal
effects
m!’
and
Cj’
be
present
or
absent
and
covariances
O’A
yl
and
UEC
be
zero
or
not,
yields
a
total
of
9
models
of
analysis
as
summarised
in
table
I.
Clearly,
Mk
in
[4]
above
represents
the
contribution
of
the
data
to
log
G,
ie
relates
to
the
&dquo;true&dquo;
model
describing
the
data.
Conversely,
V!
is
determined
by
the
&dquo;assumed&dquo;
model
of
analysis,
ie
the
effect
of
fitting
an
inappropriate
model
can
be
examined
deriving
V!.
under
the
wrong
model.
Furthermore,
the
information
contributed
by
individual
records
can
be
assessed
by
&dquo;omitting&dquo;
these
records
from
the
analysis
which
operationally
is
simply
achieved
by
setting
the
corresponding
rows
and
columns
in
V!
and
Mk
to
zero.
Analyses
In
total,
6
family
structures
were
considered.
The
first,
denoted
by
FS1,
was
a
simple
hierarchical
full-sib
design
with
records
for
both
parents
and
offspring
for
f
sires
mated
to d
dams
each
with
m
offspring
per
dam,
ie
f
families
of
size
n
=
1
+
d(l
+
m).
As
shown
in
table
II,
this
yielded
only
5
types
of
covariances
between
relatives,
ie
not
all
9
models
of
analysis
could
be
fitted.
Linking
pairs
of
such
families
by
assuming
the
sire
of
family
1
to
be
a
full
sib
(FS
2
F)
or
paternal
half
sib
(FS
2
H)
to
one
of
the
dams
mated
to
sire
2
then
added
up
to
3
further
relationships
(see
table
II).
With
s
=
2
sires
per
family,
this
gave
a
family
size
of
n = 2(1 + d(i
+
m)).
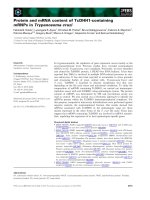
The
fourth
design
examined
was
design
I
of
Bondari
et
al
(1978) .
As
depicted
in
figure
1,
this
was
created
by
mating
2
unrelated
grand-dams
to
the
same
grand-
sire
and
recording
1
male
and
one
female
offspring
for
each
dam.
Paternal
half-
sibs
of
opposite
sex
were
then
chosen
among
these
4
animals
and
each
of
these
2
mated
to
a
random,
unrelated
animal.
From
each
of
these
matings,
2
offspring
were
recorded.
For
Bondari’s
design
I
(B1),
records
on
grand-parents
and
random
mates
were
assumed
unknown,
yielding
a
family
size
of
n
=
8
and
10
types
of
relationships
between
animals. Assuming,
for
this
study,
the
former
to
be
known
then
increased
the
family
size
for
design
B1P
to
n
=
13
and
added
grand-parent
offspring
covariances
to
the
observational
components
available.
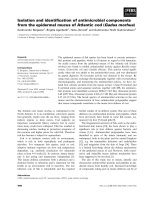
The
last
design
chosen
was
Eisen’s
design
1
(E1).
For
this,
each
family
consisted
of
s
sires
which
were
full-sibs
and
each
sire
was
mated
to
d,
dams
from
an
unrelated
full-sib
family
and
to
d2
dams
from
an
unrelated
half-sib
family.
Each
dam
had
m
offspring
which
yielded
a
family
size
of
n
=
s(l
+
dl
+
d2
)(1
+
n)).
As
shown
in
table
II,
this
produced
a
total
of
13
different
types
of
relationships
between
animals.
Figure
2
illustrates
the
mating
structure
for
this
design.
For
each
design
and
set
of
genetic
parameters
considered,
the
matrix
of
mean
squares
and
products,
M!
was
constructed
assuming
the
population
(co)variance
components
to
be
known
and
&dquo;estimates&dquo;
under
various
models
of
analysis
were
obtained
using
the
Method
of
Scoring
(MSC)
algorithm
outlined
above
(see
(5!).
Results
obtained
in
this
way
are
equivalent
to
those
obtained
as
means
over
many
replicates.
Large
sample
values
of
sampling
errors
and
sampling
correlations
between
parameter
estimates
were
then
obtained
from
the
inverse
of
the
information
matrix,
F
=
—2B!.
This
is
commonly
referred
to
as
the
formation
matrix
(Edwards,
1966).
Simulation
was
carried
out
by
sampling
matrices
M*
from
an
appropriate
Wishart
distribution
with
covariance
matrix
M!;
and
f —
1
degrees
of
freedom
and
obtaining
estimates
of
(co)variance
components
and
their
sampling
variances
and
correlations
using
the
MSC
algorithm.
However,
this
did
not
guarantee
estimates
to
be
within
parameter
space.
Hence,
if
estimates
out
of
bounds
occurred,
estimation
was
repeated
using
a
derivative-free
(DF)
algorithm,
calculating
log
G
as
given
in
[4]
and
locating
its
maximum
using
the
Simplex
procedure
due
to
Nelder
and
Mead
(1965).
This
allowed
estimates
to
be
restrained
to
the
parameter
space
simply
by
assigning
a
very
large,
negative
value
to
log
G
for
non-permissible
vectors
of
parameters
(Meyer,
1989).
Large
sample
95%
confidence
intervals
were
calculated
as
estimate
!1.96x
the
lower
bound
sampling
error
obtained
from
the
information
matrix.
Corresponding
likelihood
based
confidence
limits
(Cox
and
Hinkley,
1974)
were
determined,
as
described
by
Meyer
and
Hill
(1992),
as
the
points
on
the
profile
likelihood
curve
for
each
parameter
for
which
the
log
profile
likelihood
differed
from
the
maximum
by —1.92,
ie
the
points
for
which
the
likelihood
ratio
test
criterion
would
be
equal
to
the
XZ
value
pertaining
to
one
degree
of
freedom
and
an
error
probability
of
5%
(!%=3.84).
RESULTS
AND
DISCUSSION
Sampling
covariances
Sampling
errors
(SE)
of
(co)variance
component
estimates
based
on
2 000
records
from
analyses
under
Model
6,
ie
when
both
genetic
and
environmental
maternal
effects
are
present
and
there
is
a
direct-maternal
genetic
covariance,
are
summarised
in
table
III
for
data
sets
of
3
designs,
and
2
sets
of
population
(co)variances.
For
comparison,
values
which
would
be
obtained
for
equal
heritability
and
phenotypic
variance
in
the
absence
of
maternal
effects
(Model 1)
are
given.
The
most
striking
feature
of
table
III
is
the
magnitude
of
sampling
errors
even
for
a
quite
large
data
set
and
for
designs
like
B1
and
El
which
have
been
especially
formulated
for
the
estimation
of
maternal
effects
components.
In
all
cases,
SE((j!)
under
Model
6
is
about
twice
that
under
Model 1.
FS2F
and
El
yield
considerably
more
accurate
estimates
than
B1
under
Model 1,
with
virtually
no
difference
between
the
former
2
for
parameter
set
1.
Estimates
from
design
El
with
the
most
contrasts
between
relatives
available
have
an
average
variance
about
a
quarter
of
those
from
FS2F
and
a
third
of
those
from
Bl
for
parameter
set
I,
ie
a
high
direct
heritability
and
low
negative
direct-maternal
correlation,
and
are
comparatively
even
less
variable
for
parameter
set
II,
ie
a
low
direct
and
medium
maternal
heritability
and
a
moderate
to
high
positive
genetic
correlation.
Table
IV
gives
means
and
empirical
deviations
of
estimates
of
(co)variance
components
and
their
sampling
errors
under
Model
6
for
1000
replicates
for
a
data
set
of
size
2
000
for
parameter
set
1.
While
MSC
estimates
agree
closely
with
the
population
values,
corresponding
mean
DF
estimates
are,
by
definition,
biased
due
to
the
restriction
on
the
parameter
space
imposed.
This
is
particularly
noticeable
for
designs
FS2F
and
B1
with
355
and
258
replicates
for
which
estimates
needed
to
be
constrained.
Overall,
however,
corresponding
estimates
of
the
asymptotic
lower
bound
errors
appear
little
affected:
means
over
all
replicate
and
considering
replicates
within
the
parameter
space
only
(MSC
*)
show
only
small
differences,
except
for
FS2F,
and
agree
with
the
population
values
given
in
table
III.
Moreover,
standard
deviations
over
replicates
for
these
(not
shown)
are
small
and
virtually
the
same
for
MSC
and
MSC!‘,
ranging
from
0.22
(SE(â
1)
for
B1)
to
1.19
(SE(âÄ
1)
for
FS2F).
In
turn,
empirical
standard
deviations
of
MSC
estimates
agree
well
with
their
expected
values,
being
on
average
slightly
higher.
Those
of
the
DF
estimates,
however,
are
in
parts
substantially
lower,
demonstrating
clearly
that
constraining
estimates
alters
their
distribution,
ie
that
large
sample
theory
does
not
hold
at
the
bounds
of
the
parameter
space.
Table
V
presents
both
large
sample
(LS)
and
profile
likelihood
(PL)
derived
confidence
intervals
corresponding
to
parameter
estimates
in
table
IV,
determined
for
the
population
(co)variances.
As
noted
for
other
examples
by
Meyer
and
Hill
(1992),
unless
bounds
of
the
parameter
space
are
exceeded,
predicted
lengths
of
the
interval
from
the
2
methods
agree
consistently
better
than
values
for
the
position
of
the
confidence
bounds.
Lower
PL
limits
for
a2
m
and
a2
c
for
designs
FS2F
and
B1
could
not
be
determined
(as
the
log
profile
likelihood
curve
to
the
left
of
the
estimates
was
so
flat
that
it
did
not
deviate
from
the
maximum
by
-1.92),
and
were
thus
set
to
zero,
the
bound
of
the
parameter
space.
While
differences
between
PL
and
LS
intervals
are
small
for
all
designs
for
larger
data
sets
(not
shown),
considerable
deviations
occur
for
the
2 000
record
case,
particularly
for
Q
AM
and
the
upper
limits
for
62
m
and
62
c
for
FS2F
and
B1.
empirical
and
expected
sampling
correlations
between
DF
esti-
mates
of
(co)variance
components
are
contrasted
in
table
VI.
Mean
expected
values
over
replicates
were
in
all
cases
equal
(to
the
second
or
third
decimal
place)
to
those
derived
from
the
information
matrix
of
the
population
parameters.
While
empiri-
cal
values
for
larger
data
sets
(not
shown)
again
agree
well
with
their
theoretical
counterparts,
those
based
on
2
000
records
deviate,
again
reflecting
the
effect
of
constraining
estimates
to
the
parameter
space
on
their
sampling
distribution.
De-
viations
are
in
places
considerable
for
parameter
set
II,
for
which
estimates
from
773,
726
and
553
replicates
for
FS2F,
B1
and
E1,
respectively,
needed
to
be
cons-
trained
to
the
parameter
space.
Overall,
however,
some
of
the
sampling
correlations
(expected
values)
show
remarkably
little
variation
between
designs
or
differences
between
parameter
sets
considered.
6;1
and
û1
are
consistently
highly
negatively
correlated,
with
values
of
!
-0.8
to
-0.9; while
5!
and
the
maternal
effects
components,
6’
and
iT- 2 ,
show
comparatively
little
(though
more
variable)
association,
correlations
ranging
from
0
to m
0.4
and
0
to m
-0.3,
respectively.
Similarly,
correlations
between
û1
and
û1
are
low
and
negative
and
between
<7!.
and
3%
are
low
and
positive
or
negative
and
close
to
zero.
Differences
between
designs
and
the
amount
of
information
available
to
separate
not
only
direct
and
maternal
but
also
maternal
genetic
and
environmental
com-
ponents
as
apparent
in
table
III,
however,
are
clearly
exhibited
in
the
correlations
among
û1,
a’ m
and
9!
While
the
correlation
between
û1
and
6
AM
is
as
high
as
-0.9
for
FS2F,
it
is
reduced
in
magnitude
to
-0.8
for
B1
and
-0.7
to
-0.6
for
El.
Correspondingly,
a
high
positive
correlation
between
%
AM
and
QC
for
FS2F
(!
0.9)
and
Bl
(! 0.7)
is
reduced
substantially
for
El
(to m
0.4).
FAMILY
STRUCTURE
The
relationship
between
family
structure
and
sampling
(co)variances
for
a
given
number
of
records
is
further
investigated
in
table
VII,
for
analyses
under
Models
1
and
4.
The
total
genetic
variance
is
defined
as
a5
=
92 A
+
1/2
QM
+
3/2QAM
(Willham,
1963),
ie
is
the
same
as
o- A 2
for
Model 1.
As
in
table
III,
differences
between
designs
are
small
for
Model 1,
but
increase
with
the
number
of
parameters
estimated.
In
particular,
including
the
direct-maternal
genetic
covariance
has
a
pronounced
effect.
For
FS1
with
only
one
offspring
per
dam
(column
6),
there
are
no
full-sibs
in
the
data.
Though
the
remaining
4
observational
covariances
between
relatives
still
allow
all
4
components
under
Model
4
to
be
estimated,
this
causes
an
almost
complete
sampling
correlation
between
û1
and
both
6’ E
and
û!M’
and
correspondingly
high
sampling
variances.
Conversely,
with
the
same
number
of
offspring
but
only
one
dam
per
sire
(column
3)
there
are
no
paternal
half-sibs.
However,
as
the
expectation
of
the
pertaining
covariance
involves
only
a A 2
estimates
of
the
maternal
components
are
thus
much
less
affected,
though
SE(al A
and
the
sampling
correlation
between
a2 A
and
û1
are
largest
amongst
those
for
the
FS1
designs.
As
noted
above
for
Model 1,
Bondari’s
design
1
gives
less
accurate
estimates
than
most
full-sib
family
structures
(unless
d
=
1
or
m
=
1)
for
the
simpler
models
of
analysis,
even
at
equal
family
size.
While
all
other
cases
considered
in
table
VII
data
on
only
2
generations,
B1P
includes
records
on
grand-parents,
ie
3
generations
in
total.
Though
the
coefficients
of
a A 2
and
a
AM
in
the
expectation
of
the
grand-parent
offspring
covariances
are
comparatively
small
(see
table
II),
this
clearly
reduces
the
sampling
errors
of
all
components
estimated
and
the
magnitude
of
sampling
correlations
between
62 A
and
both
lTiI
and
%5
.
As
for
FS1,
sampling
errors
for
E1
are
markedly
increased
when
one
or
several
of
the
covariances
between
relatives
are
missing
(s
=
1
or
di
=
1
or
d2
=
1),
the
more
the
more
parameters
are
estimated.
Sampling
correlations
follow
a
similar
pattern
as
for
FS1.
Based
on
8 000
records,
design
12
provides
the
most
accurate
estimates
among
the
12
data
structures
examined.
Some
discussion
on
the
optimal
choice
of
s, d
l
and
d2
for
Eisen’s
(1967)
designs
is
given
by
Thompson
(1976).
BIAS
AND
MEAN
SQUARE
ERROR
So
far,
only
analyses
under
the
&dquo;true&dquo;
model
describing
the
data
have
been
considered.
In
some
instances,
analyses
are
carried
out,
however,
fitting
the
wrong
model.
A
particular
example
as
discussed
above
is
the
analysis
of
growth
traits
in
beef
cattle
where
an
environmental
correlation
between
a
dam
and
her
daughter,
though
assumed
to
exist,
is
generally
ignored.
Figure
3
shows
the
effect
of
such
environmental
covariance
(bEC
=
lTEG/lT!)
on
the
estimates
of
(co)variance
components
and
the
direct-maternal
genetic
correlation
(rAM
)
under
Model
6
when
the
true
model
describing
the
data
is
Model
9,
for
parameter
set
I
and
3
designs.
While
(7!
and
%5
are
generally
little
affected,
even
for
large
(absolute)
values
of
b
EC
,
all
the
maternal
components
are
substantially
biased.
The
pattern
of
biases
differs
between
designs,
reflecting
clearly
the
differences
in
covariances
between
relatives
available
and
the
information
contributed
by
each
of
them. For
design
FS1
(not
shown),
estimates
of
o, A 2 ,Or
Am
and
a5
were
unbiased
while
ô’
1-
and
ô’!
were
biased
by
-2a
Ec
and
+2o-
EC
,
respectively
(unless
estimates
exceeded
the
bounds
of
the
parameter
space
and
were
constrained).
Figure
4
shows
the
corresponding
differences
in
log £
from
analyses
under
models
6
and
9.
For
the
parameter
set
examined,
the
magnitude
of
bEc
needs
to
exceed
0.3
for
design
El
before
a
likelihood
ratio
test
would
be
expected
to
identify
a
significantly
better
fit
of
Model
9
than
of
Model
6
(at
an
error
probability
of
5%;
the
dashed
line
in
figure
2
marks
the
significance
level).
While
estimates
from
EFS2H
and
EFS2F
(not
shown)
differ
little,
the
higher
coefficients
in
the
observational
covariances
due
to
the
across
family
relationships
for
FS2F
clearly
increase
the
scope
to
identifiy
a
non-zero
QEC
.
The
effect
of
an
over-
or
underparameterized
model
of
analysis
on
estimates
of
(co)variances,
their
lower
bound
sampling
errors
and
the
resulting
mean
square
error
(MSE),
defined
as
bias
squared
plus
prediction
error
variance,
is
further
illustrated
in
table
VIII.
Clearly,
estimating
a
(co)variance
when
it
is
not
present
increases
the
sampling
errors
of
all
components
unnecessarily.
Similarly,
when
the
bias
introduced
by
ignoring
a
component
is
small,
MSEs
under
the
wrong
model
may
be
considerably
smaller
than
under
the
correct
model.
As
the
deviations
in
log
G
from
the
value
under
Model
9
show,
none
of
the
analyses
would
be
expected
to
identify
a
aEc
different
from
zero.
TRANSFER
With
a
dam
affecting
the
phenotype
of
her
offspring
both
through
half
her
direct
additive
genetic
value
and
her
maternal
genotype
as
well
as
her
maternal
environmental
effect,
high
sampling
correlations
among
the
genetic
and
maternal
(co)variance
components
are
invariable,
even
with
the best
experimental
design.
Fortunately,
modern
reproductive
technology
allows
some
of
these
correlations
to
be
reduced.
As
a
simple
illustration,
consider
the
hierarchical
full-sib
design
(FS1)
with
one
sire
per
family.
Assume
now
that
the
sire
has
been
mated
to
only
one
out
of
the
d
dams
with
md
full-sib
offspring
resulting
from
this
mating.
Further,
assume
that
each
dam
raises
m
of
these
offspring
(design
FS1ET).
This
gives
rise
to
3
different
dam-offspring
covariances,
namely:
-
the
&dquo;usual&dquo;
covariance
between
a
dam
and
her
offspring
raised
by
her,
with
expectation
afl /2
+
5
UAM/
4
+
or2 /2
+
aEc
I
-
the
covariance
between
a
dam
and
her
offspring
raised
by
another,
recipient
dam,
with
expectation
a fl /2 + a
AA
f /4,
ie
the
same
as
the
sire-offspring
covariance;
and
-
the
covariance
between
a
recipient
dam
and
the
offspring
(of
another
dam)
which
she
raised,
with
expectation
a
AM
+
(jÄ
I
/2
+
o-EC
.
Similarly,
we
now
need
to
distinguish
between
4
types
of
covariances
between
full-sibs:
-
the
&dquo;usual&dquo;
covariance
between
full-sibs
raised
by
their
genetic
dam,
with
expectation
(j!/2
+
(
jAM
+ U
2 m +
0
,2 c
-
the
covariance
between
full-sibs
raised
by
the
same
recipient
dam
(not
their
genetic
dam),
with
expectation
(j!/2
+
U2 m
+o, C
2
’
-
the
covariance
between
full-sibs
raised
by
different
dams,
with
one
of
them
being
their
genetic
dam,
with
expectation
QA/
2
+
O-A
M /2;
and
-
the
covariance
between
full-sibs
raised
by
different
recipient
dams,
none
of
which
is
their
genetic
dam,
with
expectation
!A/2.
Table
IX
compares
the
expected
sampling
errors
for
FS1
and
FS1ET
for
3
family
structures
and
Table
X
contains
the
corresponding
sampling
correlations.
Results
from
analyses
under
Models
3, 4,
5
(not
shown)
and
6
were
contrasted.
For
Model
3,
with
low
correlations
between
&
2 m
and
the
other
components,
FS1ET
yields
slightly
less
accurate
estimates
than
FS1.
However,
as
soon
as
a
direct-maternal
genetic
covariance
is
fitted,
FS1ET
gives
considerably
smaller
sampling
errors
than
FS1
as
it
reduces
the
high
sampling
correlations
between
&A 2
and
QM
(Model
4,
5
and
6),
(j2
and
62
(Model
4
and
5),
a2
and
%5
(Model
5),
62 A
and
%
AM
(Model
4
and
6),
Q
N1
and
â
AM
(Model
4
and
slightly
for
Model
6),
or
&2 A
and
ûb
(Model
5
and
6).
Clearly,
however,
FS1ET
does
not
allow
genetic
and
environmental
maternal
effects
to
be
separated
any
better
than
FS1,
and
sampling
correlations
between
& m 2
and
a2
c
(Model
5
and
6)
are
still
large
and
negative.
Other
designs
involving
genetically
more
diverse
&dquo;litter
mates&dquo;
and
related
parents
or
recipients
will
provide
more
types
of
covariances
between
relatives
and
thus
allow
even
better
separation
of
genetic
and
environmental,
and
direct
and
maternal
effects.
While
the
expectation
of
all
observational
components
in
table
II
which
involve
o, m 2
also
include
U2 A
and
0-!!,
the
covariance
between
2
unrelated
animals,
for
instance,
raised
by
different
recipient
dams
(unrelated
to
which
are
full-sibs
or
maternal
half-sibs,
is
solely
due
to
maternal
genetic
effects
(expectation
(TiE /4).
CONCLUSIONS
It
has
been
shown
that
estimates
of
(co)variance
components
are
subject
to
large
sampling
variances
and
high
sampling
correlations,
even
for
a
&dquo;reduced&dquo;
model
ignoring
dominance
effects
and
family
structures
providing
numerous
types
of
covariances
between
relatives
which
have
been
specifically
designed
for
the
estimation
of
maternal
effects.
For
small
data
sets
and
models
of
analysis
fitting
both
genetic
and
maternal
environmental
effects
or
a
direct-maternal
covariance,
this
frequently
induces
the
need
to
constrain
estimates
to
the
parameter
space.
Consequently,
large
sample
theory
predictions
of
sampling
errors
and
correlations
estimates
do
not
agree
with
empirical
results.
Further
research
is
required
to
evaluate
the
implications
of
such
large
sampling
(co)variances
on
the
accuracy
of
selection
indexes
including
both
direct
and
maternal
effects,
ie
the
expected
loss
in
selection
response
because
inaccurately
estimated
parameters
have
been
used
deriving
index
weights.
The
efficiency
of
search
procedures
used
in
derivative-free
REML
algorithms
is
highly
dependent
on
the
correlation
structure
of
the
parameters
to
be
estimated,
being
most
effective
if
these
are
uncorrelated.
The
fact
that
expected
sampling
correlations
between
some
components
for
a
given
model
of
analysis
varied
little
between
designs
(see
table
VI)
suggested
that
a
reparameterisation
to
linear
functions
of
the
(co)variance
components
might
improve
the
convergence
rate
of
such
algorithms.
Inspection
of
eigenvalues
and
eigenvectors
of
the
formation
matrices,
however,
failed
to
identify
any
general
guidelines.
Examination
of
bias,
sampling
variances
and
resulting
mean
square
errors
when
fitting
the
wrong
model
of
analysis
showed
that,
in
some
instances,
ignoring
some
component(s)
can
lead
to
considerably
smaller
MSE
without
biasing
the
(co)variances
estimated
substantially
or
reducing
the
likelihood
significantly
over
that
under
the
true
model.
In
particular,
investigating
the
effect
of
ignoring
an
environmental,
direct-maternal
covariance
for
a
parameter
set
which
might
be
appropriate
for
a
growth
trait
in
beef
cattle,
suggested
that
for
a
data
set
of
size
8 000,
the
covariance
should
amount
to
at
least
30%
of
the
permanent
environmental
variance
due
to
the
dam
before
a
likelihood
ratio
test
would
be
expected
to
distinguish
it
from
zero
(at
5%
error
probability).
Results
presented
here
reinforce
earlier
warnings
about
the
inaccuracy
of
es-
timates
of
maternal
effects
and
the
pertaining
variance
components
(Thompson,
1976;
Foulley
and
Lefort,
1978).
Clearly,
use
of
an
estimation
procedure
with
&dquo;built-
in&dquo;
optimality
characteristics
like
REML
will
not
alleviate
the
need
for
large
data
sets
supplying
numerous
types
of
covariances
between
relatives
when
attempting
to
estimate
these
components.
Use
of
modern
reproductive
techniques
such
as
embryo
transfer
may
provide
data
where
direct
and
maternal
effects
are
less
confounded.
Most
cases
examined
here
considered
data
from
2
generations
only,
and
includ-
ing
several
generations
would
provide
further
contrast
which
might
help
to
reduce
the
biologically
induced
high
sampling
correlations.
Implications
for
the
scope
of
fitting
more
detailed
models,
accounting,
for
instance,
for
dominance
effects,
recom-
bination
loss
or
variance
due
to
new
mutation,
and
of
estimating
the
appropriate
(co)variance
components
are
somewhat
discouraging.
ACKNOWLEDGMENTS
Financial
support
for
this
study
was
provided
under
the
MRC
(Australia)
grant
UNE15
and
by
the
Agricultural
and
Food
Research
Council
(UK).
I
am
grateful
to
WG
Hill
for
comments
on
the
manuscript.
REFERENCES
Baker
RL
(1980)
The
role
of
maternal
effects
on
the
efficiency
of
selection
in
beef
cattle:
a
review.
Proc
NZ
Soc
Anim
Prod
40,
285-303
Bondari
K,
Willham
RL,
Freeman
AE
(1978)
Estimates
of
direct
and
maternal
genetic
correlations
for
pupa
weight
and
family
size
of
Triboleum.
J
Anim
Sci
47,
358-365
Cantet
RJC,
Kress
DD,
Anderson
DC,
Doornbos
DE,
Burfening
PJ,
Blackwell
RL
(1988)
Direct
and
maternal
phenotypic
effects
on
preweaning
growth
of
beef
cattle.
J
Anim
Sci
66,
648-660
Cox
DR,
Hinkley
DV
(1974)
Theoretical
Statistics.
Chapman
and
Hall,
London
Edwards
AWF
(1966)
Likelihood.
Cambridge
University
Press
Eisen
EJ
(1967)
Mating
designs
for
estimating
direct
and
maternal
genetic
variances
and
direct-maternal
covariances.
Can
J
Genet
Cytol 9,
13-22
Foulley
JL,
Lefort
G
(1978)
M6thodes
d’estimation
des
effects
directs
et
maternels
en
selection
animale.
Ann
Genet
Sed
Anim
10,
475-496
Graser
HU,
Smith
SP,
Tier
B
(1987)
A
derivative-free
approach
for
estimating
variance
components
in
animal
models
by
Restricted
Maximum
Likelihood.
J
Anim
Sci
64,
1362-1370
Koch
RM
(1972)
The
role
of
maternal
effects
in
animal
breeding.
VI.
Maternal
effects
in
beef
cattle.
J
Anim
Sci
35,
1316-1323
Meyer
K
(1989)
Restricted
Maximum
Likelihood
to
estimate
variance
components
for
animal
models
with
several
random
effects
using
a
derivative-free
algorithm.
Genet
Sel
Evod 21,
317-340
Meyer
K
(1992)
Variance
components
due
to
direct
and
maternal
effects
for
growth
traits
of
Australian
beef
cattle.
Livest
Prod
Sci
31,
179-204
Meyer
K,
Hill
WG
(1992)
Approximation
of
sampling
variances
and
confidence
intervals
for
maximum
likelihood
estimates
of
variance
components.
J
Anim
Breed
Genet
109,
264-280
Nelder
JA,
Mead
R
(1965)
A
simplex
method
for
function
minimization.
Computer
J
7,
147-151
Patterson
HD,
Thompson
R
(1971)
Recovery
of inter-block
information
when
block
sizes
are
unequal.
Biometrika
58,
545-554
Thompson
R
(1976)
The
estimation
of
maternal
genetic
variances.
Biometrics
32,
903-917
Thompson
R
(1977)
Estimation
of
quantitative
genetic
parameters.
In:
Proc
Int
Conf
Quantitative
Genetics,
(Pollak
E,
Kempthorne
0,
Bailey
TB,
eds)
Iowa
State
Univ
Press,
Ames,
639-657
Willham
RL
(1963)
The
covariance
between
relatives
for
characters
composed
of
components
contributed
by
related
individuals.
Biometrics
19,
18-27
Willham
RL
(1972)
The
role
of
maternal
effects
in
animal
breeding:
III.
Biometrical
aspects
of
maternal
effects
in
animals.
J
Anim
Sci
35,
1288-1293
Willham
RL
(1980)
Problems
in
estimating
maternal
effects.
Livest
Prod
Sci
7,
405-418