Báo cáo y học: " GOTax: investigating biological processes and biochemical activities along the taxonomic tree" pot
Bạn đang xem bản rút gọn của tài liệu. Xem và tải ngay bản đầy đủ của tài liệu tại đây (1019.24 KB, 10 trang )
Genome Biology 2007, 8:R33
comment reviews reports deposited research refereed research interactions information
Open Access
2007Schlickeret al.Volume 8, Issue 3, Article R33
Software
GOTax: investigating biological processes and biochemical
activities along the taxonomic tree
Andreas Schlicker, Jörg Rahnenführer, Mario Albrecht, Thomas Lengauer
and Francisco S Domingues
Address: Department of Computational Biology and Applied Algorithmics, Max-Planck-Institute for Informatics, Stuhlsatzenhausweg, 66123
Saarbrücken, Germany.
Correspondence: Andreas Schlicker. Email:
© 2007 Schlicker et al.; licensee BioMed Central Ltd.
This is an open access article distributed under the terms of the Creative Commons Attribution License ( which
permits unrestricted use, distribution, and reproduction in any medium, provided the original work is properly cited.
Integrative approach to comparative genomics<p>GOTax, a novel web-based platform that integrates protein annotation with protein family classification and taxonomy, allows for an extensive assessment of functional similarity between proteins and for comparing and analyzing the distribution of protein families and protein functions over different taxonomic groups.</p>
Abstract
We describe GOTax, a comparative genomics platform that integrates protein annotation with
protein family classification and taxonomy. User-defined sets of proteins, protein families,
annotation terms or taxonomic groups can be selected and compared, allowing for the analysis of
distribution of biological processes and molecular activities over different taxonomic groups. In
particular, a measure of functional similarity is available for comparing proteins and protein families,
establishing functional relationships independent of evolution.
Rationale
New opportunities for understanding biology at the molecu-
lar level have been created as a result of the complete
sequencing and extensive annotation of different genomes.
The scientific community is just starting to uncover the
agents and mechanisms taking part in the molecular biology
of different organisms as we identify their genes and gene
products and the corresponding biological and molecular
roles of these. The comparison of two different genomes
allows for identifying the common and unique characteristics
of each of the genomes and provides a way for transferring
annotation from well characterized to less well characterized
genomes. As more and more genomes from organisms of dif-
ferent species across the whole taxonomic tree are character-
ized, it becomes possible to compare not only two genomes,
but also sets of genomes. Therefore, differences and similari-
ties in the molecular biology between different taxonomic
groups can be investigated in a systematic and objective way.
For example, it becomes possible to identify the distribution
of particular protein families or particular biological proc-
esses and molecular activities along the taxonomic or phylo-
genetic tree.
The comparison of different sets of genomes allows for iden-
tifying the processes, activities, and families unique to certain
taxonomic groups or shared between taxonomic groups. A
concrete application is the comparison between pathogenic
and non-pathogenic bacteria, which provides insight into the
mechanisms of pathogenicity. Another application is the
comparison between human and different pathogens in order
to identify features unique to the pathogens, a first step in the
discovery of new drug targets. Comparative methods often
rely on homology relationships, which are identified based on
sequence similarity. More recently, new methods became
available for comparing genes and gene products according to
their functional annotation. In particular, measures of func-
tional similarity of gene products have been proposed [1,2]
that rely on the Gene Ontology (GO) [3] annotation. Several
tools allowing such functional similarity searches have been
developed [1,4,5].
Published: 8 March 2007
Genome Biology 2007, 8:R33 (doi:10.1186/gb-2007-8-3-r33)
Received: 23 October 2006
Revised: 18 January 2007
Accepted: 8 March 2007
The electronic version of this article is the complete one and can be
found online at />R33.2 Genome Biology 2007, Volume 8, Issue 3, Article R33 Schlicker et al. />Genome Biology 2007, 8:R33
We describe GOTax, a platform for investigating and compar-
ing proteins, protein families, their activities and biological
roles over the taxonomic tree. The platform includes
GOTaxDB, a database integrating protein annotation [6],
functional terms [3], protein family classification [7,8], and
the taxonomic classification [9]. The database is accessed
through the GOTaxExplorer tool, which provides a simple
query language for querying the database and permits select-
ing arbitrary data sets. It also allows for the comparison of
sets of proteins, protein families, and functional terms. In
particular, it supports measures for the functional compari-
son of these sets. A functional similarity search tool (FSST) is
also proposed, which provides a functional comparison of
user-defined sets.
The GOTax platform
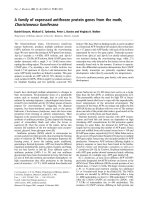
The GOTax platform consists of four basic components (Fig-
ure 1). GOTaxDB integrates the different data sources and is
queried either through the stand-alone version of GOTaxEx-
plorer or through the Web Start version. The stand-alone ver-
sion comprises a graphical user interface (GUI) and a
command line interface (CLI). The forth component of
GOTax is FSST, which consists of a query engine for func-
tional similarity searches and an embedded database.
GOTaxDB
We developed an intergrated database schema that was
implemented using a MySQL [10] database server. It includes
different data sources: UniProt, Pfam, SMART, GO, NCBI
Taxonomy. They are all cross-linked, allowing the retrieval of
entries from all sources based on SQL queries. The online ver-
sion of GOTaxDB is updated every third month and new com-
pletely sequenced genomes will be added once a year. Since
all cross-references between the data sources are provided by
UniProt, the asynchronous release of the source databases
does not affect updates of GOTaxDB. The database contains
only data from completely sequenced species, currently about
260 species. The complete list of species is available on the
worldwide web site [11]. In the following, single entries from
any data source (proteins, Pfam families, SMART families,
GO terms, taxa) are referred to as entities. A set of Java 1.5
[12] programs was implemented for importing data from
downloaded flat files. The database containing the completed
genomes is about 3 GB in size. Creating the database, includ-
ing the computation of semantic similarity values for all GO
terms, takes less than a week on an AMD Opteron 852 CPU
with 2.5 Ghz. The semantic similarity data makes up two-
thirds of the database, and is limited by the total number of
GO terms and not by the number of genomes included in the
database. Therefore, we expect the database to scale well
while adding new completely sequenced genomes.
GOTaxExplorer
GOTaxExplorer, the main tool for querying GOTaxDB, has
been implemented in Java 1.5, providing a platform-inde-
pendent software. The stand-alone version of GOTaxExplorer
was successfully tested on Debian Linux, Red Hat Linux,
Solaris 9, Windows 2000, and Windows XP. It comprises two
user interfaces, a CLI and a GUI. The GUI is available either
as a stand-alone application or as a Java Web Start applica-
tion. Additionally, a SOAP [13] server is available. In order to
take advantage of multi-processor systems, the semantic
comparison of GO terms and the functional comparison of
gene products are implemented multi-threaded.
GOTaxExplorer query capabilities
GOTaxExplorer supports four basic types of queries: selec-
tion of sets of entities; comparison of two sets of protein fam-
ilies; semantic comparison of two sets of GO terms; and
functional comparison of two sets of proteins or protein fam-
ilies. Sets are selected by searching the different data sources
integrated in the database and establishing relationships
between the different data types (proteins, protein families,
taxonomy, and GO) with a user-defined condition. This way
the relationship between protein families and taxonomic
groups can be investigated. A concrete example is determin-
ing the distribution of the PHP domain (PF02811) over the
taxonomic tree. Moreover, GOTaxExplorer allows for finding
the lowest common ancestor of species satisfying a query.
The relationship between protein families and functional
annotation can also be investigated. An example is, "Which
biological processes are annotated to proteins with a PHP
domain?" Furthermore, queries relating proteins to a specific
family and functional term are possible: "Select all proteins
with the PHP domain that are involved in DNA replication."
More complex queries can relate all integrated data sources to
each other. This allows queries like "Which Pfam domains
involved in DNA replication are present in bacteria and not in
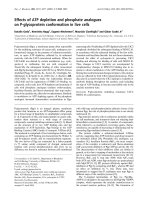
Schematic drawing of the GOTax platformFigure 1
Schematic drawing of the GOTax platform. The schema shows the
different components of the GOTax platform. GOTaxDB serves as central
data storage that is queried by GOTaxExplorer. The stand-alone version
of GOTaxExplorer comprises a GUI and a CLI. Additionally,
GOTaxExplorer is available as a Java Web Start version. FSST is a module
for calculating functional similarities between user-defined sets of proteins
or protein families. It contains an embedded database making it
independent from GOTaxDB.
GOTaxDB
FSST
Embedded DB
GOTaxExplorer
GUICLI
Stand-alone Web-based
Java Web
Start GUI
SOAP
server
Genome Biology 2007, Volume 8, Issue 3, Article R33 Schlicker et al. R33.3
comment reviews reports refereed researchdeposited research interactions information
Genome Biology 2007, 8:R33
archaea?" The comparison of two sets of Pfam families shows
which families occur in both sets or are unique to one of these
sets. This also allows for a general functional comparison of
these two sets according to the GO annotation of the Pfam
families. This can serve as a guide for a more detailed func-
tional comparison between the genes of two species. An
example is the identification of the Pfam families associated
with both yeast and human proteins.
The semantic comparison of two sets of GO terms uses a
semantic similarity measure for finding similar and dissimi-
lar terms in two sets of GO terms. The simple query "Which
biological processes are present in Saccharomyces cerevisiae
but not in human?" results in a list of GO terms. Let BP1 be a
GO term mapped to a yeast protein and BP2 a GO term
mapped to a human protein. Then the following cases can
occur: BP1 equals BP2, BP1 is an ancestor of BP2, BP1 is a
descendant of BP2, or BP1 and BP2 are both descendants of
the same GO term. In the first case, the two terms are identi-
cal and, therefore, BP1 is not included in the result set. If BP1
is an ancestor of BP2, the true path rule implies that BP1 is
also not included in the results. The true path rule states that
a gene product annotated with one GO term can also be anno-
tated with the term's ancestors in the graph. In the third case,
the situation is not clear. In this case, the human gene product
is annotated with the less detailed GO term, which can have
several reasons. One possible explanation is that there is less
knowledge about the human protein. However, it could also
be the case that the fungal protein is a subclass of the more
generic human protein. Alternatively, it is possible that there
is more knowledge about the specific function of the human
protein but it is not reflected by the annotation, or the exact
functional term is still missing in GO. It remains unclear
whether the human gene product is involved in the same
process as the gene product from fungi or not. The fourth case
presents a similar problem where the relationship between
terms BP1 and BP2 is not clearly evident. In the latter two
cases, the semantic similarity provides a basis for deciding
whether the two terms are similar or not.
The functional comparison of two sets of proteins or protein
families allows for identifying functionally similar proteins or
protein families from different species. For this comparison,
we use semantic similarity scores that have been previously
described [2]. The MFscore and the BPscore assess the simi-
larity of the molecular functions and biological processes,
respectively, annotated to two proteins or protein families.
The funSim score and the rfunSim score combine MFscore
and BPscore into one measure. These scores allow for identi-
fying the differences in the molecular biology of two closely
related species, for example: "How functionally related are
the proteins from Saccharomyces cerevisiae and Schizosac-
charomyces pombe?" The functional comparison of protein
families provides a way to compare species or groups of spe-
cies whose proteins are not properly annotated to GO, and
instead relies on the GO annotation of Pfam. Since GOTaxDB
has a rather complicated database schema, the direct SQL
queries to the database are quite complex. Therefore, we
implemented a new simple query language in GOTaxEx-
plorer. This query language was designed to be as easy to use
and as flexible as possible. This greatly simplifies the use of
the platform. More details about the query language can be
found in Additional data file 1.
GOTaxExplorer command line interface
The GOTaxExplorer CLI provides a light-weight interface
with all query capabilities, but without input aids and result
visualization. In addition to the query language, this version
provides the option of using SQL for directly querying
GOTaxDB. All results are printed onto the screen in a tabular
format. The major advantage of this interface is that it can be
integrated into scripts that automatically generate queries
and further process their results. A batch file with commands
can be used to query GOTaxDB or, alternatively, the query
commands are read from the standard input. Furthermore, it
is possible to integrate the CLI into other programs that
access GOTaxDB in order to take advantage of the simple
query language.
GOTaxExplorer graphical user interface
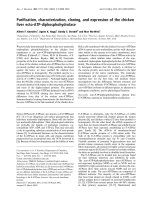
The GUI provides a query interface that helps users to formu-
late queries without knowing the exact syntax of the query
language (Figure 2). It also provides direct SQL access to
GOTaxDB. The interface contains buttons for adding opera-
tors and entities to the query. Submitted queries are added to
a query history for easy access. Furthermore, graphical tree
representations of the GO ontologies and the taxonomic tree
are available. These allow for browsing the hierarchies and
facilitate finding a specific entry. Additional external infor-
mation on an item can be accessed with a web browser. Since
the tree representation permits only one parent for each node
and the GO ontologies are directed acyclic graphs, all sub-
graphs with more than one parent are replicated, unfolding
the graph into a tree. Since the query language requires that
entities are identified by their accession number in the source
database, GOTaxExplorer provides the possibility of search-
ing an entity by name in order to retrieve its accession
number. Query results are presented in tables in the results
frame. The tables can be sorted by different columns, and a
popup menu provides access to external databases. Addition-
ally, entities from previous results may be used in subsequent
queries, facilitating further detailed investigation. Rows from
result tables can be copied to the system clipboard, and com-
plete result tables can be saved to standard text files. These
files can easily be imported into databases or opened in
spreadsheet applications.
GOTaxExplorer provides the possibility to visualize taxon-
omy and GO results in the taxonomic tree or the GO tree (Fig-
ure 3). Additionally, a bar chart visualizes the grouping of GO
results according to the given GO term list (Figure 4). Fur-
thermore, the results from the selection of Pfam families or
R33.4 Genome Biology 2007, Volume 8, Issue 3, Article R33 Schlicker et al. />Genome Biology 2007, 8:R33
the comparison of two sets of Pfam families can be shown in
a map of the functional space of all annotated Pfam families
obtained by multidimensional scaling [2] (Figure 5). In this
map, the Pfam families are grouped according to their func-
tional similarity using the MFscore. The visualization of the
results from a Pfam family query provides for quickly classi-
fying found Pfam families into functional categories. In case
of the comparison of two Pfam family sets, the families are
colored according to the set they are contained in. This per-
mits a functional classification of the families unique to one
set, shared between both sets, and missing in both sets.
GOTaxExplorer Web Start version
GOTaxExplorer is also available as a Java Web Start client
application [11]. Java Web Start is the most convenient way of
using GOTaxExplorer because it does not depend upon a local
database or application being installed by the user. It is
started directly from a link on the GOTax web page and uses
the most recent online version of GOTaxDB. The client appli-
cation is stored and deployed on the user's computer and each
time it is started Java Web Start checks for an update, which
is automatically downloaded. This ensures that the user is
employing the most recent release. The Web Start version
provides the same functionality as the GUI of the stand-alone
version with the exception of directly submitting SQL queries.
Additionally, functional comparisons of proteins are not
directly executed because they are computationally intensive.
A request for these comparisons is sent to GOTaxDB. As soon
as the results have been calculated, the user is informed via
email.
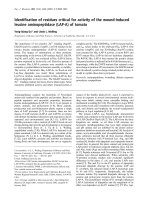
GOTaxExplorer's GUIFigure 2
GOTaxExplorer's GUI. The screenshot shows the query interface with the results for the query "Which proteins with a PHP domain are annotated with
DNA replication?" On the right side of the query interface is the graphical representation of the NCBI Taxonomy. The lower part shows the frame
containing results from the current query.
Genome Biology 2007, Volume 8, Issue 3, Article R33 Schlicker et al. R33.5
comment reviews reports refereed researchdeposited research interactions information
Genome Biology 2007, 8:R33
GOTaxExplorer SOAP server
The SOAP server provides a standard interface for remote
access to the online version of GOTaxDB. This interface
allows for integrating the GOTax platform in other web serv-
ices without the need for a locally installed version. The SOAP
server provides the same query functionality as the Web Start
version. We created a Web Services Description Language
(WSDL) [14] file describing the capabilities of the SOAP
server that can be used for implementing a compatible SOAP
client. This file and additional documentation is available
from the GOTax web site [11].
Functional similarity search tool (FSST)
The FSST was implemented for comparing user defined sets
of gene products or annotations. It supports all similarity
measures and different output formats and its multi-threaded
implementation takes advantage of symmetric multi-process-
ing computers, decreasing runtime considerably. FSST is
configurable using command line arguments and a configura-
tion file. As input to FSST, the user can provide a database file
in plain text format giving the reference entities and their GO
annotation, and a query file with the same format defining the
query entities with their annotation. It is possible to perform
either an all-against-all or a one-to-one comparison of query
entities against database entities. The results are written to a
text file containing BPscore, MFscore, funsim score, and
rfunSim score. Additionally, it is possible to obtain a similar-
ity matrix for one of the scores from an all-against-all com-
parison. Different applications might require distances rather
than similarities. Therefore, FSST is capable of transforming
the scores into distances according to the formula
dist
X
(A,B) = 1 - X(A,B)(1)
where X is either the BPscore, the MFscore, the funsim score,
or the rfunSim score of the two gene products A and B. FSST
is distributed with an embedded Apache Derby [15] database
containing all semantic similarity values of GO terms. There-
fore, FSST does not need GOTaxDB to be installed. The
embedded version of Apache Derby has the advantage that it
is completely administration free, and its deployment is com-
pletely hidden from the user.
Introducing the rfunSim score
We developed a method for assessing the functional similar-
ity of two gene products, the funSim score [2]. This score is
based on the concept of the information content and uses the
GO annotation of gene products [1,16,17]. The information
content of a GO term is defined as the negative logarithm of
the term's probability. This probability is computed as the rel-
ative frequency of a term in a large corpus of annotation. The
probabilities for the GO terms were calculated based on the
GO annotation in UniProt. Our semantic similarity measure
for two GO terms (sim
Rel
) takes into account how close the
two terms are to their lowest common ancestor as well as how
detailed this lowest common ancestor is. It ranges from 0 for
not related GO terms to 1 for highly similar terms. A sim
Rel
score below 0.5 indicates that the two GO terms are only dis-
tantly related [2]. The similarity between two gene products A
and B with GO annotation GO
A
and GO
B
, respectively, is then
calculated as follows. For each term in GO
A
, find the most
similar term in set GO
B
, and calculate the average of their
similarities as rowScore(A, B). Then, for each term in GO
B
find the term with the highest similarity from set GO
A
, and
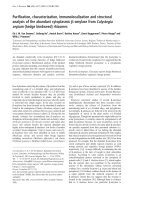
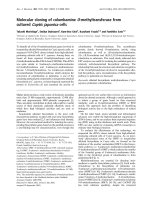
Screenshot of the taxonomic tree showing the distribution of the PHP domain (PF02811)Figure 3
Screenshot of the taxonomic tree showing the distribution of the PHP
domain (PF02811). The corresponding query is: TAX WHERE
PFAM:PF02811.
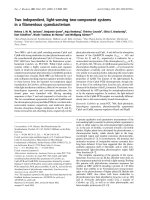
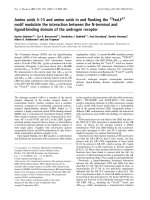
Screenshot of the histogram showing the grouping of the biological processes from yeast with a semantic similarity below 0.6 to any process from humanFigure 4
Screenshot of the histogram showing the grouping of the biological
processes from yeast with a semantic similarity below 0.6 to any process
from human. The groups correspond to 'cellular physiological process'
(GO:0050875), 'localization' (GO:0051179), 'metabolism' (GO:0008152),
and 'regulation of physiological process' (GO:0050791).
R33.6 Genome Biology 2007, Volume 8, Issue 3, Article R33 Schlicker et al. />Genome Biology 2007, 8:R33
calculate the average as columnScore(A, B). The GOs-
core(A,B) is defined as:
GOscore(A,B) = max(rowScore(A,B), columnScore(A, B)) (2)
A GOscore(A,B) is calculated for BP (BPscore) and for MF
(MFscore), respectively. Finally, the funSim score is calcu-
lated as:
where max(BPscore) and max(MFscore) denote the maxi-
mum possible score for biological process and molecular
function, respectively. The funSim score ranges between 0 for
completely unrelated gene products and 1 for gene products
with identical functionality. Due to its definition, the funSim
score is lower than the average of BPscore and MFscore in
most cases. In order to obtain a more intuitive score, we
define the rfunSim score for two gene products as
rfunSim ranges from 0 to 1 as funSim, but the values are up to
25% larger. Although the square root is a simple transforma-
tion, it changes the performance of the score. We tested how
well the scores differentiate between protein pairs without
sequence similarity and orthologous protein pairs. The ROCR
[18] package for the statistical computing environment R [19]
was used for calculating receiver operating characteristics
(ROC) curves and the calibration error [20] for the classifica-
tion task. The analysis shows that the rfunSim score achieves
a better calibration error than the funSim score. The detailed
analysis with examples of protein pairs can be found in Addi-
tional data file 1.
Using GOTaxExplorer and FSST
In this section, we demonstrate the selection and comparison
functionality of GOTax. First, the relationship between the
Screenshot of the map of the functional space of Pfam families showing the comparison of families between human and yeastFigure 5
Screenshot of the map of the functional space of Pfam families showing the comparison of families between human and yeast. The map of the functional
space was obtained by multidimensional scaling [2]. Pfam families shared between human and yeast are colored pink. Green dots indicate Pfam families
unique to yeast and yellow dots represent families unique to human. Pfam families colored black do not occur in either human or yeast. The colored
contour lines represent the regions of different functions. For more information on the map see [2]. The following query was used: PFAM WHERE
TAX:4932 PFAMCP PFAM WHERE TAX:9606.
funSim
BPscore
BPscore
MFscore
MFscore
=× +
1
2
22
[(
()
)(
()
)],
max max
33
()
rfunSim funsim
BPscore
BPscore
MFscore
MFsc
==× +
1
2
2
[(
()
)(
(max max
oore)
)].
2
4
()
Genome Biology 2007, Volume 8, Issue 3, Article R33 Schlicker et al. R33.7
comment reviews reports refereed researchdeposited research interactions information
Genome Biology 2007, 8:R33
PHP family domain and the other types of data is investi-
gated. Comparisons are then performed at three levels with
different examples: comparison of Pfam families, the seman-
tic comparison of functional terms, and the functional com-
parison of proteins. For this analysis, the following databases
where used: UniProt version 8.4, Pfam version 20, SMART
extracted from InterPro [21] version 13, GO from August
2006, and the NCBI Taxonomy from 22 August 2006.
Investigating the PHP domain
The PHP domain (PF02811) is a putative phosphoesterase
domain and belongs to the Pfam clan 'Amidohydrolase super-
family'. This family includes bacterial DNA polymerase III
proteins as well as histidinol phosphatases and uncharacter-
ized proteins. The only member of this family with known
three-dimensional structure is the hypothetical protein Ycdx
from Escherichia coli. It has been shown that the active site of
this protein contains three zinc ions [22]. The putative func-
tion of this domain is the hydrolysis of pyrophosphate during
DNA synthesis.
First, we looked at the distribution of the domain over the tax-
onomic tree. Figure 3 shows the tree view of the taxonomy in
GOTaxExplorer. As can be seen from this figure, this domain
is widespread over all superkingdoms, archaea, bacteria and
eukaryota. However, the domain does not occur in metazoa.
Eukaryotic proteins with this domain belong to the class of
phosphatases, and some are involved in DNA replication. We
proceeded by identifying all biological processes in which
proteins with the PHP domain participate. We found 11 dif-
ferent processes, which are listed in Additional data file 2. The
results convey the idea that this domain is involved primarily
in vital processes: 'DNA replication' (GO:0006260), 'DNA
repair' (GO:0006281) and 'DNA recombination'
(GO:0006310). We took a closer look at the category of 'DNA
replication' (GO:0006260) and used GOTaxExplorer for
obtaining the list of proteins that are annotated with this
process and contain the PHP domain. The results are summa-
rized in Additional data file 3. An example is the DNA-
dependent DNA polymerase beta chain (Q99UW2) from Sta-
phylococcus aureus. The list of results includes essential pro-
teins from other pathogenic organisms, indicating that the
PHP domain is a promising drug target.
Comparison of Pfam families
We used GOTaxExplorer for the comparison of Pfam families
found in human with Pfam families found in S. cerevisiae.
The complete table with the results can be found in Additional
data file 4. The search took less than 2 seconds, and the
results show that human and yeast share 1,580 families, and
that 1,478 Pfam families are unique to human and 252 are
unique to yeast. The map of the functional space of Pfam fam-
ilies showing common families and families unique to one of
the species is presented in Figure 5. As can be seen in this fig-
ure, many families annotated with 'binding' (GO:0005488)
and 'signal transducer activity' (GO:0004871) are unique to
human, for example, the small cytokines interleukin-8 like
family (PF00048). Few protein families annotated with one
of these categories are unique to yeast, such as the yeast mat-
ing factor alpha hormone domain (PF04648), or are common
to both yeast and human, like the G-protein alpha subunit
(PF00503) family.
Another example is the comparison of Pfam families found in
proteins from human and different human viruses. GOTaxDB
contains proteins and annotation from 18 human viruses,
including the hepatitis C virus (HCV), HIV, and influenza
viruses. The comparison shows that 24 Pfam families are
shared between the viral and human proteins, 132 families
are unique to viruses, and 3,170 families are unique to
human. A map of the functional space with the comparison
results is included in Additional data file 1 (as Figure S4). The
FtsJ-like methyltransferase domain (PF01728) occurs in
human and in viral proteins for example. This domain occurs
at the amino terminus of flaviviral NS5 protein and is hypoth-
esized to be involved in viral RNA capping [23]. All shared
and unique Pfam families are listed in Additional data file 5.
It is also possible to compare the Pfam families of two differ-
ent taxonomic groups. One example is the comparison of
Pfam families found in proteins from Viridiplantae and
fungi. Fungi and Viridiplantae share 1,898 Pfam families
while 487 families are unique to fungi and 700 are unique to
Viridiplantae. The results of this comparison can be found in
Additional data file 6.
Semantic comparison of functional terms
We performed a semantic comparison between biological
processes associated with S. cerevisiae proteins and
biological processes annotated to human. First, we identified
382 biological processes found in yeast and not in human.
Then, a semantic comparison was performed between the
processes unique to yeast and the processes found in human.
We found 100 yeast processes with a sim
Rel
score above 0.9 to
a human process, indicating that there is a very similar proc-
ess in human for each of these yeast processes. The biological
process with the lowest semantic similarity of 0.14 is 'plasmid
partitioning' (GO:0030541). There are 38 processes in yeast
with a semantic similarity below 0.6 to any process occurring
in human. Such low similarity values suggest that the best
matching process in human is only distantly related to the
yeast process. These 38 processes were grouped into the more
general GO categories 'cellular physiological process'
(GO:0050875), 'localization' (GO:0051179), 'metabolism'
(GO:0008152), and 'regulation of physiological process'
(GO:0050791) (Figure 4). The complete list with the results of
the semantic comparison can be found in Additional data file
7.
A similar comparison of all biological processes annotated to
proteins from fungi with processes from Viridiplantae was
performed. There are 219 processes from fungi with a sim
Rel
R33.8 Genome Biology 2007, Volume 8, Issue 3, Article R33 Schlicker et al. />Genome Biology 2007, 8:R33
score above 0.9. Additionally, there are 24 processes with a
sim
Rel
score below 0.5, indicating that there are no similar
processes in human and, therefore, the respective processes
are likely to be unique to fungi. The complete results can be
found in Additional data file 8.
Functional comparison of proteins
We used FSST for a functional comparison of all proteins
from Arabidopsis thaliana (NCBI Taxonomy id: 3702) and S.
cerevisiae (NCBI Taxonomy id: 4932). UniProt contains
47,498 proteins from A. thaliana; out of these, 20,261 and
15,470 are annotated with MF and BP, respectively. From the
7,498 S. cerevisiae proteins in UniProt, 4,070 and 4,467 are
annotated with MF and BP terms, respectively. The complete
output can be found in the Additional data file 9. Figure 6
shows the distribution of scores for the best hits of A. thaliana
proteins. The NA column contains proteins for which the cor-
responding score could not be computed because of a lack of
molecular function or biological process annotation. More
than half of A. thaliana proteins have either no molecular
function or biological process annotation. Most of the anno-
tated proteins have a high functional similarity to a S. cerevi-
siae protein. However, there are some proteins with a
rfunSim score between 0.4 and 0.6, indicating only distant
functional similarity. One such example is the cytokinin dehy-
drogenase 6 precursor (Q9LY71) from A. thaliana. It is anno-
tated with the process 'stomatal complex morphogenesis'
(GO:0010103) and the function 'cytokinin dehydrogenase
activity' (GO:0019139). The most similar protein from yeast is
the dihydrofolate reductase, which is annotated with the
process 'folic acid and derivative metabolism' (GO:0006760)
and with the functions 'dihydrofolate reductase activity'
(GO:0004146) and 'protein binding' (GO:0005515). These
two proteins have a rfunSim score of 0.47. Both proteins have
oxidoreductase activity, which translates into a MFscore of
0.664. However, the processes they are part of are not related
at all (BPscore = 0.0).
Comparison to other tools
There are other databases and programs that allow for select-
ing and comparing sets of entities and for performing func-
tional similarity comparisons. However, none of these tools
offers the same degree of functionality as the GOTax
platform. On the one hand, the Sequence Retrieval System at
EBI [24], Entrez at NCBI [9], the Pfam database [7], the
Functional comparison of A. thaliana proteins with S. cerevisiae proteinsFigure 6
Functional comparison of A. thaliana proteins with S. cerevisiae proteins. Only the best hit (highest rfunSim score) for each yeast protein was taken into
account for the score distributions. The following query could be used in GOTaxExplorer for obtaining these results: GENE WHERE TAX:3702 FUNSIM
GENE WHERE TAX:4932.
NA S0.0 S0.2 S0.4 S0.6 S0.8
0
2,500
5,000
7,500
10,000
12,500
15,000
17,500
20,000
22,500
25,000
27,500
30,000
32,500
rfunSim funSim
MFscore BPscore
Data set
Number of proteins
Genome Biology 2007, Volume 8, Issue 3, Article R33 Schlicker et al. R33.9
comment reviews reports refereed researchdeposited research interactions information
Genome Biology 2007, 8:R33
SMART database [8], and the PANTHER database [25] com-
bine proteins, protein families, and the taxonomy and allow
selection and comparisons of sets of database entries. How-
ever, they do not provide functional similarity comparisons.
The integrated bio-data warehouse BioDW at Fudan Univer-
sity integrates protein, protein family and functional annota-
tion databases [4] and allows basic semantic similarity
searches. However, this semantic similarity search is
restricted to one GO term and does not assess the overall
functional similarity of two proteins. On the other hand,
existing tools for performing functional comparisons between
proteins do not provide an integrated database for queries
and comparisons. GO Graph is a downloadable program for
calculating semantic similarity between GO terms and func-
tional similarity between proteins [1]. GO Graph allows for
comparing user defined sets of proteins but does not offer
protein and annotation databases for searching. DynGO is a
downloadable application for performing semantic searches
for gene products annotated with similar GO terms [26]. The
software needs to be installed locally and also requires a local
annotation database that has to be set up by the user. The
Gene Functional Similarity Search Tool (GFSST) is an online
resource that provides functional similarity searches within
the human and mouse proteomes from UniProt [5]. This
allows searching for functionally similar proteins, but only
within a limited subset of known and annotated proteins. A
comparison of the query capabilities of the different tools is
provided in Table 1.
Conclusion
The GOTax platform integrates proteins, protein families,
Gene Ontology, and taxonomy into one database. It provides
several interfaces for the selection and comparison of differ-
ent sets of entities, and for performing functional compari-
sons of proteins and protein families. The major limitation of
our approach is the lack of complete annotation for many
genomes and especially of the proteins unique to certain taxa.
Although several completely sequenced genomes are anno-
tated, this annotation is not complete and is still changing.
Restricting GOTaxDB to completely sequenced genomes is
one way of trying to prevent such problems, but the user
should also take into account that more reliable results are
obtained for the genomes that are extensively annotated. The
extent to which the genomes are annotated is provided on the
GOTax web site [11]. The usefulness of the GOTax platform
will increase as more and more annotation becomes available.
Further development of the GOTax platform may include
enhancements to the user interfaces and the query language
that simplify their use. One such example is the visualization
of the GO as a directed acyclic graph instead of a tree. Moreo-
ver, adding other data sources, like non-coding RNA, to the
database may expand the application scenarios of the GOTax
platform.
Additional data files
The following additional data are available with the online
version of this paper. Additional data file 1 contains a descrip-
tion of the query language used by the GOTax platform and an
analysis of the rfunSim score. Additional data file 2 lists all
biological processes annotated to proteins with the PHP
domain (PF02811). Additional data file 3 contains a list of
proteins annotated with 'DNA replication' (GO:0006260)
and containing the PHP domain (PF02811). Additional data
file 4 lists the results from the comparison of Pfam domains
from yeast and human. Additional data file 5 contains the
results from the comparison of Pfam domains from viruses
and human. Additional data file 6 contains the results of the
comparison of Pfam domains from Viridiplantae and fungi.
Additional data file 7 lists the results of the semantic compar-
ison of biological processes from yeast and human.
Table 1
Comparison of query capabilities
Proteins Pfam SMART GO Taxonomy Semantic
similarity
Functional
similarity
GOTaxExplorer b,f,c b,f,c b,f,c b,f,c b,f,c b,f,- b,f,-
UniProt b,f,c b,f,c b,f,c b,f,c b,f,c -,-,- -,-,-
Pfam b,f,- b,f,- -,f,- -,f,- b,f,- -,-,- -,-,-
SMART b,f,- -,f,- b,f,- b,f,- b,f,- -,-,- -,-,-
PANTHER* b,f,- -,-,- -,-,- b,f,c b,f,c -,-,- -,-,-
InterPro b,f,c b,f,c b,f,c b,f,c b,f,c -,-,- -,-,-
BioDW b,f,- -,-,- -,-,- b,f,- -,-,- b,f,- -,-,-
GOGraph -,-,- -,-,- -,-,- -,-,- -,-,- b,-,- b,-,-
DynGO b,f,- -,-,- -,-,- b,f,- -,-,- -,-,- b,-,-
GFSST
†
b,f,- -,-,- -,-,- b,f,- -,-,- -,-,- b,-,-
*PANTHER provides data for only seven different species.
†
GFFST provides data for only human and mouse. The table shows which information is
accessible via the corresponding databases or tools. The entries in each cell stand for (in this order): b, search by; f, search for; c, may be combined
with other types. Hyphens "-" indicate a lack of the corresponding functionality.
R33.10 Genome Biology 2007, Volume 8, Issue 3, Article R33 Schlicker et al. />Genome Biology 2007, 8:R33
Additional data file 8 contains the results of the semantic
comparison of biological processes from Viridiplantae and
fungi. Additional data file 9 contains the complete FSST out-
put for the comparison of proteins from Arabidopsis thaliana
and S. cerevisiae.
Additional data file 1Description of the query language used by the GOTax platform and an analysis of the rfunSim scoreFigure S1: Description of the query language used by the GOTax platform and an analysis of the rfunSim scoreClick here for fileAdditional data file 2All biological processes annotated to proteins with the PHP domain (PF02811)Table columns are, in the following order: numbering, GO term accession number, GO term name, GO term type.Click here for fileAdditional data file 3Proteins annotated with 'DNA replication' (GO:0006260) and con-taining the PHP domain (PF02811)Table columns are, in the following order: numbering, UniProt accession number, UniProt name, database.Click here for fileAdditional data file 4Comparison of Pfam domains from yeast and humanTable columns are, in the following order: numbering, Pfam acces-sion number, domain name. Set 1 corresponds to yeast Pfams and set 2 to human Pfams.Click here for fileAdditional data file 5Comparison of Pfam domains from viruses and humanTable columns are, in the following order: numbering, Pfam acces-sion number, domain name. Set 1 corresponds to virus Pfams and set 2 to human Pfams.Click here for fileAdditional data file 6Comparison of Pfam domains from Viridiplantae and fungiTable columns are, in the following order: numbering, Pfam acces-sion number, domain name. Set 1 corresponds to Pfams from Viridiplantae and set 2 to fungal Pfams.Click here for fileAdditional data file 7Semantic comparison of biological processes from yeast and humanTable columns are, in the following order: numbering, GO term accession number, GO term name, GO term type, sim
Rel
, matched GO term accession number, matched GO term name, semantic similarity according to Lin, matched GO term accession number, matched GO term name.Click here for fileAdditional data file 8Semantic comparison of biological processes from Viridiplantae and fungiTable columns are, in the following order: numbering, GO term accession number, GO term name, GO term type, sim
Rel
, matched GO term accession number, matched GO term name, semantic similarity according to Lin, matched GO term accession number, matched GO term name.Click here for fileAdditional data file 9Complete FSST output for the comparison of proteins from Arabi-dopsis thaliana (NCBI Taxonomy id: 3702) and S. cerevisiae (NCBI Taxonomy id: 4932)Complete FSST output for the comparison of proteins from Arabi-dopsis thaliana (NCBI Taxonomy id: 3702) and S. cerevisiae (NCBI Taxonomy id: 4932)Click here for file
Acknowledgements
Part of this study was supported by the German National Genome
Research Network (NGFN), BMBF grant No. 016R0453, and by the Ger-
man Research Foundation (DFG), contract number KFO 129/1-1. This
work also forms part of the BioSapiens project, which is funded by the
European Commission within its FP6 Programme under the thematic area
'Life sciences, genomics and biotechnology for health', contract number
LSHG-CT-2003-503265.
References
1. Lord PW, Stevens RD, Brass A, Goble CA: Investigating semantic
similarity measures across the Gene Ontology: the relation-
ship between sequence and annotation. Bioinformatics 2003,
19:1275-1283.
2. Schlicker A, Domingues F, Rahnenführer J, Lengauer T: A new
measure for functional similarity of gene products based on
gene ontology. BMC Bioinformatics 2006, 7:302.
3. Ashburner M, Ball CA, Blake JA, Botstein D, Butler H, Cherry JM,
Davis AP, Dolinski K, Dwight SS, Eppig JT, et al.: Gene ontology:
tool for the unification of biology. The Gene Ontology
Consortium. Nat Genet 2000, 25:25-29.
4. Cao SL, Qin L, He WZ, Zhong Y, Zhu YY, Li YX: Semantic search
among heterogeneous biological databases based on gene
ontology. Acta Biochim Biophys Sin (Shanghai) 2004, 36:365-370.
5. Zhang P, Zhang J, Sheng H, Russo JJ, Osborne B, Buetow K: Gene
functional similarity search tool (GFSST). BMC Bioinformatics
2006, 7:135.
6. Wu CH, Apweiler R, Bairoch A, Natale DA, Barker WC, Boeckmann
B, Ferro S, Gasteiger E, Huang H, Lopez R, et al.: The Universal
Protein Resource (UniProt): an expanding universe of pro-
tein information. Nucleic Acids Res 2006, 34 (Database
issue):D187-D191.
7. Finn RD, Mistry J, Schuster-Böckler B, Griffiths-Jones S, Hollich V,
Lassmann T, Moxon S, Marshall M, Khanna A, Durbin R, et al.: Pfam:
clans, web tools and services. Nucleic Acids Res 2006, 34 (Data-
base issue):D247-D251.
8. Letunic I, Copley RR, Pils B, Pinkert S, Schultz J, Bork P: SMART 5:
domains in the context of genomes and networks. Nucleic
Acids Res 2006, 34 (Database issue):D257-D260.
9. Wheeler DL, Barrett T, Benson DA, Bryant SH, Canese K,
Chetvernin V, Church DM, DiCuccio M, Edgar R, Federhen S, et al.:
Database resources of the National Center for Biotechnol-
ogy Information. Nucleic Acids Res 2006, 34 (Database
issue):
D173-D180.
10. MySQL AB []
11. The GOTax Platform []
12. Java Technology []
13. The SOAP Protocol [ />14. The Web Services Description Language [ />TR/wsdl]
15. Apache Derby [ />16. Resnik P: Semantic similarity in a taxonomy: an information-
based measure and its application to problems of ambiguity
in natural language. J Artif Intell Res 1999, 11:95-130.
17. Lin D: An information-theoretic definition of similarity. In Pro-
ceedings of the 15th International Conference on Machine Learning (ICML-
98): 24-27 July 1998; Madison, WI Edited by: Shavlik JW. San Francisco,
CA: Morgan Kaufmann Publishers; 1998:296-304.
18. Sing T, Sander O, Beerenwinkel N, Lengauer T: ROCR: visualizing
classifier performance in R. Bioinformatics 2005, 21:3940-3941.
19. The R Project for Statistical Computing [http://www.r-
project.org]
20. Caruana R, Niculescu-Mizil A: Data mining in metric space: an
empirical analysis of supervised learning performance crite-
ria. In Proceedings of the Tenth ACM SIGKDD International Conference
on Knowledge Discovery and Data Mining: 22-25 August 2004; Seattle,
WA Edited by: Kim W, Kohavi R, Gehrke J, DuMouchel W. New
York, NY: ACM Press; 2004:69-78.
21. Mulder NJ, Apweiler R, Attwood TK, Bairoch A, Bateman A, Binns D,
Bradley P, Bork P, Bucher P, Cerutti L, et al.: InterPro, progress
and status in 2005. Nucleic Acids Res 2005, 33 (Database
issue):D201-D205.
22. Teplyakov A, Obmolova G, Khil PP, Howard AJ, Camerini-Otero RD,
Gilliland GL: Crystal structure of the Escherichia coli YcdX pro-
tein reveals a trinuclear zinc active site. Proteins 2003,
51:315-318.
23. Benarroch D, Egloff MP, Mulard L, Guerreiro C, Romette JL, Canard
B: A structural basis for the inhibition of the NS5 dengue
virus mRNA 2'-O-methyltransferase domain by ribavirin 5'-
triphosphate. J Biol Chem 2004, 279:35638-35643.
24. Zdobnov EM, Lopez R, Apweiler R, Etzold T: The EBI SRS server-
recent developments. Bioinformatics 2002, 18:368-373.
25. Mi H, Guo N, Kejariwal A, Thomas PD: PANTHER version 6: pro-
tein sequence and function evolution data with expanded
representation of biological pathways. Nucleic Acids Res 2007,
35 (Database issue):D247-D252.
26. Liu H, Hu ZZ, Wu CH: DynGO: a tool for visualizing and mining
of Gene Ontology and its associations. BMC Bioinformatics 2005,
6:201.