Báo cáo y học: "AGE-TSSchip: promoter-based expression profiling using the 5''''-leading label of capped transcripts" docx
Bạn đang xem bản rút gọn của tài liệu. Xem và tải ngay bản đầy đủ của tài liệu tại đây (313.89 KB, 10 trang )
Genome Biology 2007, 8:R42
comment reviews reports deposited research refereed research interactions information
Open Access
2007Katayamaet al.Volume 8, Issue 3, Article R42
Method
CAGE-TSSchip: promoter-based expression profiling using the
5'-leading label of capped transcripts
Shintaro Katayama
¤
*
, Mutsumi Kanamori-Katayama
¤
*
,
Kazumi Yamaguchi
*†
, Piero Carninci
*‡
and Yoshihide Hayashizaki
*‡
Addresses:
*
Laboratory for Genome Exploration Research Group, Genomic Sciences Center, RIKEN Yokohama Institute, Suehiro-cho,
Tsurumi-ku, Yokohama 230-0045, Japan.
†
Bioinformatics Solutions Division, Nittetsu Hitachi Systems Engineering, Inc., Akashi-cho, Chuo-
ku, Tokyo 104-6591, Japan.
‡
Genome Science Laboratory, Discovery and Research Institute, RIKEN Wako Main Campus, Hirosawa, Wako 351-
0198, Japan.
¤ These authors contributed equally to this work.
Correspondence: Yoshihide Hayashizaki. Email:
© 2007 Katayama et al.; licensee BioMed Central Ltd.
This is an open access article distributed under the terms of the Creative Commons Attribution License ( which
permits unrestricted use, distribution, and reproduction in any medium, provided the original work is properly cited.
Promoter-based expression profiling<p>A novel approach that combines CAGE expression analysis with oligonucleotide array technology allows for the accurate and sensitive detection of promoter-based transcriptional activity.</p>
Abstract
Cap analysis gene expression (CAGE) technology has revealed numerous transcription start sites
(TSSs) in mammals and has suggested complex promoter-based patterns of regulation. We
developed the CAGE-TSSchip to detect promoter-based transcriptional activity. The CAGE-
TSSchip is a customized oligonucleotide array that targets known TSSs identified by CAGE. A new
labeling method, labeling capped transcripts from the 5'-end, had to be developed. The CAGE-
TSSchip is accurate and sensitive, and represents the activity of each TSS.
Background
Many genome sequencing projects of model species are fin-
ished and a large number of full-length cDNAs have been iso-
lated. Trends in large-scale life science are changing from
collection of essential elements to developing an understand-
ing of global biologic mechanisms. Transcriptional regulatory
pathways are among the basal functional mechanisms that
remain largely unknown; estimation of promoter activity is
an essential component of analysis of regulatory networks.
Large-scale analysis of the human and mouse transcriptomes
using cap analysis gene expression (CAGE) technology [1],
revealed numerous transcription start sites (TSSs) [2,3]. The
TSSs are not randomly distributed; rather, they are concen-
trated at several short regions connected to each gene. On
average there are five or more TSS clusters at one locus, and
these are not only at the 5'-end of the gene but also within the
open reading frame or 3'-untranslated region (UTR). Pro-
moter-based expression clustering revealed that even TSS
clusters in the same locus exhibit different expression pat-
terns. This finding implies that the regulatory mechanism is
defined by each TSS cluster. Measuring the transcriptional
activity by using TSSs rather than genes would therefore lead
to a better understanding of transcriptional regulatory mech-
anisms. Furthermore, promoter-based expression profiling is
of benefit to the research community.
A tag-based approach for TSS analysis [4] such as CAGE
requires deep sequencing when it is used to measure fluctua-
tions in transcript expression, but deep sequencing is time
consuming and expensive. Also, the various traditional
expression profiling technologies did not represent the activ-
ity of each TSS but only the total activity of some TSSs.
Published: 26 March 2007
Genome Biology 2007, 8:R42 (doi:10.1186/gb-2007-8-3-r42)
Received: 4 October 2006
Revised: 5 January 2007
Accepted: 26 March 2007
The electronic version of this article is the complete one and can be
found online at />R42.2 Genome Biology 2007, Volume 8, Issue 3, Article R42 Katayama et al. />Genome Biology 2007, 8:R42
Searching among the microarray technologies for a technique
that will permit large-scale promoter-by-promoter analysis,
we modified our mature technology of purifying capped tran-
scripts [5] and developed a new labeling method starting
from the 5'-end of capped transcripts. This protocol made it
possible for us to design an array for promoter-based expres-
sion profiling, which we named the CAGE-defined TSS chip
(CAGE-TSSchip). We demonstrated its accuracy and sensitiv-
ity. Furthermore, by using CAGE-TSSchip we were able to
predict principal regulatory factors.
Results and discussion
CAGE-TSSchip for mouse promoters
Applying our technology to extraction of capped transcripts
[6,7], labeling of the CAGE-TSSchip starts from the 5'-end of
the capped transcripts (Figure 1). This is in contrast to tradi-
tional technology, in which labeling starts from the 3'-end of
the transcript. Because it is difficult to transcribe labeled RNA
from a certain downstream position to the cap site, we
designed a linker containing a T7 promoter and ligated this
linker to the 5'-end of the first strand full-length cDNAs.
According to the sense of labeled RNAs, we spotted the anti-
sense probes on the CAGE-TSSchip; this implies that the
CAGE-TSSchip can identify the direction of transcription.
Use of a tag-based probe design for promoter-based expres-
sion profiling, such as that proposed by Matsumura and cow-
orkers [8], is not advisable because the distribution of TSSs
affected by CpG islands is broad [2]. We therefore designed
the CAGE-TSSchip probes to target the proximal regions of
the promoters (Figure 2). We selected mainly transcription
factors defined in TFdb [9], and extracted promoter
sequences of these genes from the mouse CAGE database
[10].
We isolated three total RNAs from mouse and conducted two
comparisons using the CAGE-TSSchip; adult mouse liver ver-
sus mouse whole embryo in Theiler stage 17.5 (E17.5), and
hepatocellular carcinoma cell line Hepa1-6 versus adult
mouse healthy liver. We synthesized labeled RNAs using our
5'-leading method of capped transcripts and hybridized them
to the CAGE-TSSchip. To estimate the reproducibility of our
protocols, we designed dye swap experiments for these two
comparisons. These experiments also helped us to reduce
unavoidable technical variation [11]. After elimination of con-
trol, non-uniform, non-significant, or saturated spots, we
deleted the hybridization signal that did not exhibit similar
values in each dye swap experiment. The scatter plots for each
dye swap experiment revealed good correlation (r = 0.87-
0.96; Additional data file 2). The variation caused by proce-
dures (described in Materials and methods, below) including
our 5'-leading label method is therefore small.
Accuracy and sensitivity: similar tendencies with qRT-
PCR and CAGE
In order to confirm the accuracy of measurement of the
expression ratio around promoters, we compared results with
the CAGE-TSSchip with those with quantitative reverse tran-
scription polymerase chain reaction (qRT-PCR). Even if the
methods are different, it is important to demonstrate a simi-
lar tendency. First, we screened CAGE-TSSchip probes for
which the ratio was threefold different or greater (absolute
log ratio >0.5) between liver and E17.5. Then, we designed 20
qRT-PCR primers targeting similar regions of these probes
(see Materials and methods, below). Table 1 summarizes find-
ings with and comparison between CAGE-TSSchip and qRT-
PCR. In all, 17 CAGE-TSSchip probes exhibited positive log
ratios, which indicate high expression in the liver. Of these 17
probes, 16 showed similar positive log ratios to those for qRT-
PCR measurements. Furthermore, there were three CAGE-
TSSchip probes that exhibited similar negative log ratios to
those of qRT-PCR measurements. Thus, the CAGE-TSSchip
has an expression ratio similar to that of qRT-PCR.
The frequency of CAGE tags reflects the activity of TSSs [2].
We examined whether this TSS activity shown by CAGE was
reflected in the CAGE-TSSchip. We counted CAGE tag num-
bers in liver and E17.5 at the region upstream from the CAGE-
TSSchip probe position (see Materials and methods, below).
We focused on 20 probes, which once again were compared
with qRT-PCR. In this comparison CAGE tags corresponding
to 17 probes exhibited similar positive log ratios, and two of
the three remaining probes exhibited similar negative log
ratios (Table 1). Therefore, the CAGE-TSSchip also shows an
expression ratio similar to the frequency identified by CAGE
tag.
CAGE or similar serial analysis technologies require deep
sequencing if they are to recognize fluctuations in weak pro-
moter activity. Therefore, sensitivity is an important issue for
the CAGE-TSSchip. To estimate sensitivity, we evaluated
whether results with the CAGE-TSSchip and the correspond-
ing qRT-PCR were similar even when promoter activity is
low. First, we selected some CAGE-TSSchip probes, without
considering the log ratio values in the liver versus E17.5 com-
parison, and designed 88 primers (see Materials and meth-
ods, below) corresponding to these probes. We then
measured expression levels using qRT-PCR and compared
expression ratios (Additional data file 3). In this comparison
we could identify a tendency toward large mathematical error
(difference) in the log ratio between the CAGE-TSSchip and
qRT-PCR at high maximum qRT-PCR Ct value in liver and
E17.5 (Additional data file 4a). These findings mean that the
log ratios of rare transcripts tend to differ between the two
methods. This is intuitive because such large Ct values in
qRT-PCR, especially 30 or greater, also exhibit technical var-
iations in repetitive experiments. In our experiments, the Ct
value of 30 is equal to one transcript per eight cells. However,
the log ratios in the liver versus E17.5 comparison were well
Genome Biology 2007, Volume 8, Issue 3, Article R42 Katayama et al. R42.3
comment reviews reports refereed researchdeposited research interactions information
Genome Biology 2007, 8:R42
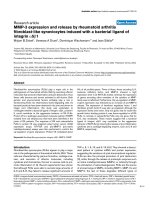
Schematic procedure of 5'-leading label of capped transcriptsFigure 1
Schematic procedure of 5'-leading label of capped transcripts. The procedure is as described in more detail in Materials and methods (see text).
mRNA (sense)
AAAAACap
random primer
1st strand cDNA synthesis
AAAAA
Cap
cDNA
AAAAA
Cap
cDNA
B
Biotinization
Capture with magnetic beads
AAAAA
Cap
cDNA
B
S
RNA hydrolysis
cDNA
C
a
p
B
S
Linker ligation
cDNA
T7 promoter
+ GNN
2nd strand cDNA synthesis
cDNA
T7 promoter
+ GNN
cRNA amplification
Labeled RNA
Hybridization on TSSchip
Single strand DNA
(antisense)
Double strand DNA
mRNA (sense)
cDNA (antisense)
Labeled RNA
(sense)
Magnetic beads
R42.4 Genome Biology 2007, Volume 8, Issue 3, Article R42 Katayama et al. />Genome Biology 2007, 8:R42
correlated between CAGE-TSSchip and qRT-PCR (r = 0.77)
in the 42 probes with a maximum Ct value above 30 (Addi-
tional data file 4b). About two million tags are required to rec-
ognize promoter-level fluctuations in expression of such rare
transcripts (Ct value >30) when using CAGE; this imposes
considerable burdens in terms of time and money. In conclu-
sion, the CAGE-TSSchip is fast, has a good cost/performance
ratio, and exhibits acceptable sensitivity.
Observations: intensity of the CAGE TSSchip
represents the activity of each TSS
Having established the accuracy and sensitivity of the CAGE-
TSSchip, we investigated several promoters of important
genes in liver by comparing them between liver and E17.5.
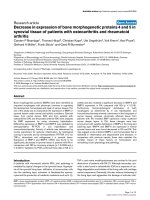
First, we focused on the liver-specific Bdh (Bdh1) gene, which
encodes an enzyme (3-hydroxybutyrate dehydrogenase type
1) that is active in fatty acid metabolism and is an important
marker of liver status. There are two isoforms in Bdh, and
these isoforms do not share the first exons. The CAGE-TSS-
chip probe A_51_P163108as was designed based on the 3'-
UTR of Bdh transcripts (Figure 3a and Additional data file 5).
The intensities of liver and E17.5 were almost the same and
were low (Additional data file 1). However, qRT-PCR clearly
showed that Bdh expression was higher in liver than in E17.5.
The CAGE-TSSchip probes pT16F01DD833D_1_61 and
pT16F01DD833D_1_41 also targeted the first exon of the
Bdh's shorter isoforms, and for these probes the intensities
were also low and almost the same between liver and E17.5.
Although the result of qRT-PCR validation demonstrated a
tendency toward lower expression in liver than in E17.5, there
was considerable discrepancy in fold value. In contrast, the
intensities of pT16F01DD69D0_1_61 and
pT16F01DD69D0_1_60, targeting the first exon of Bdh's
longer isoforms, were clearly different. They were about 6.8-
fold higher in liver than in E17.5. The qRT-PCR validation
identified the same tendency and a similar fold value.
The discrepancy in minor promoters in liver between CAGE-
TSSchip and qRT-PCR was expected because our labeling
method involves the extraction of active promoters. The
CAGE-TSSchip results also suggest that the regulatory mech-
anisms between these two promoters are different, even
though they belong to the same gene. Findings of hierarchical
clustering in CAGE expression [2] support this suggestion,
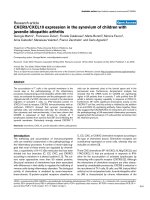
Overview of probe design: genomic coordination of TSSs and CAGE-TSSchip probesFigure 2
Overview of probe design: genomic coordination of TSSs and CAGE-TSSchip probes. The upper four tracks are an arrangement example of full-length
transcripts (cDNA) and 5'-ends of transcripts derived from various methods (cap analysis gene expression [CAGE], 5'-expressed sequence tag [EST], and
5'-end of gene identification signature/gene signature cloning [4]). Tag clusters (TC; green arrow) are the overlapping regions of the 5'-ends. The most
frequent transciption start site (TSS) for each TC is the representative position (vertical line from TC arrows). Fragments for the probe design, of 120-
nucleotide long genomic sequences, starts from the representative position of each TC fragment, shown by cyan arrows. If the fragment overlaps the 5'-
end of any exon-intron junction (diamond of cDNA and 5'-EST transcripts), the fragment skips the intron to the next exon. According to the Agilent
probe design service, the 60-nucleotide appropriate region within each fragment would then be suggested for array probes (probe; blue arrows). Details of
probe preparation are available in Additional data file 8.
cDNA
5’-EST
GIS/GSC
CAGE
TC
Fragment
Probe
Genome Biology 2007, Volume 8, Issue 3, Article R42 Katayama et al. R42.5
comment reviews reports refereed researchdeposited research interactions information
Genome Biology 2007, 8:R42
because the expression patterns in that study were clearly dif-
ferent; the former promoter belongs to expression cluster
number 4 and the latter to number 1 (Additional data file 6).
Therefore, the CAGE-TSSchip findings in terms of these two
isoforms are reasonable.
We then examined the Aldh7a1 gene, which encodes an
important enzyme (aldehyde dehydrogenase 7 family, mem-
ber A1) that is highly expressed in liver. As for Bdh1, there are
two isoforms in Aldh7a1; however, the first exon of the short
isoform shares the third exon of the long isoform. The CAGE-
TSSchip has five probes for Aldh7a1 (Figure 3b and Addi-
tional data file 5). The CAGE-TSSchip findings suggest that
the major promoter of Aldh7a1 in liver is the first exon of the
short isoform; validation by qRT-PCR supports this finding.
Based on our design of the CAGE-TSSchip, we expected the
intensity of CAGE-TSSchip findings to represent the activity
of each TSS, which would lead to a considerably greater dif-
ference for 5'-side probes than for 3'-side ones. This tendency
could be seen in Bdh, in Aldh7a1, and in other genes (for
example Ppp3ca, Scp2, Glo1, Fga, and Trf). Because of this,
we believe that the CAGE-TSSchip, as a tool for measuring
TSS activity, will perform as we expected it to.
E2F target genes were activated in Hepa1-6
We wished to demonstrate whether the CAGE-TSSchip
makes it possible to analyze promoter-based regulatory
mechanisms directly. It is noted that the functional regula-
tory elements that control transcription tend to be located
close to TSSs [12]. We designed the CAGE-TSSchip probes at
the proximal downstream region of known TSSs, and our pro-
tocols including the 5'-leading label method can demonstrate
which TSSs are controlled. Because of this, the CAGE-TSS-
chip can help to identify important promoters and control
elements. Below, we describe a comparison of Hepa1-6 and
'normal' adult mouse liver, and demonstrate both regulated
(target) gene screening and regulator prediction.
In this comparison, 117 nonredundant probes of 98 genes
identified over-expression (log ratio >0.5) in Hepa1-6, and 47
nonredundant probes of 36 genes revealed under-expression
(log ratio <-0.5; Additional data file 7). In the comparison of
the cancer cell line with normal tissue, many promoters of
genes related to cell proliferation are expected to be extracted.
Actually, genes related to DNA metabolism, which form the
superclass of DNA replication in Gene Ontology (GO), were
the most significantly enriched among the former genes (87/
98 genes had some GO annotation and 21/87 genes were
annotated with GO:0006259; P = 3.22 × e
-07
using GOstat
Table 1
Cross-validation by qRT-PCR and CAGE in mouse liver versus E17.5
Target gene CAGE-TSSchip qRT-PCR CAGE
Probe ID Ratio
a
Ratio
a
Ratio
a
Scp2 pT04R06588376_1_55 1.54 2.22 2.25
Phyh pT02F004A4350_1_56 1.47 1.48 2.09
H2-Q7 pT17F02067AF1_1_1 1.33 1.44 2.52
Gcgr pT11F072A22AF_1_56 1.10 1.32 1.58
1500017E21Rik pT19R022303AA_2_11 1.08 1.09 0.39
b
H2-K1 pT17R01EFDD1A_2_55 1.08 1.36 3.04
Ttr pT18F01417BA8_1_61 1.03 1.27 0.47
b
Creb3l3 pT10R04D401D2_1_59 0.99 1.18 1.76
Aldh7a1 pT18R0366ABBD_1_60 0.95 0.39
b
2.17
Apoa1 A_65_P16973as 0.93 1.14 0.76
Ttr pT18F014197F5_1_51 0.93 1.14 0.56
Ppara pT15F0521ABCF_1_61 0.92 0.92 1.77
Bdh pT16F01DD69D0_1_61 0.83 0.91 0.93
Hhex pT19F022F5EF6_1_61 0.75 0.88 1.63
H2-K1 pT17R01EF8909_1_61 0.67 -0.35
b,c
2.89
Trf A_65_P04625as 0.65 0.59 0.94
Mdh1 A_51_P218179as 0.57 0.19
b
0.03
b
Mcm7 pT05R08145E66_1_60 -0.52 -0.87 -0.33
b
Nisch pT14R019FAD28_1_56 -0.54 -0.27
b
0.67
c
D0H4S114 pT18R02055333_1_60 -0.67 -1.04 -0.95
Primer sequences are available in Additional data file 9. We assume that the absolute calue of the log ratio >0.5 is significantly different expression
between liver and E17.5.
a
Ratio = log
10
(liver/E17.5).
b
Non-significance.
c
Tendency for the sample to be highly different from the CAGE-TSSchip
result. CAGE, cap analysis gene expression; qRT-PCR, quantitative reverse transcription polymerase chain reaction.
R42.6 Genome Biology 2007, Volume 8, Issue 3, Article R42 Katayama et al. />Genome Biology 2007, 8:R42
[13]). Moreover, there were probes targeting the 5'-UTR or
almost upstream of the genes encoding anaphase-promoting
complex subunit 5 (Anapc5), minichromosome maintenance
proteins (MCM2-7), and cyclin-dependent kinase 4 (Cdk4) in
the former gene set. MCM genes have recently emerged as
cancer biomarkers [14], and Cdk4 is important for cell cycle
G1 phase progression. It is no surprise that abnormal prolif-
eration occurs in the comparison between Hepa1-6 and 'nor-
mal' liver. Therefore, these target gene screen findings with
CAGE-TSSchip agree well with current findings.
In order to identify regulatory factors of over-expressed genes
in Hepa1-6, we estimated the over-represented transcription-
factor binding sites (TFBSs) around the promoters of these
Observations of CAGE-TSSchip in liver versus E17.5 and genomic coordinationFigure 3
Observations of CAGE-TSSchip in liver versus E17.5 and genomic coordination. (a) Bdh (Bdh1), which encodes 3-hydroxybutyrate dehydrogenase type 1.
(b) Aldh7a1, which encodes aldehyde dehydrogenase 7 family, member A1. The red arrow in the tag cluster (TC) track describes cap analysis gene
expression (CAGE) tag frequency, and TC width and direction. Transcript tracks show the splicing pattern and coding region of each transcript. PROBE
shows the CAGE-TSSchip probes, and the blue values beside each probe are the intensity ratio between the liver and the E17.5 sample from the CAGE-
TSSchip experiment. The red values on the bottom of each figure are the validated ratios, according to by quantitative reverse transcription polymerase
chain reaction (also see Additional data file 5).
X6.8 higher in liver
than E17.5
(CAGE-TSSchip)
X5.8 higher in liver than E17.5
X1.7 lower in liver than E17.5
X1.7 lower in liver than E17.5
(Liver/E17.5=1.3~0.8)
(a)
X7.4 higher in liver
than E17.5 (qRT-PCR)
X15.8 lower in liver than E17.5
X5.6 higher in liver than E17.5
X1.1 higher in liver than E17.5
X1.1 higher in liver than E17.5
(Inconsistent in dye-swap)
X8.9 higher in liver than E17.5
X15.8 higher in liver than E17.5
X8.1 higher in liver
than E17.5 (qRT-PCR)
X1.8 higher in liver than E17.5
(b)
X1.1 higher in liver than E17.5
(CAGE-TSSchip)
Genome Biology 2007, Volume 8, Issue 3, Article R42 Katayama et al. R42.7
comment reviews reports refereed researchdeposited research interactions information
Genome Biology 2007, 8:R42
genes. Table 2 shows the over-representation of the predicted
TFBSs around the former probes in terms of Hepa1-6 over-
expression promoters. The E2F1 binding site was the most
over-represented TFBS. The probe for the E2F1 promoter
also exhibited modest over-expression (log ratio about 0.43).
Although the probe for the Sp1 transcription factor's pro-
moter did not exhibit significant over-expression (log ratio
about 0.27), the Sp1 binding site was over-represented. Sp1 is
also related to cell growth and the cell cycle with phosphoryla-
tion events [15]. Kageyama and coworkers [16] suggested that
the epidermal growth factor receptor (EGFR)-specific tran-
scription factors (ETF) could also play a role in over-expres-
sion of the cellular oncogene EGFR. Therefore, we may
conclude that regulator prediction using the CAGE-TSSchip
is also reasonable.
We note that the first exon of E2F transcription factor 7
(E2F7) was over expressed in Hepa1-6. As de Bruin and cow-
orkers [17] pointed out, this gene could block the E2F-
dependent activation of a subset of E2F target genes. Zfp161
and Churc1 are novel candidate regulators of Hepa1-6 over-
expressed genes because the CAGE-TSSchip analysis
revealed that these TFBSs are also over-represented around
the Hepa1-6 over-expressed promoters. These novel
regulators might represent an alternative regulatory pathway
for Hepa1-6 phenotype.
We believe CAGE-TSSchip to be a useful tool in promoter-by-
promoter analysis of regulatory networks. When similar pre-
diction is performed using a non-promoter-specific microar-
ray-based gene expression technology, representative
transcripts (for example, RefSeq sets) are used to identify the
genomic region that regulates promoter activity. The 5'-end of
these representative transcripts is assumed to be the candi-
date TSS. Furthermore, proximal regions of these TSSs are
candidate regulatory regions of transcription when this type
of technology is used. If this traditional technology yields a
similar result, then the regulated TSSs identified by the
CAGE-TSSchip should overlap with the 5'-end of the RefSeq
transcripts. However, out of the 163 TSSs belonging to over-
expressed or under-expressed genes, 74 did not overlap with
the 5'-end of the RefSeq sets. All of the cDNAs can be used to
capture all of the TSSs; in this case, many unregulated TSSs
would be included. For example, the probe set of the Affyme-
trix MG-U74 v2 chip could not define the singular TSSs in 26
out of the 124 genes that exhibited over-expressed or under-
expression. Such probes show the summation of activities in
all alternative promoters, and the search space for regulatory
elements expands. Therefore, although the prediction of
important regulators using the traditional expression profil-
ing technology might be able to achieve similar results as the
CAGE-TSSchip, one could assume that the significance would
be lower. The CAGE-TSSchip has been optimized for pro-
moter-by-promoter analysis.
Conclusion
We developed the CAGE-TSSchip technology. This chip was
able to identify the probes targeting the proximal region of
the promoter defined by CAGE, and must be used with a new
labeling method. This labeling method permitted labeling
from the 5'-end of the capped transcripts. In a direct compar-
ison between mouse liver and E17.5, CAGE-TSSchip identi-
fied expression ratios similar to those with qRT-PCR and
CAGE, and had sufficient sensitivity to recognize the fluctua-
tion in rare transcripts. Furthermore, the intensities of
CAGE-TSSchip reflected the activity of each TSS, and so this
technology may be useful in evaluating regulatory pathways.
CAGE-TSSchip permits promoter-based expression profiling
with a favorable ratio of cost to performance and good accu-
racy by applying mature, two-color microarray technologies
and equipment. Recently, several microarray platforms sup-
porting one-color gene expression analysis for comparisons
of many samples were developed. We were unfortunately
unable to try these systems, but we will be able to change
Table 2
Over-represented TFBSs around the over-expressed promoter in Hepa1-6 compared with liver
TRANSFAC matrixID |Log
10
(Hepa1-6/liver)| > 0.5 P value
a
Binding factors
Hepa1-6 > liver Liver > Hepa1-6
Number of probes % Number of probes %
V$E2F1_Q3 87 74.4% 16 34.0% 2.31 × e
-06
E2f1
V$SP1_01 73 62.4% 11 23.4% 6.04 × e
-06
Sp1
V$ETF_Q6 62 53.0% 9 19.1% 9.96 × e
-05
ETF
b
V$ZF5_01 77 65.8% 16 34.0% 2.50 × e
-04
Zfp161
V$CHCH_01 81 69.2% 18 38.3% 3.72 × e
-04
Churc1
Total 117 47
a
Statistical significance of the over-representation of each transcription-factor binding site (TFBS) around the over-expressed promoter in Hepa1-6
compared with liver, determined using Fisher's exact probability test.
b
Although TRANSFAC indicated that EGFR-specific transcription factor (ETF)
binds to V$ETF_Q6 matrix, there was no report of this interaction in the mouse ortholog.
R42.8 Genome Biology 2007, Volume 8, Issue 3, Article R42 Katayama et al. />Genome Biology 2007, 8:R42
CAGE-TSSchip to a one-color analysis with minor
modification.
In CAGE [1] and similar serial analysis technologies [4] for
identification of novel TSSs, deep sequencing is necessary to
identify promoters of rare transcripts or to compare expres-
sion levels in several samples. The current CAGE-TSSchip
cannot identify novel promoters because we designed probes
based on known transcripts and promoters, mainly defined
by CAGE. However, several high-density microarray technol-
ogies will help us to identify novel promoters by combining
them with our 5'-leading label method. A whole-genome
tiling array is one approach to genome-wide promoter-based
expression profiling.
An initial step in the analysis of transcriptional regulatory
mechanisms is the identification of regulated elements and
control elements. TSSs are just regulated elements, and major
control elements are located around them. Therefore, pro-
moter-based expression profiling is important in enhancing
our understanding of regulatory mechanisms. CAGE-TSS-
chip and our 5'-leading label method is an alternative
approach to promoter-based expression profiling, and it will
help us to conduct promoter-by-promoter analysis of regula-
tory networks.
Materials and methods
Probe design
Figure 2 is an overview of the CAGE-TSSchip probe design.
First, we defined tag clusters (TCs) from transcripts and sev-
eral tag-based resources. Furthermore, we chose the repre-
sentative position of a TC as the most frequent TSS. We
selected about 4,500 TCs from about 2,500 transcriptional
units [18], which were mainly transcription factors [9] as
defined by CAGE tags from E17.5. We then prepared 120-
nucleotide long genomic sequence fragments located in the
proximity downstream of the representative position of the
TC, according to splicing patterns of known transcripts. Cus-
tom Microarray Design Services (Agilent Technologies, Santa
Clara, California, United States)) proposed appropriate 60-
mer probes from each fragment. We adopted two (redundant)
probes from each fragment, and added several control probes
and reference probes (reverse complement to the Agilent Cat-
alog Array probes; the prefix of the probeID is 'A_'). All probe
sequences and their annotations are available in Additional
data file 1, and details of the probe design are available in
Additional data file 8.
RNA preparation
Tissues from adult male and embryos from C57BL/6J mice
were extracted according to the RIKEN Institute's guidelines.
The Hepa1-6 cell line was purchased from the RIKEN Cell
Bank (Tsukuba, Ibaraki, Japan) and was cultured in Dul-
becco's modified eagle medium supplemented with 10% heat-
inactivated fetal bovine serum, 200 U/ml penicillin, and 200
μg/ml streptomycin. The total RNA was extracted using the
acid phenol guanidinium thiocyanate-chloroform method.
Details of the RNA preparation are available in Additional
data file 8.
5'-Leading label and hybridization
Figure 1 shows the schematic procedure of the 5'-leading label
and hybridization process. The cDNA synthesis was per-
formed using 50 μg of total RNA and with first-strand cDNA
primer (random sequence) using SuperScript II RT (Invitro-
gen, Carlsbad, California, United States). The full-length
cDNAs were then selected with the biotinylated cap-trapper
method. A specific linker was used that contained the T7 pro-
moter sites 'upper oligonucleotide GN3' (sequence 5'-ACT-
AATACGACTCACTATAGGNNN-3') and 'upper
oligonucleotide GGN2' (sequence 5'-ACTAATACGACTCAC-
TATAGGGNN-3'), which were mixed at a ratio of 4:1. This
mixture was in turn mixed at a ratio of 1:1 to the 'lower oligo-
nucleotides' (sequence 5'-TGATTATGCTGAGTGATATCC-
3'). The sequence was then ligated to the single-strand cDNA.
The second strand of the cDNA was synthesized with the T7
promoter primer and the DNA polymerase (TaKaRa, Ohtsu,
Shiga, Japan). Details of cDNA synthesis, cRNA amplification
for the 5'-leading label, and the hybridization are available in
Additional data file 8.
Quality check for the CAGE-TSSchip assay
Before analysis, control spots, saturated spots, non-uniform
spots, and non-significant spots (according to Feature Extrac-
tion, the standard tool provided by Agilent for evaluating
probe features) were removed. We also compared the Cy3 and
Cy5 intensities of the same RNA samples in a dye swap exper-
iment. We expected these signals to be correlated; however,
low-intensity spots diverged somewhat from the regression
line. We therefore excluded such probes that differed more
than two times the standard residual deviation from the
regression line. All intensity values and filtering results are
available in Additional data file 1, and an overview can be
found in Additional data file 2.
Validation with qRT-PCR
Primer pairs were designed using an optimal primer size of 20
bases and annealing temperature of 60°C, using Primer3 soft-
ware [19]. The uniqueness of the designed primers pairs was
verified using the UCSC in silico PCR search in the UCSC
Genome Browser Database [20]. This method checks that
homologous regions are not cross-amplified by the same
primer pair. All primers were also verified by amplification
with mouse genome DNA. First-strand cDNA synthesis (5 μg
total RNA per 20 μl reaction) was carried out using a random
primer and the ThermoScript RT-PCR System (Invitrogen),
in accordance with the manufacturer's protocol. A qRT-PCR
was carried out with first-strand cDNA corresponding to 12.5
ng total RNA per reaction well using the tailor-made reaction
[21]. The PCR reactions were performed with an ABI Prism
(Applied Biosystems, Foster City, California, United States)
Genome Biology 2007, Volume 8, Issue 3, Article R42 Katayama et al. R42.9
comment reviews reports refereed researchdeposited research interactions information
Genome Biology 2007, 8:R42
using the following cycling protocols: 15 min hot start at 94°C,
followed by 40 cycles of 15 s at 94°C, 30 s at 60°C, and 30 s at
72°C. The threshold cycle (Ct) value was calculated from
amplification plots, in which the fluorescence signal detected
was plotted against the PCR cycle. All primer sequences are
available in Additional data files 3, 5 and 9.
Validation with CAGE
Transcripts overlapping with probes serve as guides for the
assignment between probes and CAGE tags. The total number
of CAGE tags located from the probe position to 100 nucle-
otides upstream of the 5'-end of the overlapping transcripts is
the expression level as estimated by CAGE. If several tran-
scripts overlap with the same probe, then the transcript tran-
scribed from the most upstream position is chosen as a
representative transcript. CAGE tags are classified by RNA
samples. The target RNA library IDs in this study were CBR,
CCM and IN, corresponding to liver, Hepa1-6 and E17.5,
respectively. Finally, log ratio values were calculated accord-
ing to CAGE-TSSchip assays. Dataset details are available in
Additional data file 8.
Over-represented TFBS analysis
First, we chose probes exhibiting significant differences
between Hepa1-6 and liver, with an absolute ratio above 0.5.
After exclusion of redundant probes, we predicted the TFBSs
around the probes in an area ranging from 1,000 nucleotides
upstream to 200 nucleotides downstream using MATCH [22]
from TRANSFAC [23] 9.4, with minimum false-negative pro-
files (minFN94.prf). The over-representation of each binding
matrix was evaluated by using Fisher's exact probability test
[24]. The matrices in Table 2 are the five most significantly
over-represented ones in the regulatory regions of several
genes, which exhibit higher expression in Hepa1-6 than in
liver.
Additional data files
The following additional data are available with the online
version of this paper. Additional data file 1 provides TSSchip
probe annotation and experimental results. Additional data
file 2 shows the performance of 5'-leading label in dye swap
experiments. Additional data file 3 provides details of
sensitivity check with qRT-PCR. Additional data file 4 sum-
marizes the sensitivity check with qRT-PCR. Additional data
file 5 provides details of the alternative promoter check with
qRT-PCR. Additional data file 6 provides CAGE expression
clustering results of Bdh alternative promoters. Additional
data file 7 summarizes over-expressed promoters in Hepa1-6
and liver. Additional data file 8 provides supplementary
methods about the array probe design and whole protocols of
wet experiments. Additional data file 9 gives details of cross-
validation by qRT-PCR and CAGE in mouse liver versus
E17.5.
Additional data file 1TSSchip probe annotation and experimental resultsTSSchip probe annotation and experimental results. Some probe-sequences from the Agilent Catalog Array are not included in this data file because of a material transfer agreement between RIKEN and Agilent. (Please contact Agilent if you need these probe sequences.)Click here for fileAdditional data file 2Performance of 5'-leading label in dye swap experimentsShown is the performance of 5'-leading label in dye swap experiments.Click here for fileAdditional data file 3Details of sensitivity check with qRT-PCRShown are the details of a sensitivity check with the qRT-PCR.Click here for fileAdditional data file 4Sensitivity check with qRT-PCRSummarized is the sensitivity check with the qRT-PCR.Click here for fileAdditional data file 5Details of the alternative promoter check with qRT-PCRDetails of the alternative promoter check with qRT-PCR are given.Click here for fileAdditional data file 6CAGE expression clustering results of Bdh alternative promotersShown are CAGE expression clustering results of Bdh alternative promoters.Click here for fileAdditional data file 7Over-expressed promoters in Hepa1-6 and liverShown are over-expressed promoters in Hepa1-6 and liverClick here for fileAdditional data file 8Supplementary methods regarding the array probe design and whole protocols of wet experimentsSupplementary Methods regarding the array probe design and whole protocols of wet experiments are given.Click here for fileAdditional data file 9Details of cross-validation by qRT-PCR and CAGE in mouse liver versus E17.5Shown are details of cross-validation by qRT-PCR and CAGE in mouse liver versus E17.5.Click here for file
Acknowledgements
We thank Yuki Tsujimura for her technical assistance, Yasumasa Kimura for
the CAGE analysis, Noriko Ninomiya for the qRT-PCR analysis, Yayoi Kita-
zume for sample preparation, and Ann Karlsson and Hanna Daub for
English editing. This study was supported by research grants from the Min-
istry of Education, Culture, Sports, Science and Technology of the Japanese
Government to YH for the following: (1) the Genome Network Project
and (2) the RIKEN Genome Exploration Research Project.
References
1. Shiraki T, Kondo S, Katayama S, Waki K, Kasukawa T, Kawaji H,
Kodzius R, Watahiki A, Nakamura M, Arakawa T, et al.: Cap analysis
gene expression for high-throughput analysis of transcrip-
tional starting point and identification of promoter usage.
Proc Natl Acad Sci USA 2003, 100:15776-15781.
2. Carninci P, Sandelin A, Lenhard B, Katayama S, Shimokawa K, Ponjavic
J, Semple CA, Taylor MS, Engstrom PG, Frith MC, et al.: Genome-
wide analysis of mammalian promoter architecture and
evolution. Nat Genet 2006, 38:626-635.
3. Carninci P, Kasukawa T, Katayama S, Gough J, Frith MC, Maeda N,
Oyama R, Ravasi T, Lenhard B, Wells C, et al.: The transcriptional
landscape of the mammalian genome. Science 2005,
309:1559-1563.
4. Harbers M, Carninci P: Tag-based approaches for transcrip-
tome research and genome annotation. Nat Methods 2005,
2:495-502.
5. Katayama S, Hayashizaki Y: Complex transcription mechanisms
in mammalian genomes: the transcriptome of FANTOM3.
Curr Genomics 2005, 6:619-625.
6. Carninci P, Kvam C, Kitamura A, Ohsumi T, Okazaki Y, Itoh M,
Kamiya M, Shibata K, Sasaki N, Izawa M, et al.: High-efficiency full-
length cDNA cloning by biotinylated CAP trapper. Genomics
1996, 37:327-336.
7. Carninci P, Westover A, Nishiyama Y, Ohsumi T, Itoh M, Nagaoka S,
Sasaki N, Okazaki Y, Muramatsu M, Schneider C, et al.: High effi-
ciency selection of full-length cDNA by improved bioti-
nylated cap trapper. DNA Res 1997, 4:61-66.
8. Matsumura H, Bin Nasir KH, Yoshida K, Ito A, Kahl G, Kruger DH,
Terauchi R: SuperSAGE array: the direct use of 26-base-pair
transcript tags in oligonucleotide arrays. Nat Methods 2006,
3:469-474.
9. Kanamori M, Konno H, Osato N, Kawai J, Hayashizaki Y, Suzuki H: A
genome-wide and nonredundant mouse transcription factor
database. Biochem Biophys Res Commun 2004,
322:787-793.
10. Kawaji H, Kasukawa T, Fukuda S, Katayama S, Kai C, Kawai J, Carninci
P, Hayashizaki Y: CAGE Basic/Analysis Databases: the CAGE
resource for comprehensive promoter analysis. Nucleic Acids
Res 2006:D632-D636.
11. Churchill GA: Fundamentals of experimental design for cDNA
microarrays. Nat Genet 2002:490-495.
12. Wasserman WW, Sandelin A: Applied bioinformatics for the
identification of regulatory elements. Nat Rev Genet 2004,
5:276-287.
13. Beissbarth T, Speed TP: GOstat: find statistically overrepre-
sented Gene Ontologies within a group of genes. Bioinformatics
2004, 20:1464-1465.
14. Gonzalez MA, Tachibana KE, Laskey RA, Coleman N: Control of
DNA replication and its potential clinical exploitation. Nat
Rev Cancer 2005, 5:135-141.
15. Chu S, Ferro TJ: Sp1: regulation of gene expression by
phosphorylation. Gene 2005, 348:1-11.
16. Kageyama R, Merlino GT, Pastan I: A transcription factor active
on the epidermal growth factor receptor gene. Proc Natl Acad
Sci USA 1988, 85:5016-5020.
17. de Bruin A, Maiti B, Jakoi L, Timmers C, Buerki R, Leone G: Identifi-
cation and characterization of E2F7, a novel mammalian E2F
family member capable of blocking cellular proliferation. J
Biol Chem 2003, 278:42041-42049.
18. Kasukawa T, Katayama S, Kawaji H, Suzuki H, Hume DA, Hayashizaki
Y: Construction of representative transcript and protein sets
of human, mouse, and rat as a platform for their transcrip-
tome and proteome analysis. Genomics 2004, 84:913-921.
19. Rozen S, Skaletsky H: Primer3 on the WWW for general users
and for biologist programmers. Methods Mol Biol 2000,
132:365-386.
R42.10 Genome Biology 2007, Volume 8, Issue 3, Article R42 Katayama et al. />Genome Biology 2007, 8:R42
20. Hinrichs AS, Karolchik D, Baertsch R, Barber GP, Bejerano G, Claw-
son H, Diekhans M, Furey TS, Harte RA, Hsu F, et al.: The UCSC
Genome Browser Database: update 2006. Nucleic Acids Res
2006:D590-D598.
21. Suzuki H, Okunishi R, Hashizume W, Katayama S, Ninomiya N, Osato
N, Sato K, Nakamura M, Iida J, Kanamori M, et al.: Identification of
region-specific transcription factor genes in the adult mouse
brain by medium-scale real-time RT-PCR. FEBS Lett 2004,
573:214-218.
22. Kel AE, Gossling E, Reuter I, Cheremushkin E, Kel-Margoulis OV,
Wingender E: MATCH: A tool for searching transcription fac-
tor binding sites in DNA sequences. Nucleic Acids Res 2003,
31:3576-3579.
23. Matys V, Kel-Margoulis OV, Fricke E, Liebich I, Land S, Barre-Dirrie
A, Reuter I, Chekmenev D, Krull M, Hornischer K, et al.: TRANS-
FAC and its module TRANSCompel: transcriptional gene
regulation in eukaryotes. Nucleic Acids Res 2006:D108-D110.
24. Fisher LD, Belle G: Biostatistics: a Methodology for the Health Sciences
New York, NY: John Wiley & Sons; 1993.
25. Benson DA, Karsch-Mizrachi I, Lipman DJ, Ostell J, Wheeler DL:
GenBank. Nucleic Acids Res 2006:D16-D20.
26. Pruitt KD, Tatusova T, Maglott DR: NCBI Reference Sequence
(RefSeq): a curated non-redundant sequence database of
genomes, transcripts and proteins. Nucleic Acids Res
2005:D501-D504.
27. Birney E, Andrews D, Caccamo M, Chen Y, Clarke L, Coates G, Cox
T, Cunningham F, Curwen V, Cutts T, et al.: Ensembl 2006. Nucleic
Acids Res 2006:D556-D561.
28. Waterston RH, Lindblad-Toh K, Birney E, Rogers J, Abril JF, Agarwal
P, Agarwala R, Ainscough R, Alexandersson M, An P, et al.: Initial
sequencing and comparative analysis of the mouse genome.
Nature 2002, 420:520-562.
29. Kent WJ: BLAT: the BLAST-like alignment tool. Genome Res
2002, 12:656-664.
30. Florea L, Hartzell G, Zhang Z, Rubin GM, Miller W: A computer
program for aligning a cDNA sequence with a genomic DNA
sequence.
Genome Res 1998, 8:967-974.
31. McGinnis S, Madden TL: BLAST: at the core of a powerful and
diverse set of sequence analysis tools. Nucleic Acids Res
2004:W20-W25.
32. Chomczynski P, Sacchi N: Single-step method of RNA isolation
by acid guanidinium thiocyanate-phenol-chloroform
extraction. Anal Biochem 1987, 162:156-159.