Báo cáo y học: "Integration of Arabidopsis thaliana stress-related transcript profiles, promoter structures, and cell-specific expression" pptx
Bạn đang xem bản rút gọn của tài liệu. Xem và tải ngay bản đầy đủ của tài liệu tại đây (1.12 MB, 22 trang )
Open Access
Volume
Ma and 8, Issue
2007 Bohnert 4, Article R49
Research
Shisong Ma*† and Hans J Bohnert†‡
comment
Integration of Arabidopsis thaliana stress-related transcript profiles,
promoter structures, and cell-specific expression
Addresses: *Physiological and Molecular Plant Biology Graduate Program, University of Illinois at Urbana-Champaign, Urbana, IL 61801, USA.
†Department of Plant Biology, University of Illinois at Urbana-Champaign, Urbana, IL 61801, USA. ‡Department of Crop Sciences, University
of Illinois at Urbana-Champaign, Urbana, IL 61801, USA.
Published: 4 April 2007
reviews
Correspondence: Hans J Bohnert. Email:
Received: 27 September 2006
Revised: 2 January 2007
Accepted: 4 April 2007
Genome Biology 2007, 8:R49 (doi:10.1186/gb-2007-8-4-r49)
The electronic version of this article is the complete one and can be
found online at />
Background: Arabidopsis thaliana transcript profiles indicate effects of abiotic and biotic stresses
and tissue-specific and cell-specific gene expression. Organizing these datasets could reveal the
structure and mechanisms of responses and crosstalk between pathways, and in which cells the
plants perceive, signal, respond to, and integrate environmental inputs.
information
Genome Biology 2007, 8:R49
interactions
Conclusion: By analyzing the stress-dependent expression profile, we define a common stress
transcriptome that apparently represents universal cell-level stress responses. Combining stressdependent and tissue-specific and cell-specific expression profiles, and Arabidopsis 5'-regulatory
DNA sequences, we confirm known stress-related 5' cis-elements on a genome-wide scale, identify
secondary motifs, and place the stress response within the context of tissues and cell lineages in
the Arabidopsis root.
refereed research
Results: We clustered Arabidopsis transcript profiles for various treatments, including abiotic,
biotic, and chemical stresses. Ubiquitous stress responses in Arabidopsis, similar to those of fungi
and animals, employ genes in pathways related to mitogen-activated protein kinases, Snf1-related
kinases, vesicle transport, mitochondrial functions, and the transcription machinery. Induced
responses to stresses are attributed to genes whose promoters are characterized by a small
number of regulatory motifs, although secondary motifs were also apparent. Most genes that are
downregulated by stresses exhibited distinct tissue-specific expression patterns and appear to be
under developmental regulation. The abscisic acid-dependent transcriptome is delineated in the
cluster structure, whereas functions that are dependent on reactive oxygen species are widely
distributed, indicating that evolutionary pressures confer distinct responses to different stresses in
time and space. Cell lineages in roots express stress-responsive genes at different levels.
Intersections of stress-responsive and cell-specific profiles identified cell lineages affected by abiotic
stress.
deposited research
Abstract
reports
© 2007 Ma and Bohnert; licensee BioMed Central Ltd.
This is an open access article distributed under the terms of the Creative Commons Attribution License ( which
permits unrestricted use, distribution, and reproduction in any medium, provided the original work is properly cited.
ages inresponse transcriptome, identifies tissue- and cell-specific expression profiles stress response in the context of analysis defines a
commonintegration of stress-dependent, major motifs for stress response, and placesand 5'-regulatory sequence motif tissue and cell line
The stress in Arabidopsis
Stress the <it>Arabidopsis </it>root.
R49.2 Genome Biology 2007,
Volume 8, Issue 4, Article R49
Ma and Bohnert
Background
Knowledge about responses of the model plant Arabidopsis
thaliana to abiotic or biotic stresses has accumulated during
the past decade, based on large-scale mutant analyses and
genome-wide transcript profiles. In particular, random mutagenesis combined with cell-specific or treatment-specific
reporter gene expression has identified many players in the
stress response, whereas microarray-based observations have
revealed transcriptional responses to stresses on a genomewide scale [1-4]. However, most analyses have been restricted
to individual genes or treatments. Plant-specific databases,
such as The Arabidopsis Information Resource (TAIR), Genevestigator, and the Nottingham Arabidopsis Stock Centre
(NASC), have begun to collect data from various sources and
merge them with genome sequence-based features [5-8];
however, the data typically exist in isolation. Integrating
these diverse datasets remains a significant challenge in the
assembly of a unifying picture of plant responses to environmental effects. For this purpose, various tools have been
developed, such as MapMan and STKE (Signal Transduction
Knowledge Environment), which begin to link individual
genes to pathways or coregulation circuits [9,10]. Here, we
present an alternative approach to integrating different datasets related to plant stress responses.
In Arabidopsis, as in all organisms, a variety of stress factors
that disturb homeostatic conditions bring about ubiquitous
as well as distinct responses at the transcription level. Identification of ubiquitous, cell autonomous responses is based on
monitoring the status of macromolecules in cells, gauging
DNA damage, protein degradation, or lipid membrane integrity, and eliciting pathways that carry out repair functions
[11]. The degree of damage will trigger this common response,
which must be distinguished from a set of reactions that recognize and respond to specific stress conditions. Identifying
the genes that determine the specific responses and then separating them into distinct groups, functional categories, and
pathways is an important task that must be undertaken if we
are to elucidate how plants sense and recognize the environment, and then embark upon a meaningful defense that will
alleviate the stress condition. The approach presented here
aims to define the distinction between ubiquitous and specific
stress response categories. Very few transcript profiling studies, which did not include the majority of the Arabidopsis
genes, have addressed specificity and crosstalk of different
stress treatments [1,3,4].
Control over gene expression is in part determined by motifs,
cis-elements, within the promoter sequence of regulated
genes. In plants, distinct motifs have been correlated with
responses to individual treatments, resulting in discovery of a
number of motifs related to stress responses and developmental or organ-specific regulation. Among these motifs,
those responding to light and osmotic and cold stress treatments have been analyzed most intensely [12,13]. Databases
dedicated to plant promoter motifs have been established,
/>
based on motif identification in single or, at most, a few genes
[14,15]. How their competence in regulating gene expression
is mirrored at the genome level has not been tested.
Here, we applied the fuzzy k-means clustering method [16] to
publicly available microarray data from the AtGenExpression
project to compare the response of Arabidopsis to a variety of
abiotic and biotic stresses that disturb homeostatic conditions [17]. The results revealed common as well as distinct
pathways that govern changes in the expression of induced
and repressed genes in response to various treatments. Based
on the collection of motifs in the Plant cis-acting Regulatory
DNA Elements (PLACE) database [14], clusters of coregulated genes were screened for over-represented cis-elements
within their promoters. In addition, gene expression profiles
identifying cell lineages in Arabidopsis roots were used to
correlate the cell type-specific response to various stresses in
the root [18,19]. Integration of information from previously
unconnected databases provided surprising insights about
genes and pathways that classify the evolutionarily conserved
cell-based common stress response, and the divergent pathways that organize abscisic acid (ABA)-dependent and ABAindependent reactions to stress in a tissue-specific manner.
Results and discussion
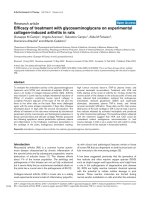
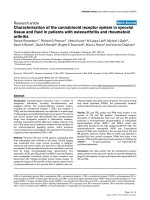
An analysis of the Arabidopsis abiotic and biotic transcriptome is presented in four sections (Figure 1). First, the overall
clustering pattern for 22,746 probes in response to different
environmental and chemical stress conditions was analyzed.
This was followed by analysis of a 'common stress transcriptome', which unites genes that respond to any deviation from
homeostasis. Then, an analysis of 5'-motifs defined promoter
structures - cis-elements - that are characteristic for individual clusters of stress-responsive genes, focusing on clusters
containing induced genes (2,715 genes in total) and on the few
large clusters (5,998 genes) containing stress-repressed
genes. Finally, cell-specific and tissue-specific responses to a
variety of stresses were determined by integrating the clusters
defining stress specificity with the gene expression map
established for the Arabidopsis root [19]. This analysis provided intersections between stress and tissue or cell
specificity.
Clustering of different stress response categories
The fuzzy k-means clustering method [16,20,21] was applied
to the probe set (22,746 in total) printed on Affymetrix Arabidopsis ATH1 chips, which corresponded to about 22,400
genes. In the following analysis, we treated each probe set as
a gene. The external conditions selected included treatments
with a variety of biotic and abiotic stresses included in AtGenExpress [17], as outlined in a previous analysis that focused
on a subset of salt-responsive genes [21]. Additionally
included were results for different light conditions and exposures of plants to chemicals and growth regulators such as tzeatin, tri-iodobenzoic acid, AgNO3, and cycloheximide. The
Genome Biology 2007, 8:R49
/>
Genome Biology 2007,
Root-specific
expression profile
Global gene expression profile
(22,746 genes; AtGenExpress)
Chemical treatments:
t-zeatin, AgNO 3 ,
tri-iodobenzoic acid,
cycloheximide
Fuzzy k-means clustering identifies
8,520 genes in 180 clusters (N0-N179)
cis-elements
scanning
Tissue- & cell lineage-specific
reactions to st resses in roots
Strategies to identify of Arabidopsis stress-regulated and tissue-regulated
Figure
genes 1
Strategies to identify of Arabidopsis stress-regulated and tissue-regulated
genes.
Genome Biology 2007, 8:R49
information
Several MAPK pathways, organized into signaling cascades,
are conserved in eukaryotic organism [23,24]. In Saccharomyces cerevisiae, for example, the high osmolarity glycerol
(HOG) signaling pathway is responsible for osmotic stress
interactions
MAPK pathways
refereed research
The majority of these 8,520 genes was concentrated in a few
large clusters. The most highly populated 15 clusters, each
including more than 100 genes, totaled 5,478 or more than
60% of all significantly clustered transcripts. The largest clusters, namely N0, N2, N5, N18, included 699, 1,206, 705, and
430 genes, respectively. ABA, which acts as an important signaling molecule under a variety of different stress conditions,
The 197 genes in cluster N12 (Figure 2) are induced by a broad
range of diverse stress conditions: cold, osmotic, salinity,
wounding, and biotic stresses (including treatments with elicitors). The 'limma' analysis indicated that approximately 80%
of these genes were significantly regulated under all treatment conditions, whereas the rest of the included genes were
marginally regulated in one (mostly the wounding treatment)
but significantly regulated in all other conditions (P < 0.01;
Table 1; Additional data file 5). They appear to represent a
common or universal stress response transcriptome because
most of these genes are conserved among plants, animals and
fungi, and are stress regulated in all organisms, with the
inclusion of a few genes related to the plant-specific hormones ABA and JA (Figure 3 and Table 1). Several Gene
Ontology (GO) categories were enriched among these genes:
GO:0009611 (response to wounding), GO:0009613
(response to pest, pathogen, or parasite), GO:0006970
(response to osmotic stress), GO:0009737 (response to ABA
stimulus), GO:0009651 (response to salt stress),
GO:0009723 (response to ethylene stimulus), GO:0009751
(response to salicylic acid stimulus), GO:0009753 (response
to JA stimulus), GO:0050832 (defense response to fungi),
GO:0006839 (mitochondrial transport), and GO:008270
(zinc ion binding). Signaling pathways related to mitogenactivated protein kinase (MAPK), calcium, reactive oxygen
species (ROS), phospholipids, apoptosis, and protein degradation were induced. Equally, part of this cluster of genes that
generally are upregulated by stress is functionally related to
vesicle transport and mitochondrial functions. N12 included
induced genes that had previously been identified as related
to or specific for biotic stresses, but these were also induced
by abiotic stresses, and vice versa. Past restrictions in the
scope of analyses, which typically focused on single treatment
conditions, and the resulting problem of annotation stringency did not compromise the fuzzy k-means clustering analysis. We discuss these universal stress response genes by
organizing them into different pathways (Figure 3).
deposited research
The 'limma' statistical program was applied to the Affymetrix
dataset to identify differentially regulated genes [22]. Of the
22,746 probe sets, 14,015 were differentially expressed in at
least one condition (P < 10-15). Among the 10,490 significant
genes included in the clustering analysis, 8,520 were differentially expressed and 1,970 were not significantly regulated.
This nonregulated category includes 879 (out of 884) and 119
(out of 131) genes from clusters N6 and N53, respectively.
Genes in cluster N6 were not regulated under most conditions, whereas genes in cluster N53 exhibited a very small
induction in osmotically-stressed roots only (see Additional
data file 4). The separation of clusters N6 and N53 reflects the
discriminative power of fuzzy k-means clustering and sensitivity in identifying even minute differences in expression
patterns. The remaining nonregulated genes were mainly
found in downregulated clusters. In the following analysis of
common stress responses and promoter motifs, we focus our
attention on the 8,520 differentially expressed genes.
The 'universal stress response transcriptome': cluster N12
reports
chemical treatments were included because we expected
them to add additional power of resolution to the analysis.
Considering the large number of genes to be analyzed, fuzzy
k-means clustering was conducted initially with a large centroid parameter (k = 320). Subsequently, 10,490 genes with
significant membership values emerged from the dataset,
which, with the cutoff set at a membership value of 0.035,
most parsimoniously assembled into 180 clusters. The composition of 28 clusters (N0 to N27) is shown in Figure 2 and
the entire set is included in the Additional data files 2 and 3.
was implicated in and induced the expression of genes in clusters N3, N9, N10, N12, N13 and N20, whereas genes in clusters N0, N11, N16, N19 and N28 did not respond to ABA
(Figure 2). Genes in clusters N1 and N8 were induced by light,
and those in cluster N1 were additionally repressed in
response to biotic stress treatments. Genes in cluster N27
were induced by jasmonic acid (JA) treatment, as well as by
salt and wounding stresses. Large clusters in which gene
expression was generally repressed by environmental
stresses included N2, N4, N5, N7, N15, and N18. All genes are
identified in the Additional data files.
reviews
Common stress
response genes;
(cluster N12)
Fuzzy k-means
clustering placed 12,360
genes into 19 clusters
Ma and Bohnert R49.3
comment
Stress treatments:
abiotic, biotic,
elicitors, light
& hormones
Volume 8, Issue 4, Article R49
R49.4 Genome Biology 2007,
Volume 8, Issue 4, Article R49
(a)
c
os
s
d
Ma and Bohnert
(b) (c) (d)(e)
ox
/>
(a)
w
c
os
s
d
(a)
(b) (c) (d)(e)
ox
c
w
0
8
9
10
3
11
4
12
5
13
6
15
(b) (c) (d)(e)
ox
w
14
7
d
17
2
s
16
1
os
18
19
20
21
27
28
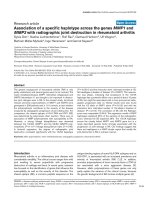
Clustering of genes in the Arabidopsis transcriptome
Figure 2
Clustering of genes in the Arabidopsis transcriptome. Out of 22,746 genes, 10,671 genes exhibited significant membership values in 180 clusters. The 17
most populated clusters include 7,039 genes (66% of total). Rows represent individual genes; columns (from left to right, as listed below) represent
treatment conditions. A total of 180 clusters emerged. Outlined is cluster 12 (216 genes) including genes that responded to all stress treatment conditions
(see Additional data files). (a) Time course experiments include cold (12 time points), osmotic (12), salt (12), drought (12), oxidative (12), and wounding
(14) treatments. (b) Hormone treatments include ABA (3), ACC (3) and MeJA (3). (c) Biotic stress treatments include bacteria-derived elicitors (12),
Pseudomonas syringae pt. tomato (Pst) DC300 (3), Pst avrRPM1 (3), Pst DC3000hrcC- (3), P. syringae pv. phaseolicola (3), Erysyphe oromoti (7), Phytophtera
infestans (3), P. syringae ES4325 avrRPT2 (5), and P. syingae ES4325 (5). (d) Different light conditions (14). (e) Chemical treatments included t-zeatin, triiodobenzoic acid, AgNO3, and cycloheximide.
sensing [25,26]. The Arabidopsis AtHK1, MEK1, MPK4, and
MPK6 can complement yeast deletion mutants of the HOG
pathways. Other examples of plant MAPKs are alfalfa stressinduced MAPK (SIMK), tobacco salicylic acid-induced protein kinase (SIPK), wound-induced protein kinase (WIPK),
and Nicotiana Fus-3-like kinase6 (Ntf6).
Among common genes that are upregulated by stress, several
MAPK components were identified: MPK5, MKK9, and
MAPKKK14. The MAPK pathway has been suggested to be
involved in ethylene signaling [27-29]. Included among ubiquitous stress-regulated genes is also ACS6, encoding the ratelimiting enzyme of ethylene biosynthesis and a substrate for
MPK6 [30], together with six ERF/AP2 transcription factors
(AtERF). This implicates the ethylene signaling-mediated
engagement of a subset of the MAPK family as a component
of the common stress response.
However, the ethylene response transcriptome is not strictly
clustered in the stress transcriptome, notwithstanding its
importance in developmental processes such as fruit ripening. Incorporating the results from a study that measured
transcript changes in Arabidopsis Col-0 wild-type [31] into
the cluster structure obtained by fuzzy k-means, the significantly ethylene-regulated genes identified in the study were
located in a large number of different clusters.
Genome Biology 2007, 8:R49
/>
Genome Biology 2007,
Volume 8, Issue 4, Article R49
Ma and Bohnert R49.5
Table 1
Selected common stress response genes
AGI
Annotation
Membership value
257053_at
At3g15210
ATERF-4
0.273508
261470_at
At1g28370
ERF/AP2 transcription factor
0.162002
248799_at
At5g47230
ATERF-5
0.086731
252214_at*
At3g50260
ERF/AP2 transcription factor
comment
Affymetrix probe
0.083494
At4g17490
ATERF-6
0.063712
248448_at
At5g51190
ERF/AP2 transcription factor
0.044611
254926_at
At4g11280
ACS6
0.109595
266832_at
At2g30040
MAPKKK14
0.054407
245731_at
At1g73500
ATMKK9
0.165439
254924_at
At4g11330
ATMPK5
0.060749
At5g67250
SKIP2
0.052666
255872_at
At2g30360
CIPK11
0.093386
261648_at
At1g27730
ZAT10
0.458157
257022_at
At3g19580
AZF2
0.194905
248833_at
At5g47120
Bax inhibitor-1, AtBI-1
0.048683
At5g16830
SYP21
0.089816
254422_at
At4g21560
VPS28 family protein
0.081642
At1g09070
SRC2
0.119115
256238_at
At3g12400
tumour susceptibility gene 101 (TSG101) family protein
0.051677
265375_at
At2g06530
SNF7 family protein
0.125775
262367_at*
At1g73030
SNF7 family protein
0.037115
247204_at
At5g64990
Ras-related GTP-binding protein, putative
0.048757
260915_at
At1g02660
lipase class 3 family protein
0.100258
254707_at
At4g18010
inositol polyphosphate 5-phosphatase II (IP5PII)
0.056767
251336_at
At3g61190
BON1-associated protein 1 (BAP1)
0.152337
262540_at
At1g34260
phosphatidylinositol-4-phosphate 5-kinase family protein
0.054866
247431_at*
At5g62520
SRO5, similarity to RCD1 but without the WWE domain
0.048374
247655_at
At5g59820
zinc finger protein ZAT12
0.286685
At1g76650
calcium-binding EF hand family protein
0.09479
266371_at
At2g41410
putative calmodulin
0.072498
At3g10300
calcium-binding EF hand family protein
0.06951
247426_at
At5g62570
calmodulin-binding protein
0.068879
247137_at
At5g66210
CPK28, calcium-dependent protein kinase
0.067785
251636_at
At3g57530
CPK32, calcium-dependent protein kinase
0.06706
253284_at
At4g34150
C2 domain-containing protein
0.056923
253915_at
At4g27280
calcium-binding EF hand family protein
0.051136
265460_at
At2g46600
calcium-binding protein, putative
0.038761
249928_at
At5g22250
similar CCR4-NOT transcription complex, subunit 7, CAF1
0.136686
Genome Biology 2007, 8:R49
information
259137_at
interactions
259879_at*
refereed research
264655_at
deposited research
246453_at
reports
247033_at
reviews
245250_at
R49.6 Genome Biology 2007,
Volume 8, Issue 4, Article R49
Ma and Bohnert
/>
Table 1 (Continued)
Selected common stress response genes
248146_at
At5g54940
eukaryotic translation initiation factor SUI1
0.090271
256356_s_at
At1g66500
similar to Pre-mRNA cleavage complex II protein Pcf11
0.102701
255742_at
At1g25560
AP2 domain-containing transcription factor
0.039118
245247_at
At4g17230
scarecrow-like transcription factor 13, SCL13
0.251161
246987_at
At5g67300
myb family transcription factor
0.096819
265359_at
At2g16720
myb family transcription factor, MYB7
0.068213
246253_at*
At4g37260
myb family transcription factor, MYB73
0.046837
253219_at
At4g34990
myb family transcription factor, MYB32
0.03538
247351_at
At5g63790
no apical meristem (NAM) family protein
0.159799
252278_at
At3g49530
no apical meristem (NAM) family protein
0.127213
249746_at
At5g24590
turnip crinkle virus-interacting protein, with NAM domain
0.087334
261892_at
At1g80840
WRKY family transcription factor, WRKY40
0.186156
267028_at
At2g38470
WRKY family transcription factor, WRKY33
0.122218
267246_at
At2g30250
WRKY family transcription factor, WRKY25
0.069374
253535_at*
At4g31550
WRKY family transcription factor, WRKY11
0.039245
253485_at
At4g31800
WRKY family transcription factor, WRKY18
0.037623
247509_at
At5g62020
Heat Stress Transcription Factor, At-HSFB2A
0.110848
254592_at*
At4g18880
Heat Stress Transcription Factor, At-HSFA4A
0.084085
259992_at*
At1g67970
Heat Stress Transcription Factor, At-HSFA8
0.069577
255259_at
At4g05020
NADH dehydrogenase-related
0.089839
254120_at
At4g24570
mitochondrial substrate carrier family protein
0.111919
250335_at
At5g11650
hydrolase, alpha/beta fold family protein
0.111254
252131_at
At3g50930
AAA-type ATPase family protein
0.105058
250062_at
At5g17760
AAA-type ATPase family protein
0.052915
265450_at*
At2g46620
AAA-type ATPase family protein
0.05194
253323_at
At4g33920
PP2c familiy protein
0.10342
253824_at
At4g27940
mitochondrial substrate carrier family protein
0.075698
246870_at
At5g26030
ferrochelatase I
0.089846
264000_at
At2g22500
mitochondrial substrate carrier family protein
0.308636
246779_at
At5g27520
mitochondrial substrate carrier family protein
0.077536
251757_at
At3g55640
mitochondrial substrate carrier family protein
0.040783
260345_at*
At1g69270
leucine-reich repreat family protein, RPK1
0.061161
248964_at
At5g45340
P450 CYP707A3
0.050208
253203_at
At4g34710
arginine decarboxylase, ADC2
0.099102
258207_at
At3g14050
RelA/Spot protein, RSH2
0.177302
250676_at
At5g06320
harpin-induced family protein, NHL3
0.119862
259826_at
At1g29340
PUB17, an E3 ubiquitin ligase
0.069476
267411_at
At2g34930
disease resistance family protein, similar to Cf-2.1
0.043403
245986_at*
At5g13160
protein kinase PBS1
0.06912
Included are genes from the common stress response cluster N12. Membership indicates the probe membership value associated with centroid N12. Asterisks identify genes
that are significantly regulated in all but one treatment condition (see results).
Genome Biology 2007, 8:R49
/>
Genome Biology 2007,
ABA-Related
Wounding
Cold
NHL3
(annotated
as biotic)
Mitochondria
Metabolism
BCS1-like ATPase
Carrier protein
(ANT- or MTM-like)
NADPH Dehydrogenase
ADC2
ROS
SRO5
PI-Related
Protein cleavage
reviews
IP5PII
PI4P5K
BAP1
Pub17, PBS1
Zinc-finger proteins
Salinity
Ma and Bohnert R49.7
comment
PRK1
CYP707A3
Volume 8, Issue 4, Article R49
MAPK
Osmotic
Elicitors
MAPKKK14
MKK9
MPK5
ACS
AtERF
Snf1/SnRK
CIPK
SKIP2
ZAT10
Transcription
AZF2
Vesicle transport
machinery
CAF1-homologs
PCF11-homologs
SUI
Biotic
SYP21, VPS28
Tsg101, SRC
Snf7-related
reports
Vacuole
Chemical
Transcription factors
BI-1
Stringent response
Ca2+ - related
Calmodulins, Ca
2+
RSH2
-binding, CIPK
Snf1/AMPK/SnRK
N12 as well, suggesting functions that are specific for particular stress conditions (data not shown).
Bax inhibitor 1: endoplasmic reticulum stress
Genome Biology 2007, 8:R49
information
The Bax-inhibitor 1 (BI-1) is an endoplasmic reticulum (ER)
protein that suppresses cell death induced by ER stress in
both animal and plant cells. It can inhibit the activation of Bax
and its translocation to mitochondria, and suppresses the
activation of caspase, and functions in reducing calcium
release from the ER [36]. In Arabidopsis, Bax over-expression causes ROS accumulation and cell death, and BI-1 attenuates the cell death effect without affecting production of ROS
[37,38]. It alleviated cell death caused by biotic and abiotic
stresses [39]. BI-1 (At5g47120), one of three genes in Arabidopsis with this sequence signature, was induced by several
other stresses in a specific manner as well, and appears to
represent a signature gene and protein of the common stress
response cluster.
interactions
The yeast Snf1 protein kinase and the mammalian AMP-activated protein kinase act as metabolic sensors that monitor
cellular AMP and ATP levels. Activation increases the
ATP:AMP ratio. Snf4 is part of the Snf1 protein kinase complex. In higher plants, they are involved in response to environmental or nutritional stress. Related common stressinduced genes were CIPK11 (encoding a Snf1-related protein
kinase that is similar to SOS2, a protein kinase that is
involved in plant salinity stress responses) [32], SKIP2 (a
conserved SCF ubiquitin ligase subunit that interacts with
SnRKs), and AZF2 and ZAT10 (C2H2 zinc finger proteins)
[33]. Both AZF2 and ZAT10 suppressed the Snf4 deficiency in
yeast and function as transcription repressors in Arabidopsis
[33,34]. ZAT10 can activate salt stress tolerance, controlled in
yeast by MSN2 and MSN4 factors, and ZAT10 can repress the
expression of the plant stress gene RD29A [35]. Several Snf1related genes appeared in stress-induced clusters other than
refereed research
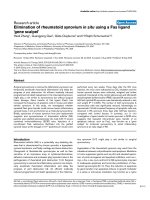
Figure
Diagram3of common stress response pathway genes
Diagram of common stress response pathway genes. Representation of genes with known functions in clusters that respond to most stresses in cluster
N12. Genes are identified by name or Gene Ontology assignment (see Additional data file 5).
deposited research
ER
stress
HSF, MYB, NAM
WRKY
R49.8 Genome Biology 2007,
Volume 8, Issue 4, Article R49
Ma and Bohnert
Vesicle transport
Although mechanisms of vesicle transport have been studied
extensively, little is known about regulation in response to
stress. A plant vesicle-related protein, AtVAMP, when ectopically expressed, can suppress Bax-induced apoptosis in
yeast, possibly by improving membrane repair [40]. The
over-expression of AtRab7, a gene that is involved in regulation of vesicle trafficking, increased endocytosis in roots, as
well as salt and osmotic stress tolerance [41]. This indicates
the importance of regulated vesicle trafficking for acquisition
of stress tolerance.
Several genes related to trafficking from endosomes to central
vacuoles were placed into N12. They are SYP21, Vps28related, Tsg101-related, SRC2, Ras-related GTPase, and
genes for two Snf7 family proteins. In roots, the Tsg101related and Vps28-related genes, as well as SYP21 and one
gene encoding a Snf7-like protein are specifically expressed in
the endodermis of the root hair zone.
Phospholipid signaling
A multitude of signaling molecules is generated from membrane phospholipids. Their involvement in osmotic stress
responses has been demonstrated. Several related genes are
induced, such as encoding inositol polyphosphate 5-phosphatase II, FYVE domain-containing phosphatidylinositol-4phosphate 5-kinase (PI4P5K), and lipase class 3 family proteins. PI4P5K leads to the synthesis of PI4,5P2. Mutations in
the offsetting phosphatase gene, SAC9, lead to over-accumulation of PI4,5P2 and constitutive expression of stressresponse pathways [42,43]. The product of the BAP1 gene,
which is also upregulated, interacts with BON1, a protein with
two C2 domains that binds to phospholipids. Together, BAP1
and BON1 control plant growth homeostasis [44].
Reactive oxygen species
ROS have been associated with stress sensing and signaling,
but have emerged more recently as important, general signals
[45-47]. Irrespective of their ubiquitous presence, ROS that
derive from different stimuli appear to be recognized as specific, indicating that a number of different signal mediators
must exist. We suggest that cluster 12 identifies the evolutionarily conserved set of these genes. SRO5 is a gene that controls ROS in plants, which is upregulated by various stresses.
SRO5 transcript expression overlaps partially with that of
P5CDH mRNA. The induction of SRO5 leads to production of
a 24-nucleotide nat-siRNA that guides cleavage of P5CDH
mRNA, resulting in regulated proline levels [48]. Additionally, ZAT12, and possibly ZAT10 of the Snf1 pathway, also
participate in ROS signaling transduction [46].
/>
and three calcium-dependent kinases. These calcium-related
genes cannot be organized into a pathway-like structure, in
part because of the lack of detailed experimental evidence and
also based on the multiplicity of functions that are channeled
through calcium-binding proteins.
The transcription machinery and transcription factors
CCR4 and CCR4-associated factor 1 (CAF1) are critical for
mRNA turnover in yeast [49]. Pcf11 is an mRNA 3'-end
processing factor and binds the carboxyl-terminal domain of
the largest subunit of RNA polymerase II [50]. Both CAF1 and
Pcf11 have their Arabidopsis homologs upregulated by different stresses, indicating a role for control over mRNA processing and degradation. Another upregulated gene is the
eukaryotic translation initiation factor SUI1. Other examples
are AZF2 and ZAT10, which encode transcription repressors.
Stress-related transcription factors were also among the common stress response genes, including five WRKY family
members, four Myb, three HSF, three NAM and two AP2, and
the transcription factor SCL13. Included are WRKY18 and
WRKY40, which physically interact with both overlapping
and antagonistic roles in pathogen responses [51]. WRKY25
and WRKY33 are substrates of MKS1, which itself is a substrate of MPK4 and regulates plant defense reactions [52].
WRKY33 is also required for resistance to necrotrophic fungal pathogens [53]. WRKY11 interacts with calmodulin and
acts as a negative regulator of basal resistance in Arabidopsis
[54]. SCL13 has been shown to function in light signaling [55].
These WRKYs function in resistance to necrotrophic but not
biotrophic pathogens, whereas necrotrophic damage is more
closely related to the physical damage caused by abiotic
stresses, as also reflected in the cluster structures. Little information is available for other transcription factors in cluster
N12, although several isoforms of Myb, NAM, HSF, and AP2
not included in N12 have been associated before with stress
response pathways.
Mitochondrial functions
Among the genes upregulated by many stress treatments, several are localized to mitochondria. They are three BCS1-like
ATPases (which could function as chaperones, whose yeast
homologs are required for cytochrome bc[1] complex assembly), two DIC1-like, one ANT1-like, one MTM1-like, and one
other mitochondrial substrate carrier family protein. Furthermore, a ferrochelatase I gene, an NADH dehydrogenaserelated gene, and a PP2C are part of this group. Also upregulated here was the Bax-inhibitor 1 gene. To appreciate their
precise functions in plants, more studies are required.
ABA-related: RPK1 and CYP707A3
Calcium
Multiple calcium-related functions are induced by stresses.
Among them is a SOS2-like protein kinase, namely CIPK11.
However, little is known about the other genes in this group,
including two calmodulins, three calcium-binding proteins,
Among the common stress response genes were two ABArelated genes, RPK1 and CYP707A3. RPK1 encodes a leucinerich repeat receptor-like kinase 1, a membrane-bound regulator of ABA early signaling [56]. The rpk1 mutant exhibited
decreased sensitivity to ABA, and over-expression resulted in
Genome Biology 2007, 8:R49
/>
Genome Biology 2007,
ADC2, a rate-limiting enzyme in polyamine (PA) biosynthesis
RelA/SpoT, RSH2, and the 'stringent response' in bacteria
NHL3, PBS1, and PUB17
We analyzed cis-elements, which are conserved motifs in the
5'-region of genes with a key role in assembling the transcription machinery. Extracted from the genome sequence were
1,000 base pairs upstream of the translation initiation codon,
and genes in each cluster were scanned for motifs listed in the
PLACE database [14]. The occurrence of these motifs was
compared with their frequency among all promoters in the
genome. A P value was then calculated for every motif and
cluster combination, based on the hypergeometric distribution [69]. We considered motifs with P values lower than 10-4
to be significantly over-represented. Listed in Table 2, and
justified below, are motifs that have been identified.
The WB-BOX motif TTTGACT was identified in clusters N0,
N11, and N19. Genes in clusters N0 and N19 were generally
induced by abiotic stresses, whereas genes in cluster N11 were
upregulated markedly in roots by salt treatment. The WBBOX represents a binding site for WRKY transcription factors
Genome Biology 2007, 8:R49
information
Genes in upregulated clusters
interactions
An additional 120 genes are included in the common stress
response cluster (ST3). In part, their functions are known by
specific activities (for example, trehalose-6-phosphate phosphatase), whereas most are identified only by domain identifiers (for example, protease-associated or thioredoxin familyrelated), or their functions are not clear or completely
unknown. The group included transcripts for 19 zinc-finger
family proteins, five protein kinases, four protein phosphatases, a number of glycosyl hydrolases, thioredoxins,
cytochromes P450, and hormone-responsive functions,
mostly annotated according to similarity criteria, and 40
expressed proteins without any annotation. Among the genes
that lack annotation, the majority is most strongly induced by
Other clusters (Figure 2; ST1) separated the data into distinct
groups, with groups of upregulated or downregulated genes
with various groupings indicating dependence or independence of the action of hormones (ABA, ethylene, JA).
Generally, all clusters included many genes with unknown
functions but also a variable number of genes for which a relationship with a specific stress has been documented. One task
was to analyze correlations between stress clusters and the
presence and nature of regulatory motifs in their promoters.
refereed research
Genes with unknown or unclear functions
Identification and analysis of regulatory motifs
deposited research
These genes function in resistance to the bacterial pathogen
Pseudomonas syringae pv. tomato DC3000 carrying avirulence proteins [51,62,63], and they - as identified here - were
also induced by various abiotic stresses. Interestingly, NHL3
over-expression in Arabidopsis enhances resistance to the
virulent Pseudomonas syringae pv. tomato DC3000, without
an increase in PR gene expression or H2O2 accumulation [64].
PBS1 and RPS5 are required for avrPphB mediated Pseudomonas syringae resistance in Arabidopsis. AvrPphB can
proteolytically cleave PBS1, which is required for RPS5-mediated resistance [65]. PUB17 is a U-box ARMADILLO repeat
E3-ligase, which regulates cell death and defense [66].
Another disease resistance family protein, similar to Cf-2.1
(At2g34930), is also upregulated by various stresses. Its null
mutant was particularly susceptible to fungus attack [67]. The
inclusion of these genes in cluster N12 suggests their function
in common mechanisms that counter both abiotic and biotic
stresses.
The high correlation of genes in cluster N12 with experimentally verified or alleged functions in a wide variety of stress
conditions in species across all kingdoms suggests that the
functions identified by this cluster categorize the basic stress
response transcriptome (Figure 3). By their nature, these
functions appear to identify ubiquitous cellular stress defense
programs in all organisms, whereas pathways that integrate
stress responses at the organ or organism levels may be based
on programs that diverged during evolution. Conceivably,
reverse genetics will determine the functions of little
understood and completely unknown genes in N12, and provide a clear separation of these genes from pathways that are
specific to individual stress conditions. The common stress
response genes epitomize components of crosstalk between
biotic and abiotic stress response mechanisms by identifying
genes such as WRKY transcription factors, NHL3, and
PUB17. Indeed, the Arabidopsis mutant bos1 exhibited compromised resistance to the pathogen Botrytis cinerea and
reduced tolerance to drought, high salinity, and oxidative
stress [68].
reports
The stringent response is crucial for stress adaptation in bacteria, mediated by the production of the nucleotide guanosine-3',5'-(bis-)pyrophosphate (ppGpp). RelA and SpoT
encode bacterial enzymes for ppGpp synthesis. RSH is the
higher plant homolog of this RelA/SpoT protein [60,61].
conditions that affect redox homeostasis and ROS responses,
in particular treatments with ozone, H3BO3, H2O2, AgNO3,
hypoxia, and triiodobenzoic acid (an inhibitor of polar auxin
transport; Genevestigator dataset [8]).
reviews
ADC genes are essential for polyamine (PA) production.
Over-expression of ADC2 led to GA-deficient plants and accumulation of putrescine, a phenotype reversed by GA3 [58].
The null mutant adc2-1 was sensitive to salt stress, but could
be rescued by external putrescine [59]. ADC2 is among the
common stress response genes.
Ma and Bohnert R49.9
comment
hypersensitivity. CYP707A3 encodes a cytochrome P450 protein catalyzing ABA 8'-hydroxylation and catabolism. Its
knockout mutant exhibited exaggerated ABA-inducible gene
expression and enhanced drought tolerance, whereas overexpression was associated with growth retardation by ABA
and increased transpiration [57].
Volume 8, Issue 4, Article R49
R49.10 Genome Biology 2007,
Volume 8, Issue 4, Article R49
Ma and Bohnert
/>
Table 2
Promoter motifs in different clusters
Motif
Cluster No.
Name
Sequence
WBBOXPCWRKY1
TTTGACT
Distribution
P value
Genome
Cluster
N0
8004/31128
301/699
2.06 × e-23
ACGCG*
N0
6880/31128
230/699
3.40 × e-11
HSF
RGAAnnTTC
N0
8380/31128
260/699
1.95 × e-09
ACGTABREMOTIFA2OSEM
ACGTGKC
N1
4552/31128
118/343
5.43 × e-20
ABREATCONSENSUS
YACGTGGC
N1
1470/31128
56/343
8.08 × e-16
IBOXCORENT
GATAAGR
N1
8237/31128
134/343
2.43 × e-07
SORLIP2AT
GGGCC
N1
10199/31128
145/343
1.44 × e-04
RACCACAR*
N1
4187/31128
74/343
2.47 × e-05
IBOXCORENT
GATAAGR
N2
8237/31128
414/1206
9.99 × e-10
SORLIP2AT
GGGCC
N2
10199/31128
495/1206
1.06 × e-09
UP1ATMSD
GGCCCAWWW
N2
4460/31128
242/1206
3.53 × e-08
SORLIP5AT
GAGTGAG
N2
3015/31128
169/1206
9.47 × e-07
ACGTABREMOTIFA2OSEM
ACGTGKC
N3
4552/31128
98/154
1.09 × e-43
ABRELATERD1
ACGTG
N3
16971/31128
139/154
4.99 × e-22
BOXIIPCCHS
ACGTGGC
N3
2367/31128
51/154
5.97 × e-20
ZDNAFORMINGATCAB1
ATACGTGT
N3
771/31128
20/154
1.99 × e-09
T/GBOXATPIN2
AACGTG
N3
7495/31128
66/154
2.36 × e-07
DRECRTCOREAT
RCCGAC
N3
7166/31128
62/154
1.37 × e-06
SORLIP1AT
GCCAC
N3
15027/31128
101/154
1.11 × e-05
UP1ATMSD
GGCCCAWWW
N5
4460/31128
167/705
2.79 × e-11
RRCCGTTA*
N5
1809/31128
88/705
2.31 × e-11
E2F1OSPCNA
GCGGGAAA
N5
676/31128
33/705
4.69 × e-05
E2FANTRNR
TTTCCCGC
N5
676/31128
33/705
4.69 × e-05
E2FCONSENSUS
WTTSSCSS
N5
8895/31128
237/705
1.98 × e-06
Genome Biology 2007, 8:R49
/>
Genome Biology 2007,
Volume 8, Issue 4, Article R49
Ma and Bohnert R49.11
Table 2 (Continued)
Promoter motifs in different clusters
4187/31128
25/89
2.13 × e-04
DRECRTCOREAT
RCCGAC
N9
7166/31128
74/96
5.80 × e-29
ACGTABREMOTIFA2OSEM
ACGTGKC
N9
4552/31128
45/96
5.55 × e-14
ACGTABREMOTIFA2OSEM
ACGTGKC
N10
4552/31128
109/343
8.19 × e-16
TGACGTVMAMY
TGACGT
N10
6796/31128
109/343
1.28 × e-05
ABREATRD22
RYACGTGGYR
N10
747/31128
22/343
3.28 × e-05
ACGCG*
N11
6880/31128
122/279
7.90 × e-16
ACGTABREMOTIFA2OSEM
ACGTGKC
N12
4552/31128
67/197
8.52 × e-12
DRECRTCOREAT
RCCGAC
N12
7166/31128
73/197
6.47 × e-06
ELRECOREPCRP1
TTGACC
N12
11015/31128
97/197
4.57 × e-05
ACGTABREMOTIFA2OSEM
ACGTGKC
N13
4552/31128
77/149
2.96 × e-26
ZDNAFORMINGATCAB1
ATACGTGT
N13
771/31128
13/149
9.60 × e-05
UP2ATMSD
AAACCCTA
N14
4947/31128
137/275
5.56 × e-39
UP1ATMSD
GGCCCAWWW
N14
4460/31128
82/275
3.53 × e-11
SITEIIATCYTC
TGGGCY
N14
12341/31128
164/275
1.79 × e-11
MYCATERD1
CATGTG
N15
11214/31128
89/171
1.36 × e-05
SORLREP3AT
TGTATATAT
N15
3065/31128
33/171
1.34 × e-04
UP1ATMSD
GGCCCAWWW
N18
4460/31128
193/430
2.38 × e-52
E2FCONSENSUS
WTTSSCSS
N18
8895/31128
160/430
6.74 × e-05
RnGTGGGC*
N18
2046/31128
51/430
3.92 × e-05
ELRECOREPCRP1
TTGACC
N19
11015/31128
112/210
8.12 × e-08
ACGTABREMOTIFA2OSEM
ACGTGKC
N20
4552/31128
43/91
1.40 × e-13
LRENPCABE
ACGTGGCA
N20
1122/31128
12/91
1.07 × e-04
Motifs are according to the PLACE database [14]. *Motifs identified from a study in mammalian systems [89]. R, A or G; W, A or T; S, C or G; K, G or T; Y, C or T; n, any
nucleotide.
Genome Biology 2007, 8:R49
information
N8
interactions
RACCACAR*
refereed research
5.09 × e-07
deposited research
32/89
reports
4552/31128
reviews
N8
comment
ACGTGKC
ACGTABREMOTIFA2OSEM
R49.12 Genome Biology 2007,
Volume 8, Issue 4, Article R49
Ma and Bohnert
[70], which have 12, 4, and 5 members in clusters N0, N11,
and N19, respectively. Among other clusters, only N12
included a number of WRKY factors (five in total). It seems
that WRKYs correlate well with pathogen response activity.
Genes in cluster N0 were also induced by osmotic and ionic
stresses, and the additional HSF motif (heat shock factor
binding) (A|G)GAANNTTC was over-represented in this cluster (with N representing any nucleotide). Also, two HSF transcription factors are included in this cluster.
Genes in clusters N1 and N8 were responsive to light treatment. The ABRE motif ACGTG(G|T)C was identified in both
clusters, together with an unknown motif, namely
(A|G)ACCACA(A|G). ACGTG(G|T)C is similar to the G-Box
motif that mediates light signaling [12]. Also identified in
cluster N1 was the I-Box motif GATAAG(A|G).
Clusters N3, N9, N10, N12, N13, and N20 were induced by
ABA treatment to variable degrees. The ABRE motif was overrepresented in these clusters, but only cluster N3 contained
the ABRE-binding proteins AREB1 and AREB2 [13]. The DRE
motif (A|G)CCGAC was identified in the clusters N3, N9, and
N12, which is in agreement with the strong induction by cold
stress of genes in these clusters [13]. Within these three clusters, four, two, and one DRE-binding (DREB) transcription
factors were included, respectively. Although cluster N11
included seven DREB genes, the DRE motif was not over-represented in this cluster. Cluster N11 also contains an additional nine ERF/AP2 transcription factors. Clusters N3 and
N9 additionally exhibited the EVENINGAT motif
(AAAATATCT), which functions in the circadian control of
gene expression [71]. Further identified were the P1BS motif
(GNATATNC) and an unknown, hypothetical motif
(A|G)(C|T)TAA(A|T)NNNTGA(C|T) in cluster N10, and the
2S-SEED-PROTBANAPA motif (CAAACAC) in cluster N13.
Over-representation of the well known ABRE motif in multiple clusters of genes that respond to either light or ABA treatment points toward the existence of additional motifs [13].
These could be the I-Box and DRE motifs that are over-represented in these clusters, and other putatively cis-acting motifs
are suggested by the analysis. More likely, however, is the
presence of transcriptional control mechanisms that act on
cis-element binding proteins rather than on the promoter
elements.
Genes in downregulated clusters
Motifs of prevalence similar to those in upregulated genes
appear to be largely absent from the stress-repressed genes in
clusters N4, N7, and N17. For cluster N15 genes, strongly
downregulated by osmotic and high salinity stresses in roots,
the MYCATERD1 motif (CATGTG) and the SORLRP3AT
motif (TGTATATAT) were identified. Clusters N2, N5, N14,
and N18 included many genes related to general gene expression functions, protein synthesis, cell organization, and
metabolism. Several known motifs were enriched in these
/>
clusters. The UP1ATMSD motif GGCCCA(A|T)(A|T)(A|T),
which is related to axillary bud growth [72], was over-represented in all four clusters. Additionally, over-represented in
genes in cluster N2 were the I-Box motif GATAAG(A|G) and
the SORLIP5AT motif GAGTGAG [73], which appear to be
connected to the expression of genes in metabolic functions.
Cluster N5 showed the E2F1OSPCNA motif GCGGGAAA, the
E2FANTRNR motif TTTCCCGC, and the E2FCONSENSUS
motif (A|T)TT(G|C)C(G|C)(G|C). These motifs are typically
associated with genes that are involved in cell cycle
progression and cell division [74-76]. At lower frequency,
clusters 14 and 18 exhibited similar motif combinations
(Table 2).
In general, fuzzy k-means clustering applied to 5'-regulatory
sequences confirmed known motifs in the major stressresponding clusters, whereas different clusters shared
subsets of these motifs. Additional, secondary motifs between
and within large clusters are suggested (Figure 4b, Table 2),
but attempts to distinguish between clusters that shared similar expression patterns through motif analyses alone proved
inconclusive. Different approaches will be necessary to reveal
how combinations of motifs may control gene expression.
Methods for identifying such combinations are emerging
[77].
Integrating AtGenExpress and Arabidopsis root
transcript profiles
Very few data are available to date that correlate stressrelated transcript changes and cell-specific or tissue-specific
gene expression. We focused on the tissue-specific response
to stress in detail by including a dataset in which cell typespecific and growth stage-specific gene expression in Arabidopsis roots was recorded [19]. Among the probes printed on
the Affymetrix chip, 12,360 were considered present in at
least one of the three developmental stages of the root. These
stages identify genes in cell division and early root expansion
growth (stage 1), the region of maximum elongation growth
(stage 2), and genes in the root maturation region (stage 3).
Also recorded was the gene expression pattern in different
cell lineages: the lateral root cap, epidermis, cortex, endodermis, and in the vasculature (stele). Here, intensity values were
compared for each gene in the three developmental stages
and in each cell lineage against its average intensity across all
stages or cell lineages, and the difference in expression provided a measure of cell specificity and stage specificity for
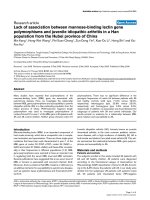
each gene. Fuzzy-k means clustering revealed a clear pattern
for the 12,360 genes in the root dataset, which separated into
19 clusters (T0 to T18; Figure 5). For example, genes in cluster
T2 were more highly expressed in the cortex, endodermis,
and stele during developmental stage 3, identifying mature
regions of the root. In contrast, genes in cluster T3 were
highly expressed during stage 1 development, and present at
lower level in stage 3 regions of the root and in the endodermis. Cluster T4 shows genes with strong expression in the
stele during stage 3.
Genome Biology 2007, 8:R49
c
d e
I-Box
b
DRE
8
DRE
3
9
12
Light
Stress down-regulated genes in roots
information
Genome Biology 2007, 8:R49
interactions
Three different regulatory patterns for downregulated genes
emerged. First, the stress clusters N14 and N18 included
mainly genes related to the key machineries of gene expression and protein synthesis, most of which organized in tissue
cluster T3 (stage 1 specific) and T7 (stages 1 and 2). Cluster
N18 includes genes that mainly function in protein synthesis:
more than 190 ribosomal proteins, 5 tRNA synthetases, 13
translation initiation/elongation proteins, 10 chaperonin
proteins, and a few genes related to lysine or arginine synthesis. Also included in N18 were DNA replication licensing factors, nucleosome assembly proteins, histones H2A and H3,
small nuclear ribonucleoproteins, and signaling G proteins.
Several GO categories are enriched in cluster N18:
GO:0042254 (ribosome biogenesis and assembly),
GO:0043037 (translation), GO:0015450 (protein translocase
activity),
GO:0046112
(nucleobase
biosynthesis),
GO:0006333 (chromatin assembly), and GO:0006525
(arginine metabolism). In contrast, cluster N14 collected
refereed research
Figure 4 or cluster-specific cis-elements
Conserved
Conserved or cluster-specific cis-elements. (a) Motifs identified in clusters N1, N8, N3, N9, N10, N12, and N13. These clusters were induced by light or
ABA. A common motif ABRE united genes within these clusters. Additional motifs that distinguish genes in individual clusters are included (I-Box or DRE).
See Table 2 for identified motifs. (b) 5'-regulatory motifs identified from clusters N0 and N19. The WRKY motif was identified in both clusters, whereas
the HSF motif was present only in cluster N0.
deposited research
13
ABA
Among the 12,360 genes recognized in roots, 5,963 exhibited
significant membership values in the stress expression profiles, and these genes were further analyzed. The intersections
between tissue and stress clusters are shown in Table 3,
revealing specific reactions to different stress conditions in
distinct cell lineages and developmental stages of the Arabidopsis root. The nature of the genes at the intersection
between cell specificity/development in roots and stresses
(Table 3) is detailed in Additional data file 9. In the following
discussion, we address stress-regulated genes within the
context of their expression in a developmental and cell-specific context. Examples highlight root-specific genes that are
downregulated by abiotic stress and that are highly expressed
in root cap and epidermis of stage 1 roots under optimal conditions (Figure 6), and genes that are upregulated by stress
and that, under nonstress conditions, are highly expressed in
the vasculature (stele), endodermis, and cortex in stage 3
roots (Figure 7).
reports
10
Secondary motif – cluster-specific
I-Box
1
reviews
19
a
Ma and Bohnert R49.13
DRE
HS-TF
(A/G)GAAnnTC
0
Volume 8, Issue 4, Article R49
comment
HS
(b)
Biotic
stresses
WRKY-TF (A/G)GTCAA(A/C)
(a)
Genome Biology 2007,
Common motif - ACGTG(G|T)C - (G-box: Light & ABRE: ABA)
/>
/>
Lat. root cap
Epidermis
Cortex
Endodermis
Stele
Stage 1
Stage 2
Stage 3
Ma and Bohnert
Lat. root cap
Epidermis
Cortex
Endodermis
Stele
Stage 1
Stage 2
Stage 3
Volume 8, Issue 4, Article R49
Lat. root cap
Epidermis
Cortex
Endodermis
Stele
Stage 1
Stage 2
Stage 3
R49.14 Genome Biology 2007,
T0
T7
T13
T1
T8
T14
T2
T9
T15
T3
T10
T16
T4
T11
T17
T5
T12
T18
T6
Figure 5
Tissue-specific characteristics of abiotic stress-regulated transcripts
Tissue-specific characteristics of abiotic stress-regulated transcripts. The expression of 12,360 transcripts in different tissues, cell lineages, and at three
developmental stages in Arabidopsis root [19], separated into 19 clusters.
genes mainly related to transcription, such as 12 DEAD/
DEAH box helicases and 11 polymerases (or similar to
polymerase functions), with a few genes involved in protein
synthesis functions. Several GO categories were over-represented in N14: GO:0016072 (rRNA metabolism),
GO:0003899 (DNA-directed RNA polymerase activity),
GO:0004527 (exonuclease activity), GO:0008026 (ATPdependent helicase activity), GO:0042254 (ribosome biogen-
esis and assembly), and GO:0006396 (RNA processing).
Cluster N14 was different from N18 in that N14 was slightly
induced by cold stress but N18 was not. The expression of
genes in these two clusters can most parsimoniously be
rationalized by developmental regulation.
Second, the stress clusters N4 and N7 contained genes that
were placed mainly in the tissue clusters T4, T8, and T14, all
Genome Biology 2007, 8:R49
/>
Genome Biology 2007,
Volume 8, Issue 4, Article R49
Ma and Bohnert R49.15
Table 3
Intersection between tissue-specific expression and stress responses
0
1
2
3
4
5
6
7
8
9
10
11
12
13
14
15
16
17
18
19
12
53
8
1
38*
0
2
7
4
32*
3
5
4
0
13
2
19*
4
5
26
9
2
7
0
6
2
3
12
5
12
3
0
28*
2
6
2
23*
2
50*
13
56
14
3
21
0
5
12
9
26*
9
4
11
0
17
0
10
0
19*
3
3
22*
251*
1
0
234*
0
0
2
0
4
1
3
1
243*
2
3
5
336*
5
4
9
4
31
6
18*
30
0
28*
1
9
13
5
4
10
0
16
3
2
0
5
5
110*
11
18
6
0
1
0
2
10
5
56*
16
19
13
0
0
1
26*
0
7
6
13
3
32
2
0
49*
0
0
4
1
10
3
1
2
1
3
3
10
12
3
7
3
1
36
2
0
55*
0
0
0
1
2
0
1
0
10
0
0
4
41*
2
8
21
6
8
7
15*
1
0
3
4
1
10
4
12
9
0
20*
0
8
0
8
9
25
12
21
5
0
4
0
0
5
6
7
11
24*
1
0
0
1
5
0
4
10
13
13
25
3
1
17
0
0
4
1
26*
1
3
2
0
1
0
13
4
4
11
50*
1
15
4
0
7
0
0
3
2
25*
4
4
5
1
1
2
12
0
12
12
2
6
52
3
0
32*
0
0
0
2
3
1
1
3
1
2
0
1
5
3
13
8
26*
94*
3
0
35*
0
0
1
4
11
3
2
2
3
5
3
3
1
1
14
19
1
8
11
1
5
0
7
2
5
16
2
0
4
0
9
0
5
0
11
15
1
15
58
4
0
25
0
0
1
2
3
2
1
0
4
1
0
4
3
2
16
6
10
61
1
0
20
0
0
2
0
3
1
0
2
5
1
2
3
6
0
17
2
3
18
4
0
30
0
0
0
3
0
0
5
0
4
0
1
3
12
1
18
56*
1
5
2
0
1
0
1
4
6
8
5
18
3
0
2
2
4
0
12
Sum
469
156
868
95
41
612
0
54
64
64
267
76
119
75
272
121
25
143
426
134
Shown are numbers of genes at intersections between clusters of tissue-specific expression patterns (T0 to T18) in roots and clusters emerging from the analysis of stress
treatments (N0 to N19). *Gene-enriched intersections.
Stress upregulated genes in roots
A significant difference emerged when genes in stress upregulated clusters were viewed in their tissue-specific or cell-spe-
Genome Biology 2007, 8:R49
information
In essence, the genes downregulated by different stresses are
expressed under ideal growth conditions close to the root
meristem and in the region of strongest cell expansion.
Furthermore, genes related to the functional categories of
mRNA and protein synthesis, cell cycle control, and primary
metabolism categories were separated into differentially
repressed clusters. This indicated active regulatory processes,
other than a passive repression brought about merely by a
general stressed physiologic state.
interactions
Finally, genes in the stress clusters N2 and N5 represented a
combination of the previously discussed patterns. These clusters included genes regulated developmentally (in the tissue
clusters T3, T6, T7, T12, T13, T15, and T16 [stage 1 or stage 2
specific]), and genes downregulated by stress signaling
(mainly in the tissue clusters T0, T1, T2, or T4). Over-represented in cluster N2 were genes involved in metabolism,
which included amino acid, cell wall, carbohydrate, lipid,
nucleotide, and secondary metabolism biosynthetic functions. The following GO categories were over-represented:
GO:0043038 (amino acid activation), GO:0009658 (chloroplast organization and biogenesis), GO:0006779 (porphyrin
biosynthesis),
GO:0019321
(pentose
metabolism),
GO:0004312 (fatty-acid synthase activity), GO:0006769
(nicotinamide metabolism), GO:0005528 (FK506 binding),
GO:0016117 (carotenoid biosynthesis), GO:0015994 (chlorophyll metabolism), and GO:0009606 (tropism). Genes
related to DNA synthesis, chromatin structure, cell cycle, and
cell division were abundant in downregulated cluster N5; the
following were over-represented: GO:0006260 (DNA replication), GO:0007049 (cell cycle), GO:0000910 (cytokinesis),
GO:0007010 (cytoskeleton organization and biogenesis), and
GO:0016071 (mRNA metabolism). Cluster N5 also includes
some genes related to metabolic processes, as indicated the
over-represented GO categories GO:0009853 (photorespiration), GO:0019758 (glycosinolate biosynthesis), GO:0044272
(sulfur compound biosynthesis), and GO:0009067 (aspartate
family amino acid biosynthesis).
refereed research
of which represent stage 3 specific genes. Interestingly,
among the downregulated genes were those related to cell
wall modification that are specifically expressed in the stele
(T4 and T14), such as expansins, extensins, (putative) cellulases, pectinesterases, and peroxidases. Enriched in these two
clusters were GO:0006979 (response to oxidative stress),
GO:0007047 (cell wall organization and biogenesis),
GO:0009653 (morphogenesis), GO:0042545 (cell wall modification), GO:0010054 (trichoblast differentiation), and
GO:0005516 (calmodulin binding). Together, these clusters
appear to identify the portion of the transcriptome that controls root maturation, which is downregulated under stress
treatments of the root system.
deposited research
3
42*
reports
36*
reviews
0
1
Clusters (according to tissue specificity)
comment
Cluster (analysis of different stress conditions; N0 to N19)
Cold
Shoot
Root
Ma and Bohnert
/>
Osmotic
Shoot
Root
Drought
Salt
Shoot
Root
Shoot
JA
Volume 8, Issue 4, Article R49
ABA
Lat. root cap
Epidermis
Cortex
Endodermis
Stele
Stage 1
Stage 2
Stage 3
R49.16 Genome Biology 2007,
Root
AT5G04960
AT4G26010
AT3G59370
AT1G05250
AT3G49960
AT5G05500
AT4G00680
AT2G47540
AT4G02270
AT1G01750
AT1G48930
AT4G20210
AT5G67400
AT5G19790
AT3G26610
AT1G62980
AT1G12560
AT2G44110
AT1G30870
AT4G40090
AT4G09990
AT5G35190
No_match
AT1G12080
AT3G62680
Figure 6
Stress down-regulated genes highly expressed in Stele during stage 3 development
Stress down-regulated genes highly expressed in Stele during stage 3 development. AT5G04960, pectinesterase family protein; AT4G26010, peroxidase,
putative, peroxidase ATP13a; AT3G59370, expressed protein; AT1G05250, peroxidase, putative, similar to peroxidase ATP11a; AT3G49960, peroxidase,
putative, identical to peroxidase ATP21a; AT5G05500, pollen Ole e1 allergen and extensin family protein; AT4G00680, actin-depolymerizing factor,
putative; AT2G47540, pollen Ole e1 allergen and extensin family protein; AT4G02270, pollen Ole e1 allergen and extensin family protein; AT1G01750,
actin-depolymerizing factor, putative; AT1G48930, endo-1,4-beta-glucanase, putative cellulase; AT4G20210, terpene synthase/cyclase family protein;
AT5G67400, peroxidase 73 (PER73) (P73) (PRXR11); AT5G19790, encodes a member of the ERF (ethylene response factor) subfamily B-6 of ERF/AP2
transcription factor family (RAP2.11); AT3G26610, polygalacturonase, putative pectinase; AT1G62980, expansin, putative (EXP18); AT1G12560, expansin,
putative (EXP7); AT2G44110, seven transmembrane MLO family protein/MLO-like protein 15 (MLO15); AT1G30870, cationic peroxidase, putative;
AT4G40090, arabinogalactan-protein (AGP3); AT4G09990, expressed protein; AT5G35190, proline-rich extensin-like family protein; No match, no match;
AT1G12080, expressed protein; AT3G62680, proline-rich family protein.
cific context. In the majority, these genes exhibited a high
expression level at stage 3 (tissue clusters T0, T2, T5, T14, and
T17) or high expression in root cap cells (T1 and T9). Because
genes in these tissue clusters appeared with insignificant
membership values only in the repressed clusters N14 and
N18, we consider them representative of first responders to
stress signaling. It appeared significant that these genes were
upregulated in cells in the more mature region of the root,
coinciding with the region of beginning root hair
development.
Merging stress and tissue/cell specificity, a framework
became recognizable. Genes in tissue clusters T3 and T7 were
significantly downregulated during abiotic stress, and genes
in tissue clusters T0, T1, T2, and T4 were either upregulated
or downregulated under different stress conditions. In con-
trast, genes in tissue clusters T5 and T18 were mainly
upregulated upon stress. Of particular importance may be the
behavior of the genes in clusters T5 and T18. T5 genes were
specifically expressed in endodermis cells in stage 3, whereas
T18 genes exhibited high expression level in lateral root cap
cells.
Cell lineage-specific and development-dependent stress response
pathways
Focusing on abiotic stresses alone (cold, osmotic, salinity,
drought, and the hormones ABA and JA), the 12,360 probes
present in roots were analyzed by fuzzy k-means clustering.
The analysis of this smaller set of treatments separated the
genes into 66 clusters (Additional data file 10). Intersections
of stress specificity and spatial or temporal expression characteristics are illustrated by two examples.
Genome Biology 2007, 8:R49
Root
Shoot
Root
Salt
Shoot
Drought
Root
Shoot
Ma and Bohnert R49.17
JA
Shoot
Osmotic
Volume 8, Issue 4, Article R49
ABA
Cold
Genome Biology 2007,
comment
Lat. root cap
Epidermis
Cortex
Endodermis
Stele
Stage 1
Stage 2
Stage 3
/>
Root
interactions
information
Genome Biology 2007, 8:R49
refereed research
ABA and, in part by JA, while ABA upregulation generally
also extends into the shoots. This cluster includes many
transcripts for functions in signaling and transport, and a
number of genes that have been well characterized, such as
transcripts for proline synthesis, glutathionine-conjugate
transport, ferritin, calcineurin phosphoesterase, SEC14, and
the ABA-responsive AREB2. The complete set of data is
included in the Additional data file 10.
deposited research
Figure 6 shows root-expressed genes that are strongly downregulated predominantly during osmotic and salt stresses.
The identity of the genes with high expression in the stele of
stage 3 roots highlights functions that are associated with the
decline of root growth. Abundantly represented were peroxidases, extensins, and PRP-like proteins, and functionally
unknown proteins. A contrasting behavior is shown in Figure
7, which identifies a cluster with osmotic and salt stress
upregulated genes. These genes are uniformly upregulated by
reports
Figure 7
Stress and ABA upregulated genes in mature roots are also expressed in shoots
Stress and ABA upregulated genes in mature roots are also expressed in shoots. AT2G04350, long-chain-fatty-acid-CoA ligase family protein; AT4G10955,
lipase class 3 family protein; AT1G77450, no apical meristem (NAM) family protein, similar to GRAB1; AT4G33905, peroxisomal membrane protein 22
kDa; AT3G04240, O-linked N-acetyl glucosamine transferase; AT2G39800, delta 1-pyrroline-5-carboxylate synthetase A/P5CS A (P5CS1); AT4G34230,
cinnamyl-alcohol dehydrogenase, putative; AT4G11220, reticulon family protein (RTNLB2); AT1G75170, SEC14 cytosolic factor family protein/
phosphoglyceride transfer family; AT3G19290, ABA-responsive element-binding protein 2 (AREB2); AT5G37540, aspartyl protease family protein, weak
similarity to CND41; AT1G58360, amino acid permease I (AAP1); AT1G78610, mechanosensitive ion channel domain-containing protein; AT4G34710,
arginine decarboxylase 2 (SPE2); AT3G17790, acid phosphatase type 5 (ACP5); AT1G50630, expressed protein; AT1G13195, zinc finger (C3HC4-type
RING finger) family protein; AT2G32800, protein kinase family protein, contains dual protein kinase domains; AT5G35460, expressed protein;
AT2G32510, protein kinase family protein, contains protein kinase domain; AT1G07870, protein kinase family protein, contains protein kinase domain;
AT1G43160, encodes a member of the ERF (ethylene response factor) subfamily B-4 of ERF/AP2 transcription factor family (RAP2.6); AT3G62700,
glutathione-conjugate transporter, putative, similar to AtMRP4; AT2G31980, cysteine proteinase inhibitor-related; AT5G17860, cation exchanger, putative
(CAX7), similar to NKX3_HUMAN sodium/potassium/calcium exchanger 3 precursor; AT1G08920, sugar transporter, putative, similar to ERD6 protein
(Arabidopsis thaliana); AT4G15120, VQ, motif-containing protein; AT2G03240, EXS family protein/ERD1/XPR1/SYG1 family protein, similar to PHO1;
AT5G01200, myb family transcription factor; AT1G48320, thioesterase family protein; AT5G01600, ferritin 1 (FER1).
reviews
AT2G04350
AT4G10955
AT1G77450
AT4G33905
AT3G04240
AT2G39800
AT4G34230
AT4G11220
AT1G75170
AT3G19290
AT5G37540
AT1G58360
AT1G78610
AT4G34710
AT3G17790
AT1G50630
AT1G13195
AT2G32800
AT5G35460
AT2G32510
AT1G07870
AT1G43160
AT3G62700
AT2G31980
AT5G17860
AT1G08920
AT4G15120
AT2G03240
AT5G01200
AT1G48320
AT5G01600
R49.18 Genome Biology 2007,
Volume 8, Issue 4, Article R49
Ma and Bohnert
Conclusion
Integration of diverse, large-scale datasets into a framework
that then describes and explains the functioning of an organism remains an elusive goal of genomics-type approaches.
Combining three types of data, we analyzed in context the
genome-wide expression profiles modulated by a number of
stress conditions, regulatory cis-elements in promoters, and
cell-specific and developmental age-specific root transcripts
and their reaction to stress in the model crucifer Arabidopsis
thaliana. A recent analysis used the AtGenExpress dataset by
focusing on responses under nine experimental conditions
and identified similarities between conditions [78], whereas
our approach distinguished similarities and differences
between genes under all conditions. The fuzzy k-means clustering tool [16] generated reliable clustering results because
known stress response genes, originally reported in singlegene analyses, were generally confirmed by their inclusion in
appropriate clusters [3,4,20,79]. The tool provided flexibility
to arrive at realistic cluster structures that could be adjusted
by the choice of different membership values to take into
account data from different sources.
Detailed analysis focused on cluster N12, which included
genes responsive to most environmental perturbations. This
type of analysis is similar to that in a study that identified cellular stress response genes in yeast from global transcript
profiles of stress responses [80]. In terms of functional
categories a significant overlap is evident, although the yeast
analysis identified a larger number of genes involved in carbohydrate metabolism in this group of common stress genes
compared with the Arabidopsis list. Many of the genes in our
analysis encode stress-responsive functions in animals and
yeasts, such as the Snf1 kinase-related, phoshoinositolrelated, and Bax-inhibitor related pathways. They may represent the evolutionarily conserved cellular stress response,
originating from damage recognition of, for example, lipid
membranes, proteins, or DNA, and mediated by signals
related to calcium and ROS [11,81]. In plants, signals may also
be communicated by ethylene [82] and are largely independent of ABA. Although responding to many stresses, ROS and
ethylene signaling cannot act as a systemic coordinator of
gene expression in the way that this is accomplished by ABA.
Hypothetically, ROS [81] or ethylene induce signaling mainly
locally in stress responses, and the genes in cluster N12
appear to elicit local responses but have no function in long
distance communication. In agreement with this hypothesis,
no cluster specific for ACC treatment emerged, and neither
was a correlation between ethylene treatments and the stress
cluster structure identified in fuzzy k-means analysis [31].
The correlation of a number of previously studied 5'-regulatory, cis-acting sequences with particular stress conditions,
biotic and abiotic alike, was confirmed [12,13,70], and the
presence of additional 5'-regulatory response elements was
identified (Table 2). The ABRE motif ACGTG(G|T)C was
/>
over-represented in multiple clusters responding to either
light or ABA treatment, indicating that the motif is essential
but not sufficient to explain the multiplicity of clusters. Secondary motifs that modify ABA responsiveness are identified.
Within these clusters, the I-Box and DRE motifs emerged and
others are strongly suggested, although detailed studies have
not been conducted on these putatively novel regulatory elements. Another motif, the W-box, was over-represented in
several clusters induced by biotic stresses, and the
corresponding W-box binding transcription factors, namely
WRKYs, were themselves included in these clusters.
The chosen way to integrate datasets revealed relationships
between stress regulation and tissue-specific expression in
the Arabidopsis root. In particular, the downregulation of
genes during osmotic challenge and, although moderately, by
ABA in roots identified genes that, under nonstress conditions, are highly expressed in cells of the vascular tissue and
in the mature root (Figure 6). The stress-repressed genes in
these clusters are responsible for the physiologic effects of
stress that result in impeded growth; most of these genes
reflect metabolic pathways and functions that signal injury
and challenges to organ integrity. In stark contrast, other
clusters identified genes that are upregulated by ABA, in part
also by JA, and upregulation is not solely confined to the roots
(Figure 7). Cell specificity is less pronounced in these clusters
but the genes included tend to be more highly expressed in
cells of the cortex, endodermis, and vasculature in mature
regions of roots. Genes with known and conjectured signaling
functions dominate in these clusters. This findings appears to
implicate the endodermis and stele of mature roots as playing
critical roles in counteracting the effects of many stresses.
Included are many unknown genes, whose functions in environmental stress protection have not yet been analyzed.
Our approach represents one way to integrate diverse, independent datasets to enhance understanding of the plant environmental stress transcriptome. Irrespective of the many
experimental conditions, the analysis identified many genes
that had previously been implicated in plant stress responses
in detailed studies that focused on individual genes. In addition, the overall structure of 5'-regulatory sequences that
resulted from this study corresponded to the results of other
studies, but they also suggested the existence of additional
putative cis-elements, which await detailed analysis. The
clustering that emerged provides an interpretation for the
interdependence and distinction of biotic and abiotic stress
factors. It defines an evolutionarily conserved basic set of
stress response genes. Genes related to ROS-generating and
ROS-detoxifying functions and ethylene action were scattered in virtually all major clusters, which appears to indicate
the fundamental roles that these proteins play in diverse
sensing and signaling pathways. Finally, the correlation of
changes in transcript abundance and the spatial and temporal
resolution of expression patterns in Arabidopsis roots add a
new dimension. The predictions intrinsic in the cluster struc-
Genome Biology 2007, 8:R49
/>
Genome Biology 2007,
tures and their gene compositions are models that should be
helpful in designing more detailed analyses.
Affymetrix microarray data
The limma method implemented in Bioconductor was used to
identify differentially expressed genes [22]. The original
expression datasets from all conditions, derived from gcRMA,
were used to construct the linear model. Different contrast
matrices were utilized to identify the genes that were
differentially expressed under at least one condition/time
point among all conditions, or among the time course treatments of cold, osmotic, salinity, wounding, or pathogen
treatments.
Gene Ontology analysis
The Clench 2.0 program [87] was used to identify over-represented GO categories within a group of genes.
Motif analysis
p(m) =
⎛k ⎞ ⎛ K −k ⎞
⎟×⎜
⎟
⎝ ⎠ ⎝ M −l ⎠
⎛K ⎞
⎜
⎟
⎝M⎠
min( k , M ) ⎜ l
∑
l =m
Genome Biology 2007, 8:R49
information
where M is the number of promoters within the cluster, m is
the number of promoters within the cluster that contain the
motif, K is the total number of promoters in the genome, and
k is the total number of the promoters in the genome that contain the motif.
interactions
The motifs listed in the PLACE database were collected [14].
Their frequencies of appearance in the promoter regions
(1,000 base pairs upstream of the coding region, downloaded
from TAIR) of all genes in the entire genome were scanned
using the patmatch program [88]. For each motif, its frequency of appearance in any cluster was compared with its
frequency in all promoters predicted for the entire genome. A
P value was calculated based on hypergeometric distribution
[69]:
refereed research
The analysis of stress, hormone, chemical, and light treatments was similar to the procedure described previously [21].
The log2 fold change values (treatment/control) of entire
probe sets were analyzed with fuzzy k-means clustering [16].
The parameter was set as k = 300 for the complete set of treatments. In the most economical manner, 180 centroids were
identified, and clustered such that any probe was assigned to
the cluster in which it had highest membership value (Additional data file 3). By applying a cutoff of 0.035, 10,671 probes
were separated into these clusters. For each gene, the sum of
its membership values with the 180 centroids is 1. Therefore,
the average membership value is 0.006. We considered
0.035, around six times higher than the average value, to be a
significant cutoff.
Differentially expressed genes
deposited research
Clustering analysis
To focus on abiotic stress responses, we selected datasets for
cold, osmotic, salt and drought stresses, and the hormones
ABA and JA, for those probes present in roots. These were
clustered separately, as previously, and resulted in 66
clusters. The corresponding Arabidopsis gene locus for each
probe set followed the annotation by TAIR [85].
reports
The microarray data pertaining to cell type-specific and
growth stage-specific gene expression in Arabidopsis roots
have previously been described [19]. The CEL files for these
data were downloaded from the Arabidopsis Gene
Expression Database [18] and processed into expression estimates as described above. The log2 intensities of every individual probe sets were averaged across three replicates for cell
type-specific profiles, or four replicates for stage-specific profiles (Additional data file 6). MAS 5.0, which calls as present
or absent each probe set in each slide, was calculated using
the 'affy' package implemented in Bioconductor. Only probe
sets with calls of present in all four replicates from at least one
of the stage samples were analyzed. Excluded were 356 genes
that had been shown to be induced by protoplasting of root
cells [19]. The remaining 12,360 probes were analyzed.
To reveal the cell type-specific and stage-specific gene expression patterns, the relative expression value for each probe in
each cell type or stage was calculated, by subtracting the
probe's average intensity across the cell type samples or the
stage samples from its intensity in that cell type or stage samples (Additional data file 7). The relative expression values
were assembled and analyzed by fuzzy k-means, with the
parameter k set at 30. Nineteen well defined clusters were
recovered, and no cutoff values were applied (Figure 5 and
Additional data file 8).
reviews
Transcript profiles that reflect responses of Arabidopsis to
different abiotic stress conditions were obtained from Weigel
World [83], which had been processed via gcRMA [84]. For
biotic stresses, hormones, different light regimens, and
chemicals (t-zeatin, tri-iodobenzoic acid, AgNO3, and
cycloheximide) treatments, the CEL files of the Affymetrix
ATH1 microarray data were downloaded from TAIR [85], and
processed into expression estimates using the gcRMA
method with default settings implemented in Bioconductor
[86]. For each experiment, the log2 intensities of individual
probe sets were averaged across two replicates for both treatments and control, and their differences were used as log2
values of fold changes (treatments/control). Details of the
treatment conditions, excerpted from the AtGenExpress
project, are included in Additional data file 1, and the processed data are listed in Additional data file 2.
Ma and Bohnert R49.19
comment
Materials and methods
Volume 8, Issue 4, Article R49
R49.20 Genome Biology 2007,
Volume 8, Issue 4, Article R49
Ma and Bohnert
Over-represented motifs within clusters were identified by
their P values. Also included in the analysis was a list of ciselements identified from a study conducted in mammalian
systems [89].
/>
11.
12.
13.
Additional data files
The following additional data are available with the online
version of this paper. Additional data file 1 includes the
microarray datasets used for this analysis. Additional data file
2 includes the stress datasets used for fuzzy k-means analysis.
Additional data file 3 includes clustering results of all stress
datasets. Additional data file 4 includes a comparison
between clusters N6 and N53. Additional data file 5 shows all
genes in the common stresses response cluster N12. Additional data file 6 provides original data of gene expression in
roots. Additional data file 7 shows processed root dataset
used for fuzzy k-means analysis. Additional data file 8 shows
clustering results for the root dataset. Additional data file 9
shows the intersection between stress clustering and root
clustering. Additional data file 10 shows clustering results for
abiotic stresses in roots.
Intersection file for and
Processed the geneclusters datasets. analysis the
Original
All genes cell forand the for stresses roots. of as from
Comparisonorgan-specific conditions. roots come in
Clustering root file 4 abioticfor fuzzy and transcription
Stress datasets used3 stressstresses, elicitor treatments,
Click herein datasets2for stress datasetsN53 cluster N12.
different databetweenallused clusteringk-means analysis. descriptreatments,treatments andexpression),The rootanalysis Figure 2).
Express (abioticcommon rootthis andin anddataclustering.
tions of the datadatasetexpression analysis, including thehormone
Microarrayresults of1usedstresses analysis (legend N12 root.AtGenAdditionalforlineagesbioticdevelopmental stagesclustering data in
9
8
7
6
5 Fuzzy N6 response
10
dataset analysis.
dataset.
K-means
in roots.
roots
14.
15.
16.
17.
18.
19.
20.
21.
Acknowledgements
22.
We thank Dr Qingqiu Gong for many discussions, and the reviewers for
their scrutiny and many helpful comments. We are indebted to members
of the AtGenExpress consortium for their help. The work was supported
by NSF DBI-0223905 and DBI-0211842, and UIUC institutional funds.
23.
References
25.
1.
26.
2.
3.
4.
5.
6.
7.
8.
9.
10.
Cheong YH, Chang HS, Gupta R, Wang X, Zhu T, Luan S: Transcriptional profiling reveals novel interactions between wounding, pathogen, abiotic stress, and hormonal responses in
Arabidopsis. Plant Physiol 2002, 129:661-677.
Chinnusamy V, Stevenson B, Lee BH, Zhu JK: Screening for gene
regulation mutants by bioluminescence imaging. Sci STKE
2002, 2002:PL10.
Kreps JA, Wu Y, Chang HS, Zhu T, Wang X, Harper JF: Transcriptome changes for Arabidopsis in response to salt, osmotic,
and cold stress. Plant Physiol 2002, 130:2129-2141.
Seki M, Narusaka M, Ishida J, Nanjo T, Fujita M, Oono Y, Kamiya A,
Nakajima M, Enju A, Sakurai T, et al.: Monitoring the expression
profiles of 7000 Arabidopsis genes under drought, cold and
high-salinity stresses using a full-length cDNA microarray.
Plant J 2002, 31:279-292.
Analysis of the genome sequence of the flowering plant Arabidopsis thaliana. Nature 2000, 408:796-815.
Rhee SY, Beavis W, Berardini TZ, Chen G, Dixon D, Doyle A, GarciaHernandez M, Huala E, Lander G, Montoya M, et al.: The Arabidopsis
Information Resource (TAIR): a model organism database
providing a centralized, curated gateway to Arabidopsis biology, research materials and community. Nucleic Acids Res 2003,
31:224-228.
Craigon DJ, James N, Okyere J, Higgins J, Jotham J, May S: NASCArrays: a repository for microarray data generated by NASC's
transcriptomics service. Nucleic Acids Res 2004:D575-D577.
Zimmermann P, Hirsch-Hoffmann M, Hennig L, Gruissem W: GENEVESTIGATOR. Arabidopsis microarray database and analysis toolbox. Plant Physiol 2004, 136:2621-2632.
Gough NR: Science's signal transduction knowledge environment: the connections maps database. Ann NY Acad Sci 2002,
971:585-587.
Usadel B, Nagel A, Thimm O, Redestig H, Blaesing OE, Palacios-Rojas
N, Selbig J, Hannemann J, Piques MC, Steinhauser D, et al.: Extension
of the visualization tool MapMan to allow statistical analysis
24.
27.
28.
29.
30.
31.
32.
33.
34.
35.
of arrays, display of corresponding genes, and comparison
with known responses. Plant Physiol 2005, 138:1195-1204.
Kultz D: Molecular and evolutionary basis of the cellular
stress response. Annu Rev Physiol 2005, 67:225-257.
Arguello-Astorga G, Herrera-Estrella L: Evolution of light-regulated plant promoters. Annu Rev Plant Physiol Plant Mol Biol 1998,
49:525-555.
Yamaguchi-Shinozaki K, Shinozaki K: Organization of cis-acting
regulatory elements in osmotic- and cold-stress-responsive
promoters. Trends Plant Sci 2005, 10:88-94.
Higo K, Ugawa Y, Iwamoto M, Korenaga T: Plant cis-acting regulatory DNA elements (PLACE) database: 1999. Nucleic Acids
Res 1999, 27:297-300.
Lescot M, Dehais P, Thijs G, Marchal K, Moreau Y, Van de Peer Y,
Rouze P, Rombauts S: PlantCARE, a database of plant cis-acting
regulatory elements and a portal to tools for in silico analysis
of promoter sequences. Nucleic Acids Res 2002, 30:325-327.
Gasch AP, Eisen MB: Exploring the conditional coregulation of
yeast gene expression through fuzzy k-means clustering.
Genome Biol 2002, 3:RESEARCH0059.
TAIR - Gene Expression
[ />expression/ATGenExpress.jsp]
The Arabidopsis Gene Expression Database
[http://
www.arexdb.org/]
Birnbaum K, Shasha DE, Wang JY, Jung JW, Lambert GM, Galbraith
DW, Benfey PN: A gene expression map of the Arabidopsis
root. Science 2003, 302:1956-1960.
Gong Q, Li P, Ma S, Indu Rupassara S, Bohnert HJ: Salinity stress
adaptation competence in the extremophile Thellungiella
halophila in comparison with its relative Arabidopsis thaliana.
Plant J 2005, 44:826-839.
Ma S, Gong Q, Bohnert HJ: Dissecting salt stress pathways. J Exp
Bot 2006, 57:1097-1107.
Smyth GK: Linear models and empirical bayes methods for
assessing differential expression in microarray experiments.
Stat Appl Genet Mol Biol 2004, 3:Article3.
Nakagami H, Pitzschke A, Hirt H: Emerging MAP kinase pathways in plant stress signalling. Trends Plant Sci 2005, 10:339-346.
Widmann C, Gibson S, Jarpe MB, Johnson GL: Mitogen-activated
protein kinase: conservation of a three-kinase module from
yeast to human. Physiol Rev 1999, 79:143-180.
Hohmann S: Osmotic stress signaling and osmoadaptation in
yeasts. Microbiol Mol Biol Rev 2002, 66:300-372.
Wojda I, Alonso-Monge R, Bebelman JP, Mager WH, Siderius M:
Response to high osmotic conditions and elevated temperature in Saccharomyces cerevisiae is controlled by intracellular
glycerol and involves coordinate activity of MAP kinase
pathways. Microbiology 2003, 149:1193-1204.
Chang C: Ethylene signaling: the MAPK module has finally
landed. Trends Plant Sci 2003, 8:365-368.
Chen YF, Etheridge N, Schaller GE: Ethylene signal transduction.
Ann Bot (Lond) 2005, 95:901-915.
Ouaked F, Rozhon W, Lecourieux D, Hirt H: A MAPK pathway
mediates ethylene signaling in plants.
EMBO J 2003,
22:1282-1288.
Liu Y, Zhang S: Phosphorylation of 1-aminocyclopropane-1carboxylic acid synthase by MPK6, a stress-responsive
mitogen-activated protein kinase, induces ethylene biosynthesis in Arabidopsis. Plant Cell 2004, 16:3386-3399.
De Paepe A, Vuylsteke M, Van Hummelen P, Zabeau M, Van Der Straeten D: Transcriptional profiling by cDNA-AFLP and microarray analysis reveals novel insights into the early response
to ethylene in Arabidopsis. Plant J 2004, 39:537-559.
Gong D, Guo Y, Jagendorf AT, Zhu JK: Biochemical characterization of the Arabidopsis protein kinase SOS2 that functions in
salt tolerance. Plant Physiol 2002, 130:256-264.
Kleinow T, Bhalerao R, Breuer F, Umeda M, Salchert K, Koncz C:
Functional identification of an Arabidopsis snf4 ortholog by
screening for heterologous multicopy suppressors of snf4
deficiency in yeast. Plant J 2000, 23:115-122.
Sakamoto H, Maruyama K, Sakuma Y, Meshi T, Iwabuchi M, Shinozaki
K, Yamaguchi-Shinozaki K: Arabidopsis Cys2/His2-type zinc-finger proteins function as transcription repressors under
drought, cold, and high-salinity stress conditions. Plant Physiol
2004, 136:2734-2746.
Lee H, Guo Y, Ohta M, Xiong L, Stevenson B, Zhu JK: LOS2, a
genetic locus required for cold-responsive gene transcription encodes a bi-functional enolase.
Embo J 2002,
Genome Biology 2007, 8:R49
/>
36.
38.
39.
41.
42.
44.
46.
47.
48.
50.
51.
53.
54.
56.
57.
63.
64.
65.
66.
67.
68.
69.
70.
71.
72.
73.
74.
75.
76.
Genome Biology 2007, 8:R49
information
55.
62.
interactions
52.
61.
refereed research
49.
60.
deposited research
45.
59.
Kobayashi M, Koshiba T, Kamiya Y, Shinozaki K: CYP707A3, a
major ABA 8'-hydroxylase involved in dehydration and rehydration response in Arabidopsis thaliana.
Plant J 2006,
46:171-182.
Alcazar R, Garcia-Martinez JL, Cuevas JC, Tiburcio AF, Altabella T:
Overexpression of ADC2 in Arabidopsis induces dwarfism
and late-flowering through GA deficiency. Plant J 2005,
43:425-436.
Urano K, Yoshiba Y, Nanjo T, Ito T, Yamaguchi-Shinozaki K, Shinozaki
K: Arabidopsis stress-inducible gene for arginine decarboxylase AtADC2 is required for accumulation of putrescine in
salt tolerance. Biochem Biophys Res Commun 2004, 313:369-375.
Givens RM, Lin MH, Taylor DJ, Mechold U, Berry JO, Hernandez VJ:
Inducible expression, enzymatic activity, and origin of higher
plant homologues of bacterial RelA/SpoT stress proteins in
Nicotiana tabacum. J Biol Chem 2004, 279:7495-7504.
van der Biezen EA, Sun J, Coleman MJ, Bibb MJ, Jones JD: Arabidopsis
RelA/SpoT homologs implicate (p)ppGpp in plant signaling.
Proc Natl Acad Sci USA 2000, 97:3747-3752.
Swiderski MR, Innes RW: The Arabidopsis PBS1 resistance gene
encodes a member of a novel protein kinase subfamily. Plant
J 2001, 26:101-112.
Varet A, Parker J, Tornero P, Nass N, Nurnberger T, Dangl JL, Scheel
D, Lee J: NHL25 and NHL3, two NDR1/HIN1-1ike genes in
Arabidopsis thaliana with potential role(s) in plant defense.
Mol Plant Microbe Interact 2002, 15:608-616.
Varet A, Hause B, Hause G, Scheel D, Lee J: The Arabidopsis NHL3
gene encodes a plasma membrane protein and its overexpression correlates with increased resistance to Pseudomonas syringae pv. tomato DC3000. Plant Physiol 2003,
132:2023-2033.
Shao F, Golstein C, Ade J, Stoutemyer M, Dixon JE, Innes RW: Cleavage of Arabidopsis PBS1 by a bacterial type III effector. Science
2003, 301:1230-1232.
Yang CW, Gonzalez-Lamothe R, Ewan RA, Rowland O, Yoshioka H,
Shenton M, Ye H, O'Donnell E, Jones JD, Sadanandom A: The E3
ubiquitin ligase activity of Arabidopsis PLANT U-BOX17 and
its functional tobacco homolog ACRE276 are required for
cell death and defense. Plant Cell 2006, 18:1084-1098.
Ramonell K, Berrocal-Lobo M, Koh S, Wan J, Edwards H, Stacey G,
Somerville S: Loss-of-function mutations in chitin responsive
genes show increased susceptibility to the powdery mildew
pathogen Erysiphe cichoracearum.
Plant Physiol 2005,
138:1027-1036.
Mengiste T, Chen X, Salmeron J, Dietrich R: The BOTRYTIS
SUSCEPTIBLE1 gene encodes an R2R3MYB transcription
factor protein that is required for biotic and abiotic stress
responses in Arabidopsis. Plant Cell 2003, 15:2551-2565.
Hughes JD, Estep PW, Tavazoie S, Church GM: Computational
identification of cis-regulatory elements associated with
groups of functionally related genes in Saccharomyces
cerevisiae. J Mol Biol 2000, 296:1205-1214.
Eulgem T, Rushton PJ, Robatzek S, Somssich IE: The WRKY superfamily of plant transcription factors. Trends Plant Sci 2000,
5:199-206.
Harmer SL, Hogenesch JB, Straume M, Chang HS, Han B, Zhu T,
Wang X, Kreps JA, Kay SA: Orchestrated transcription of key
pathways in Arabidopsis by the circadian clock. Science 2000,
290:2110-2113.
Tatematsu K, Ward S, Leyser O, Kamiya Y, Nambara E: Identification of cis-elements that regulate gene expression during initiation of axillary bud outgrowth in Arabidopsis. Plant Physiol
2005, 138:757-766.
Hudson ME, Quail PH: Identification of promoter motifs
involved in the network of phytochrome A-regulated gene
expression by combined analysis of genomic sequence and
microarray data. Plant Physiol 2003, 133:1605-1616.
Chaboute ME, Clement B, Sekine M, Philipps G, Chaubet-Gigot N:
Cell cycle regulation of the tobacco ribonucleotide reductase small subunit gene is mediated by E2F-like elements.
Plant Cell 2000, 12:1987-2000.
Kosugi S, Ohashi Y: E2F sites that can interact with E2F proteins cloned from rice are required for meristematic tissuespecific expression of rice and tobacco proliferating cell
nuclear antigen promoters. Plant J 2002, 29:45-59.
Vandepoele K, Vlieghe K, Florquin K, Hennig L, Beemster GT, Gruissem W, Van de Peer Y, Inze D, De Veylder L: Genome-wide identification of potential plant E2F target genes. Plant Physiol 2005,
reports
43.
58.
Ma and Bohnert R49.21
reviews
40.
21:2692-2702.
Chae HJ, Kim HR, Xu C, Bailly-Maitre B, Krajewska M, Krajewski S,
Banares S, Cui J, Digicaylioglu M, Ke N, et al.: BI-1 regulates an
apoptosis pathway linked to endoplasmic reticulum stress.
Mol Cell 2004, 15:355-366.
Baek D, Nam J, Koo YD, Kim DH, Lee J, Jeong JC, Kwak SS, Chung
WS, Lim CO, Bahk JD, et al.: Bax-induced cell death of Arabidopsis is meditated through reactive oxygen-dependent andindependent processes. Plant Mol Biol 2004, 56:15-27.
Kawai-Yamada M, Ohori Y, Uchimiya H: Dissection of Arabidopsis
Bax inhibitor-1 suppressing Bax-, hydrogen peroxide-, and
salicylic acid-induced cell death. Plant Cell 2004, 16:21-32.
Watanabe N, Lam E: Arabidopsis Bax inhibitor-1 functions as an
attenuator of biotic and abiotic types of cell death. Plant J
2006, 45:884-894.
Levine A, Belenghi B, Damari-Weisler H, Granot D: Vesicle-associated membrane protein of Arabidopsis suppresses Baxinduced apoptosis in yeast downstream of oxidative burst. J
Biol Chem 2001, 276:46284-46289.
Mazel A, Leshem Y, Tiwari BS, Levine A: Induction of salt and
osmotic stress tolerance by overexpression of an intracellular vesicle trafficking protein AtRab7 (AtRabG3e). Plant
Physiol 2004, 134:118-128.
Williams ME, Torabinejad J, Cohick E, Parker K, Drake EJ, Thompson
JE, Hortter M, Dewald DB: Mutations in the Arabidopsis phosphoinositide phosphatase gene SAC9 lead to overaccumulation of PtdIns(4,5)P2 and constitutive expression of the
stress-response pathway. Plant Physiol 2005, 138:686-700.
Zhong R, Burk DH, Nairn CJ, Wood-Jones A, Morrison WH 3rd, Ye
ZH: Mutation of SAC1, an Arabidopsis SAC domain phosphoinositide phosphatase, causes alterations in cell morphogenesis, cell wall synthesis, and actin organization. Plant Cell
2005, 17:1449-1466.
Hua J, Grisafi P, Cheng SH, Fink GR: Plant growth homeostasis is
controlled by the Arabidopsis BON1 and BAP1 genes. Genes
Dev 2001, 15:2263-2272.
Apel K, Hirt H: Reactive oxygen species: metabolism, oxidative stress, and signal transduction. Annu Rev Plant Biol 2004,
55:373-399.
Davletova S, Schlauch K, Coutu J, Mittler R: The zinc-finger protein Zat12 plays a central role in reactive oxygen and abiotic
stress signaling in Arabidopsis. Plant Physiol 2005, 139:847-856.
Mittler R, Vanderauwera S, Gollery M, Van Breusegem F: Reactive
oxygen gene network of plants. Trends Plant Sci 2004, 9:490-498.
Borsani O, Zhu J, Verslues PE, Sunkar R, Zhu JK: Endogenous siRNAs derived from a pair of natural cis-antisense transcripts
regulate salt tolerance in Arabidopsis. Cell 2005, 123:1279-1291.
Tucker M, Valencia-Sanchez MA, Staples RR, Chen J, Denis CL, Parker
R: The transcription factor associated Ccr4 and Caf1 proteins are components of the major cytoplasmic mRNA deadenylase in Saccharomyces cerevisiae. Cell 2001, 104:377-386.
Birse CE, Minvielle-Sebastia L, Lee BA, Keller W, Proudfoot NJ: Coupling termination of transcription to messenger RNA maturation in yeast. Science 1998, 280:298-301.
Xu X, Chen C, Fan B, Chen Z: Physical and functional interactions between pathogen-induced Arabidopsis WRKY18,
WRKY40, and WRKY60 transcription factors. Plant Cell 2006,
18:1310-1326.
Andreasson E, Jenkins T, Brodersen P, Thorgrimsen S, Petersen NH,
Zhu S, Qiu JL, Micheelsen P, Rocher A, Petersen M, et al.: The MAP
kinase substrate MKS1 is a regulator of plant defense
responses. EMBO J 2005, 24:2579-2589.
Zheng Z, Qamar SA, Chen Z, Mengiste T: Arabidopsis WRKY33
transcription factor is required for resistance to necrotrophic fungal pathogens. Plant J 2006, 48:592-605.
Journot-Catalino N, Somssich IE, Roby D, Kroj T: The transcription factors WRKY11 and WRKY17 Act as negative regulators of basal resistance in Arabidopsis thaliana. Plant Cell 2006,
18:3289-3302.
Torres-Galea P, Huang LF, Chua NH, Bolle C: The GRAS protein
SCL13 is a positive regulator of phytochrome-dependent red
light signaling, but can also modulate phytochrome A
responses. Mol Genet Genomics 2006, 276:13-30.
Osakabe Y, Maruyama K, Seki M, Satou M, Shinozaki K, YamaguchiShinozaki K: Leucine-rich repeat receptor-like kinase1 is a key
membrane-bound regulator of abscisic acid early signaling in
Arabidopsis. Plant Cell 2005, 17:1105-1119.
Umezawa T, Okamoto M, Kushiro T, Nambara E, Oono Y, Seki M,
Volume 8, Issue 4, Article R49
comment
37.
Genome Biology 2007,
R49.22 Genome Biology 2007,
77.
78.
79.
80.
81.
82.
83.
84.
85.
86.
87.
88.
89.
Volume 8, Issue 4, Article R49
Ma and Bohnert
139:316-328.
Pati A, Vasquez-Robinet C, Heath LS, Grene R, Murali TM: XcisClique: analysis of regulatory bicliques. BMC Bioinformatics
2006, 7:218.
Swindell WR: The association among gene expression
responses to nine abiotic stress treatments in Arabidopsis
thaliana. Genetics 2006, 174:1811-1824.
Fowler S, Thomashow MF: Arabidopsis transcriptome profiling
indicates that multiple regulatory pathways are activated
during cold acclimation in addition to the CBF cold response
pathway. Plant Cell 2002, 14:1675-1690.
Chen D, Toone WM, Mata J, Lyne R, Burns G, Kivinen K, Brazma A,
Jones N, Bahler J: Global transcriptional responses of fission
yeast to environmental stress. Mol Biol Cell 2003, 14:214-229.
Fedoroff N: Redox regulatory mechanisms in cellular stress
responses. Ann Bot (Lond) 2006, 98:289-300.
Alonso JM, Ecker JR: The ethylene pathway: a paradigm for
plant hormone signaling and interaction. Sci STKE 2001,
2001:RE1.
Weigel World
[ />ray/AtGenExpress/]
Wu Z, Irizarry R, Gentleman R, Murillo F, Spencer F: A model based
background adjustment for oligonucleotide expression
arrays. Baltimore, MA: Johns Hopkins University, Dept of Biostatistics Working Papers; 2003.
TAIR - Microarrays [ />Microarrays/Affymetrix/]
Gentleman RC, Carey VJ, Bates DM, Bolstad B, Dettling M, Dudoit S,
Ellis B, Gautier L, Ge Y, Gentry J, et al.: Bioconductor: open software development for computational biology and
bioinformatics. Genome Biol 2004, 5:R80.
Shah NH, Fedoroff NV: CLENCH: a program for calculating
Cluster ENriCHment using the Gene Ontology. Bioinformatics
2004, 20:1196-1197.
Yan T, Yoo D, Berardini TZ, Mueller LA, Weems DC, Weng S,
Cherry JM, Rhee SY: PatMatch: a program for finding patterns
in peptide and nucleotide sequences. Nucleic Acids Res
2005:W262-W266.
Xie X, Lu J, Kulbokas EJ, Golub TR, Mootha V, Lindblad-Toh K,
Lander ES, Kellis M: Systematic discovery of regulatory motifs
in human promoters and 3' UTRs by comparison of several
mammals. Nature 2005, 434:338-345.
Genome Biology 2007, 8:R49
/>