Báo cáo y học: " Comparative analysis indicates regulatory neofunctionalization of yeast duplicates" pps
Bạn đang xem bản rút gọn của tài liệu. Xem và tải ngay bản đầy đủ của tài liệu tại đây (500.38 KB, 11 trang )
Genome Biology 2007, 8:R50
comment reviews reports deposited research refereed research interactions information
Open Access
2007Tirosh and BarkaiVolume 8, Issue 4, Article R50
Research
Comparative analysis indicates regulatory neofunctionalization of
yeast duplicates
Itay Tirosh
*
and Naama Barkai
†
Addresses:
*
Department of Molecular Genetics, Weizmann Institute of Science, 76100 Rehovot, Israel.
†
Department of Physics of Complex
Systems, Weizmann Institute of Science, 76100 Rehovot, Israel.
Correspondence: Naama Barkai. Email:
© 2007 Tirosh and Barkai; licensee BioMed Central Ltd.
This is an open access article distributed under the terms of the Creative Commons Attribution License ( which
permits unrestricted use, distribution, and reproduction in any medium, provided the original work is properly cited.
Regulatory neofunctionalization of yeast duplicates<p>Comparison of the expression profiles of <it>S. cerevisiae</it> duplicate pairs with that of their pre-duplication orthologs in <it>C. albicans</it> identified a class of genes that may present cases of regulatory neofunctionalization.</p>
Abstract
Background: Gene duplication provides raw material for the generation of new functions, but
most duplicates are rapidly lost due to the initial redundancy in gene function. How gene function
diversifies following duplication is largely unclear. Previous studies analyzed the diversification of
duplicates by characterizing their coding sequence divergence. However, functional divergence can
also be attributed to changes in regulatory properties, such as protein localization or expression,
which require only minor changes in gene sequence.
Results: We developed a novel method to compare expression profiles from different organisms
and applied it to analyze the expression divergence of yeast duplicated genes. The expression
profiles of Saccharomyces cerevisiae duplicate pairs were compared with those of their pre-
duplication orthologs in Candida albicans. Duplicate pairs were classified into two classes,
corresponding to symmetric versus asymmetric rates of expression divergence. The latter class
includes 43 duplicate pairs in which only one copy has a significant expression similarity to the C.
albicans ortholog. These may present cases of regulatory neofunctionalization, as supported also by
their dispensability and variability.
Conclusion: Duplicated genes may diversify through regulatory neofunctionalization. Notably, the
asymmetry of gene sequence evolution and the asymmetry of gene expression evolution are only
weakly correlated, underscoring the importance of expression analysis to elucidate the evolution
of novel functions.
Background
Current genomes were shaped by numerous duplications of
single genes, chromosomal segments and even entire
genomes [1-3]. In most cases, one copy of the duplicated gene
is rapidly lost either by deletion or through mutations ('non-
functionalization'), reflecting the lack of selection for each
individual copy. In other cases, however, both duplicates may
survive despite the initial redundancy and become fixed in the
genome. The retention of both duplicates over millions of
years implies that they confer an advantage such that deletion
of either copy will cause a reduction in fitness.
While the evolutionary advantage of duplicates retention is
usually difficult to ascertain, several models have been
Published: 5 April 2007
Genome Biology 2007, 8:R50 (doi:10.1186/gb-2007-8-4-r50)
Received: 21 December 2006
Revised: 15 February 2007
Accepted: 5 April 2007
The electronic version of this article is the complete one and can be
found online at />R50.2 Genome Biology 2007, Volume 8, Issue 4, Article R50 Tirosh and Barkai />Genome Biology 2007, 8:R50
suggested [4]. First, duplicates could be retained due to selec-
tion for robustness through redundancy [5], although this
view has been frequently challenged [6,7]. Second, selection
for high protein dosage may favor the presence of two gene
copies [8]. In these cases, similarity between the two copies
can be maintained by negative selection or by gene conver-
sion. Third, each of the duplicates may specialize in a subset
of the ancestral functions, such that the ancestral functions
require the activity of both genes ('subfunctionalization').
Fourth, one of the duplicates may retain the ancestral func-
tions while the other evolves to perform a novel function
('neofunctionalization'). Identifying these scenarios and, in
particular, recognizing cases of neofunctionalization may
provide new insights into genome evolution, since duplica-
tions are believed to constitute the main origin of novel
functions.
The term neofunctionalization refers to the acquisition of a
novel function. However, it is typically difficult to define what
the function of a gene is, and what constitutes a novel func-
tion. One obvious aspect of gene function is the catalytic
activity performed by encoded enzymes. A broader definition
of gene function, however, should include other aspects, such
as protein localization, interactions with other proteins and
expression patterns. These features are usually difficult to
infer from the protein sequence, but the abundance of func-
tional genomics datasets and the advent of microarray tech-
nology can now be used to analyze these properties directly.
Of particular interest are the expression patterns of genes in
various conditions. Changes in expression patterns have been
suggested to be the primary source of phenotypic divergence
among related species [9]. Such regulatory changes can have
a profound effect on the function of a duplicated gene and,
thus, lead to the preservation of a duplicate pair [10-12]. We
refer to this scenario, where one copy of a duplicate pair
diverges in expression pattern thereby facilitating the acqui-
sition of a novel function, as regulatory neofunctionalization.
The yeast Saccharomyces cerevisiae is an excellent model to
study the diversification of duplicate gene pairs. First, exten-
sive functional annotations and expression data are available
for S. cerevisiae. Second, the S. cerevisiae ancestor has
undergone a whole genome duplication (WGD) event about
100 million years ago [13]. Sequencing of the pre-duplication
yeast, Kluyveromyces waltii, identified hundreds of dupli-
cate gene-pairs that were retained following this WGD event
[2]. Many of these duplicate pairs accumulated extensive
divergence and evolved new or altered functions. For exam-
ple, sequence comparisons between S. cerevisiae duplicate
pairs and their single orthologs from K. waltii revealed that in
a significant portion of the duplicate pairs (115 out of 457),
one copy has diverged in sequence significantly faster than
the other copy [2]. This was taken as evidence for neofunc-
tionalization, with the more conserved copy retaining the
ancestral function and the other copy evolving to perform a
new or altered function. A similar analysis of expression pat-
terns may reveal additional cases of regulatory
neofunctionalization.
Recent studies reported that 40% of the duplicate pairs in S.
cerevisiae differ significantly in their expression patterns
[14,15]. However, to identify cases of neofunctionalization,
the expression pattern of each of the copies must be com-
pared with the ancestral expression pattern. To circumvent
this problem, Gu et al. [15] focused on gene families that con-
tain a duplicate pair and at least one additional gene that was
assumed to represent the ancestral expression pattern. In the
absence of data about the expression of the ancestral genes,
however, the validity of this assumption is difficult to assess.
Here we analyze the diversification of yeast duplicates by
directly comparing their expression patterns in a post-dupli-
cation species (S. cerevisiae) to those of their single orthologs
in a pre-duplication species (Candida albicans) as a proxy for
the ancestral gene expression. We first describe a general
method for comparative analysis of expression profiles from
related organisms. We apply this method to compare large
datasets from hundreds of microarray experiments in both
yeast species. Focusing on duplicate gene pairs, we identify 43
duplicated gene pairs with asymmetric rates of expression
divergence. These gene pairs are likely to present instances of
regulatory neofunctionalization. Notably, the level of
sequence divergence in many of these duplicates is similar,
emphasizing the need to include gene regulation as a comple-
mentary means for analyzing functional divergence.
Results
We first describe our method for comparison of expression
profiles between one-to-one orthologs from two organisms,
and later extend it to examine the expression conservation of
duplicate gene pairs.
A novel method for comparative analysis of gene
expression
Ideally, we wish to compare the transcription responses of the
S. cerevisiae genes to those of their C. albicans orthologs
under the same set of conditions. However, the expression
data of the two species was measured under different condi-
tions and by different laboratories and could not be directly
compared. We thus developed a novel method for comparing
the expression profiles of two organisms, called 'iterative
comparison of coexpression' (ICC; see Materials and methods
and Figure 1). To analyze the expression conservation of an
orthologous gene pair from S. cerevisiae and Candida albi-
cans (a
i
cer
and a
i
can
, respectively), we compare their expres-
sion correlations with all other one-to-one orthologous pairs
(a
g
cer
, a
g
can
; g = 1n), as described below. This method follows
the conceptual framework described by Ihmels et al. [16] and
Dutilh et al. [17] and compares the architecture of the co-
expression networks.
Genome Biology 2007, Volume 8, Issue 4, Article R50 Tirosh and Barkai R50.3
comment reviews reports refereed researchdeposited research interactions information
Genome Biology 2007, 8:R50
Dutilh et al. [17] defined expression conservation as the sim-
ilarity between (i) the expression correlations between a gene
from S. cerevisiae (a
i
cer
) and all other S. cerevisiae genes
(a
g
cer
, g = 1 n), and (ii) the expression correlations between
its ortholog from Candida albicans (a
i
can
) and all other Can-
dida albicans orthologs (a
g
can
, g = 1 n), that is:
EC(i) = PCC(R
i,g
cer
, R
i,g
can
), g = 1 n
where PCC is the Pearson correlation coefficient and R
i,g
cer
is
a vector of intra-species correlations, whose component R
i,j
cer
is the correlation between the expression patterns of a
i
cer
and
a
j
cer
(Figure 1). However, we note that a difference between
R
i,g
cer
and R
i,g
can
does not necessarily correspond to a differ-
ence in the expression patterns of a
i
cer
and a
i
can
. For example,
if a
j
cer
and a
j
can
have highly divergent expression profiles, then
R
i,j
cer
and R
i,j
can
will be different even if the expression of a
i
cer
and a
i
can
has been completely conserved. Thus, when calcu-
lating the similarity between the vectors of correlations
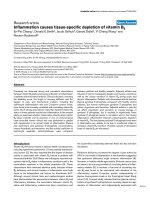
Method for comparative analysis of gene expressionFigure 1
Method for comparative analysis of gene expression. Given expression matrices for two species where rows correspond to genes and columns
correspond to conditions, we first find one-to-one ortholog matches between the two species and arrange the matrices such that equivalent rows
represent the expression patterns of orthologs. Note that after this step the two matrices have the same number of rows, but not necessarily the same
number of conditions and the conditions are not comparable. Next, the Pearson correlation coefficient (PCC) is calculated for each pair of genes over all
conditions, generating the correlation matrices , . Each row in these matrices corresponds to the correlations between one gene and all
other genes (with orthologs) from the same genome. Equivalent rows in the two matrices correspond to the correlation vectors of a pair of orthologs
with all other orthologs from the respective genomes. The correlation between these vectors of correlations is defined as the initial estimation of
expression conservation (EC
0
). EC scores are then iteratively refined by calculating weighted Pearson correlation coefficients (PCCw) where EC scores
from the previous iteration are used as weights and genes with negative weights are excluded from the calculation. This procedure is repeated until
convergence of the EC scores (EC
k
≈ EC
k - 1
). The iterative procedure can also be initiated from random weights to verify the convergence to a global
minimum (see Materials and methods).
Collect expression data from
various conditions
Find orthology and arrange
expression matrices accordingly
Calculate expression correlation
for each gene pair, over all
conditions
Estimate
Expression Conservation without
weights (EC
Final EC scores
no
yes
Genes
Conditions
Genes
Genes
Genes
Genes
cer
cg
E
1
,
cer
cg
R
,
cer
gg
R
,
Genes
Conditions
Genes
Genes
Genes
Genes
can
cg
E
2
,
can
gg
R
,
can
gg
R
,
Orthologs
),()(
,,0
can
gi
cer
gi
RRPCCiEC
),()(
',',
can
gi
cer
gik
RRPCCwiEC
)(
1
iECw
k-i
ng 1
}0)(|{'
1
lECglg
k-
(i)
(i)
(i) (i)
=
=
=
=
=
>
∈
0
)
Refine Expression Conservation
(EC
k
)using EC
k-1
as weights
EC
k
EC
k-1
≠
?
R
gg
cer
,
R
gg
can
,
R50.4 Genome Biology 2007, Volume 8, Issue 4, Article R50 Tirosh and Barkai />Genome Biology 2007, 8:R50
(R
i,g
cer
and R
i,g
can
), larger weight should be given to ortholo-
gous pairs whose expression has been conserved. In other
words, when comparing a pair of orthologs, we would like to
focus on their correlations with other orthologous pairs
whose expression has been conserved.
To account for this effect, we employ an iterative algorithm
that estimates expression conservation iteratively (see Figure
1 and Materials and methods). Briefly, at the first iteration,
expression conservation is calculated as in Dutilh et al. [17];
at each subsequent iteration, the expression conservation val-
ues from the previous iteration are used as weights to calcu-
late new expression conservation values. The iterative
process proceeds until the expression conservation values
converge.
Expression conservation between S. cerevisiae and C.
albicans orthologs
We applied ICC to the set of one-to-one orthologs between S.
cerevisiae and C. albicans [18]. To this end, we assembled a
large dataset of genome-wide expression data, consisting of
approximately 1,700 expression profiles for S. cerevisiae and
244 expression profiles for C. albicans [16,19]. The results are
summarized in Figure 2 and Additional data file 1.
Several tests were performed to validate the results. First, we
ran the algorithm several times, starting from randomly cho-
sen initial weights for each orthologous pair. In all cases the
algorithm converged to the same results (Figure 2a), thus ver-
ifying the robustness of the iterative procedure. Second, we
ran the algorithm with randomly chosen subsets of the
expression datasets consisting of half the number of condi-
tions for each species. Also in this case, the algorithm con-
verged to the same results (Figure 2a). Third, we defined the
set of conserved and divergent genes (5% highest or lowest
expression conservation values, respectively) and examined
their properties. Approximately 60% of the most conserved S.
cerevisiae genes are essential [20] compared with 26% for all
genes with orthologs in C. albicans (p < 10
-16
by the hyperge-
ometric test). Furthermore, ribosome biogenesis was found
to be the most enriched Gene Ontology (GO) term among the
conserved genes (p < 10
-50
by hypergeometric test), whereas
mitochondrion and mitochondrial ribosome were the most
enriched GO terms among the divergent genes (p < 10
-17
for
both by hypergeometric test). Indeed, these latter groups
have undergone a large-scale adaptation of their expression
profiles following the WGD [19]. Thus, the results of our algo-
rithm are in good agreement with prior knowledge and expec-
tations. Finally, we compared the distribution of expression
conservation scores obtained for the orthologous pairs to that
obtained for randomly chosen (non-orthologous) gene pairs.
Expression conservation was higher for orthologs than non-
orthologs (Figure 2b), indicating that the expression net-
works of the two yeast species have retained significant
similarities.
Comparison of duplicate gene pairs with their single
orthologs
We next focused on the expression conservation of duplicate
gene pairs. To this end, we used the expression conservation
scores generated by the ICC for each of the one-to-one
orthologs as weights to calculate the expression conservation
of duplicate genes. Namely, for each duplicate gene pair in S.
cerevisiae, we calculated two expression conservation scores
between each of the duplicates and their single ortholog from
C. albicans (see Materials and methods).
Expression conservationFigure 2
Expression conservation. (a) Controls for the ICC algorithm. ICC was
applied ten times with randomly chosen initial weights (red), and ten times
with randomly selected subsets of the expression conditions (blue). The
correlations between these controls and expression conservation (from
the original application) are shown after one to ten iterations. (b)
Expression conservation values were calculated by ICC for all S. cerevisiae-
C. albicans orthologs (solid black), duplicates from the WGD and their C.
albicans ancestors (solid grey; both duplicates from each pair were
compared to their ancestor), and randomly selected S. cerevisiae-C. albicans
gene pairs (dashed black). Distributions are shown for bins of 0.1.
1 2 3 4 5 6 7 8 9 10
0.8
0.85
0.9
0.95
1
Iteration
Correlation with Expression Conservation
(a)
-1 -0.8 -0.6 -0.4 -0.2 0 0.2 0.4 0.6 0.8 1
0
0.05
0.1
0.15
0.2
0.25
Expression Conservation
Frequency
Random
Orthologs
Duplicates
(b)
Genome Biology 2007, Volume 8, Issue 4, Article R50 Tirosh and Barkai R50.5
comment reviews reports refereed researchdeposited research interactions information
Genome Biology 2007, 8:R50
Out of the 457 duplicate pairs from the WGD event [2], we
focused on 244 pairs compiled with the following two condi-
tions. First, we performed a phylogenetic analysis and
required that a single ortholog from C. albicans was predicted
for both of the duplicates and that no other in-paralogs were
found in S. cerevisiae (Materials and methods). This single
ortholog serves as an out-group to estimate the expression of
the ancestral gene before the WGD. Second, to avoid cases
where the duplicates cross-hybridize to microarrays, thus
leading to artificial correlations, we considered only duplicate
pairs whose nucleotide sequence similarity was lower than
90%.
Two modes of expression divergence for duplicates
As shown in Figure 3a, a large percentage of the duplicates
appear to have evolved at a similar rate, as both gene pairs
show similar expression conservation to their single C. albi-
cans orthologs (for example, 79 duplicates in the yellow
region). Notably, however, a similarly large fraction of dupli-
cate pairs display distinctly different levels of expression con-
servation (for example, 63 duplicates in the green region).
These cases indicate asymmetric rates of expression evolution
among the two duplicate genes.
To further explore the distinction between duplicate pairs
that evolve at similar versus asymmetric rates, we focused on
the 96 duplicate pairs in which at least one of the copies has
significantly high expression conservation (EC > 0.37; see
dashed line in Figure 3a). This constraint removed cases for
which it is difficult to infer the ancestral expression pattern,
since the C. albicans expression pattern is much different
from that of both duplicate genes. The expression conserva-
tion of the least conserved duplicates, in these cases, display
a bimodal distribution with a boundary at approximately EC
= 0 (Figure 3b). This distribution thus partitions the dupli-
cate gene pairs into two classes.
The first class corresponds to duplicate gene pairs for which
the expression of both copies resembles that of the C. albicans
ortholog. Of these duplicate pairs, 28 have significantly high
expression conservation for both copies; we refer to these as
duplicate pairs with conserved expression. This class includes
duplicate pairs whose divergence is probably related to other
aspects of protein function, such as protein structure or inter-
actions. In addition, duplicates in this class tend to have
higher mRNA and protein abundance [21,22] than other
duplicates (Additional data file 2), suggesting that some of
these duplicate pairs could have been retained due to selec-
tion for high dosage.
Interestingly, in the second class, comprising 45% of the
duplicate gene pairs (43 out of 96), one copy has a significant
Expression conservation between duplicates and their ancestorsFigure 3
Expression conservation between duplicates and their ancestors. (a) Each dot represents the EC of a duplicate pair where the EC of the less conserved
duplicate is shown on the x-axis and the EC of the more conserved duplicate is shown on the y-axis. The yellow region indicates similar rates of
expression divergence (y - x < 0.2) and the green region indicates asymmetric rates of expression divergence (y - x > 0.5). The dashed line indicates a
threshold of EC > 0.37, which is the 0.05 significance value from randomly selected S. cerevisiae-C. albicans gene pairs (see Figure 2b). (b) Distribution of
EC for the least conserved duplicates among the 96 cases where the more conserved duplicate has significantly high EC (above the dashed line in (b)). (c)
EC between the least conserved duplicate and the reconstructed ancestral expression (x-axis), and between the C. albicans ortholog and the reconstructed
ancestral expression (y-axis). Red dots correspond to duplicates with asymmetric expression divergence (left peak in (b)) and blue dots correspond to
duplicates with conserved expression (both copies with EC > 0.37).
(c)
(b)(a)
R50.6 Genome Biology 2007, Volume 8, Issue 4, Article R50 Tirosh and Barkai />Genome Biology 2007, 8:R50
similarity (EC > 0.37) to the C. albicans ortholog (conserved),
and the second copy has no similarity (EC < 0) to the C. albi-
cans ortholog (divergent). The duplicate pairs displaying this
asymmetric pattern of expression evolution are given in Table
Table 1
Duplicate pairs with asymmetric expression evolution
Conserved* Divergent* Ortholog* EC
1
†
EC
2
†
AA
1
‡
AA
2
‡
URA7 URA8 orf19.3941 0.83877 -0.70319 19 12
YML125C YML087C orf19.7307 0.78458 -0.67655 31 5
YGR141W YPR157W orf19.1800 0.71756 -0.65682 11 15
URA5 URA10 orf19.2555 0.65222 -0.62355 14 2
SEC14 YKL091C orf19.941 0.56525 -0.57108 30 3
YDR018C YBR042C orf19.137 0.63182 -0.55743 6 26
UTH1 NCA3 orf19.5032 0.6716 -0.53582 25 8
MRS3 MRS4 orf19.2178 0.59171 -0.5275 3 3
YDR341C MSR1 orf19.3341 0.86239 -0.49736 31 2
SVL3 PAM1 orf19.1139 0.51523 -0.48769 32 21
YGL060W YBR216C orf19.5034 0.53514 -0.43043 28 26
YKL035W YHL012W orf19.1738 0.55403 -0.41198 178 1
FKS1 GSC2 orf19.2929 0.53428 -0.40078 24 17
APA1 APA2 orf19.5630 0.71784 -0.38482 7 9
YOR054C SIS2 orf19.7378 0.59512 -0.38274 13 12
EGD1 BTT1 orf19.1154 0.80319 -0.35655 18 3
PRK1 YNL020C orf19.2605 0.56058 -0.3195 14 14
YOR227W YPL137C orf19.6544 0.66576 -0.28599 31 41
GSP1 GSP2 orf19.5493 0.70457 -0.26817 1 0
YBL054W YER088C orf19.2545 0.78265 -0.25468 9 19
EMP70 YDR107C orf19.2746 0.44981 -0.22268 32 13
YDR185C MSF1' orf19.3089 0.72298 -0.21596 3 19
GZF3 DAL80 orf19.2842 0.59906 -0.20028 3 2
YEL006W YIL006W orf19.1393 0.6866 -0.16477 5 28
ARE2 ARE1 orf19.2248 0.82595 -0.13257 39 10
YMR102C YKL121W orf19.7235 0.59001 -0.12411 21 6
YIL036W YER045C orf19.6102 0.60972 -0.08006 8 2
YJL084C YKR021W orf19.5605 0.57884 -0.0794 43 26
YOR108W LEU4 orf19.6086 0.80251 -0.04464 6 16
YKR027W CHS6 orf19.5155 0.54734 -0.03258 9 17
YHR149C YGR221C orf19.1426 0.65 0.010312 27 15
YGL133W YPL216W orf19.5510 0.67582 0.050333 33 11
YER119C YBL089W orf19.1210 0.84012 0.06238 22 14
RSC6 SNF12 orf19.2265 0.68101 0.068833 13 31
HXK2 HXK1 orf19.542 0.71034 0.10264 18 9
YLL010C YLR019W orf19.5406 0.82661 0.11215 13 8
AAP1' APE2 orf19.5197 0.59717 0.14552 7 11
YGL144C YDL109C orf19.3991 0.82365 0.17816 41 21
PMT2 PMT3 orf19.6812 0.75012 0.26011 57 10
NHP6A YBR089CA orf19.4623.3 0.78273 0.3078 1 0
MKK2 MKK1 orf19.6889 0.77227 0.31153 7 10
YBR238C YGL107C orf19.7459 0.69723 0.40045 2 0
CDC19 PYK2 orf19.3575 0.81763 0.4044 56 12
*'Conserved' and 'Divergent' refer to the duplicates from S. cerevisiae with high and low expression similarity to the ortholog from C. albicans,
respectively.
†
Expression conservation between the conserved (EC
1
) and divergent (EC
2
) copies and their reconstructed ancestor.
‡
Number of
amino acid substitutions between the conserved (AA
1
) and divergent (AA
2
) copies and their reconstructed ancestor.
Genome Biology 2007, Volume 8, Issue 4, Article R50 Tirosh and Barkai R50.7
comment reviews reports refereed researchdeposited research interactions information
Genome Biology 2007, 8:R50
1. This pattern is consistent with regulatory neofunctionaliza-
tion, suggesting that the conserved copy has retained the
ancestral function while the divergent copy performs a novel
or altered function.
To verify the asymmetric divergence of these duplicate pairs
we also performed an ancestral reconstruction analysis; since
our method relies on correlations of expression with multiple
genes, we performed a parsimony-based reconstruction [23]
for each correlation value (see Materials and methods). This
allowed us to decompose the expression divergence of each
duplicate gene into two components: duplicate versus ances-
tor and ancestor versus C. albicans ortholog (Figure 3c). By
definition, the ancestral reconstruction procedure tends to
estimate an ancestral state that is an intermediate between
the two duplicates. However, asymmetric expression diver-
gence was still evident when examining the duplicate versus
ancestor expression similarity (Table 1 and Figure 3c). In all
cases, the expression similarity of the divergent copy was
much lower than that of the conserved copy, and in most
cases even lower than zero. Furthermore, the predicted
ancestral expression patterns were more similar to the C.
albicans patterns in duplicate pairs with asymmetric diver-
gence compared to duplicate pairs with conserved expression
(Figure 3c; p = 0.004 in a Wilcoxon rank sum test). This
implies that expression of the duplicate pairs with asymmet-
ric divergence is, in general, highly conserved, and divergence
in these cases was restricted to one of the copies after
duplication.
Properties of duplicates predicted to undergo
regulatory neofunctionalization
Within a duplicate pair predicted to undergo regulatory neo-
functionalization, our analysis distinguishes the conserved
from the divergent copy. We next compared the set of con-
served copies with that of the divergent copies using several
datasets. First, we examined the fraction of essential genes
[20] in the two gene sets. While eight of the conserved copies
are essential, all of the divergent copies are dispensable (Fig-
ure 4). Second, we examined the extent of sequence variabil-
ity [24], as well as expression variability [25], of these genes
among the closely related sensu-stricto species, which
diverged from S. cerevisiae long after the WGD. In both cases,
the divergent copies were, on average, more variable than the
conserved ones (Figure 4), indicating that they are still evolv-
ing rapidly. Taken together, these results suggest that the
conserved copies typically perform stable and important
functions, while the divergent copies are dispensable and
undergoing continuous fine-tuning, as expected for newly
derived functions.
Whole-genome versus smaller-scale duplications
Recent studies have suggested that duplicate pairs arising
from a WGD event have different characteristics to those aris-
ing from smaller-scale duplications [26-28]. To examine if
this is the case with respect to gene expression evolution, we
repeated the analysis presented above with 46 gene pairs
from S. cerevisiae that were predicted to arise from small-
scale duplications after speciation from C. albicans (see
Materials and methods). Interestingly, only 1 duplicate pair
had asymmetric expression divergence while 14 duplicate
pairs had conserved expression (see Additional data file 3).
This ratio is much different from the results in the WGD anal-
ysis where 43 duplicate pairs had asymmetric expression
divergence and only 28 duplicate pairs had conserved expres-
sion. This difference may indicate that divergence of WGD
duplicates is more likely to occur through regulatory diver-
gence compared with small-scale duplicates.
Properties of duplicates with predicted ancestral or novel functionsFigure 4
Properties of duplicates with predicted ancestral or novel functions.
Duplicate gene pairs with asymmetric expression divergence are predicted
to evolve by neofunctionalization, such that the copy with the higher EC
(conserved) retained the ancestral function and the copy with the lower
EC (divergent) performs a novel function. The percentage of essential
genes, the average normalized sequence divergence [24] and the average
normalized expression divergence [25] are shown for the conserved
duplicates, divergent duplicates and all duplicates. Error-bars correspond
to standard error, calculated by bootstrapping with 1,000 repeats.
Conserved
Divergent
All duplicates
Percentage
essentialdivergence
Expression
Sequence
divergence
R50.8 Genome Biology 2007, Volume 8, Issue 4, Article R50 Tirosh and Barkai />Genome Biology 2007, 8:R50
Divergence of protein sequence versus expression
pattern
We asked whether the observed asymmetry in the evolution
of duplicates' expression patterns is correlated with asym-
metric evolution of protein sequences [17,29,30]. To this end,
we used a parsimony-based approach to asses the protein
sequence divergence of each of the WGD duplicates from
their pre-duplication ancestors (see Materials and methods
and Table 1). We then compared the asymmetry of protein
sequence divergence with that of expression divergence as
estimated in the ancestral reconstruction analysis (Figure 5;
see Materials and methods). The two measures of asymmetry
are only weakly correlated (r = 0.15, p = 0.11). While most of
the copies with asymmetric expression divergence also have
high asymmetry of sequence divergence, others show similar
levels of sequence divergence, and some even show an oppo-
site trend where the divergent copy in terms of expression is
more conserved in terms of sequence (negative sequence
divergence asymmetry in Figure 5). These results suggest that
although in many cases protein sequence and expression
divergence are correlated, they represent distinct evolution-
ary mechanisms for the acquisition of novel functions.
Discussion
We developed a new method for comparative analysis of
genome-wide expression data (ICC) and applied it to charac-
terize the diversification of yeast duplicates that originated at
the WGD event. We identified a natural separation of dupli-
cate pairs into two classes. The first class includes duplicates
with symmetric expression divergence, such that both S. cer-
evisiae gene pairs displayed similar conservation with their C.
albicans ortholog. The expression of many of these duplicate
pairs is highly correlated (not shown), suggesting that they
were retained by selection for high protein dosage or evolved
through other functional aspects, such as protein structure or
interactions.
The second class includes 43 duplicate gene pairs in which
one copy showed a significant expression similarity to the C.
albicans ortholog while the other copy displayed no similarity
to the C. albicans ortholog. Some of these cases may repre-
sent neutral evolution of gene expression that has no func-
tional significance. Alternatively, these cases may involve
regulatory neofunctionalization. Although our method is not
capable of detecting the action of directional selection, as
required for neofunctionalization, the high conservation of
one copy and the total lack of conservation of the other copy
appear to be inconsistent with a neutral model. We thus inter-
preted this class as enriched with cases of regulatory
neofunctionalization.
Another alternative interpretation is that this pattern indi-
cates evolution by subfunctionalization, whereby the expres-
sion of the ancestral gene is partitioned between the two
copies [4,11]. Our method does not compare the expression of
duplicates and their orthologs under the same conditions,
and thus subfunctionalization can lead to different patterns of
expression conservation and is difficult to infer. In contrast,
the neofunctionalization model clearly predicts that the gene
with ancestral function will have high expression
conservation, while the gene with derived function has low
expression conservation. Our observations are, therefore,
more consistent with the neofunctionalization model. It is
important to note, however, that the neofunctionalization
and subfunctionalization models are not mutually exclusive.
For example, duplicates can evolve by subfunctionalization in
terms of protein structure but by neofunctionalization in
terms of expression profile. Furthermore, an initial subfunc-
tionalization can be followed by neofunctionalization [31].
Our interpretation of neofunctionalization of the indicated
genes is supported by their increased dispensability and
enhanced variability in sequence and expression among
closely related yeast species. Importantly, each of these 43
cases (Table 1) entails a prediction for the function of the
ancestral protein in C. albicans and the evolutionary trajec-
tory of the duplicate pair.
The new functions encoded by genes that evolved by neofunc-
tionalization probably had an important role in the adapta-
tion of yeast following the WGD. Perhaps the most significant
adaptation of the S. cerevisiae lineage was the transformation
from aerobic to predominantly anaerobic metabolism [32].
Asymmetric evolution of protein sequence and expression patternFigure 5
Asymmetric evolution of protein sequence and expression pattern. Scatter
plot for asymmetry in expression and sequence divergence of the WGD
duplicate pairs. Only duplicate pairs where more than 20 amino acid
substitutions were predicted in at least one of the copies are included (see
Materials and methods and Table 1). Red circles indicate duplicates with
asymmetric expression divergence as defined in Figure 3. The line indicates
the linear regression. The sign of sequence divergence asymmetry
indicates the consistency between sequence and expression divergence
(that is, negative values refer to duplicate pairs where the faster evolving
copy in terms of sequence is the slower evolving copy in terms of
expression).
0 0.1 0.2 0.3 0.4 0.5 0.6 0.7 0.8 0.9
−1
−0.8
−0.6
−0.4
−0.2
0
0.2
0.4
0.6
0.8
1
Expression divergence asymmetry
Sequence divergence asymmetry
Genome Biology 2007, Volume 8, Issue 4, Article R50 Tirosh and Barkai R50.9
comment reviews reports refereed researchdeposited research interactions information
Genome Biology 2007, 8:R50
This adaptation involved the generation of novel pathways,
most notably the repression of oxidative phosphorylation and
related processes in the presence of glucose, known as glucose
repression [33]. Indeed, of the duplicate pairs with asymmet-
ric expression evolution at least two encode isoenzymes, and
in these pairs the genes encoding the predicted novel function
(HXK1 and PYK2) are under the control of the glucose repres-
sion pathway, while the genes encoding the predicted ances-
tral function (HXK2 and CDC19) are not repressed by glucose
[34,35]. Another pair of isoenzymes (APA1 and APA2), which
are ATP adenylyltransferases whose functional distinction is
unclear, shows a similar pattern of regulation. The enzyme
with the predicted novel function (APA2) is co-regulated with
the anaerobic genes (expression correlation r = 0.4875 for
HXK1 and r = 0.3966 for PYK2 in the S. cerevisiae dataset),
while the enzyme with the predicted ancestral function
(APA1) is co-regulated with the aerobic genes (expression
correlation r = 0.5220 for HXK2 and r = 0.2940 for CDC19 in
the S. cerevisiae dataset). This observation suggests that
APA2 is the anaerobic ATP adenylyltransferase while APA1 is
the aerobic one.
Neofunctionalization could also refine the function of existing
complexes by creating specialized subunits with an elaborate
regulation. For example, two of the duplicate gene pairs pre-
dicted to have evolved by neofunctionalization are alternative
subunits of the same complex: EGD1 and BTT1 of the nascent
polypeptide-associated complex [17,36], and FKS1 and GSC2
of beta-1,3-glucan synthase. Similarly, the transcription fac-
tors GZF3 (conserved) and DAL80 (divergent) are two regu-
lators of nitrogen metabolism that can homo- or hetero-
dimerize [37], presumably leading to different activities.
These cases may provide examples where regulation of the
alternative subunits' expression determines the composition
of the complex at any cellular state, and thus dictates its con-
dition-dependent function.
Conclusion
Genes can evolve new functions by modulation of different
characteristics, including the structure, physical interactions,
expression patterns and localization of the proteins they
encode. A comprehensive understanding of functional diver-
gence thus requires an integrated analysis of different meas-
ures of divergence. Here, we studied the expression
divergence of yeast duplicate pairs and identified 43 pairs
with asymmetric divergence that is compatible with regula-
tory neofunctionalization. Importantly, most of these were
not identified by sequence analysis [2] and, in general, the
asymmetry of sequence divergence and that of expression
divergence were only marginally correlated. Future studies
will undertake the challenge of integrating these and other
data types to provide a better understanding of the functional
diversification of genes following duplications.
Materials and methods
Definition of homology relationships
The Inparanoid software [18] was used to identify one-to-one
orthology between genes in S. cerevisiae and C. albicans.
Duplicate pairs from the WGD were taken from Kellis et al.
[2] and filtered with the following phylogenetic analysis: for
each duplicate pair we constructed a clustalw multiple align-
ment of the duplicates, their single K. waltii ortholog (which
was determined by synteny [2]) and all other matches from S.
cerevisiae and C. albicans with a BLAST p value smaller than
10
-4
. These alignments were used to construct a neighbor-
joining phylogenetic tree with the jukes-cantor distance, after
ignoring gaps. We then demanded that each tree (or its
subtree) contain only the pair of duplicates, the syntenic K.
waltii ortholog and a single C. albicans ortholog. To further
verify the C. albicans ortholog we also verified that the K.
waltii ortholog and one of the duplicates are its best matches
in the corresponding genomes.
The set of smaller-scale duplications was defined by: first,
taking all duplications predicted by Inparanoid (that is, clus-
ters of one C. albicans gene and two S. cerevisiae genes); sec-
ond, excluding those that were predicted to arise from the
WGD [2]; and third, filtering the remaining set using the phy-
logenetic analysis described above.
Method for comparative analysis of gene expression
Expression datasets for S. cerevisiae and C. albicans contain-
ing multiple experimental conditions were collected as
described in Ihmels et al. [16]. These expression matrices
were restricted to genes for which orthology relationships
were identified and ordered accordingly (that is, equivalent
rows of the two matrices correspond to the expression
profiles of a pair of orthologs). Next, these matrices were con-
verted into correlation matrices by calculating, within each
organism, the Pearson correlation coefficient (PCC) between
the expression profiles of each pair of genes, over all the con-
ditions. The resulting matrices ( , ) contain all the
correlations between genes for which an orthology relation-
ship was defined (g = 1 n). These matrices have similar
dimensionality, and we proceeded by comparing equivalent
rows:
This corresponds to the initial estimation of expression con-
servation (EC) in which identical weights are given to the cor-
relations with all genes. We then iteratively refined this
measure by calculating a weighted correlation, where the
weight for a correlation with each gene is given by the EC of
that gene from the previous iteration:
R
gg
cer
,
R
gg
can
,
EC i PCC R R
ig
cer
ig
can
0
() ( , )
,,
=
EC i PCCw R R
kig
cer
ig
can
() ( , )
,,
=
′′
R50.10 Genome Biology 2007, Volume 8, Issue 4, Article R50 Tirosh and Barkai />Genome Biology 2007, 8:R50
where:
w
i
= EC
k - 1
(i)
g' = {l ∈ g | EC
k - 1
(l) > 0}
This procedure was repeated until convergence:
Finally, to validate the iterative heuristic, we calculated EC
scores when the initial weights were randomly selected:
where w
i
= rand([0,1]).
This was repeated ten times; in each case the algorithm
described above was applied until convergence and the EC
scores were compared to those without randomization. In all
cases the results from the randomized procedure were similar
to those of the original procedure (PCC > 0.99), indicating
that the original results reflect a global minimum.
Application to duplicate gene pairs
After EC scores were computed for all ortholog gene pairs,
these scores were used as weights for a similar analysis of
duplicates. For each pair of duplicates from S. cerevisiae and
their orthologs from C. albicans, we calculated two EC scores
for comparison of each of the duplicates with their ortholog.
mRNA and protein abundance
mRNA abundance averaged over various studies was taken
from Beyer et al. [22], and protein abundance was taken from
Ghaemmaghami et al. [21]. These values were log
2
-tran-
formed, and then centered and normalized.
Ancestral reconstruction of expression correlations
Each gene in S. cerevisiae and C. albicans is represented in
our analysis by its expression correlation with a reference set
of one-to-one orthologs. Thus, for each pair of duplicates and
each reference gene, we performed ancestral reconstruction
to infer the correlation of the ancestral gene (before duplica-
tion) with the reference gene. Ancestral reconstruction is
done with a parsimony-based procedure [23], which uses the
correlation values in each of the duplicates and the C. albi-
cans ortholog to infer the ancestral correlation that mini-
mizes the total divergence of that value. The inferred
correlations with the entire reference set defines the ancestral
expression pattern that is then compared to the duplicate pair
and the C. albicans ortholog using the EC score defined
above.
Variability of protein sequence and expression profiles
Variability of protein sequences (adjusted Ka/Ks) among four
yeast species from the Saccharomyces sensu-stricto complex
were taken from [17], transformed as in the original study
(f(k) = Log [k + 0.001]), and normalized by subtracting their
mean and dividing by their standard deviation. Variability of
expression profiles in response to environmental stresses
among four yeast species from the Saccharomyces sensu-
stricto complex were taken from [18].
Protein sequence divergence
Multiple alignments of the duplicates and their single
orthologs from K. waltii and C. albicans were used to esti-
mate protein sequence divergence using a parsimony-based
approach. Namely, each position with the same amino acid in
the K. waltii ortholog, the C. albicans ortholog and at least
one of the duplicates was assumed to represent the ancestral
state before duplication; if the second duplicate had a differ-
ent amino acid at that position, then a substitution was
inferred. The number of substitutions inferred for each dupli-
cate gene is used as an estimate of protein sequence diver-
gence (Table 1).
Asymmetry of sequence and expression divergence
Asymmetry was defined as , where x
1
and x
2
are meas-
ures of divergence of the duplicate gene pair. For sequence
divergence x
i
represented the number of amino acid substitu-
tions and for expression divergence it was 1 - EC. For each
gene pair, x
1
was chosen as the copy with lower expression
conservation, such that asymmetry of expression divergence
is always positive and the sign of asymmetry of sequence
divergence reflects the congruence between sequence and
expression analyses (negative asymmetry of sequence diver-
gence means that the copy with lower expression conserva-
tion had higher sequence conservation). Note that this
measure is not equivalent to that used to detect extreme cases
of asymmetry where we demanded that one copy has EC >
0.372 and the other copy has EC < 0.
Additional data files
The following additional data are available with the online
version of this paper. Additional data file 1 is a table that lists
the expression conservation values of 2,644 orthologous pairs
from S. cerevisiae and C. albicans. Additional data file 2 is a
figure showing the high mRNA and protein abundance of
duplicated genes with conserved expression compared with
other duplicated genes. Additional data file 3 is a figure
showing the expression conservation of duplicated genes
from small-scale duplication events. In contrast to duplicates
from the WGD, there is only one case of asymmetric diver-
gence and many cases of conserved expression.
Additional data file 1Expression conservation values of 2,644 orthologous pairs from S. cerevisiae and C. albicansExpression conservation values of 2,644 orthologous pairs from S. cerevisiae and C. albicans.Click here for fileAdditional data file 2High mRNA and protein abundance of duplicated genes with con-served expression compared with other duplicated genesHigh mRNA and protein abundance of duplicated genes with con-served expression compared with other duplicated genes.Click here for fileAdditional data file 3Expression conservation of duplicated genes from small-scale duplication eventsIn contrast to duplicates from the WGD, there is only one case of asymmetric divergence and many cases of conserved expression.Click here for file
PCCw X Y
wX XY Y
wX X wY Y
ii i
ii ii
(,)
()()
()()
=
−−
−−
∑
∑∑
22
[ ( ) ( )] .EC i EC i
kk
ig
−<
−
∈
∑
1
2
01
EC i PCCw R R
ig
cer
ig
can
0
() ( , )
,,
=
xx
xx
12
12
−
+
Genome Biology 2007, Volume 8, Issue 4, Article R50 Tirosh and Barkai R50.11
comment reviews reports refereed researchdeposited research interactions information
Genome Biology 2007, 8:R50
Acknowledgements
We thank Yonatan Bilu and Andreas Doncic for critical reading and mem-
bers of our lab for helpful discussions. This work was supported by grants
from the Kahn fund for Systems Biology at the Weizmann Institute of Sci-
ence, the Tauber fund, the Israeli Ministry of Science and the Bi-national Sci-
ence Foundation (BSF).
References
1. Lynch M, Force A: The probability of duplicate gene preserva-
tion by subfunctionalization. Genetics 2000, 154:459-473.
2. Kellis M, Birren BW, Lander ES: Proof and evolutionary analysis
of ancient genome duplication in the yeast Saccharomyces
cerevisiae. Nature 2004, 428:617-624.
3. Li WH, Gu Z, Cavalcanti AR, Nekrutenko A: Detection of gene
duplications and block duplications in eukaryotic genomes. J
Struct Funct Genomics 2003, 3:27-34.
4. Prince VE, Pickett FB: Splitting pairs: the diverging fates of
duplicated genes. Nat Rev Genet 2002, 3:827-837.
5. Tischler J, Lehner B, Chen N, Fraser AG: Combinatorial RNA
interference in C. elegans reveals that redundancy between
gene duplicates can be maintained for more than 80 million
years of evolution. Genome Biol 2006, 7:R69.
6. Kafri R, Bar-Even A, Pilpel Y: Transcription control reprogram-
ming in genetic backup circuits. Nat Genet 2005, 37:295-299.
7. Nowak MA, Boerlijst MC, Cooke J, Smith JM: Evolution of genetic
redundancy. Nature 1997, 388:167-171.
8. Sugino RP, Innan H: Selection for more of the same product as
a force to enhance concerted evolution of duplicated genes.
Trends Genet 2006, 22:642-644.
9. King MC, Wilson AC: Evolution at two levels in humans and
chimpanzees. Science 1975, 188:107-116.
10. Adams KL, Wendel JF: Novel patterns of gene expression in
polyploid plants. Trends Genet 2005, 21:539-543.
11. Duarte JM, Cui L, Wall PK, Zhang Q, Zhang X, Leebens-Mack J, Ma
H, Altman N, dePamphilis CW: Expression pattern shifts follow-
ing duplication indicative of subfunctionalization and neo-
functionalization in regulatory genes of Arabidopsis.
Mol Biol
Evol 2006, 23:469-478.
12. Li WH, Yang J, Gu X: Expression divergence between duplicate
genes. Trends Genet 2005, 21:602-607.
13. Wolfe KH, Shields DC: Molecular evidence for an ancient dupli-
cation of the entire yeast genome. Nature 1997, 387:708-713.
14. Gu Z, Nicolae D, Lu HH, Li WH: Rapid divergence in expression
between duplicate genes inferred from microarray data.
Trends Genet 2002, 18:609-613.
15. Gu X, Zhang Z, Huang W: Rapid evolution of expression and
regulatory divergences after yeast gene duplication. Proc Natl
Acad Sci USA 2005, 102:707-712.
16. Ihmels J, Bergmann S, Berman J, Barkai N: Comparative gene
expression analysis by differential clustering approach: appli-
cation to the Candida albicans transcription program. PLoS
Genet 2005, 1:e39.
17. Dutilh BE, Huynen MA, Snel B: A global definition of expression
context is conserved between orthologs, but does not corre-
late with sequence conservation. BMC Genomics 2006, 7:10.
18. Remm M, Storm CE, Sonnhammer EL: Automatic clustering of
orthologs and in-paralogs from pairwise species
comparisons. J Mol Biol 2001, 314:1041-1052.
19. Ihmels J, Bergmann S, Gerami-Nejad M, Yanai I, McClellan M, Berman
J, Barkai N: Rewiring of the yeast transcriptional network
through the evolution of motif usage. Science 2005,
309:938-940.
20. Giaever G, Chu AM, Ni L, Connelly C, Riles L, Veronneau S, Dow S,
Lucau-Danila A, Anderson K, Andre B, et al.: Functional profiling
of the Saccharomyces cerevisiae genome. Nature 2002,
418:387-391.
21. Ghaemmaghami S, Huh WK, Bower K, Howson RW, Belle A,
Dephoure N, O'Shea EK, Weissman JS: Global analysis of protein
expression in yeast. Nature 2003,
425:737-741.
22. Beyer A, Hollunder J, Nasheuer HP, Wilhelm T: Post-transcrip-
tional expression regulation in the yeast Saccharomyces cere-
visiae on a genomic scale. Mol Cell Proteomics 2004, 3:1083-1092.
23. Rossnes R, Eidhammer I, Liberles DA: Phylogenetic reconstruc-
tion of ancestral character states for gene expression and
mRNA splicing data. BMC Bioinformatics 2005, 6:127.
24. Wall DP, Hirsh AE, Fraser HB, Kumm J, Giaever G, Eisen MB, Feld-
man MW: Functional genomic analysis of the rates of protein
evolution. Proc Natl Acad Sci USA 2005, 102:5483-5488.
25. Tirosh I, Weinberger A, Carmi M, Barkai N: A genetic signature of
interspecies variations in gene expression. Nat Genet 2006,
38:830-834.
26. Davis JC, Petrov DA: Do disparate mechanisms of duplication
add similar genes to the genome? Trends Genet 2005,
21:548-551.
27. Guan Y, Dunham MJ, Troyanskaya OG: Functional analysis of
gene duplications in Saccharomyces cerevisiae. Genetics 2007,
175:933-943.
28. Casneuf T, De Bodt S, Raes J, Maere S, Van de Peer Y: Nonrandom
divergence of gene expression following gene and genome
duplications in the flowering plant Arabidopsis thaliana.
Genome Biol 2006, 7:R13.
29. Wagner A: Decoupled evolution of coding region and mRNA
expression patterns after gene duplication: implications for
the neutralist-selectionist debate. Proc Natl Acad Sci USA 2000,
97:6579-6584.
30. Kim SH, Yi SV: Correlated asymmetry of sequence and func-
tional divergence between duplicate proteins of Saccharomy-
ces cerevisiae. Mol Biol Evol 2006, 23:1068-1075.
31. He X, Zhang J: Rapid subfunctionalization accompanied by
prolonged and substantial neofunctionalization in duplicate
gene evolution. Genetics
2005, 169:1157-1164.
32. Piskur J, Langkjaer RB: Yeast genome sequencing: the power of
comparative genomics. Mol Microbiol 2004, 53:381-389.
33. Carlson M: Glucose repression in yeast. Curr Opin Microbiol 1999,
2:202-207.
34. Boles E, Schulte F, Miosga T, Freidel K, Schluter E, Zimmermann FK,
Hollenberg CP, Heinisch JJ: Characterization of a glucose-
repressed pyruvate kinase (Pyk2p) in Saccharomyces cerevi-
siae that is catalytically insensitive to fructose-1,6-bisphos-
phate. J Bacteriol 1997, 179:2987-2993.
35. Rodriguez-Trelles F, Tarrio R, Ayala FJ: Evolution of cis-regulatory
regions versus codifying regions. Int J Dev Biol 2003, 47:665-673.
36. Reimann B, Bradsher J, Franke J, Hartmann E, Wiedmann M, Prehn S,
Wiedmann B: Initial characterization of the nascent polypep-
tide-associated complex in yeast. Yeast 1999, 15:397-407.
37. Svetlov VV, Cooper TG: The Saccharomyces cerevisiae GATA
factors Dal80p and Deh1p can form homo- and het-
erodimeric complexes. J Bacteriol 1998, 180:5682-5688.