Báo cáo y học: "Adenovirus type 5 exerts genome-wide control over cellular programs governing proliferation, quiescence, and survival" pptx
Bạn đang xem bản rút gọn của tài liệu. Xem và tải ngay bản đầy đủ của tài liệu tại đây (1.22 MB, 19 trang )
Open Access
Volume
et al.
Miller
2007 8, Issue 4, Article R58
Research
Daniel L Miller*†, Chad L Myers‡§, Brenden Rickards*, Hilary A Coller* and
S Jane Flint*
Correspondence: S Jane Flint. Email:
Published: 12 April 2007
reviews
Addresses: *Department of Molecular Biology, Princeton University, Princeton, NJ 08544, USA. †Laboratory of Genetics, University of
Wisconsin, 425-G Henry Mall, Madison, Wisconsin 53706, USA. ‡Lewis-Sigler Institute for Integrative Genomics, Carl Icahn Laboratory,
Princeton University, Princeton, NJ 08544, USA. §Department of Computer Science, Princeton University, Princeton, New Jersey 08544, USA.
comment
Adenovirus type 5 exerts genome-wide control over cellular
programs governing proliferation, quiescence, and survival
Received: 4 August 2006
Revised: 20 October 2006
Accepted: 12 April 2007
Genome Biology 2007, 8:R58 (doi:10.1186/gb-2007-8-4-r58)
The electronic version of this article is the complete one and can be
found online at />
Background: Human adenoviruses, such as serotype 5 (Ad5), encode several proteins that can
perturb cellular mechanisms that regulate cell cycle progression and apoptosis, as well as those that
mediate mRNA production and translation. However, a global view of the effects of Ad5 infection
on such programs in normal human cells is not available, despite widespread efforts to develop
adenoviruses for therapeutic applications.
The Adenoviridae are nonenveloped viruses of mammals and
birds that are characterized by linear, double-stranded DNA
genomes of 34 to 43 kilobases (kb) and strikingly icosahedral
capsids that carry projecting fibers at each of the 12 vertices.
Since the first adenovirus was isolated from human adenoid
tissue in 1953, some 50 human serotypes have been identified
and associated with various syndromes, including upper
Genome Biology 2007, 8:R58
information
Background
interactions
Conclusion: These findings establish that the impact of adenovirus infection on host cell programs
is far greater than appreciated hitherto. Furthermore, they provide a new framework for
investigating the molecular functions of viral early proteins and information relevant to the design
of conditionally replicating adenoviral vectors.
refereed research
Results: We used two-color hybridization and oligonucleotide microarrays to monitor changes in
cellular RNA concentrations as a function of time after Ad5 infection of quiescent, normal human
fibroblasts. We observed that the expression of some 2,000 genes, about 10% of those examined,
increased or decreased by a factor of two or greater following Ad5 infection, but were not altered
in mock-infected cells. Consensus k-means clustering established that the temporal patterns of
these changes were unexpectedly complex. Gene Ontology terms associated with cell proliferation
were significantly over-represented in several clusters. The results of comparative analyses
demonstrate that Ad5 infection induces reversal of the quiescence program and recapitulation of
the core serum response, and that only a small subset of the observed changes in cellular gene
expression can be ascribed to well characterized functions of the viral E1A and E1B proteins.
deposited research
Abstract
reports
© 2007 Miller et al; licensee BioMed Central Ltd.
This is an open access article distributed under the terms of the Creative Commons Attribution License ( which
permits unrestricted use, distribution, and reproduction in any medium, provided the original work is properly cited.
Thefibroblasts. About 2,000 geneson type the core serum response.
infection and Ad5 were studied shown to induce reversal ofHost-cell regulation through recapitulation of 5hostdown-regulatedsuch as cell-cycle regulation, infection was in a microarray analysis of
the quiescence of the adenovirus Ad5 were uphuman effects program and adenovirus basic or cell programs, after Ad5
R58.2 Genome Biology 2007,
Volume 8, Issue 4, Article R58
Miller et al.
respiratory tract infections in young children, acute respiratory disease in military recruits, epidemic keratoconjunctivitis, and gastroenteritis. However, it was the demonstration
that some human adenoviruses induce tumors in laboratory
animals [1] that greatly increased interest in these viruses and
their interactions with host cells. Although human adenoviruses can be classified as highly oncogenic, weakly oncogenic,
or non-oncogenic in rodents, all transform rodent cells in culture [2].
The viral E1A and E1B early genes are necessary and sufficient
for transformation, and E1A can also transform normal cells
in cooperation with other oncogenes, such as activated RAS
[2]. Investigation into the mechanisms by which the E1A and
E1B gene products transform cells has yielded important
insights into the cellular pathways that control cell cycle progression and programmed cell death, in particular the roles of
the tumor suppressor proteins Rb (retinoblastoma protein)
and p53 [3-7]. In addition, studies of the viral replication
cycle in permissive cells have made major contributions to
elucidating fundamental cellular processes, most famously
with the discovery of pre-mRNA splicing [8,9].
The infectious cycle of subgroup C human adenovirus, such as
adenovirus type 5 (Ad5), in permissive cells in culture is characterized by a strict temporal program of viral gene expression that culminates in production of large quantities of viral
DNA and structural proteins. Viral protein encoding genes
are transcribed by the RNA polymerase II transcriptional
apparatus of the host, but viral proteins or processes orchestrate the strict temporal sequence in which viral genes are
expressed [2]. The first to be transcribed following entry of
DNA genomes into host cell nuclei is the E1A immediate early
gene. The two most abundant E1A proteins, which are produced by translation of alternatively spliced mRNAs, differ
only in the presence in the larger of an internal sequence of 43
amino acids. This segment is one of four E1A protein
sequences that are conserved among primate adenoviruses,
and denoted conserved region (CR)1 to CR4 [10-12]. It (CR3)
is essential for efficient progression beyond the immediate
phase of the infectious cycle because it mediates activation of
transcription from viral early promoters by the larger E1A
protein [13-17]. Such stimulation appears to result from the
interaction of CR3 with a subunit of the mediator [18-21], a
multiprotein complex that can act as a co-activator or corepressor of transcription by RNA polymerase II [22,23].
CR2, which is common to both E1A proteins, probably contributes to activation of transcription of the viral E2 early
(E2E) gene. The E2E promoter contains two binding sites for
sequence-specific transcriptional activators of the E2F family
[24]. The transcriptional functions of E2Fs are regulated by
binding of the Rb protein, which represses E2F-dependent
transcription [3-5,25]. A conserved motif within CR2 of E1A
proteins binds to the same sequence of the Rb proteins as do
E2Fs, and therefore can liberate E2Fs from inhibitory inter-
/>
actions with Rb family members. This interaction of E1A proteins with Rb is necessary for the mitogenic activity of the
viral proteins in primary cells, and for their ability to transform nonpermissive cells in conjunction with the viral E1B
gene or an activated RAS oncogene [26-31].
Transcription of viral early genes leads to synthesis of some 17
early proteins, many of which perturb host cell (or host) physiology. For example, several E3 proteins block host immune
responses [32,33]. The two E1B proteins can protect infected
cells against apoptosis. The E1B 19 kDa protein is a homolog
of the cellular antiapoptotic protein Bcl, which inhibits the
proapoptotic Bax [3,4,34]. In contrast, the E1B 55 kDa protein counters the consequences of activation of the tumor
suppressor p53. Binding of this E1B protein to p53 converts
the cellular protein from an activator to a repressor of transcription [35,36] and, in conjunction with the viral E4 orf6
protein, the E1B protein induces accelerated degradation of
p53 [37-39]. Once the viral E2 replication proteins have
attained sufficient concentrations, viral DNA synthesis commences. This event marks the transition to the late phase of
infection and is necessary for activation of the late transcriptional program. Viral DNA synthesis dependent titration of a
cellular repressor permits transcription from the promoter of
the late IVa2 gene [40,41], which encodes a sequence-specific
DNA-binding protein that has been implicated in stimulation
of transcription from the major late (ML) promoter [42,43].
Transcription from the ML promoter, in conjunction with
alternative processing of ML pre-mRNAs, leads to production
of some 15 mRNAs, most of which encode viral structural proteins [2].
As noted above, investigation into interactions among adenoviral and cellular components has greatly improved our
understanding of several fundamental processes and the
impact of viral gene products on multiple cellular pathways.
It has also set the stage for current efforts to develop adenovirus vectors for therapeutic applications. Much effort has been
devoted to the design of vectors for delivery of endogenous
genes. Within this context a major goal is to minimize host
immune responses to the vector, for example by preventing
expression of viral genes and viral replication [44-47]. In contrast, the development of conditionally replicating adenoviruses for selective killing of tumor cells depends on efficient
replication in transformed but not in normal cells [48-50].
Nevertheless, replication of the virus in normal human cells
has received little attention, despite hints of significant differences when Ad5 infects normal as compared to transformed
cells. For example, the 243R protein is dispensable for Ad5
replication in transformed HeLa cells, but it is required for
maximal replication in normal lung fibroblasts [30]. Similarly, the E1B 55 kDa protein is necessary for efficient viral
DNA synthesis in Ad5 infected primary human fibroblasts but
not in established lines of human cells [51]. Although informative, such studies of individual viral gene products cannot
determine the degree to which interactions of Ad5 with host
Genome Biology 2007, 8:R58
/>
Genome Biology 2007,
Results and discussion
Kinetics of the Ad5 infectious cycle
information
Genome Biology 2007, 8:R58
interactions
As a comparison with our simple filter for differential expression, we applied significance analysis of microarrays (SAM)
[53]. Specifically, we looked for genes that were significantly
differentially regulated at two different times after infection,
as compared with the triplicate zero time point measurements. To overcome the absence of replicate measurements
of Ad5 infected cells, we treated the three measurements surrounding both 26 and 40 hours as triplicate measurements.
Two groups of measurements, the first taken at 24, 26, and 28
hours after infection and the second group taken at 38, 40,
and 42 hours, were tested independently for differential
expression compared with the triplicate zero time point. To
make the SAM results comparable with the results of our twofold filter discussed above, we excluded all genes that
refereed research
We conducted two-color hybridizations using Agilent 44k
Whole Genome microarrays to examine time-dependent
changes in the concentrations of cellular RNA species in
HFFs after Ad5 or mock infection. Infected cells were harvested after various periods of infection, as described above,
Application of these criteria identified 2,104 genes (unique
Unigene clusters), of the 20,590 on the arrays, whose expression exhibited a sustained change of twofold or greater following Ad5 infection, but were not significantly altered in
mock infected cells. (For a complete list of genes that pass
these filters, see Additional data file 1. The complete unfiltered dataset can be accessed at the Princeton University
Microarray database [PUMA] [52].)
deposited research
Overview of alterations in cellular gene expression
induced by Ad5 infection
For each hybridization, variations in the input of labeled
cRNA were corrected by a standard computational dye normalization (see Materials and methods, below). To facilitate
comparison of the response profiles of individual probes with
each other and with the temporal origin of the experiment, we
zero transformed the data by probe; the log2 expression values of each probe in the mock and Ad5 time courses were linearly transformed by subtracting the mean values of the
corresponding zero samples. Finally, to isolate a core set of
probes that exhibited significant changes in expression specifically in response to Ad5 infection, we applied the following
intensity filters; probes were required to exhibit a log2 expression value ≥ 1 (equivalent to 2-fold change) at at least three
time points in the Ad5-infected series, and a log2 expression
value ≤ 0.4 (equivalent to 1.3-fold change) in no more than
two arrays in the mock infected series.
reports
Infected cells were harvested in parallel with those from
which cellular RNA was isolated, and total DNA or protein
extracts prepared from them as described in Materials and
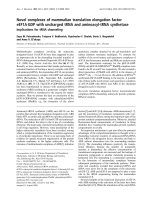
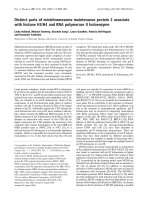
methods (below). The results of immunoblotting indicated
that the viral early E2 single-stranded DNA-binding protein
was present at a low concentration at 18 hours after infection,
and at a substantially higher concentration by 24 hours (Figure 1a). In contrast, the late structural protein, protein V, was
not clearly detected until 30 hours after infection, whereas
the first increase in the intracellular concentration of viral
DNA was observed between 26 and 28 hours after infection
(Figure 1a,b). These data establish that in Ad5 infected, contact inhibited human foreskin fibroblasts (HFFs), the early
and late phases of infection begin at around 18 hours and
between 26 and 28 hours after infection, respectively. A similar time course of synthesis of other viral early and late proteins was observed when HFFs infected under the same
conditions were examined by immunofluorescence (data not
shown). These experiments also indicated that the viral
immediate early E1A proteins, which are required for efficient
transcription from all early promoters, such as that of the E2
transcription unit (see Background, above), were first made
between 12 and 16 hours after infection. The onset of the synthesis of viral macromolecules is considerably delayed under
these conditions as compared with the infectious cycle in
established lines of human cells, such as HeLa cells, but it is
very similar to that observed previously in subconfluent, proliferating HFFs [51].
whereas duplicate samples of mock infected cells were collected at 24 and 48 hours. Zero time point samples for each
time course (two zeros for the mock and three for the Ad5
infection) were collected immediately after the 1 hour adsorption period. Labeled cRNAs prepared from Ad5 or mock
infected samples (red channel) were hybridized competitively
with approximately equal concentrations of a common reference cRNA (green channel). The reference cRNA was made
from a mixture of RNAs originating from a diverse set of
human cells and cell lines. These differed in terms of history
(primary and transformed) and proliferation state (overgrown, cycling, and quiescent), and were chosen in order to
maximize the diversity of detectable cellular transcripts, by
minimizing the number of probes on the arrays with belowbackground signals in the reference channel.
reviews
To provide a temporal framework within which to interpret
changes in cellular gene expression induced by Ad5 infection
of normal human fibroblasts, we first examined the accumulation of viral DNA, as well as of early and late viral proteins,
as a function of time of infection. The results of preliminary
experiments were used to design a time series that covered
the entire infectious cycle, while focusing on the period (18 to
42 hours after infection) in which synthesis of viral macromolecules and changes in viral gene expression were
maximal.
Miller et al. R58.3
comment
cell systems differ in established and normal cells. As a first
step to address this important issue, we have undertaken a
global analysis of the changes in cellular gene expression that
accompany progression through the viral infectious cycle in
normal human fibroblasts.
Volume 8, Issue 4, Article R58
R58.4 Genome Biology 2007,
(a)
0
(b)
0
Volume 8, Issue 4, Article R58
12 18 24
12
18
26 28
24
Miller et al.
/>
30 32 34 36
26 28
30
32
38
34
40
36
42
38
48 54 Ad5 Hu
40
42
48
54
Hrs p i
Hrs p i
E2-ssBP
Protein V
α β-actin
Figure of
Kinetics 1 the Ad5 infectious cycle in quiescent HFFs
Kinetics of the Ad5 infectious cycle in quiescent HFFs. Quiescent human foreskin fibroblasts (HFFs) were infected with 30 plaque forming units/cell
adenovirus type 5 (Ad5) and total DNA or protein extracts prepared after various periods of infection, as described in Materials and methods. (a)
Concentrations of viral DNA were determined by limiting polymerase chain reaction amplification of a sequence with the E1A gene. Purified Ad5 (Ad5)
and human (Hu) DNAs were amplified as positive and negative controls, respectively. (b) The viral early E2 and late V proteins, and the cellular β-actin
protein were examined by immunoblotting.
exhibited any change in response to mock infection. We then
performed independent two-class unpaired analysis for the
two sets of pseudo-replicates centered at 26 and 40 hours,
and combined the results of these two tests. Using a false discovery rate of no more than 0.1%, we identified 5,262 genes
that are differentially expressed at 26 or 40 hours after infection. This number far exceeds the 2,104 that pass the fold
change filters. In addition, 96% of the genes that pass the fold
change filter above were also found by the SAM analysis to
exhibit statistically significant differential expression (P < 1010). Thus, our fold change criteria defined a subset of statistically significantly differentially expressed genes that exhibit
the strongest changes in mRNA levels in response to Ad5
infection.
The concentrations of a subset of the cellular RNAs that
exhibited changes in response to Ad5 infections satisfying our
fold change filter were determined using an alternative
method, namely reverse transcription (RT)-polymerase chain
reaction (PCR). In parallel, we examined the same RNAs in
samples isolated at various times after two additional and
independent infections of HFFs. Representative results of the
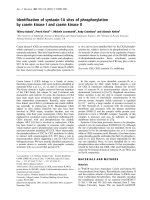
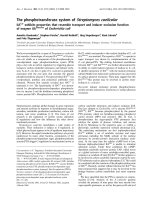
RT-PCR experiments are shown for CDC6 RNA in Figure 2a.
Although the absolute quantities of CDC6 RNA present after
increasing periods of infection varied among infections, the
temporal patterns of changes in concentration were the same
in all cases. The gene expression patterns for 16 different
genes were determined by RT-PCR. The data were zero transformed and converted to log2 values for comparison with the
microarray data (Figure 2b and Additional data file 2). The
two methods of analysis yielded closely similar patterns of
temporal changes in expression for 14 of the 16 genes examined (87.5%), as illustrated in Figure 2b for two RNAs that
differed in direction as well as magnitude of Ad5-induced
alterations. These results establish both the reproducibility of
the changes in cellular gene expression induced by Ad5 infection of quiescent HFFs and the reliability of the alterations
detected by hybridization to microarrays.
In addition to confirming our results by statistical and quantitative means, we wished to compare them with those of published reports of changes in cellular gene expression induced
by adenovirus infection. During the early phase of Ad5 infection of transformed HeLa cells, expression of 76 cellular
genes of the 12,309 examined was observed to be increased or
decreased by a factor of 1.5-fold or greater, whereas
Genome Biology 2007, 8:R58
/>
Genome Biology 2007,
(a)
Volume 8, Issue 4, Article R58
Miller et al. R58.5
(b)
comment
5
Exp 1
Exp 2
3
2
1
0
10
20
30
40
50
Hrs p.i.
-1
0
0
0
18
24 30 40
54
Hrs p.i.
-2
-3
E2F2-RTPCR
E2F2-Array
RHOQ-RTPC
RHOQ-Array
information
Genome Biology 2007, 8:R58
interactions
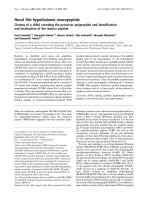
In this way, eight groups of genes were clearly distinguished
on the basis of the temporal patterns of alterations in the corresponding RNA concentrations induced by Ad5 infection
(Figure 4). Although approximately equal numbers of cellular
RNA species represented in the total dataset increased or
decreased in concentration during the viral infectious cycle
(data not shown), nearly two-thirds of the probe responses in
the filtered list exhibited an increase in RNA concentration.
refereed research
In order to identify groups of genes that exhibited significant
co-regulation, we chose to apply a k-means clustering algorithm to the filtered dataset. The clustering process begins by
randomly assigning all genes to k total clusters and computes
a centroid vector for each cluster. The algorithm then iteratively reassigns genes to clusters based on the closest match
(highest Pearson correlation) of individual expression vectors
to the cluster centroids, until no changes allow better matches
of gene to cluster means. To ensure that the final clustering
result was not sensitive to the initial, random assignment of
centroids, we report the consensus of 5,000 such runs of kmeans clustering. We determined an appropriate number of
clusters, k, by using figure of merit (FOM) analysis, which
measures the predictive power of a clustering result by leaving one condition out of the clustering process and measuring
how predictive the cluster centroids are of the held-out condition [60]. Details of the consensus clustering are discussed in
Materials and methods (below).
deposited research
Differences in the methods used to collect and analyze
hybridization data are likely to contribute to these seemingly
disparate responses to infection, as are the genetic histories of
the infected cells. Highly transformed and genetically abnormal cells, such as HeLa cells, are likely to be less sensitive to
stresses such as viral infection, and may have lost cellular
systems that are targeted by adenovirus in normal diploid
fibroblasts. For example, HeLa cells contain integrated copies
of the human papillomavirus type 18 oncogenes encoding the
E6 and E7 proteins [56], which, like adenoviral E1B and E1A
proteins (see Background, above), inactivate the cellular
tumor suppressors p53 and Rb, respectively [57-59]. However, as discussed below, an important determinant of the
extent to which cellular gene expression is reprogrammed in
Ad5 infected cells appears to be whether cells are proliferating (subconfluent HeLa cells) or quiescent (contact-inhibited
HFFs) at the time of infection. In addition to a larger number
of responsive genes, our analysis of cellular RNA concentrations at many time points has identified multiple temporal
responses to Ad5 infection.
Clustering of co-regulated genes
reports
Figure
Changes2in RNA concentrations in Ad5-infected HFFs determined by RT-PCR
Changes in RNA concentrations in Ad5-infected HFFs determined by RT-PCR. (a) Autoradiograms of products of reverse transcription (RT)-polymerase
chain reaction (PCR) amplification of CDC6 RNA isolated from human foreskin fibroblasts (HFFs) infected for the periods indicated. The RNA samples
used in experiment 1 were those also used for amplification and hybridization to microarrays, whereas experiments 2 and 3 total RNAs were from two
other independent infections of quiescent HFFs. (b) The RT-PCR signals for E2F2 and RHOQ RNAs from the three independent infections were
quantified, as described in Materials and methods, zero transformed against the mean of the three zero time point samples included in each experiment,
and converted to log2 values for comparison to the changes in concentration of these RNAs determined by hybridization to microarrays. Ad5, adenovirus
type 5.
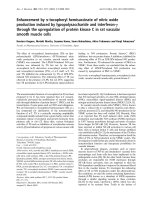
expression of 112 genes was specifically altered during the late
phase of infection [54,55]. The majority of these RNAs exhibited similar alterations in concentration following Ad5 infection of HFFs (Figure 3). However, expression was modulated
for a significantly larger proportion of the cellular genes
examined in Ad5-infected HFFs than in HeLa cells (10.5%
versus about 1.5%).
reviews
Exp 3
Log2 relative [RNA]
4
R58.6 Genome Biology 2007,
(a) Mock
0
Volume 8, Issue 4, Article R58
Miller et al.
(b) Mock
Adenovirus type 5
0
/>
Ad2
0
NR4A1
VMP1
BMP4
TP53AP1
RHOB
PGA5
ATF3
GADD45B
IL6
CXCL1
ID3
SNAI1
JUNB
KIAA0247
FBXO32
PLK2
GAS1
RNF19
CCL2
WNT5A
CTNS
GREM1
ADAMTS1
F3
C22orf16
ALPI
SRCRB4D
HNRPK
FLJ14299
TNKS1BP1
SMURF1
COL6A1
RNPC1
TLE3
GEMIN4
FUT4
POLR2A
BIRC5
P2RX5
FLJ10307
HSPA1L
C15orf19
ZNF503
Adenovirus type 5
0
Ad2
CLK1
RAD21
GTF2E1
GDA
CTGF
F3
GCLM
CAV2
KRT19
ARPC5
TMOD3
GNB2L1
TOB1
CCPG1
DDAH1
THBS1
SGK
AKR1C2
AKR1C3
HIF1A
TGFB1I4
ANXA1
ARHE
GAS1
LMO7
MAP2K3
SLC2A1
NFE2L2
LITAF
PLK2
DAZAP2
SLC38A2
SQSTM1
KLF10
MYC
JUNB
ETS2
DUSP1
CYR61
CEBPB
NFKBIA
CMKOR1
ID3
IL6
TNFAIP3
IER3
MT1E
KLF4
CKS2
NR4A1
NPTX1
CTF1
RPS10
WASL
VIL2
BRD2
DGKD
HSPA1L
PSCD1
RNPC1
PDLIM7
TGFB1I1
PICALM
EPHA2
P2RX5
AATF
CDC25A
SFRS1
CCT7
RAB9P40
FABP5
Pfs2
FKBP4
CACYBP
PSMC3
NME1
HIST1H2BK
HIST1H2BJ
CKB
GAL
MYBL2
LOC388524
SSB
KCNK1
CPS1
PGC
NFKB2
KYNU
KIF23
Figure 3
Comparison of adenovirus-induced changes in gene expression in HeLa cells and HFFs
Comparison of adenovirus-induced changes in gene expression in HeLa cells and HFFs. The genes reported to exhibit changes in expression at (a) 6 hours
or (b) 10 and 21 hours after infection of HeLa cells by adenovirus type 2 (Ad2) [54,55] were isolated from our dataset and clustered on the basis of their
responses to infection of human foreskin fibroblasts (HFFs). The changes observed in HeLa cells are summarized in the columns labeled Ad2, in which
yellow and blue represent increased and decreased expression respectively. In panel b, the HeLa response is based on the average of the two time points.
Ramps above panels indicate increases in time after infection.
Genome Biology 2007, 8:R58
/>
Adenovirus type 5
Volume 8, Issue 4, Article R58
DNA replication
1.03E-08
Cell cycle
2.22E-08
GO:0007067
Mitosis
9.76E-07
M phase
5.71E-06
Intracellular transport
4.15E-05
GO:0006913
Nucleocytoplasmic transport
1.04E-04
GO:0006281
DNA repair
<1.0E-11
GO:0006260
DNA replication
1.29E-08
GO:0007049
Cell cycle
1.77E-08
GO:0007046
Ribosome biogenesis
GO:0000279
1
RNA splicing
GO:0046907
12 18 24 26 28 30 32 34 36 38 40 42 48 54 60 hrs p i
GO:0008380
GO:0000087
0
GO term description
GO:0007049
24 48
GO term ID
GO:0006260
0
M phase
1.54E-04
GO:0006929
Substrate-bound cell migration
5.57E-04
GO:0031497
Chromatin assembly
1.19E-08
GO:0006334
Nucleosome assembly
1.99E-08
GO:0042254
Ribosome biogenesis
Miller et al. R58.7
comment
Mock
Genome Biology 2007,
P value
9.48E-09
reviews
2
4
6
7.86E-08
deposited research
5
reports
3
3.55E-08
refereed research
7
interactions
8
Log2 ratio: -2.5
Fold: -5.7
-1.0
+1.0
+2.5
-2.0
+2.0
+5.7
Genome Biology 2007, 8:R58
information
Figure patterns of expression of Ad5-responsive genes and associated cellular functions
Kinetic 4
Kinetic patterns of expression of Ad5-responsive genes and associated cellular functions. The log2 expression values of the 2,106 genes that passed the
filters described in the text clustered into eight groups are shown at the left, and over-represented Gene Ontology (GO) terms in each cluster at the right.
Also shown is a color-bar relating both log2 ratios and fold changes (relative to the average zero values) to color intensity. Ad5, adenovirus type 5.
R58.8 Genome Biology 2007,
Volume 8, Issue 4, Article R58
Miller et al.
Those exhibiting a reduction in concentration fell into three
clusters, distinguished primarily by the time after infection at
which a significant change in RNA concentration was first
detected: early after infection, 24 hours (cluster 7), or late in
infection, between 32 and 36 hours (cluster 2). A third cluster
of downregulated genes (cluster 4) consisted of a small
number of genes encoding RNAs that decreased in concentration early in infection, reached their lowest levels between 34
and 38 hours after infection, but returned to baseline concentrations by the end of infection (Figure 4). In contrast, the
kinetic patterns of increases in cellular RNA concentrations
were considerably more variable, in terms of both the time
after infection at which an increase was first detected and the
duration of the change (Figure 4). For example, increased
accumulation of a substantial number of cellular RNAs was
evident by 18 or 24 hours after infection, but in some cases
RNA concentrations subsequently decreased (clusters 3 and
6), whereas in others the initial alteration was sustained
(cluster 1) or amplified (cluster 5) later in the infectious cycle.
The number of RNA species observed to increase in concentration during the late phase of infection was relatively small
(about 500; Figure 4). Unexpectedly, however, the maximal
increases in accumulation of these RNAs were observed very
late in the infectious cycle, from 48 hours after infection
(clusters 8), when infected cells are largely devoted to assembly of virus particles.
Analysis of cellular functions targeted by Ad5 infection
In an attempt to identify cellular functions that are predominantly affected by Ad5 infection, we searched the filtered list
of genes significantly altered in expression for statistical overrepresentation of functional classes. We used a local implementation of GoTermFinder (see Materials and methods,
below), which maps each gene in a query list to a node in the
'biologic process' ontology of the Gene Ontology Consortium
[61], and computes a probability for the preponderance of
each function in the query list. To avoid a possible function
bias in the population of genes present on the arrays, the P
value for over-representation was computed using all genes
on the array as the background population. In addition, the P
value was Bonferroni-corrected for multiple hypothesis testing. In this way, several important cellular functions were
found to be modulated specifically in response to Ad5 infection (Table 1). We wished to determine whether the specific
targeting of cellular functions correlated with temporal patterns of changes in gene expression, and therefore searched
the kinetic clusters generated by consensus k-means clustering (Figure 4) for over-represented function terms.
Several instances of Ad5-induced co-regulation of genes associated with common cellular functions were identified (Figure
4). Cellular RNAs that increased in concentration slowly and
steadily throughout most of the observed infectious cycle,
which are grouped in cluster 5, exhibited a highly significant
enrichment in RNAs specifying proteins that participate in
the establishment and maintenance of chromatin structure (P
/>
= 10-8). These RNAs encode chromatin modifying proteins,
such as the histone methyl transferase DotIL and subunits of
the NuAY histone acetyl transferase, and numerous core histones, including the S-phase specific histone H2BFS. Cluster
1 contains RNAs that increased in abundance early in
response to Ad5 infection and remained elevated thereafter.
Genes encoding RNA splicing components are significantly
enriched in cluster 1 (P = 10-8), and these RNAs encode several snRNP core Sm and Sm-like protein proteins, SF3A subunits, and proteins critical for enhancer mediated splicing.
RNAs encoding proteins that mediate nucleocytoplasmic
transport of both RNA and protein molecules, such as importins and nucleoporins, were also over-represented in cluster 1
(P = 10-4).
As discussed above, cellular RNAs that exhibited strong, Ad5induced increases in concentration early in infection (18 to 24
hours) fell into three main kinetic clusters that differ in terms
of whether initial increases in RNA concentration were maintained for the duration of the viral life cycle (cluster 1) or
steadily declined from 34 hours after infection (clusters 3 and
6). Despite differences in temporal patterns of expression,
these clusters exhibited common enrichment in genes
ascribed important functions related to cellular proliferation
(Figure 4). Both clusters 1 and 3, which are distinguished by
whether initial increases in RNA concentration were sustained throughout the infection, were strongly enriched in
genes specifying proteins that function in progression
through the cell cycle (P = 10-8 in both). These include checkpoint proteins, DNA replication licensing proteins, and cell
cycle promoting transcription factors. Enrichment for
increased expression of such cell cycle genes is consistent
with the well established mitogenic activity of viral E1A proteins (see below). Furthermore, genes encoding proteins that
mediate or regulate DNA replication were also highly
enriched in clusters 1 and 3 (P = 10-8 in both), as were genes
associated with M phase (P = 10-5 and P = 10-4, respectively).
These include genes encoding subunits of DNA polymerases,
and Mcm complex components, as well as subunits of the
anaphase promoting complex, mitotic checkpoint proteins,
and proteins that regulate spindle formation, chromosome
condensation and chromosome segregation. Interestingly,
cluster 3 is also highly enriched for transcripts of DNA repair
genes (P < 10-11). In particular, the Fanconi anemia group
pathway of DNA repair is heavily targeted by Ad5 infection, as
are the central pathways required for the detection and signaling of DNA damage, represented by the catalytic subunit of
DNA-dependent protein kinase and the UV damage sensor
Rad18. Finally, cluster 6 differs from cluster 3 in that the peak
expression levels reached early after infection, subsequently
decreased far more dramatically than those in cluster 3, and
returned to near baseline levels by 60 hours. Nevertheless,
both cluster 3 and 6 are highly enriched for genes involved in
another cellular function important for growth and proliferation, namely ribosome biogenesis (P = 10-7 and P = 10-8,
respectively). Nucleolar proteins feature prominently in these
Genome Biology 2007, 8:R58
/>
Genome Biology 2007,
Volume 8, Issue 4, Article R58
Miller et al. R58.9
Table 1
Cellular functions associated with genes significantly regulated by Ad5 infection
GO term description
P value
Cellular functions associated with down-regulated genes
GO:0045449
Regulation of transcription
5.97 × e-06
GO:0007154
Cell communication
1.63 × e-04
GO:0007165
Signal transduction
1.05 × e-03
GO:0007275
Development
comment
GO term ID
5.42 × e-03
< 0.00 × e-11
GO:0042254
Ribosome biogenesis and assembly
< 0.00 × e-11
GO:0007046
Ribosome biogenesis
3.60 × e-09
GO:0008380
RNA splicing
4.73 × e-09
GO:0006260
DNA replication
1.71 × e-08
GO:0007049
Cell cycle
2.03 × e-08
GO:0000279
M phase
3.52 × e-08
GO:0006913
Nucleocytoplasmic transport
1.12 × e-05
GO:0006270
DNA replication initiation
4.37 × e-05
GO:0006334
Nucleosome assembly
8.81 × e-05
GO:0051169
Nuclear transport
1.86 × e-04
GO:0051301
Cell division
1.95 × e-04
GO:0031497
Chromatin assembly
7.92 × e-04
GO:0009156
Ribonucleoside monophosphate biosynthesis
4.32 × e-03
GO:0009124
Nucleoside monophosphate biosynthesis
7.06 × e-03
Ad5, adenovirus type 5; GO, Gene Ontology.
Mock
0
two clusters, including many that participate in pre-rRNA
biosynthesis and maturation, as well as ribosome particle
assembly.
Adenovirus type 5
0
Down-regulated
during quiescence
MX2
Up-regulated
during quiescence
interactions
TRIM22
STAT1
refereed research
NFKB2
Assuming that changes in cellular gene expression induced by
Ad5 infection result in corresponding increases or decreases
in protein production, and hence activity, we can conclude
that the diversity of cellular functions modulated during the
adenoviral life cycle is far greater than was previously appreciated. Perhaps even more striking is the substantial enrichment in the 2,000 or so RNAs that changed most strongly in
concentration in Ad5-infected HFFs, with those that encode
proteins that mediate and regulate cell cycle progression and
cell proliferation (Figure 4). Because the HFFs were quiescent
at the time of infection, this finding prompted us to undertake
a comparison of alterations in gene expression induced by
infection and by entry into, and exit from, the quiescent state.
deposited research
DNA repair
reports
GO:0006281
reviews
Cellular functions associated with up-regulated genes
IFITM1
Ad5 infection induces reversal of the quiescence program and
recapitulation of the core serum response
Upon reaching confluence in tissue culture, primary fibroblasts undergo a highly regulated transition into a reversible
growth arrest termed quiescence. Recently, the core alterations in gene expression that accompany this process in diploid human fibroblasts were defined [62]. To determine
whether the genes associated with the induction of the quiescence program exhibited any systematic changes in expres-
Genome Biology 2007, 8:R58
information
Figure 5
Ad5 infection induces reversal of the quiescence program
Ad5 infection induces reversal of the quiescence program. The expression
responses of the quiescence program genes to adenovirus type 5 (Ad5)
infection were isolated, and divided into two groups on the basis of
expression changes during quiescence. The members of each group
(downregulated during quiescence and upregulated during quiescence)
were then hierarchically clustered and the two groups then rejoined for
visualization. The genes named at the right are discussed in the text.
Ramps above panels indicate increases in time after infection.
R58.10 Genome Biology 2007,
Volume 8, Issue 4, Article R58
Miller et al.
sion after Ad5 infection, the expression changes of the genes
that are specifically upregulated or downregulated as primary
lung fibroblasts become quiescent were linked to the expression changes in response to Ad5 infection of quiescent HFFs.
The data were then organized by regulation of gene expression during quiescence (Figure 5).
Strikingly, genes encoding RNAs that decreased in concentration during quiescence were preferentially upregulated during infection, whereas the transcripts of genes activated
during quiescence exhibited nearly systematic Ad5-induced
decreases in abundance. To test whether this opposing pattern was statistically significant, we clustered the infection
responses into two groups, namely those exhibiting an
upward and those exhibiting a downward trend (data not
shown), and used the hypergeometric probability distribution
to compute P values for the nonrandom representation of quiescence RNAs in each cluster. Downregulated quiescence
genes were significantly enriched in the cluster of Ad5 upregulated responses, and upregulated quiescence genes in the
cluster of Ad5 downregulated RNAs (P 7 × 10⁻⁴ and 9 × 10⁻⁵,
respectively). Furthermore, the set of genes that did not conform to the reverse pattern (< 30% of the quiescence program
genes) generally exhibited weak responses to Ad5 infection
and were less than half as likely to pass cutoff filters compared with the set of genes that did conform to the pattern of
quiescence reversal. In addition, the several genes that were
upregulated both during quiescence and late in Ad5 infection
encode proteins (myxovirus resistance protein 2, NF-kappaB2 [p49/p100], Trim22, and Stat1) that are components of
the host antiviral defense mediated by interferon [63,64].
In all, our findings show a robust reversal of the expression
profile recently identified as the core signature of quiescence.
The late changes in RNA concentration, and the cellular function of the corresponding genes that do not conform to this
reversal, suggest that their increased expression is part of a
general response to infection, superimposed on the Ad5-specific reversal of the quiescence program.
Prolonged serum withdrawal represents one way in which
quiescence can be induced in primary cells. Upon re-addition
of serum, the quiescent state is reversed, and cells re-enter
the cell cycle, accompanied by profound changes in their gene
expression profile. In fibroblasts, these changes clearly reflect
their role in wound healing [65]. The apparent reversal of the
quiescence gene expression program induced by Ad5
infection suggested that infection of quiescent fibroblasts by
Ad5 may represent an event akin to serum stimulation. To
test this hypothesis, we isolated the Ad5 induced changes in
expression of the core serum response (CSR) signature genes
identified by Chang and coworkers [66,67]. In remarkable
studies, those researchers showed that primary human
fibroblasts from different parts of the body exhibit distinct
location specific expression profiles [66], yet they share a
common transcriptional response to serum [67]. The latter is
/>
Mock
0
Adenovirus type 5
0
CSR
Figure 6
Induction of the core serum response by Ad5 infection
Induction of the core serum response by Ad5 infection. The responses of
the core serum response (CSR) genes to adenovirus type 5 (Ad5)
infection were isolated and clustered on the basis of their response to Ad5
infection. The serum dependent expression responses are summarized in
yellow or blue (activated or repressed, respectively) in the rightmost
column labeled CSR. Ramps above panels indicate increases in time after
infection.
termed the CSR, and is defined as the set of 512 genes that, in
all 50 fibroblast lines from 10 different anatomical sites,
exhibit differential expression when cultured in the presence
or absence of serum. Importantly, genes that had been found
to show a periodic pattern of altered expression during the
cell cycle [68] were excluded from this list. Thus, the CSR represents a stereotyped, serum dependent gene expression signature, which is independent of cell cycle associated
responses to serum.
We hierarchically clustered the genes that comprise the CSR
on the basis of their alterations in expression during Ad5
infection of HFFs (Figure 6). This approach established that
increases in expression in response to infection are highly
correlated with elevated gene expression in the presence of
serum. Similarly, Ad5 induced decreases were correlated with
lower expression in response to serum (Figure 6). Indeed, the
concordance between the two datasets for this group of genes
is remarkable (P < 10-34 and P < 10-14 for RNAs that decreased
and increased in concentration during Ad5 infection, respectively). These findings strongly suggest that Ad5 infection not
only elicits a reversal in the gene expression program that is
characteristic of quiescent human fibroblasts, but also
Genome Biology 2007, 8:R58
/>
Genome Biology 2007,
interactions
information
Genome Biology 2007, 8:R58
refereed research
The E2F transcriptional regulators were first identified, and
named, by virtue of their ability to bind specifically to two
sites in the type C adenoviral E2 early promoter [24]. This
family is now known to comprise at least eight members,
which differ in their association with Rb family members,
effects on transcription, and mechanisms of binding to DNA
[74-78]. For example, E2F-1, E2F-2, and E2F-3 bind directly
From our complete, that is, unfiltered, dataset we isolated the
expression changes of the direct E2F target genes identified
by Ren and coworkers [86], while excluding genes that
exhibit changes in expression in response to mock infection.
Comparison with an equal number of randomly selected
genes from this dataset revealed strong enrichment of Ad5
responsive genes among direct E2F target genes (Figure 7). In
fact, 60% of the 67 E2F target genes that showed no significant response in mock infected cells passed the stringent foldchange filtering scheme applied previously (compared with
10% of all the genes in the dataset), and all but seven are
grouped in clusters 1 and 3 (Figure 4) with the genes that
deposited research
Internalization of adenovirus particles by receptor mediated
endocytosis is initiated by binding of the capsid penton base
to cell surface α'i integrin molecules [2]. This interaction also
results in very rapid (within 10 min), transient activation of
phosphoinositide-3-OH kinase [69]. Although activation of
signaling via this enzyme has the potential to alter gene
expression [70-73], we detected no changes in cellular RNA
concentrations during the first hours of the infectious cycle
(Figure 4). Rather, the earliest alteration detected took place
at 18 hours after infection (Figure 4), coincident with the
onset of viral early gene expression (Figure 1). These changes
in cellular gene expression are almost certainly the result of
changes in rates of transcription; post-transcriptional mechanisms that govern RNA production in Ad5-infected cells
operate only late in infection (see Background, above). Furthermore, the adenoviral immediate early E1A proteins,
which are necessary for efficient progression beyond the initial phase of the infectious cycle, can regulate transcription by
multiple mechanisms. In view of the findings reported above,
the effects of CR2 of E1A proteins on cellular E2F proteins
were of particular interest.
A common method used to associate particular transcriptional regulators with induction of specific patterns of gene
expression is to search the regulatory sequences of co-regulated genes for statistically significant over-representation of
binding sites for such proteins. An initial, manual search of
the entire set of genes from positions -1,000 to +500 for the
two most common variants of an 8 base pair (bp) E2F consensus binding site [83,84] identified a large number of potential
E2F-responsive genes (some 500). Nearly 80 of these were
genes were in clusters 1, 3, and 4, which contain genes
specifying RNAs that increased in concentration in response
to Ad5 (data not shown). However, in the case of E2F, methods based on identification of binding site sequences are
problematic; the currently defined consensus binding sites
for members of this family includes a significant degree of
degeneracy [83,84]. Furthermore, it has recently been
reported that many sequences to which E2F binds in vivo do
not match such consensus sequences [85]. We therefore
examined the effects of Ad5 infection on the expression of
genes to which E2F family proteins are known to bind in vivo,
which have been identified by immunoprecipitation of E2F
containing chromatin and microarray analysis of the DNA
[86].
reports
Mechanisms by which Ad5 gene products regulate
cellular gene expression
The E1A proteins
to the Rb protein and are strong activators of transcription.
They are also necessary for activation of E2F-responsive
genes and entry into S phase [79]. E2F-4 and E2F-5 can also
associate with other members of the Rb family and stimulate
transcription less strongly, whereas E2F-6, E2F-7, and E2F-8
appear to repress transcription. Association of E2F proteins
with Rb, which inhibits expression of E2F responsive genes,
is normally regulated during the cell cycle by phosphorylation
of Rb [80]. However, CR2 dependent binding of E1A to Rb
protein induces release of E2F, and hence activation of transcription of E2F responsive genes and induction of progression into the S phase of the cell cycle [3,81,82]. These effects
of CR2, results discussed in the previous section, and the
observation that RNAs encoding E2F-1 and E2F-2 increased
significantly in concentration from 24 hours after Ad5 infection, whereas E2F-4, E2F-5 and E2F-7 RNAs did not, suggested that E2F-responsive genes were likely to be highly
targeted in Ad5 infected HFFs.
reviews
In addition to providing a molecular fingerprint of fibroblasts
that grow in the presence of serum, the transcriptional CSR
phenotype has been shown to be a robust predictor of the clinical outcome of several human carcinomas [67]. The metastasis and death associated with these human tumors correlated
strongly with expression of the CSR phenotype. Thus, even
though adenovirus infection is not tumorigenic in humans, it
appears that infection of human cells induces a transcriptional state associated with aggressive tumor progression and
poor clinical outcome.
Miller et al. R58.11
comment
induces a nearly perfect recapitulation of the highly specific
core gene expression profile exhibited by cells that proliferate
in the presence of serum growth factors. Underscoring its
close association with the wound healing program, the CSR is
significantly enriched for genes encoding proteins that participate in blood coagulation, complement activation, and
angiogenesis, and contains genes associated with cell motility, extracellular matrix remodeling, and the myofibroblast
phenotype [67]. Thus, in addition to the induction of
proliferation (see above), it appears that Ad5 infection
induces a cellular state closely associated with a specialized,
serum dependent fibroblast function.
Volume 8, Issue 4, Article R58
R58.12 Genome Biology 2007,
Volume 8, Issue 4, Article R58
(a) Mock
0
Miller et al.
Ad5
0
/>
(b) Mock
0
Ad5
0
Figure 7
The expression of E2F target genes in Ad5 infected HFFs
The expression of E2F target genes in Ad5 infected HFFs. (a) The 67 genes bound by E2F2 or E2F4 identified by Ren and coworkers [86] and (b) 67
randomly chosen genes were isolated from the complete dataset while excluding genes with responses to mock treatment. The genes in both panels were
hierarchically clustered for easier viewing. Ramps above panels indicate increases in time after infection. Ad5, adenovirus type 5; HFF, human foreskin
fibroblast.
exhibit the earliest activation in response to Ad5 infection
(data not shown).
We then tabulated the Ad5 specific expression responses of
the E2F target genes according to function (Figure 7). Genes
that passed the fold change filter applied previously were
labeled as responsive, either up or down. Across all functions,
a significantly higher proportion of E2F target genes showed
significant changes in the concentrations of their RNA transcripts in Ad5 infected HFFs, relative to all genes in the
dataset. Moreover, the expression of all E2F target genes
increased, rather than decreased, in infected cells. It is therefore likely that during infection of nonproliferating cells,
effects mediated by CR2 of the E1A proteins account for an
important subset of the changes in cellular gene expression
summarized in Figure 3, as predicted by current models
[3,81,82]. Unexpectedly, however, we observed that the
expression of some functional groups of genes bound by E2F
was more heavily affected than that of others (Figure 8).
Notably, E2F targets encoding proteins that mediate or regulate cell cycle progression and DNA replication and repair
exhibited much greater propensity to change in response to
Ad5 than did genes associated with transcription, intracellular transport, or development (Figure 8). These different
responses might be the result of preferential recognition of
E2F responsive promoters by different E2F family members
or effects of other transcriptional regulators that also recognize such promoters. Regardless, such function specific, differential regulation of E2F target genes suggests that
additional mechanisms must regulate expression of E2F
responsive genes, or E2F proteins, in adenovirus infected
cells.
The E2F responsive genes described above represent but a
subset of those that increased or decreased in expression during the early phase of Ad5 infection. However, E1A proteins
can modulate cellular transcriptional regulators by at least
three additional mechanisms. Because the interaction of CR3
of the large E1A protein with the mediator complex (see
Background, above) both stimulates transcription by RNA
polymerase II in vitro [21] and is necessary for efficient transcription of viral early genes in infected cells [20], it may well
contribute to activation of cellular gene expression. CR1 and
CR4 of the E1A proteins associate with various histone acetylases that activate transcription [3] and the transcriptional
co-repressor Ct-BP [87,88], respectively. The latter interaction inhibits E1A dependent transformation, whereas CR1 is
necessary for transformation. Neither the transcriptional
consequences of association of CR1 or CR4 with cellular coactivators or co-repressors, nor the contributions of these
E1A sequences to the viral infectious cycle are understood.
However, these interactions could well result in either
increases or decreases in transcription of specific cellular
genes. It will therefore be of interest to examine the effects of
substitutions that block the interactions of these conserved
regions of E1A proteins with cellular components on cellular
gene expression.
Genome Biology 2007, 8:R58
/>
Genome Biology 2007,
The E1B 55 kDa protein
Conclusion
deposited research
refereed research
It is also apparent that a significant fraction of the alterations
in cellular gene expression represent Ad5-induced reversal of
the quiescence program with concomitant induction of the
core serum response, and activation of expression of many
genes associated with cell proliferation. These observations
provide the first experimental support for the long-held view
that the mitogenic activity of adenoviral E1A proteins, which
is crucial for transformation of nonpermissive cells, optimizes
the environment of permissive cells for viral replication.
Clearly, it will be important in future experiments to examine
both cellular responses and progression through the infectious cycle in quiescent fibroblasts infected by viruses carrying mutations that impair specific functions of these viral
early proteins. Such information should facilitate design of
adenoviral vectors for therapeutic applications.
reports
One of the most remarkable conclusions to emerge from the
global analysis of the responses of quiescent fibroblasts to
Ad5 infection presented here is that a small number of viral
gene products can induce massive reprogramming of cellular
gene expression. Even with application of stringent filters,
some 10% of the 20,000 or so human genes examined
increased or decreased in expression specifically in Ad5
infected cells. Our data also indicate that previously described
properties of viral early proteins, such as binding of E1A gene
products to Rb family members, are likely to account for the
responses of particular sets of cellular genes. Nevertheless, in
terms of explanatory power, such well characterized functions of viral proteins represent but the tip of the iceberg, for
they apply to no more than 5% of the changes observed. It is
probable that effects of activities of viral proteins that are not
yet well understood, for example the interaction of CR1 of E1A
proteins with cellular transcriptional co-activators, contribute to the reprogramming of cellular gene expression. Secondary consequences of the effects of viral early proteins are
also likely to contribute via induction of transcriptional
cascades.
reviews
Materials and methods
Cells and virus
Genome Biology 2007, 8:R58
information
Human Ad5 was propagated in HeLa cells in suspension culture, as described previously [95]; purified by adsorption to
an AdenoPack™ membrane (Sartorius, Goettingen, Germany), in accordance with the manufacturer's instructions;
and titered by plaque assay on HeLa cell monolayers [96].
Primary HFFs were maintained in monolayer culture in Dulbecco's modified essential medium (GIBCO-BRL, Gaithersburg, MD, USA) supplemented with 10% (vol/vol) fetal
bovine serum (Gemini, West Sacramento, CA, USA). Before
Ad5 infection, HFFs were cultured in six-well dishes until 3
days after they had become fully confluent. They were then
infected with 30 plaque forming units/cell of Ad5, a multiplicity previously determined to be sufficient for 100% infection
of HFFs [51], or were mock infected. After adsorption of virus
interactions
Initial inspection of classical, p53 activated genes indicated
that Ad5 infection induced decreases (for example, CDKN7A
and all cyclin G genes) or no change (for example, BAX and
MDM2) in the concentrations of corresponding RNAs. To
conduct a systematic analysis, we took advantage of a careful
microarray study conducted by Kannan and coworkers [94],
in which they identified a set of primary p53 target genes
using a temperature sensitive p53 protein synthesized in a
p53 null human cancer cell line. This group identified a core
set of primary p53 target genes that exhibited significant
expression changes when cells were shifted to the permissive
temperature, both in the presence and absence of cycloheximide. This approach, which excludes indirect p53 responses
that are likely to be dependent on protein synthesis, identified
approximately 50 genes as primary targets. We therefore isolated these genes in our dataset. We found that the vast
majority of primary p53 target genes exhibited either no
response to Ad5 infection or, most frequently, a reversal of
p53 induced changes (Figure 9). Thus, most genes activated
by p53 were either repressed upon Ad5 infection or
unchanged in expression. On the other hand, genes normally
directly repressed by p53 were de-repressed during adenovirus infection. We therefore conclude that that Ad5
orchestrates an extremely effective suppression of p53 transcriptional activity. These observations provide the first evidence suggesting that the E1B 55 kDa protein counters the
transcriptional function of activated p53 in Ad5 infected cells.
Miller et al. R58.13
comment
Like E1A proteins, the E1B 55 kDa protein can also modulate
cellular gene expression by multiple mechanisms. In terms of
molecular detail, the best understood is repression of p53dependent transcription [35,36]. Such inhibition of the transcriptional function of this cellular tumor suppressor protein
is mediated by binding of the viral protein to the activation
domain of p53 [89-91]. The results of in vitro experiments
indicate that, when associated with p53, the E1B protein
actively represses transcription [89,90]. It is therefore
believed that the carboxyl-terminal repression domain of the
E1B 55 kDa protein is recruited to specific promoters via the
DNA binding activity of p53 to repress transcription of p53
responsive genes. Consistent with this model, substitutions or
insertions at specific positions within the E1B repression
domain prevent inhibition of transcription in transient assays
or in in vitro reactions [35,89]. These mutations also impair
the ability of the E1B gene to cooperate with E1A in transformation of rodent cells. In addition, it has been reported that
the E1B 55 kDa protein inhibits acetylation of p53 by the histone acetyltranferase PCAF [92], a modification that is
important for activation of p53 [93]. The viral protein also
prevents stimulation of p53 dependent transcription in transient expression assays by the cellular protein Daxx [54].
However, it is not known whether p53 dependent transcription is repressed during Ad5 infection, as these observations
predict. We therefore wished to exploit the data described
previously to begin to address this issue.
Volume 8, Issue 4, Article R58
R58.14 Genome Biology 2007,
MLH1
CENPE
BUB3
AURKB
CDC6
CDK2
MYC
CKS1B
H2AFX
MCM3
MCM5
MCM6
MSH2
PCNA
PTTG2
RAD54L
SMC2L1
CENPA
TRA1
SMARCA3
PKN2
EIF2B2
AURKB
H2AFX
HSPC150
HIST2H2AA
CDK2
H2AFZ
VCP
PRKDC
CALR
RPA3
MSH2
MLH1
RFC3
RFC2
PCNA
TOP2A
MCM3
CDK2
POLA2
POLD1
CDC6
FEN1
MCM6
TK1
MCM5
DUT
RRM1
PRIM2A
PLSCR1
TRA1
FEN1
MLH1
POLD1
PTTG2
H2AFX
RAD54L
PCNA
TOP2A
MSH2
UNG
RPA3
PRKDC
NFE2L1
VCP
Volume 8, Issue 4, Article R58
Miller et al.
Cell Cycle
MutL homolog 1, colon cancer, nonpolyposis type 2
Centromere protein E, 312kDa
BUB3 budding uninhibited by benzimidazoles 3 homolog
Aurora kinase B
CDC6 cell division cycle 6 homolog
Cyclin-dependent kinase 2
V-myc myelocytomatosis viral oncogene homolog
CDC28 protein kinase regulatory subunit 1B
H2A histone family, member X
MCM3 minichromosome maintenance deficient
MCM5 minichromosome maintenance deficient 5
MCM6 minichromosome maintenance deficient 6
MutS homolog 2, colon cancer
Proliferating cell nuclear antigen
**Pituitary tumor-transforming 2
RAD54-like (S. cerevisiae)
SMC2 structural maintenance of chromosomes 2-like 1
Cellular Protein Metabolism
Centromere protein A, 17kDa
Tumor rejection antigen (gp96) 1
SWI/SNF related regulator of chromatin
Protein kinase N2
Eukaryotic translation initiation factor 2B, subunit 2 beta
Aurora kinase B
H2A histone family, member X
HSPC150 protein similar to ubiquitin-conjugating enzyme
**Histone 2, H2aa
Cyclin-dependent kinase 2
H2A histone family, member Z
Valosin-containing protein
Protein kinase, DNA-activated, catalytic polypeptide
Calreticulin
DNA replication
Replication protein A3, 14kDa
MutS homolog 2, colon cancer, nonpolyposis type 1
MutL homolog 1, colon cancer, nonpolyposis type 2
Replication factor C (activator 1) 3, 38kDa
Replication factor C (activator 1) 2, 40kDa
Proliferating cell nuclear antigen
Topoisomerase (DNA) II alpha 170kDa
MCM3 minichromosome maintenance deficient 3
Cyclin-dependent kinase 2
Polymerase (DNA directed), alpha 2 (70kD subunit)
Polymerase (DNA directed), delta 1, catalytic subunit 125kDa
CDC6 cell division cycle 6 homolog
Flap structure-specific endonuclease 1
MCM6 minichromosome maintenance deficient 6
Thymidine kinase 1, soluble
MCM5 minichromosome maintenance deficient 5
DUTP pyrophosphatase
Ribonucleotide reductase M1 polypeptide
Primase, polypeptide 2A, 58kDa
Response to Stress
Phospholipid scramblase 1
Tumor rejection antigen (gp96) 1
Flap structure-specific endonuclease 1
MutL homolog 1, colon cancer, nonpolyposis type 2
DNA Polymerase delta 1, catalytic subunit 125kDa
**Pituitary tumor-transforming 2
H2A histone family, member X
RAD54-like (S. cerevisiae)
Proliferating cell nuclear antigen
Topoisomerase (DNA) II alpha 170kDa
MutS homolog 2, colon cancer, nonpolyposis type 1
Uracil-DNA glycosylase
Replication protein A3, 14kDa
Protein kinase, DNA-activated, catalytic polypeptide
Nuclear factor (erythroid-derived 2)-like 1
Valosin-containing protein
/>
UP
UP
UP
UP
UP
UP
UP
UP
UP
UP
UP
UP
UP
UP
UP
UP
UP
UP
UP
UP
UP
UP
UP
UP
UP
UP
UP
UP
UP
UP
UP
UP
UP
UP
UP
UP
UP
UP
UP
UP
UP
UP
UP
UP
UP
UP
UP
UP
Transcription
Suppressor of Ty 4 homolog 1
High-mobility group box 3
V-myc myelocytomatosis viral oncogene homolog
SWI/SNF related regulator of chromatin
**Pituitary tumor-transforming 2
MCM3 minichromosome maintenance deficient 3
MCM5 minichromosome maintenance deficient 5
TEA domain family member 4
MCM6 minichromosome maintenance deficient 6
Zinc finger protein 267
Nuclear factor (erythroid-derived 2)-like 1
Calreticulin
DNA repair
RPA3
Replication protein A3, 14kDa
PRKDC
Protein kinase, DNA-activated, catalytic polypeptide
MLH1
MutL homolog 1, colon cancer, nonpolyposis type 2
PCNA
Proliferating cell nuclear antigen
TOP2A
Topoisomerase (DNA) II alpha 170kDa
MSH2
MutS homolog 2, colon cancer, nonpolyposis type 1
UNG
Uracil-DNA glycosylase
RAD54L
RAD54-like
POLD1
DNA Polymerase delta 1, catalytic subunit 125kDa
PTTG2
**Pituitary tumor-transforming 2
FEN1
Flap structure-specific endonuclease 1
H2AFX
H2A histone family, member X
M phase
BUB3
BUB3 budding uninhibited by benzimidazoles 3 homolog
SMC2L1
SMC2 structural maintenance of chromosomes 2-like 1
CDK2
Cyclin-dependent kinase 2
PTTG2
**Pituitary tumor-transforming 2
CDC6
CDC6 cell division cycle 6 homolog
H2AFX
H2A histone family, member X
RAD54L
RAD54-like
CENPE
Centromere protein E, 312kDa
Signal Transduction
PIG8
Translokin
PPP2R2B protein phosphatase 2, regulatory subunit B
VCP
Valosin-containing protein
RABIF
RAB interacting factor
PCNA
Proliferating cell nuclear antigen
TOP2A
Topoisomerase (DNA) II alpha 170kDa
FEN1
Flap structure-specific endonuclease 1
PKN2
Protein kinase N2
STAM
Signal transducing adaptor molecule 1
Cell Proliferation
BUB3
BUB3 budding uninhibited by benzimidazoles 3 homolog
PCNA
Proliferating cell nuclear antigen
MYC
V-myc myelocytomatosis viral oncogene homolog
CDK2
Cyclin-dependent kinase 2
CDC6
CDC6 cell division cycle 6 homolog (S. cerevisiae)
Establishment/Maintenance of Chromatin Architecture
CENPA
Centromere protein A, 17kDa
SMARCA3 SWI/SNF related regulator of chromatin
H2AFZ
H2A histone family, member Z
H2AFX
H2A histone family, member X
HIST2H2AA **Histone 2, H2aa
Intracellular Transport
PIG8
Translokin
STAM
Signal transducing adaptor molecule 1
CALR
Calreticulin
VCP
Valosin-containing protein
CENPE
Centromere protein E, 312kDa
KIF4A
Kinesin family member 4A
Development
HMGB3
High-mobility group box 3
ZNF267
Zinc finger protein 267
NFE2L1
Nuclear factor (erythroid-derived 2)-like 1
TEAD4
TEA domain family member 4
SUPT4H1
HMGB3
MYC
SMARCA3
PTTG2
MCM3
MCM5
TEAD4
MCM6
ZNF267
NFE2L1
CALR
UP
UP
UP
UP
UP
UP
UP
UP
UP
UP
UP
UP
UP
UP
UP
UP
UP
UP
UP
UP
UP
UP
UP
UP
UP
UP
UP
UP
UP
UP
UP
UP
UP
Figure 8
Ad5 induced changes of expression of E2F target genes organized by function
Ad5 induced changes of expression of E2F target genes organized by function. E2F target genes, identified by Ren and coworkers [86], were organized by
cellular function. Genes significantly regulated by Ad5 (those that pass fold change filter applied previously) are indicated with red/UP or green/DOWN.
Grey indicates genes not significantly regulated by Ad5. (Note that none of the 67 E2F target genes were significantly downregulated.)
Genome Biology 2007, 8:R58
/>
Mock
0
Volume 8, Issue 4, Article R58
Miller et al. R58.15
for 1 hour at 37°C, the innoculum was removed and replaced
with the original, conditioned medium. Mock and Ad5
infected cells were incubated at 37°C.
p53
CDKN1A
ENG
FOSL2
MGC5370
PURA
Raw image data were extracted using Agilent Feature extraction software with the protocol settings recommended by the
manufacturer. Raw channel intensities were adjusted for
Genome Biology 2007, 8:R58
information
Data normalization and processing
interactions
Figure
Changes9in expression of direct p53 target genes induced by Ad5 infection
Changes in expression of direct p53 target genes induced by Ad5 infection.
The 50 or so genes that are direct p53 targets in human lung fibroblasts
[94] are shown clustered based on the changes in their expression
observed in adenovirus type 5 (Ad5) infected human foreskin fibroblasts.
The column labeled p53 summarizes the p53 induced alterations in
expression of these genes, which are listed at the right. Ramps above
panels indicate increases in time after infection.
refereed research
SMTN
GTF2H2
PCNA
PPAT
CCNE1
SLC19A1
CDC6
SCRIB
EIF4A1
INA
HRAS
POMZP3
COL18A1
DMWD
BBC3
PDLIM4
Ad5 infected and mock infected HFF cells were harvested for
RNA isolation using the RNeasy Micro™ kit (Invitrogen,
Carlsbad, CA, USA), following the manufacturer's instructions. In brief, medium was completely removed from wells
followed by immediate addition of a denaturing lysis buffer
(RLT™, supplied by the manufacturer), homogenization by
vortexing, and freezing on dry ice. All samples were thawed
and processed for RNA isolation in parallel. The purification
included an on-column DNAse I digestion step. The yield and
quality of each RNA sample were assessed by nano-drop
spectrophotometry and agarose gel electrophoresis, respectively. For each sample, 400 ng RNA was linearly amplified
and labeled in the presence of Cy5-CTP, using Low RNA Input
Linear Amplification reagents (Agilent Technologies, Santa
Clara, CA, USA). Amplified RNA was purified on RNAeasy™
spin columns (Qiagen, Valencia, CA, USA). A mixture of total
cellular RNA from five different types of human cells, including both transformed cell lines and primary cells, was labeled
with Cy3-CTP and purified in the same way for use as a common reference. The amplification/labeling reactions yielded
specific activities of 10 to 12 pmol Cy3/Cy5 per μg cRNA.
Samples were processed and hybridized to Agilent Whole
Human 44 k DNA microarrays for 17 hours at 60°C in parallel
staggered batches using the Agilent hybridization kit. Slides
were washed in parallel according to the manufacturer's protocol, which included a final drying rinse in acetonitrile, and
scanned in batch using an Agilent two color scanner. All preand post-hybridization procedures with labeled cRNAs were
performed in an ozone free facility.
deposited research
NDN
PRKAB1
APLP1
NEFL
Analysis of cellular gene expression
reports
LCAT
KIAA0247
SURF1
PMP22
HAN11
CTDSP2
TST
LOXL1
ADFP
IGFBP6
NINJ1
DDB2
CES2
APBA2
Infected cells were scraped from individual wells of six-well
dishes after various periods of infection, washed twice in ice
cold phosphate-buffered saline, and divided into two equal
portions. Total DNA was purified from one portion and the
quantity of viral DNA examined by using 12 cycles of PCR
amplification of a segment of the viral E1A gene, as described
previously [51]. The amplified DNA was analyzed by electrophoresis in a 1.4% (weight/vol) agarose gel cast and run in
0.04 M Tris-acetate (pH 7.5) containing 1 mM EDTA. A total
protein lysate was prepared from the second portion of each
sample of cells, as described previously [97]. The viral early
E2 single-stranded DNA-binding protein and late protein V
were detected by immunoblotting with monoclonal antibodies B6 [98] and F58#1 [99], respectively, as described previously [51].
reviews
SMAD7
EXT2
MAN2B1
Analysis of viral DNA and protein synthesis
comment
0
Ad5
Genome Biology 2007,
R58.16 Genome Biology 2007,
Volume 8, Issue 4, Article R58
Miller et al.
background using a spatial de-trend algorithm, dye normalization was performed using an intensity-dependent lowness
normalization based on spots that passed a rank consistency
filter, and final spot values were computed as the log2 of processed channel intensity ratios (red/green). The extracted data
were loaded onto the Princeton University PUMA database
[52] for storage and spot quality filtering. Spots flagged by the
extraction software as feature uniformity outliers, in either
channel, were culled. In addition, only spots flagged as well
above background were included in the analysis; uncorrected
channel intensity values passed a two sided t-test (P = 0.01)
for significance, and background-corrected signals were
greater than 2.6 times the standard deviation of global background. Processing of corrected and filtered log2 dye ratio
data, including dataset manipulations, zero transformation,
filtering, and visualization, were performed using the following freeware: PCL-Analysis (Gavin Scherlock, Stanford University, Palo Alto, CA, USA), TIGR MeV data analysis
package, and Java-Treeview (Alok Jerome Saldanha, Stanford University, Palo Alto, CA, USA). Primary probe accessions supplied by Agilent Technologies were mapped to
Unigene clusters via batch retrieval using SOURCE [100]
using the Protein Information Resource batch retrieval utility
[101]. To establish a dataset of unique genes, the expression
values associated with multiple probes referencing the same
gene were averaged.
RT-PCR analysis
Cellular RNA (100 ng) isolated from HFF cells at 0, 18, 24, 30,
40 and 54 hours after infection (as described in a previous
section) was analyzed by RT-PCR for several human genes
using the RT-PCR Master Mix (2 ×) kit (USB, Cleveland, OH,
USA) in the presence of 3 μCi/reaction [α32P]-dATP (3000
Ci/mmol; Perkin Elmer, Waltham, MA, USA). For each gene,
the optimal number of cycles was experimentally determined
to ensure exponential amplification. The primer pairs, ranging in size from 19 to 24 bases, were designed to amplify
GMNN (positions +68 to +347 of the coding sequence),
CCNE1 (+79 to +314), E2F2 (+1,133 to +1,344), MSH2 (+807
to +1,053), SFRP1 (+1,366 to +1,609), FAM45A (+606 to
+759), NOLC1 (+639 to +886), LENG9 (+448 to +631),
IGFBP5 (+1,208 to +1,445), EIF4EBP2 (+564 to +720),
MAP3K3 (+841 to +1,022), PNKP (+519 to +728), RAB31
(+315 to +560), RHOQ (+445 to +601), NEUROG1 (+228 to
+379), and CDC6 (+1472 to +1981). The RT-PCR products,
ranging in size from about 150 to about 510 base pairs, were
resolved by electrophoresis in 6% acrylamide gels, cast, and
run in 0.25 × TBE (0.0225 mol/l Tris-borate [pH 7.5], 0.5
mmol/l EDTA). Signals were quantified by using a Molecular
Dynamics STORM 869 Phosphor Imaging Scanner and
Image Quant™ TL software (Amersham Biosciences, Piscataway, NJ, USA).
/>
ing result was consistent across different initializations and
generally robust, we used consensus clustering [102]. We
applied consensus clustering to our data by performing 5,000
iterations of k-means clustering, each with a different,
random initialization. We used Pearson correlation as the distance metric with k = 8 (see figure of merit [FOM] discussion,
below). For every possible pair of genes, we counted the
number of cluster results in which that pair was co-clustered.
The final step was to derive a consensus clustering result from
the average behavior over the entire set of iterations. We
applied the average-linkage agglomerative approach,
described by Monit and coworkers [102], which uses the fraction of iterations in which each pair of genes co-clustered as a
similarity metric and builds a hierarchical linkage tree
accordingly. Based on FOM analysis (described below), we
picked a similarity threshold that resulted in eight total
clusters.
One requirement of the k-means algorithm, which is the basis
of our consensus clustering, is that a total number of clusters,
k, must be chosen in advance. A common approach to
automatically determining k is to use FOM analysis, which
attempts to ascertain the minimal number of clusters necessary to produce a good fit of the data to the cluster centroids.
Specifically, the FOM for a particular choice of clustering
parameters (for instance, the number of clusters) is computed
by iteratively withholding a single condition from each
expression vector, clustering the data, and measuring how
predictive cluster centroids are of all member genes' held-out
expression measurement [60]. We used the FOM utility in the
MeV Tiger toolbox [103] to perform this analysis and determined that the FOM reached a minimum for k = 8. All figures
illustrating clustering results can be interactively viewed on
our supplemental website [104] (clustered data can also be
downloaded for viewing with Java-Treeview [105]).
Gene Ontology enrichment analysis
Gene Ontology (GO) analyses were performed in Matlab
using a script written by CLM and DLM based on GO TermFinder [106]. Updated gene association and ontology files
were downloaded from the GO Consortium database [61] on
24 January 2007, and parsed to create a Matlab reference
object for the process ontology. These were used to map Uniprot identifiers to their GO process identifiers. The hypergeometric distribution was used to calculate the significance of
GO term assignments in gene clusters. The background set of
genes was the set of genes represented on the array, and the P
values are Bonferroni corrected for multiple hypothesis testing. The Matlab scripts and supporting data can be downloaded from our supplementary website [104]. GO term
results were validated and visualized using GOLEM, an interactive tool for browsing the GO [107].
Consensus clustering
Several clustering algorithms, including k-means used here,
are sensitive to random initialization. To ensure our clusterGenome Biology 2007, 8:R58
/>
Genome Biology 2007,
Additional data files
21.
22.
23.
Shown shown file 1
Validation
Click here
city filters). the dataset data
expression datain all genes
Provided the file Figureof that pass the by change and specifiDatasetis isof microarray 3 microarray datafoldRT-PCR.
Additionalforvalidationshown in Figure 3 (k-means clustered
for 2
24.
Acknowledgements
25.
References
1.
3.
4.
6.
7.
8.
9.
11.
12.
13.
15.
16.
17.
19.
20.
31.
32.
33.
34.
35.
36.
37.
38.
39.
40.
41.
42.
43.
Genome Biology 2007, 8:R58
information
18.
30.
interactions
14.
29.
refereed research
10.
28.
Trentin JJ, Yabe Y, Taylor G: The quest for human cancer
viruses. Science 1962, 137:835-841.
Shenk T: Adenoviridae and their replication. In Virology 4th edition. Edited by: Fields B, Howley P, Knipe D. New York, NY: Raven
Press; 2001:2265-2300.
Berk AJ: Recent lessons in gene expression, cell cycle control,
and cell biology from adenovirus. Oncogene 2005, 24:7673-7685.
Moran E: DNA tumor virus transforming proteins and the cell
cycle. Curr Opin Genet Dev 1993, 3:63-70.
Nevins JR: E2F: a link between the Rb tumor suppressor protein and viral oncoproteins. Science 1992, 258:424-429.
Frisch SM, Mymryk JS: Adenovirus-5 E1A: paradox and
paradigm. Nat Rev Mol Cell Biol 2002, 3:441-452.
Levine AJ: The p53 protein and its interactions with the oncogene products of the small DNA tumor viruses. Virology 1990,
177:419-426.
Berget SM, Moore C, Sharp PA: Spliced segments at the 5' terminus of adenovirus 2 late mRNA. Proc Natl Acad Sci USA 1977,
74:3171-3175.
Chow LT, Gelinas RE, Broker TR, Roberts RJ: An amazing
sequence arrangement at the 5' ends of adenovirus 2 messenger RNA. Cell 1977, 12:1-8.
Moran E, Mathews MB: Multiple functional domains in the adenovirus E1A gene. Cell 1987, 48:177-178.
Schaeper U, Subramanian T, Lim L, Boyd JM, Chinnadurai G: Interaction between a cellular protein that binds to the C-terminal
region of adenovirus E1A (CtBP) and a novel cellular protein
is disrupted by E1A through a conserved PLDLS motif. J Biol
Chem 1998, 273:8549-8552.
Avvakumov N, Kajon AE, Hoeben RC, Mymryk JS: Comprehensive
sequence analysis of the E1A proteins of human and simian
adenoviruses. Virology 2004, 329:477-492.
Flint J, Shenk T: Viral transactivating proteins. Annu Rev Genet
1997, 31:177-212.
Nevins JR: Mechanism of activation of early viral transcription
by the adenovirus E1A gene product. Cell 1981, 26:213-220.
Jones N, Shenk T: An adenovirus type 5 early gene function
regulates expression of other early viral genes. Proc Natl Acad
Sci USA 1979, 76:3665-3669.
Ricciardi RP, Jones RL, Cepko CL, Sharp PA, Roberts BE: Expression
of early adenovirus genes requires a viral encoded acidic
polypeptide. Proc Natl Acad Sci USA 1981, 78:6121-6125.
Berk AJ: Adenovirus promoters and E1A transactivation. Ann
Rev Genet 1986, 20:45-79.
Boyer TG, Martin ME, Lees E, Ricciardi RP, Berk AJ: Mammalian
Srb/Mediator complex is targeted by adenovirus E1A
protein. Nature 1999, 399:276-279.
Wang G, Cantin GT, Stevens JL, Berk AJ: Characterization of
mediator complexes from HeLa cell nuclear extract. Mol Cell
Biol 2001, 21:4604-4613.
Stevens JL, Cantin GT, Wang G, Shevchenko A, Shevchenko A, Berk
AJ: Transcription control by E1A and MAP kinase pathway
via Sur2 mediator subunit. Science 2002, 296:755-758.
deposited research
5.
27.
reports
2.
26.
Cantin GT, Stevens JL, Berk AJ: Activation domain-mediator
interactions promote transcription preinitiation complex
assembly on promoter DNA. Proc Natl Acad Sci USA 2003,
100:12003-12008.
Malik S, Roeder RG: Dynamic regulation of pol II transcription
by the mammalian Mediator complex. Trends Biochem Sci 2005,
30:256-263.
Conaway RC, Sato S, Tomomori-Sato C, Yao T, Conaway JW: The
mammalian Mediator complex and its role in transcriptional
regulation. Trends Biochem Sci 2005, 30:250-255.
Kovesdi I, Reichel R, Nevins JR: Identification of a cellular transcription factor involved in E1A trans-activation. Cell 1986,
45:219-228.
Dyson N: The regulation of E2F by pRB-family proteins. Genes
Dev 1998, 12:2245-2262.
Howe JA, Mymryk JS, Egan C, Branton PE, Bayley ST: Retinoblastoma growth suppressor and a 300-kDa protein appear to
regulate cellular DNA synthesis. Proc Natl Acad Sci USA 1990,
87:5883-5887.
Stein RW, Corrigan M, Yaciuk P, Whelan J, Moran E: Analysis of
E1A-mediated growth regulation functions: binding of the
300-kilodalton cellular product correlates with E1A
enhancer repression function and DNA synthesis-inducing
activity. J Virol 1990, 64:4421-4427.
Wang HG, Rikitake Y, Carter MC, Yaciuk P, Abraham SE, Zerler B,
Moran E: Identification of specific adenovirus E1A N-terminal
residues critical to the binding of cellular proteins and to the
control of cell growth. J Virol 1993, 67:476-488.
Braithwaite AW, Cheetham BF, Li P, Parish CR, Waldron-Stevens LK,
Bellett A: Adenovirus-induced alterations of the cell growth
cycle: a requirement for expression of E1A but not of E1B. J
Virol 1983, 45:192-199.
Spindler KR, Eng CY, Berk AJ: An adenovirus early region 1A
protein is required for maximal viral DNA replication in
growth-arrested human cells. J Virol 1985, 53:742-750.
Zerler B, Roberts RJ, Mathews MB, Moran E: Different functional
domains of the adenovirus E1A genes are involved in the regulation of host cell cycle products. Mol Cell Biol 1987, 7:821-829.
Wold WS, Doronin K, Toth K, Kuppuswamy M, Lichtenstein DL,
Tollefson AE: Immune responses to adenoviruses: viral
evasion mechanisms and their implications for the clinic.
Curr Opin Immunol 1999, 11:380-386.
Horwitz MS: Adenovirus immunoregulatory genes and their
cellular targets. Virology 2001, 279:1-8.
Cuconati A, White E: Viral homologs of BCL-2: role of apoptosis in the regulation of virus infection. Genes Dev 2002,
16:2465-2478.
Teodoro JG, Branton PE: Regulation of p53-dependent apoptosis, transcriptional repression, and cell transformation by
phosphorylation of the 55-kilodalton E1B protein of human
adenovirus type 5. J Virol 1997, 71:3620-3627.
Yew PR, Berk AJ: Inhibition of p53 transactivation required for
transformation by adenovirus early 1B protein. Nature 1992,
357:82-85.
Roth J, Dobbelstein M, Freedman DA, Shenk T, Levine AJ: Nucleocytoplasmic shuttling of the hdm2 oncoprotein regulates the
levels of the p53 protein via a pathway used by the human
immunodeficiency virus rev protein. EMBO J 1998, 17:554-564.
Steegenga WT, Riteco N, Jochemsen AG, Fallaux FJ, Bos JL: The
large E1B protein together with the E4orf6 protein target
p53 for active degradation in adenovirus infected cells. Oncogene 1998, 16:349-357.
Querido E, Marcellus RC, Lai A, Charbonneau R, Teodoro JG, Ketner
G, Branton PE: Regulation of p53 levels by the E1B 55-kilodalton protein and E4orf6 in adenovirus-infected cells. J Virol
1997, 71:3788-3798.
Iftode C, Flint SJ: Viral synthesis-dependent titration of a cellular repressor activates transcription of the human adenovirus type 2 IVa2 gene.
Proc Natl Acad Sci USA 2004,
101:17831-17836.
Lin HJ, Flint SJ: Identification of a cellular repressor of transcription of the adenoviral late IVa2 gene that is unaltered in
activity in infected cells. Virology 2000, 277:397-410.
Tribouley C, Lutz P, Staub A, Kedinger C: The product of the adenovirus intermediate gene IVa2 is a transcription activator of
the major late promoter. J Virol 1994, 68:4450-4457.
Pardo-Mateos A, Young CS: Adenovirus IVa2 protein plays an
important role in transcription from the major late
reviews
We wish to thank Sanjay Chandriani and John C Matese for invaluable
advice and discussion. HAC is grateful for support by the Rita Allen Foundation as a Milton E Cassel Scholar, Center of Excellence Grant
P50GM071508 from the National Institute of General Medical Science/
National Institutes of Health, and the PhRMA Foundation. SJF is supported
by a grant from the National Institute of Allergy and Infectious Diseases,
National Institutes of Health.
Miller et al. R58.17
comment
The following additional data are available with the online
version of this paper. Additional file 1 provides dataset shown
in Figure 3 (k-means clustered expression data for all genes
that pass the fold change and specificity filters). Additional
data file 2 shows the validation of microarray data by RTPCR.
Volume 8, Issue 4, Article R58
R58.18 Genome Biology 2007,
44.
45.
46.
47.
48.
49.
50.
51.
52.
53.
54.
55.
56.
57.
58.
59.
60.
61.
62.
63.
64.
65.
66.
67.
68.
69.
Volume 8, Issue 4, Article R58
Miller et al.
promoter in vivo. Virology 2004, 327:50-59.
Benihoud K, Yeh P, Perricaudet M: Adenovirus vectors for gene
delivery. Curr Opin Biotechnol 1999, 10:440-447.
Basak SK, Kiertscher SM, Harui A, Roth MD: Modifying adenoviral
vectors for use as gene-based cancer vaccines. Viral Immunol
2004, 17:182-196.
Ghosh SS, Gopinath P, Ramesh A: Adenoviral vectors: a promising tool for gene therapy. Appl Biochem Biotechnol 2006, 133:9-29.
Verma IM, Weitzman MD: Gene therapy: twenty-first century
medicine. Annu Rev Biochem 2005, 74:711-738.
Lichtenstein DL, Wold WS: Experimental infections of humans
with wild-type adenoviruses and with replication-competent
adenovirus vectors: replication, safety, and transmission.
Cancer Gene Ther 2004, 11:819-829.
Everts B, van der Poel HG: Replication-selective oncolytic
viruses in the treatment of cancer. Cancer Gene Ther 2005,
12:141-161.
Dobbelstein M: Replicating adenoviruses in cancer therapy.
Curr Top Microbiol Immunol 2004, 273:291-334.
Gonzalez R, Huang W, Finnen R, Bragg C, Flint SJ: Adenovirus E1B
55-kilodalton protein is required for both regulation of
mRNA export and efficient entry into the late phase of infection in normal human fibroblasts. J Virol 2006, 80:964-974.
Princeton University PUMA database
[nce
ton.edu]
Tusher VG, Tibshirani R, Chu G: Significance analysis of microarrays applied to the ionizing radiation response. Proc Natl
Acad Sci USA 2001, 98:5116-5121.
Zhao LY, Colosimo AL, Liu Y, Wan Y, Liao D: Adenovirus E1B 55kilodalton oncoprotein binds to Daxx and eliminates
enhancement of p53-dependent transcription by Daxx. J Virol
2003, 77:11809-11821.
Granberg F, Svensson C, Pettersson U, Zhao H: Modulation of host
cell gene expression during onset of the late phase of an adenovirus infection is focused on growth inhibition and cell
architecture. Virology 2005, 343:236-245.
Schwarz E, Freese UK, Gissmann L, Mayer W, Roggenbuck B, Stremlau A, zur Hausen H: Structure and transcription of human papillomavirus sequences in cervical carcinoma cells. Nature
1985, 314:111-114.
Helt AM, Galloway DA: Mechanisms by which DNA tumor virus
oncoproteins target the Rb family of pocket proteins. Carcinogenesis 2003, 24:159-169.
Uhnoo I, Svensson L, Wadell G: Enteric adenoviruses. Baillieres
Clin Gastroenterol 1990, 4:627-642.
Vousden KH: Regulation of the cell cycle by viral
oncoproteins. Semin Cancer Biol 1995, 6:109-116.
Yeung KY, Haynor DR, Ruzzo WL: Validating clustering for gene
expression data. Bioinformatics 2001, 17:309-318.
Gene Ontology Consortium []
Coller HA, Sang L, Roberts JM: A new description of cellular
quiescence. PLoS Biol 2006, 4:e83.
Goodbourn S, Didcock L, Randall RE: Interferons: cell signalling,
immune modulation, antiviral response and virus
countermeasures. J Gen Virol 2000, 81:2341-2364.
Hatada EN, Krappmann D, Scheidereit C: NF-kappaB and the
innate immune response. Curr Opin Immunol 2000, 12:52-58.
Iyer VR, Eisen MB, Ross DT, Schuler G, Moore T, Lee JC, Trent JM,
Staudt LM, Hudson J Jr, Boguski MS, et al.: The transcriptional program in the response of human fibroblasts to serum. Science
1999, 283:83-87.
Chang HY, Chi JT, Dudoit S, Bondre C, van de Rijn M, Botstein D,
Brown PO: Diversity, topographic differentiation, and positional memory in human fibroblasts. Proc Natl Acad Sci USA
2002, 99:12877-12882.
Chang HY, Sneddon JB, Alizadeh AA, Sood R, West RB, Montgomery
K, Chi JT, van de Rijn M, Botstein D, Brown PO: Gene expression
signature of fibroblast serum response predicts human cancer progression: similarities between tumors and wounds.
PLoS Biol 2004, 2:E7.
Whitfield ML, Sherlock G, Saldanha AJ, Murray JI, Ball CA, Alexander
KE, Matese JC, Perou CM, Hurt MM, Brown PO, Botstein D: Identification of genes periodically expressed in the human cell
cycle and their expression in tumors. Mol Biol Cell 2002,
13:1977-2000.
Li E, Stupack D, Klemke R, Cheresh DA, Nemerow GR: Adenovirus
endocytosis via alpha(v) integrins requires phosphoinositide3-OH kinase. J Virol 1998, 72:2055-2061.
/>
70.
71.
72.
73.
74.
75.
76.
77.
78.
79.
80.
81.
82.
83.
84.
85.
86.
87.
88.
89.
90.
91.
92.
93.
94.
Bader AG, Kang S, Zhao L, Vogt PK: Oncogenic PI3K deregulates
transcription and translation. Nat Rev Cancer 2005, 5:921-929.
Martinez-Gac L, Alvarez B, Garcia Z, Marques M, Arrizabalaga M, Carrera AC: Phosphoinositide 3-kinase and Forkhead, a switch
for cell division. Biochem Soc Trans 2004, 32:360-361.
Burgering BM, Kops GJ: Cell cycle and death control: long live
Forkheads. Trends Biochem Sci 2002, 27:352-360.
Brunet A, Datta SR, Greenberg ME: Transcription-dependent
and -independent control of neuronal survival by the PI3KAkt signaling pathway. Curr Opin Neurobiol 2001, 11:297-305.
Stevaux O, Dyson NJ: A revised picture of the E2F transcriptional network and RB function. Curr Opin Cell Biol 2002,
14:684-691.
Giangrande PH, Zhu W, Schlisio S, Sun X, Mori S, Gaubatz S, Nevins
JR: A role for E2F6 in distinguishing G1/S- and G2/M-specific
transcription. Genes Dev 2004, 18:2941-2951.
Attwooll C, Oddi S, Cartwright P, Prosperini E, Agger K, Steensgaard
P, Wagener C, Sardet C, Moroni MC, Helin K: A novel repressive
E2F6 complex containing the polycomb group protein,
EPC1, that interacts with EZH2 in a proliferation-specific
manner. J Biol Chem 2005, 280:1199-1208.
Di Stefano L, Jensen MR, Helin K: E2F7, a novel E2F featuring DPindependent repression of a subset of E2F-regulated genes.
EMBO J 2003, 22:6289-6298.
Guerra S, Lopez-Fernandez LA, Conde R, Pascual-Montano A, Harshman K, Esteban M: Microarray analysis reveals characteristic
changes of host cell gene expression in response to attenuated modified vaccinia virus Ankara infection of human
HeLa cells. J Virol 2004, 78:5820-5834.
Wu L, Timmers C, Maiti B, Saavedra HI, Sang L, Chong GT, Nuckolls
F, Giangrande P, Wright FA, Field SJ, et al.: The E2F1-3 transcription factors are essential for cellular proliferation. Nature
2001, 414:457-462.
Hatakeyama M, Weinberg RA: The role of RB in cell cycle
control. Prog Cell Cycle Res 1995, 1:9-19.
Nevins JR: Adenovirus E1A: transcription regulation and
alteration of cell growth control. Curr Top Microbiol Immunol
1995, 199:25-32.
Adams PD, Kaelin WG Jr: Transcriptional control by E2F. Semin
Cancer Biol 1995, 6:99-108.
Tao Y, Kassatly RF, Cress WD, Horowitz JM: Subunit composition
determines E2F DNA-binding site specificity. Mol Cell Biol
1997, 17:6994-7007.
Kel AE, Kel-Margoulis OV, Farnham PJ, Bartley SM, Wingender E,
Zhang MQ: Computer-assisted identification of cell cyclerelated genes: new targets for E2F transcription factors. J
Mol Biol 2001, 309:99-120.
Bieda M, Xu X, Singer MA, Green R, Farnham PJ: Unbiased location
analysis of E2F1-binding sites suggests a widespread role for
E2F1 in the human genome. Genome Res 2006, 16:595-605.
Ren B, Cam H, Takahashi Y, Volkert T, Terragni J, Young RA,
Dynlacht BD: E2F integrates cell cycle progression with DNA
repair, replication, and G2/M checkpoints. Genes Dev 2002,
16:245-256.
Boyd JM, Subramanian T, Schaeper U, La Regina M, Bayley S, Chinnadurai G: A region in the C-terminus of adenovirus 2/5 E1a protein is required for association with a cellular
phosphoprotein and important for the negative modulation
of T24-ras mediated transformation, tumorigenesis and
metastasis. EMBO J 1993, 12:469-478.
Chinnadurai G: CtBP, an unconventional transcriptional corepressor in development and oncogenesis. Mol Cell 2002,
9:213-224.
Yew PR, Liu X, Berk AJ: Adenovirus E1B oncoprotein tethers a
transcriptional repression domain to p53. Genes Dev 1994,
8:190-202.
Martin ME, Berk AJ: Adenovirus E1B 55K represses p53 activation in vitro. J Virol 1998, 72:3146-3154.
Martin ME, Berk AJ: Corepressor required for adenovirus E1B
55,000-molecular-weight protein repression of basal
transcription. Mol Cell Biol 1999, 19:3403-3414.
Liu Y, Colosimo AL, Yang XJ, Liao D: Adenovirus E1B 55-kilodalton oncoprotein inhibits p53 acetylation by PCAF. Mol Cell
Biol 2000, 20:5540-5553.
Prives C: Signaling to p53: breaking the MDM2-p53 circuit.
Cell 1998, 95:5-8.
Kannan K, Amariglio N, Rechavi G, Jakob-Hirsch J, Kela I, Kaminski N,
Getz G, Domany E, Givol D: DNA microarrays identification of
Genome Biology 2007, 8:R58
/>
95.
97.
98.
99.
101.
102.
103.
105.
106.
deposited research
107.
reports
104.
Miller et al. R58.19
reviews
100.
primary and secondary target genes regulated by p53. Oncogene 2001, 20:2225-2234.
Flint SJ, Gallimore PH, Sharp PA: Comparison of viral RNA
sequences in adenovirus 2-transformed and lytically infected
cells. J Mol Biol 1975, 96:47-68.
Williams JF: Oncogenic transformation of hamster embryo
cells in vitro by adenovirus type 5. Nature 1973, 243:162-163.
Gonzalez RA, Flint SJ: Effects of mutations in the adenoviral
E1B 55 kDa protein coding sequence on viral late mRNA
metabolism. J Virol 2002, 76:4507-4519.
Reich NC, Sarnow P, Duprey E, Levine AJ: Monoclonal antibodies
which recognise native and denatured forms of the adenovirus DNA-binding protein. Virology 1983, 128:480-484.
Lunt R, Vayda ME, Young M, Flint SJ: Isolation and characterization of monoclonal antibodies against the adenovirus core
proteins. Virology 1988, 164:275-279.
SOURCE
[ />Search]
Protein Information Resource [ />www/search/batch.shtml]
Monti S, Tamayo P, Mesirov J, Golub T: Consensus clustering: a
resampling-based method for visualization of gene expression microarray data. Machine Learning 2003, 52:91-118.
Saeed AI, Sharov V, White J, Li J, Liang W, Bhagabati N, Braisted J,
Klapa M, Currier T, Thiagarajan M, et al.: TM4: a free, open-source
system for microarray data management and analysis. Biotechniques 2003, 34:374-378.
Princeton University PUMA database for Ad5 [http://genom
ics-pubs.princeton.edu/Ad5_HFF]
Java Treeview []
Boyle EI, Weng S, Gollub J, Jin H, Botstein D, Cherry JM, Sherlock G:
GO:TermFinder - open source software for accessing Gene
Ontology information and finding significantly enriched
Gene Ontology terms associated with a list of genes. Bioinformatics 2004, 20:3710-3715.
Sealfon RS, Hibbs MA, Huttenhower C, Myers CL, Troyanskaya OG:
GOLEM: an interactive graph-based gene-ontology navigation and analysis tool. BMC Bioinformatics 2006, 7:443.
Volume 8, Issue 4, Article R58
comment
96.
Genome Biology 2007,
refereed research
interactions
information
Genome Biology 2007, 8:R58