Báo cáo y học: "Genetic analysis of the human infective trypanosome Trypanosoma brucei gambiense: chromosomal segregation, crossing over, and the construction of a genetic map" doc
Bạn đang xem bản rút gọn của tài liệu. Xem và tải ngay bản đầy đủ của tài liệu tại đây (479.32 KB, 12 trang )
Genome Biology 2008, 9:R103
Open Access
2008Cooperet al.Volume 9, Issue 6, Article R103
Research
Genetic analysis of the human infective trypanosome Trypanosoma
brucei gambiense: chromosomal segregation, crossing over, and the
construction of a genetic map
Anneli Cooper
*†
, Andy Tait
*
, Lindsay Sweeney
*
, Alison Tweedie
*
,
Liam Morrison
*
, C Michael R Turner
*†
and Annette MacLeod
*
Addresses:
*
Wellcome Centre for Molecular Parasitology, Glasgow Biomedical Research Centre, University Place, Glasgow, G12 8TA, UK.
†
Division of Infection and Immunity, Faculty of Biomedical and Life Sciences, Glasgow Biomedical Research Centre, University Place, Glasgow,
G12 8TA, UK.
Correspondence: Anneli Cooper. Email:
© 2008 Cooper et al.; licensee BioMed Central Ltd.
This is an open access article distributed under the terms of the Creative Commons Attribution License ( which
permits unrestricted use, distribution, and reproduction in any medium, provided the original work is properly cited.
Trypanosoma brucei gambiense genetic linkage map<p>A high-resolution genetic linkage map of the STIB 386 strain of <it>Trypanosoma brucei gambiense</it> is presented.</p>
Abstract
Background: Trypanosoma brucei is the causative agent of human sleeping sickness and animal
trypanosomiasis in sub-Saharan Africa, and it has been subdivided into three subspecies:
Trypanosoma brucei gambiense and Trypanosoma brucei rhodesiense, which cause sleeping sickness in
humans, and the nonhuman infective Trypanosoma brucei brucei. T. b. gambiense is the most clinically
relevant subspecies, being responsible for more than 90% of all trypanosomal disease in humans.
The genome sequence is now available, and a Mendelian genetic system has been demonstrated in
T. brucei, facilitating genetic analysis in this diploid protozoan parasite. As an essential step toward
identifying loci that determine important traits in the human-infective subspecies, we report the
construction of a high-resolution genetic map of the STIB 386 strain of T. b. gambiense.
Results: The genetic map was determined using 119 microsatellite markers assigned to the 11
megabase chromosomes. The total genetic map length of the linkage groups was 733.1 cM, covering
a physical distance of 17.9 megabases with an average map unit size of 24 kilobases/cM. Forty-seven
markers in this map were also used in a genetic map of the nonhuman infective T. b. brucei
subspecies, permitting comparison of the two maps and showing that synteny is conserved between
the two subspecies.
Conclusion: The genetic linkage map presented here is the first available for the human-infective
trypanosome T. b. gambiense. In combination with the genome sequence, this opens up the
possibility of using genetic analysis to identify the loci responsible for T. b. gambiense specific traits
such as human infectivity as well as comparative studies of parasite field populations.
Background
Genetic maps can be used to establish the order, location, and
relative distance of genetic markers in organisms that
undergo sexual recombination, as well as to define some of
the basic features of recombination. Their most important
application, however, is in the identification of loci that
Published: 22 June 2008
Genome Biology 2008, 9:R103 (doi:10.1186/gb-2008-9-6-r103)
Received: 8 February 2008
Revised: 20 May 2008
Accepted: 22 June 2008
The electronic version of this article is the complete one and can be
found online at />Genome Biology 2008, 9:R103
Genome Biology 2008, Volume 9, Issue 6, Article R103 Cooper et al. R103.2
determine traits or phenotypes that differ between individu-
als by linkage analysis. The importance of the genetic map-
ping of traits as a tool, coupled with positional cloning, is
particularly high when analyzing both simple and complex
phenotypes for which there are no obvious candidate genes,
and it provides a complementary tool with which to reverse
genetics in order to analyze gene function.
Genetic maps have been generated for a number of haploid
eukaryotic pathogens including Plasmodium falciparum [1],
Plasmodium chabaudi chabaudi [2], Toxoplasma gondii [3],
and Eimeria tenella [4]. The genetic linkage approach, using
such maps, has been an important tool for mapping genes
which are responsible for drug resistance [5,6], virulence [7-
10], and strain specific immunity [11]. An important feature
of the maps of all these organisms is that the physical size of
the recombination unit is relatively small, ranging from 17
kilobases (kb) per cM in the case of P. falciparum [1] to 100
to 215 kb in the case of E. tenella and T. gondii [3,4,12]. This
means that the analysis of relatively few progeny can provide
high mapping resolution; this is in contrast to higher eukary-
otes, in which the physical size of the recombination unit is
usually considerably greater [13].
The use of this approach to identify loci linked to traits of
interest in diploid pathogens has been more limited. This is
either because there is no evidence for a system of genetic
exchange (a crucial requirement for the application of this
approach) or the basic rules of how genetic exchange occurs
have not been fully defined. Trypanosoma brucei is a diploid
protozoan parasite for which genetic exchange has successful
been demonstrated, first by Jenni and coworkers [14] and in
multiple crosses since [15]. This tsetse-transmitted parasite is
the causative agent of human sleeping sickness and animal
trypanosomiasis in sub-Saharan Africa, and can be subdi-
vided into three morphologically identical subspecies:
Trypanosoma brucei gambiense and Trypanosoma brucei
rhodesiense, which are the cause of sleeping sickness in
humans; and the nonhuman infective Trypanosoma brucei
brucei subspecies.
Over the past 20 years, several experimental genetic crosses
have been performed both between and within subspecies
(for review [15]). This includes the crossing of two T. b. brucei
and a T. b. gambiense strain in all pair-wise combinations
[16], from which the products of mating have been defined as
the equivalent of F
1
progeny, with the inheritance of alleles at
parental heterozygous loci conforming to Mendelian ratios
[17]. The strains used in these crosses (STIB 247, STIB 386,
and TREU 927) were isolated from different regions of Africa
and different hosts. They also differ in a range of phenotypes
[18], allowing the genetic basis of these differences to be
analyzed.
The chromosomes of T. brucei do not condense during mito-
sis, but the nuclear karyotype has been observed by separat-
ing chromosomes using pulsed field gel electrophoresis
(PFGE) [19]. Unusually, the genome consists of three classes
of chromosomes, which are categorized by size based on their
migration in an electric field. The 11 diploid megabase chro-
mosomes (1 to 6 megabases [Mb]) contain the housekeeping
genes [20,21]; one to seven intermediate chromosomes (200
to 900 kb) of uncertain ploidy contain expression sites for the
variant surface glycoprotein (VSG) genes, which are involved
in antigenic variation [22]; and approximately 100 transcrip-
tionally silent minichromosomes (50 to 150 kb) contain
sequences for expanding the repertoire of available VSG
genes [23,24].
A project to sequence the megabase chromosomes of T. bru-
cei has resulted in the availability of the genome sequence for
one of the T. b. brucei isolates, namely TREU 927 [25], which
has been used in several of the genetic crosses, and this has
been utilized by our laboratory to generate a genetic map for
this strain [26]. It is the T. b. gambiense subspecies, however,
that is responsible for the majority of current human African
trypanosomiasis infections in sub-Saharan Africa [27,28].
Although it is related to T. b. brucei, it differs in several
important phenotypic characteristics, such as human infec-
tivity. A separate T. b. gambiense genetic map is therefore
desirable for the study of specific mechanisms of disease in
this pathogenic subspecies.
For this reason, the strain STIB 386 is of particular interest as
it was isolated from a human in West Africa and is conse-
quently defined as T. b. gambiense. Two types of this human-
infective subspecies have been identified, types 1 and 2 [29],
that differ in biologic features such as growth in rodents and
constitutive or nonconstitutive expression of resistance to
lysis by human serum (a measure of human infectivity); they
also differ at the molecular level, based on findings with a
range of polymorphic markers [30,31].
The STIB 386 strain is a type 2 T. b. gambiense, with the char-
acteristics of ready growth in rodents and variable expression
of human serum resistance [32] as well as differing in a
number of other phenotypes from strain STIB 247. We have
previously reported data from a cross between these two
strains (STIB 386 × STIB 247) and the Mendelian segregation
of 11 markers, each on separate chromosomes, into 38 inde-
pendent F
1
progeny isolated from the cross [17]. As an essen-
tial and important step toward using this cross to map genes
determining traits of importance in the human-infective sub-
species of T. brucei, we report the construction of a genetic
map of the STIB 386 strain of T. b. gambiense, defining the
key features of recombination and providing a comparative
analysis with the genetic map of T. b. brucei strain TREU 927.
Genome Biology 2008, Volume 9, Issue 6, Article R103 Cooper et al. R103.3
Genome Biology 2008, 9:R103
Results
Identification of heterozygous markers and the
genotyping of F
1
progeny
The T. brucei genome sequence from strain TREU 927 had
previously been screened using the Tandem Repeat Finder
program [33] to identify microsatellites, which were evenly
distributed across the genome. A total of 810 pairs of primers
was designed to the unique sequence flanking each microsat-
ellite locus [26]. These primers were used to amplify by PCR
the microsatellites from the two parental stocks, STIB 386
and STIB 247, thus identifying markers that were hetero-
zygous and could therefore be used to construct a genetic map
of STIB 386. Heterozygous markers were defined by the
amplification of two different sized PCR products in STIB
386, which could be easily separated and visualized by gel
electrophoresis.
In all, 99 potentially informative markers were identified
using this method and so could be used for the construction
of a partial genetic map, whereas the remaining 711 markers
either amplified a homozygous band in STIB 386 or failed to
amplify any PCR product. Of these 99 heterozygous markers,
47 had also previously been found to be heterozygous for
TREU 927 and so were included in the construction of both
the T. b. brucei and T. b. gambiense genetic maps.
Following this initial microsatellite screen, further markers
were sought to fill in regions of the genome that were not cov-
ered by a heterozygous marker for STIB 386. An additional
215 primer pairs were designed to screen further microsatel-
lites from these regions, resulting in the identification of an
additional 20 heterozygous markers and a total marker cov-
erage of 119 heterozygous markers. Overall the level of heter-
ozygosity for all the markers screened is significantly lower, at
12.5%, than the value of 20% reported for the genome strain
(χ
2
[1 degree of freedom] = 27.3; P < 0.01) [26]. Thirty-eight
F
1
progeny clones from the cross between STIB 386 and STIB
247 were genotyped with the 119 markers and the segregation
patterns in the progeny were scored to generate a full geno-
type of each progeny clone (Additional data file 1 contains the
complete segregation data).
Construction of the STIB 386 genetic linkage map
The inheritance pattern of STIB 386 alleles, at each hetero-
zygous locus, in the 38 F
1
progeny was determined (Addi-
tional data file 1) and the segregation data used to construct a
genetic map using the Map Manager QTX program [34]. This
linked the 119 markers into 12 linkage groups, which corre-
spond to the 11 housekeeping chromosomes. The genetic link-
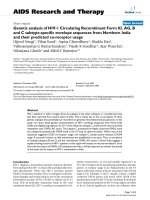
age map of each chromosome is shown in Figure 1, and
although ten chromosomes (1, 2, 3, 4, 5, 6, 7, 8, 9, and 11) con-
sist of one linkage group each, chromosome 10 currently com-
prises two groups. The main characteristics of the linkage
groups obtained are summarized in Table 1. The genetic dis-
tances, based on the number of recombination units between
each marker, are expressed in centiMorgans, which added
together for all 12 linkage groups gave a total genetic map
length of 733.1 cM. The size of each chromosome and the
physical distances between markers were based on the TREU
927 T. b. brucei sequence [25]. Using these figures, the
genetic map covers 17.9 Mb, which equates to an approximate
genome coverage of 70%. However, this calculation includes
the gene-poor subtelomeric regions, which the genetic map
does not extend into because of the difficulties in identifying
Table 1
Characteristics of the genetic linkage maps of Trypanosoma brucei gambiense
Chromosome Number of markers Genetic length (cM)
a
Physical size (Mb)
b
Recombination Frequency
(kb/cM)
Average number of crossover
events/meiosis
1 10 51.20 0.74 14.53 0.46
2 10 47.60 0.74 15.46 0.42
3 10 46.90 1.25 26.74 0.42
4 12 54.40 1.05 19.30 0.50
5 7 90.60 1.20 13.29 0.74
6 9 42.40 0.94 22.13 0.35
7 7 46.90 1.65 35.08 0.40
8 11 115.60 2.30 19.88 0.95
9 10 73.10 2.10 28.67 0.65
10
c
12 76.10 2.50 32.85 1.08
11 21 88.30 3.42 38.76 0.71
Average 24.40 0.61
Total 119 733.10 17.89
a
Total genetic length was calculated by the addition of recombination units between each marker.
b
Physical distances were calculated from the T. b.
brucei genome sequence [25].
c
Chromosome 10 is a combination of two linkage groups.
Genome Biology 2008, 9:R103
Genome Biology 2008, Volume 9, Issue 6, Article R103 Cooper et al. R103.4
unique sequences in these regions.
On average, the crossover frequency was found to be 0.6
crossovers/chromosome/individual progeny clone in the
mapped population (Table 1) and the average recombination
unit size is 24.4 kb/cM. This provides a 9 cM resolution
genetic map with a 90% probability of mapping any locus to
within 11 cM (268 kb). The physical position of each micros-
atellite marker, based on the genome sequence of T. b. brucei
[25], allows us to compare the position of markers in the
physical map of T. b. brucei and the genetic map of T. b. gam-
biense, revealing that synteny is conserved for all markers on
all chromosomes (Additional data files 1 and 2).
Marker segregation proportions
The availability of segregation data across the length of each
chromosome allows a full analysis of the inheritance of the
STIB 386 parental chromosome homologs. The ratio of segre-
gation of alleles for each heterozygous marker was calculated
along each chromosome with the 95% confidence limits of a
1:1 segregation with 38 F
1
progeny. This analysis had previ-
ously been conducted for the STIB 386 map of one of the
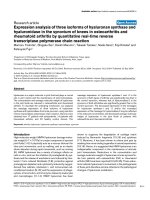
Genetic linkage maps corresponding to the 11 Mb chromosomes of Trypanosoma brucei gambienseFigure 1
Genetic linkage maps corresponding to the 11 Mb chromosomes of Trypanosoma brucei gambiense. Every microsatellite marker (shown to the right of each
linkage group) has been anchored to the physical map, and the physical location (derived from the T. b. brucei genome sequence [25]) is identified in the
supplementary data (Additional data file 1). The corresponding genetic distances between intervals is shown in cM on the left of each map and the total
genetic size of each linkage group given below.
1
TB1/4
TB1/10
TB1/1
TB1/17
TB1/12
TB1/16
TB1/15
TB1/14
TB1/2
TB1/6
25.5cM
6.1cM
3.1cM
10.4cM
3.2cM
2.9cM
51.2cM
2
6.1cM
21.0cM
6.1cM
8.4cM
3.0cM
3.0cM
TB2/2
TB2/20
TB2/19
TB2/18
TB2/15
TB2/12
TB2/9 TB2/10
TB2/7
TB2/4
47.6cM
3
TB3/1
TB3/14
TB3/13 TB3/10
TB3/23
TB3/22TB3/21
TB3/4
TB3/20
TB3/19
2.7cM
5.6cM
8.8cM
2.9cM
5.9cM
15.3cM
5.7cM
46.9cM
TB4/19
4
TB4/8
TB4/4
54.4cM
TB4/13
TB4/12
TB4/22
TB4/21
TB4/20
TB4/5
TB4/18
TB4/2
16.8cM
3.0cM
6.3cM
6.5cM
9.4cM
6.3cM
6.1cM
TB4/17
TB5/17
TB5/15
TB5/20
TB5/19
TB5/18
TB5/4
TB5/16
12.6cM
15.8cM
29.4cM
21.0cM
11.8cM
5
90.6cM
6
TB6/6
42.4cM
TB6/9
TB6/15
TB6/13
TB6/12
TB6/11
TB6/10
TB6/14
13.9cM
2.9cM
2.9cM
6.1cM
3.2cM
13.4cM
TB6/16
TB7/16
TB7/14
TB7/17
TB7/15
TB7/5
TB7/4
2.9cM
18.0cM
13.0cM
13.0cM
7
46.9cM
TB7/1
8
TB8/12
TB8/21
TB8/20
TB8/19
TB8/10
TB8/18
TB8/16
TB8/15
TB8/14
TB8/13
17.4cM
9.1cM
9.4cM
20.3cM
29.4cM
14.4cM
6.1cM
3.0cM
6.5cM
115.6cM
9
73.1cM
TB9/22
TB9/18
TB9/14
TB9/12
TB9/9
TB9/5
TB9/21
TB9/20
TB9/19
5.9cM
9.1cM
5.9cM
9.1cM
12.6cM
2.9cM
24.6cM
3.0cM
TB9/17
10
TB10/24
TB10/30
TB10/19
TB10/29
TB10/28
TB10/27
TB10/26
TB10/14
TB10/12
TB10/25
3.0cM
6.5cM
13.0cM
2.9cM
9.1cM
16.3cM
5.9cM
16.3cM
73.0cM
TB10/23
3.1cM
TB10/22
3.1cM
11
88.3cM
TB11/32
TB11/23
TB11/45
TB11/44
TB11/43
TB11/21
TB11/42
TB11/41
TB11/40
TB11/39
TB11/38
TB11/37
TB11/15
TB11/36
TB11/35
TB11/34
TB11/13
TB11/11
TB11/10
TB11/33TB11/7
3.2cM
2.9cM
6.7cM
6.9cM
3.1cM
6.5cM
3.0cM
3.4cM
22.6cM
13.4cM
9.7cM
6.9cM
TB8/17
TB3/23
TB9/9
Genome Biology 2008, Volume 9, Issue 6, Article R103 Cooper et al. R103.5
Genome Biology 2008, 9:R103
smallest chromosomes, namely chromosome 1, and detected
a region of significant distortion across the left arm of the
chromosome [17]. Segregation analysis has now been per-
formed on the remaining ten chromosomes (Figure 2) and
this shows no evidence of distortion from a 1:1 segregation
ratio across the length of chromosomes 4, 8, 9, or 10. On chro-
mosomes 2, 5, 6, 7, and 11 there is one marker per chromo-
some, and on chromosome 3 there are two markers that have
been inherited at proportions just outside the 95% confidence
limits. However, it should be considered that this totals only
seven out of 109 markers analyzed (6%), which is close to the
5% of outliers that would be expected with 95% confidence
intervals and thus are unlikely to signify regions of true segre-
gation distortion. Therefore, the previously reported region of
chromosome 1 remains the only region of the STIB 386
genetic map for which there is evidence of any significant seg-
regation distortion. The origin of this distortion is not known,
but one possibility is that it is the result of postmeiotic selec-
tion acting on the uncloned progeny during growth in mice
before isolation.
Variation in recombination between chromosomes
Although the average rate of recombination in the T. b. gam-
biense map was found to be 24.4 kb/cM, there is variation
both between and within the chromosomes, as is common in
many other eukaryotic organisms [35]. A correlation of the
physical and genetic sizes of every chromosome in the map is
shown in Figure 3, and the average physical size of a recombi-
nation unit ranges from a high of 39 kb/cM on chromosome
11 to a low of 13 kb/cM on chromosome 5 (Table 1). Variation
is also evident between specific intervals across chromosomes
where a map unit can vary from under 1 kb/cM up to 170 kb/
cM on the same chromosome (chromosome 11; Additional
data file 2) representing extremes in recombination fre-
quency. If we define hot and cold spots of recombination as
three times less (cold) or three times more (hot) than the
average recombination rate, the boundaries for defining hot
and cold regions can be set at under 8 kb/cM and over 73 kb/
cM, respectively, based on an average physical size of a
recombination unit of 24 kb/cM. Analysis of crossovers in the
STIB 386 × STIB 247 progeny revealed that variation in
recombination frequency between markers is common, pro-
ducing a least one hot or cold region on every chromosomes
and a total of 15 hot and 27 cold spots overall (Figure 4 and
Additional data file 2).
Variation in recombination was also noted as a common fea-
ture in the T. b. brucei TREU 927 map [26]. Data from the T.
b. brucei genetic map was re-analyzed alongside the T. b.
gambiense map to identify regions of high and low recombi-
nation using the same definition of boundaries. Based on an
average physical recombination unit size of 15.6 kb/cM for
TREU 927, hot and cold spot boundaries could therefore be
defined as under 5.2 kb/cM and over 46.8 kb/cM, respec-
tively. As a result of this analysis, a similar number of hot and
cold regions were identified on the TREU 927 map, with a
total of 20 hot and 32 cold spots overall (Figure 4 and Addi-
tional data file 2).
A more detailed comparison of these regions with those iden-
tified on STIB 386 was then performed, and four areas of high
recombination (hot) and ten of low recombination (cold)
were found to overlap the same physical location on both
genetic maps. Chromosome 2, for example (Figure 4b), has a
region of higher recombination toward the center of the chro-
mosome (denoted in red), which contains two of the STIB 386
hot spots and four of the TREU 927 hot spots, as well as a
large shared cold spot (denoted in blue) toward the end of the
chromosome, with no evidence of recombination over a dis-
tance of more than 200 kb on either map. In contrast, there
are also several regions, where a STIB 386 hot spot corre-
sponds to a cold spot on TREU 927, as illustrated at the end
of chromosome 1 (Figure 4a) and vice versa (for example,
chromosome 8; Additional data file 2). Although local varia-
tion in crossover frequency appears to be a common feature
of both the T. b. brucei and T. b. gambiense maps, this bal-
ances out over the full length of each chromosome, with the
net result being that the total genetic distance of linkage
groups is correlated with their physical size (Figure 3).
Comparison of the genetic maps of T. b. gambiense and
T. b. brucei and the physical map of T. b. brucei
The linkage groups of the STIB 386 genetic map comprise a
total genetic distance of 733.1 cM covering a physical distance
of 17.9 Mb, compared to a genetic map of 1,157 cM covering
18.06 Mb for the T. b. brucei TREU 927 map [26]. Although
the genetic distance covered by the STIB 386 map is smaller,
there is no significant difference in frequency of recombina-
tion (kb/cM) between the two subspecies (χ
2
[1 degree of free-
dom] = 1.936; P = 0.164), and they contain very similar
marker densities (average cMs between intervals) of 9.0 cM
for STIB 386 and 9.5 cM for TREU 927.
Because 47 markers are informative in both the T. b. brucei
and T. b. gambiense maps, this allows a direct evaluation of
genetic distances between the maps, and comparison with the
physical T. b. brucei map. For six chromosomes for which
there are four or more shared markers (chromosomes 1, 2, 3,
4, 9 and 11), synteny in terms of marker order is conserved
(Figure 4 and Additional data file 2). The rest of the chromo-
somes have fewer shared markers, making comparisons less
informative, but no inconsistencies between the genetic map
and the physical map of TREU 927 were detected. The karyo-
type of both strains has been determined by PFGE [20] and,
in terms of chromosome size, seven of the chromosome pairs
of STIB 386 are found to be considerably larger than those of
TREU 927 (chromosomes 1, 4, 6, 7, 8, 9, and 10). If these
physical size differences occurred in regions of each chromo-
some covered by the genetic map, then one would predict that
the recombination frequency of the STIB 386 chromosomes
would be correspondingly higher and result in larger genetic
Genome Biology 2008, 9:R103
Genome Biology 2008, Volume 9, Issue 6, Article R103 Cooper et al. R103.6
distances between markers, but this does not appear to be the
case.
To illustrate the similarities and differences between chromo-
somes, the data for chromosomes 1 and 2 are illustrated (Fig-
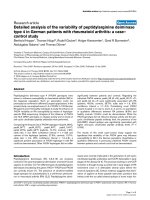
Genotype segregatitions. Genotype segregation proportions for all microsatellite markers present on chromosomesFigure 2
Genotype segregation proportions. Genotype segregation proportions for all microsatellite markers present on chromosomes: (a) 2, (b) 3, (c) 4, (d) 5,
(e) 6, (f) 7, (g) 8, (h) 9, (i) 10, and (j) 11. Dashed horizontal lines indicate the approximate 95% probability range for equal segregation of alleles.
Marker positions on Chromosome (Mb)
0
20
40
60
80
100
0.00 0.40 0.80 1.00 1.20 1.40
0.20 0.60
0
20
40
60
80
100
0.00 0.40 0.80 1.00 1.20 1.40
0.20 0.60
(a)
(j)
0
20
40
60
80
100
0.00 0.50 1.00 1.50 2.00 2.50 3.00 3.50 4.00
(i)
0
20
40
60
80
100
0.00 0.50 1.00 1.50 2.00 2.50 3.00 3.50 4.00
(f)
(c)
(b)
(g)
0
20
40
60
80
100
0.00 0.50 1.00 1.50 2.00 2.50
0
20
40
60
80
100
0.00 0.50 1.00 1.50 2.00 2.50
(h)
0
20
40
60
80
100
0.00 0.50
1.00
1.50 2.00 2.50
0
20
40
60
80
100
0.00 0.50
1.00
1.50 2.00 2.50
0.50 1.00 1.50 2.00 2.50 3.00 3.50 4.00 4.50
0
20
40
60
80
100
0.50 1.00 1.50 2.00 2.50 3.00 3.50 4.00 4.50
0
20
40
60
80
100
(d)
0
20
40
60
80
100
0.00 0.20 0.40 0.60 0.80 1.00 1.20 1.40
0
20
40
60
80
100
0.00 0.20 0.40 0.60 0.80 1.00 1.20 1.40
100
Proportion of markers from one homologue
(e)
0
20
40
60
80
100
0.30 0.50 0.70 0.90 1.10 1.30 1.50
0
20
40
60
80
100
0.30 0.50 0.70 0.90 1.10 1.30 1.50
0.00 0.20 0.40 0.60 0.80 1.00 1.20 1.40 1.60 1.80
0
20
40
60
80
100
0.00 0.20 0.40 0.60 0.80 1.00 1.20 1.40 1.60 1.80
0
20
40
60
80
100
0
20
40
60
80
100
0.30 0.40 0.50 0.60 0.70 0.80 0.90 1.00 1.10
0
20
40
60
80
100
0.30 0.40 0.50 0.60 0.70 0.80 0.90 1.00 1.10
0
20
40
60
80
0.20 0.40 0.60 0.80 1.00 1.20 1.40 1.60
0
20
40
60
80
0.20 0.40 0.60 0.80 1.00 1.20 1.40 1.60
Genome Biology 2008, Volume 9, Issue 6, Article R103 Cooper et al. R103.7
Genome Biology 2008, 9:R103
ure 4). For chromosome 2, the physical size of the
chromosome is similar in both isolates based on PFGE [20],
but the size of the genetic maps differ significantly. Compar-
ing only the region of the chromosome represented by both
genetic maps, from marker TB2/2 to TB2/20, the genetic dis-
tances for T. b. brucei and T. b. gambiense are 81.2 cM and
47.6 cM, respectively (Figure 4b), which is significantly differ-
ent (χ
2
[1 degree of freedom] = 8.765; P < 0.01). The differ-
ence in genetic distance between the chromosome two maps
is largely due to a hotspot of recombination in the interval
between markers TB2/20 and TB2/12 in T. b. brucei (35.6
cM), which in not present in T. b. gambiense (14.4 cM) at the
same marker interval. However, for chromosome 1 (Figure
4a), comparing the distance represented by the two genetic
maps (35.8 cM and 25.1 cM), the difference is not significant
(χ
2
[1 degree of freedom] = 1.88; P = 0.17), despite the physi-
cal size of chromosome 1 in the T. b. gambiense strain STIB
386 being estimated to be almost twice that of TREU 927
[20].
Mutation frequency
A single spontaneous mutation event, generating a novel
sized allele product, distinct from the parental alleles, was
detected when genotyping the progeny clones. This mutation
occurred at marker TB6/15, resulting in a mutation frequency
at this locus of 0.028 mutants/alleles genotyped. Combined
with all other markers this produces an overall mutation fre-
quency of 0.00024 mutants/alleles genotyped, which is con-
sistent with the mutation frequency of 0.0003 mutants/
alleles genotyped reported for the T. b. brucei strain TREU
927 [26]. In contrast to the TREU 927 mutant loci, the allele
in question had lost repeats resulting in an allele smaller than
either of the parental alleles. The origin of the mutation has
not been determined, but as the original parental allele is not
detected in addition to the mutant, the mutation is unlikely to
have arisen during vegetative growth of the progeny clone,
but before the cloning process, probably at meiosis.
Discussion
Genetic linkage maps have been determined for a number of
parasites, including the haploid apicomplexa species Plasmo-
dium falciparum [1], Plasmodium chabaudi chabaudi [2],
Eimeria tenella [4], and Toxoplasma gondii [3], and recently
the first map for the diploid trypanosomatid T. b. brucei was
reported [26]. Here, we advance knowledge of this parasite by
reporting the construction of the first linkage map of a
human-infective strain of the T. b. gambiense subspecies to
provide a basis for expanding studies on important biological
traits in this line such as human infectivity and virulence.
The average recombination rate in this genetic map (24.4 kb/
cM) is close to the values reported for T. b. brucei [26], P. fal-
ciparum [1], and other organisms with a similar size genome
[13]. However, as observed for a variety of other eukaryotes,
there is considerable variation in the physical size of a cM.
Similar hot and cold spots of meiotic recombination have
been reported for a wide variety of eukaryotic species [35] and
were also identified on the T. b. brucei TREU 927 map
[26,36,37]. Although local variation in crossover frequency
appears to be a common feature of both the T. b. brucei and
T. b. gambiense maps, this balances out over the full length of
each chromosome, with the total genetic distance of chromo-
somes correlated with their physical sizes for the T. b. brucei
map [26] and to a lesser degree with the T. b. gambiense map,
with the caveat that the sequence data of T. b. brucei was used
to as a basis for estimating the physical size for T. b.
gambiense.
Size polymorphism in the megabase chromosomes of T. bru-
cei has been documented both between isolates and between
homologs within a single parasite genome [21,38]. PFGE res-
olution of the molecular karyotype for the genetic map isolate
STIB 386 showed that at least seven out of 11 chromosome
pairs were larger in size than those in the T. b. brucei genome
reference strain TREU 927 [20]. On this basis we might there-
fore anticipate the genetic size of these chromosomes to
reflect this physical size difference, with larger genetic dis-
tances in those chromosomes that are larger in the T. b. gam-
biense subspecies. Interestingly, though, we found no
significant difference in recombination, measured in terms of
average map unit size, between the two strains. Indeed, where
distance between markers present on both genetic maps were
examined, STIB 386 was frequently found to have the smaller
genetic map distance, despite the predicted size of homologs
being up to twice that of TREU 927 [20,21].
The genetic size of each linkage group relative to its physical sizeFigure 3
The genetic size of each linkage group relative to its physical size. A
comparison of the total genetic size of each linkage group against the
predicted physical distance, calculated from the T. b. brucei genome
sequence [25]. The line shown was determined by linear least squares
regression analysis.
0
20
40
60
80
100
120
140
0.0 0.5 1.0 1.5 2.0 2.5 3.0 3.5
Physical size (Mb)
Genetic size (cM)
3
1
2
11
10
8
9
5
7
6
4
4.0
Genome Biology 2008, 9:R103
Genome Biology 2008, Volume 9, Issue 6, Article R103 Cooper et al. R103.8
Considerable chromosome size variation between isolates has
been reported in many protozoan parasites with little or no
effect on gene content. Variations in chromosome size
between strains of 10-50% in Plasmodium falciparum [39-
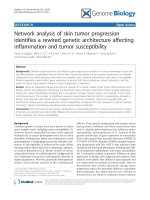
Comparison with the physical and genetic maps of Trypanosoma brucei bruceiFigure 4
Comparison with the physical and genetic maps of Trypanosoma brucei brucei. The genetic maps of T. b. brucei isolate TREU 927 and T. b. gambiense isolate
STIB 386 are shown alongside the TREU 927 physical map of the same chromosome for (a) chromosome 1 and (b) chromosome 2. The average physical
size of a recombination unit between each marker is given in kb/cM and the genetic distance given in cM. Dashed lines link the position of all markers on
the physical map to their relative position on the genetic maps. Hot and cold spots are defined as threefold more or less recombination than average for
each genetic map and indicated against the physical map by red and blue bars, respectively.
Physical map (Kb)
T.b.brucei
Genetic map (cM)
T.b.brucei
Genetic map (cM)
T.b.gambiense
TB1/3 TB1/4
TB1/12 TB1/13
TB1/9 TB1/10
TB1/6
TB1/1
TB1/2
TB1/7 TB1/8
3.2
15.1
3.1
3.3
8.0
3.1
TB1/1 TB1/2
TB1/10
TB1/4 TB1/6
TB1/12
TB1/16
TB1/15
TB1/14
8Kb/cM
4Kb/cM
46Kb/cM
32Kb/cM
11Kb/cM
18Kb/cM
TB1/17
3.1
25.5
2.9
3.2
10.4
6.1
29Kb/cM
31Kb/cM
7Kb/cM
32Kb/cM
13Kb/cM
6Kb/cM
51.2cM35.8cM
TB1/11
TB1/5
100Kb
Gene dense regions
Gene poor regions
Region of high recombination
Region of low recombination
TB2
/
13 TB2/14
TB2/1
TB2/2 TB2/3
TB2/4
TB2/5
TB2/6
TB2/7
TB2/8
TB2/12
TB2/15 TB2/16
TB2/17 TB2/18
TB2/19 TB2/20
TB2/21
TB2/9 TB2/10
TB2/15 TB2/18
TB2/2
TB2/4
TB2/7
TB2/20
TB2/19
12Kb/cM
3Kb/cM
12Kb/cM
25Kb/cM
6Kb/cM
6Kb/cM
1Kb/cM
2Kb/cM
17Kb/cM
4Kb/cM
2Kb/cM
22Kb/cM
11Kb/cM
11Kb/cM
4Kb/cM
5Kb/cM
3.0
6.1
21.0
6.1
8.4
3.0
3.0
5.9
26.5
13.9
6.1
21.8
3.0
9.1
2.9
2.9
95.1cM 47.6cM
(a)
(b)
TB2/9 TB2/10
TB2/12
TB2/11
Genome Biology 2008, Volume 9, Issue 6, Article R103 Cooper et al. R103.9
Genome Biology 2008, 9:R103
41], Leishmania spp. [42-44], and Trypanosoma cruzi [45]
have been attributed primarily to changes in repeat regions in
the subtelomeric sequence. This polymorphism is even more
extreme in T. brucei isolates, in which chromosome plasticity
results in homologs varying up to fourfold between isolates
[46] and even twofold within a single genome [20,21,46],
without an apparent loss of linkage in coding regions.
Comparisons of the Trypanosomatid genome sequence data,
comprising the T. brucei, T. cruzi and Leishmania major spe-
cies, has uncovered a common chromosomal arrangement
with a central core exhibiting extensive synteny [47]. Within
T. brucei isolates, comparative studies of homologous chro-
mosomes have as yet failed to identify any associated loss of
synteny or translocation in coding regions, even between very
size divergence chromosomes. In one such study, DNA micro-
array analysis of the genome content variation of chromo-
some 1, one of the most size variable chromosomes, was used
to identify regions of copy number polymorphism between
strains [48]. As observed with related protozoan pathogens,
the majority of the extensive size variation between isolates
appeared to be concentrated in the subtelomerically located
genes, including the VSGs, VSG expression site associated
genes, and highly polymorphic gene families such as the ret-
rotransposon hot spot and leucine-rich repeat protein genes.
Variation in copy number of these repeat elements was found
to compose as much as 75% of the length of a homolog. In
contrast, 90% of the diploid core showed little evidence of sig-
nificant copy number variation, with polymorphisms mainly
limited to tandemly repeated gene arrays such as tubulin, his-
tone H3, and the pteridine transporters.
Our comparison of the T. b. brucei strain TREU 927 and T. b.
gambiense strain STIB 386 genetic maps is in agreement with
these findings. We report no inconsistency in the marker
order or average map unit size between the STIB 386 genetic
map and that of T. b. brucei. Some strain-specific local varia-
tion in the recombination rate between shared markers pairs
were identified, which may be attributed to local physical size
differences or variation in tandemly repeated gene arrays
within the coding regions. Overall, though, our data appear to
be in agreement with a conservation of synteny between the
two subspecies, with the majority of the variation accounting
for chromosome size difference between the two strains
focused outside the gene-rich coding region (in the sub-tel-
omeres) and therefore not covered by the genetic map.
The genetic distances in the map reflect the number of recom-
bination events that have occurred in the population during
meiosis. At least one reciprocal crossover per chromosome is
considered essential for the successful disjunction of homol-
ogous chromosomes during meiosis [49]. It is therefore sur-
prising that 48% of all STIB 386 chromosomes analyzed in
this cross failed to exhibit evidence of any recombination
events (a full analysis of crossovers in the progeny is available
in Additional data file 3). Progeny averaged only 0.6 crosso-
vers/chromosome compared with the 1.02 calculated for the
TREU 927 map, despite comparable coverage of the genome.
Indeed, in several progeny clones, evidence of recombination
was extremely rare or, in the case of hybrid F492/50 bscl 23,
entirely absent on all 11 chromosomes. The reasons for this
low crossover frequency are unknown but may also be a con-
sequence of the larger predicted genome size of the STIB 386
strain. Physical estimates of marker locations were estab-
lished from the available TREU 927 sequence to produce a
total predicted coverage of the genome of 70%. However, if
the larger physical size of STIB 386 was due to extended sub-
telomeric regions, then this would leave an increased percent-
age of the genome outside of the gene-dense center,
uncovered by the map. If the obligate crossover necessary to
ensure faithful meiotic segregation of chromosomes is occur-
ring outside the central core on some STIB 386 chromosomes
and toward the subtelomeric regions at the ends of chromo-
somes, then it would not be detected by our analysis.
Estimations of the frequency at which spontaneous microsat-
ellite mutations occur may enhance our understanding of the
evolution and stability of such markers and their usefulness
in genetic analysis of T. brucei populations. Few such esti-
mates exist for T. brucei, but an approximate mutation rate of
0.0003 mutants/allele genotyped was reported in the T. b.
brucei genetic map from the identification of two spontane-
ous mutation events in a dataset of 6,797 microsatellite alle-
les. In this T. b. gambiense genetic map the identification of a
single spontaneous mutation event in a microsatellite marker
appears to substantiate this (0.00024 mutants/allele geno-
typed). These estimates are based on only a small number of
mutation events and thus can only be considered an approxi-
mation, but they are comparable to a similar mutation rate
reported in the malaria parasite Plasmodium falciparum of
0.00016 mutants/allele genotyped [50]. Given that we have
screened an additional 118 markers and found no mutations
(about 4,500 events), we can be confident that the value we
have obtained is a maximum. Although the screening of a sig-
nificantly larger dataset of marker alleles would allow a more
accurate mutation rate to be obtained, we consider that our
high coverage of the genome sequence in the screen for
informative microsatellite markers - coupled with the rela-
tively low level of heterozygosity - make it unlikely we would
find enough additional microsatellite markers from further
screening to detect more mutations.
T. b. gambiense is related to T. b. brucei, but differs signifi-
cantly in many phenotypic characteristics, most notably in
their ability to infect humans. Indeed, the T. b. gambiense
and T. b. brucei strains examined here not only differ in terms
of human infectivity and pathogenesis, but also in their ability
to establish midgut infections in the tsetse vector, to progress
from the midgut to the salivary glands (transmission index),
and in their ability to resist killing by a number of trypano-
cidal drugs used in the treatment of human African trypano-
somiasis [18]. The availability of a genetic linkage map for T.
Genome Biology 2008, 9:R103
Genome Biology 2008, Volume 9, Issue 6, Article R103 Cooper et al. R103.10
b. gambiense opens up the possibility of identifying genes
that determine these traits. The value of a genetic map for
identifying loci that effectuate particular phenotypes is pri-
marily determined by the recombination frequency of the
organism, providing there is sufficient marker coverage of the
genome. T. brucei has a relatively high crossover frequency
compared with higher eukaryotes, which is comparable to
that seen in P. falciparum [1] and 40 times higher than in
humans [51]. With this recombination frequency the 9 cM
resolution of this map will allow linkage of a phenotype to
within 270 kb of a genomic locus with 90% probability. Once
such linkage is identified, finer scale mapping would be war-
ranted and, consequently, it may then be beneficial to isolate
further progeny and increase the marker density to improve
the resolution of the map in the specific area of the genome.
Under these circumstances other genetic markers such as sin-
gle nucleotide polymorphisms could be used to increase the
density of markers within chromosomal regions of interest.
Conclusion
The genome sequence of T. b. brucei was recently completed,
and that for T. b. gambiense is underway. Although this has
provided useful insights into gene function, there is still a
large percentage of genes that have no known function or
ortholog. Genetic mapping is a powerful tool, which can
attribute functions to some of these genes. The power of this
approach lies in the fact that it identifies genes involved in
naturally occurring variation, requires no prior knowledge as
to the nature of the genes involved in particular phenotypes,
and it can identify genes involved in complex traits, which
may be difficult to detect by other means. Such an approach
has been validated in other parasites to identify genes
involved in drug resistance in Plasmodium falciparum [52]
and Eimeria tenella [4], and virulence in Toxoplasma gondii
[3,7-9]. The genetic linkage map presented here is the first
available for the human-infective trypanosome T. b. gambi-
ense. In combination with the genome sequence, this opens
up the possibility of using genetic analysis to identify the loci
responsible for T. b. gambiense specific traits such as human
infectivity.
Materials and methods
Origin of F
1
progeny clones
The progeny clones from the cross between STIB 386 and
STIB 247 used in the analysis and their derivation were
described previously [16-18]. Briefly, tsetse flies were co-
infected with a mixture of the two bloodstream stage parental
trypanosomes and, after maturation within the flies to the
metacyclic stage, the populations of trypanosomes from each
fly were monitored for the presence of the products of mating.
Once these were detected, cloned lines were established
either by directly cloning metacyclic stage trypanosomes in
individual immuno-suppressed mice or by cloning from
bloodstream stage infections derived directly from feeding
infected tsetse on a mouse. The resulting metacyclic and/or
bloodstream, cloned populations from six mixed infected flies
(F 8,19, 28, 29, 80 and 492) were then genotyped with two
microsatellite markers JS2 [53] and PLC [26] and three min-
isatellites markers, MS42, CRAM, and 292 [54] that were het-
erozygous in one or both of the two parental stocks. This
resulted in the identification of 38 independent F
1
progeny
clones from the cross, each of a different and unique geno-
type. A list of all hybrids and their genotypes is provided in
the supplementary material (Additional data file 4).
Preparation of DNA from trypanosomes
The parental stocks and the progeny clones derived from the
cross were amplified in mice or by procyclic culture, and
lysates of partially purified trypanosomes prepared as
described previously [54].
PCR amplification of mini and microsatellite markers
Primers were designed to the unique flanking sequences of
tandemly repeated loci and used in PCR reactions, prepared
in 10 μl reaction volumes containing the following: 45 mmol/
l Tris-HCl (pH 8.8), 11 mmol/l (NH
4
)
2
SO
4
, 4.5 mmol/l MgCl
2
,
6.7 mmol/l 2-mercaptoethanol, 4.4 μmol/l EDTA, 113 μg/ml
bovine serum albumin, 1 mmol/l each of the four deoxyribo-
nucleotide triphosphates, 10 μmol/l each oligonucleotide
primer, 0.5 units Taq DNA polymerase (Abgene, Epsom,
UK), and 1 μl DNA template. Reactions were overlaid with
mineral oil to prevent evaporation and amplification carried
out in a Robocycler gradient 96 (Stratagene, La Jolla, CA,
UK). All PCR reactions except the three minisatellites used for
genotyping DNA stocks (CRAM, MS42 and 292) were ampli-
fied under the following conditions: 95°C for 50 seconds,
50°C for 50 seconds and 65°C for 50 seconds × 30 cycles. In
the three minisatellites the following conditions were used:
95°C for 50 seconds, 60°C for 50 seconds and 65°C for 3 min-
utes × 30 cycles. PCR products were separated by gel electro-
phoresis on a 1% Seakem LE agarose gel for the 3
minisatellites and a 3% Nusieve GTG agarose gel for the mic-
rosatellites in 0.5 × TBE buffer containing 50 ng/ml ethidium
bromide, visualized by UV illumination, and photographed
for analysis.
Identification of microsatellite markers and PCR
screening
Primers for 810 markers, evenly distributed throughout the 11
chromosomes of the T. brucei genome, which had been
designed for screening the TREU 927 × STIB 247 cross during
construction of the TREU 927 T. b. brucei map, were available
[26]. Primers for an additional 215 new markers were
designed specifically for the construction of the STIB 386
map. Microsatellite markers were identified from the T. bru-
cei genome sequence [25], accessed though the Trypano-
soma brucei GeneDB resource [55] with the Tandem Repeat
Finder program [56]. Candidate markers were identified as
sequences containing more than ten copies of a repeat motif
of two to six nucleotides with more than 70% sequence iden-
Genome Biology 2008, Volume 9, Issue 6, Article R103 Cooper et al. R103.11
Genome Biology 2008, 9:R103
tity. Primer pairs were then designed for each microsatellite
marker in the unique sequence flanking each repeat region
using the PRIDE primer design program [57].
The primers were used to screen the parental STIB 386 and
STIB 247 genomic DNA by PCR to identify loci that were het-
erozygous for allele size in STIB 386 and so would segregate
in the progeny. These selected markers were PCR amplified
from all 38 F
1
progeny from the STIB 386 × STIB 247 cross
and, following agarose gel electrophoresis, the inheritance of
each STIB 386 parental allele in each progeny clone was
determined for each microsatellite locus. All gels were inde-
pendently scored by a second individual to ensure progeny
genotypes were correctly assigned. The physical location of
the markers on the T. brucei genome was determined by
GeneDB BLASTN search of the primers against the T. brucei
contigs database [55]. The details of the primers used and the
markers scored are provided as supplementary material
(Additional data file 1).
Generation of a linkage map
A genetic map of STIB 386 was generated, based on the seg-
regation of marker alleles in the F
1
progeny, for loci hetero-
zygous in the STIB 386 parent. The allele segregation data
were analysed using the Map Manager QTX software [34],
with a Haldane map function and the highest level of signifi-
cance for linkage criteria, giving a probability of type 1 error P
= 1 × e
-6
. Linkage between the adjacent physical markers was
determined by a LOD (log of the odds) score of 5.5 or greater.
Online resources
The genetic map, supplementary material, and additional
information regarding how the genetic cross was performed is
available on the Trypanosome Genetic Mapping Database
website [58].
Abbreviations
kb, kilobases; Mb, megabases; PCR, polymerase chain reac-
tion; PFGE, pulsed field gel electrophoresis; VSG, variant sur-
face glycoprotein.
Authors' contributions
AC, ATa, MT and AML designed the experiments, analyzed
the data, and wrote the manuscript. AC, LS, ATw, and LM car-
ried out the experimental work. All authors read and
approved the final manuscript.
Additional data files
The following additional data are available with this paper.
Additional data file 1 provides segregation data. Additional
data file 2 provides a comparison with the physical and
genetic maps of T. b. brucei for every chromosome. Addi-
tional data file 3 provides recombination data for every link-
age group of every individual. Additional data file 4 provides
the unique genotype pattern of each progeny clone.
Additional data file 1Segregation dataThe segregation data for all the markers on each of the 11 Mb chro-mosomes is given. For each linkage group, markers are shown in map order, alongside: primer pair sequences, chromosomal loca-tion of the primers based on the available 927 sequence, estimated size of the PCR product, genotype of the STIB 386 parental line (AB), and inheritance pattern (either A or B) in the progeny clones for each marker. Novel sized alleles are marked as mutants.Click here for fileAdditional data file 2Comparison with the physical and genetic maps of T. b. brucei for every chromosomeThe genetic maps of T. b. brucei isolate TREU 927 and T. b. gambi-ense isolate STIB 386 are shown alongside the TREU 927 physical map of every chromosome. The average physical size of a recombi-nation unit between each marker is shown on the outside of each map in kb/cM and the genetic distance, given in cM, shown on the inside. Dashed lines link the position of all markers on the physical map to their relative position on the genetic maps, based on the TREU 927 sequence. Hot and cold spots are defined here as three-fold more or less recombination than average for each genetic map and indicated against the physical map by red and blue bars, respectively.Click here for fileAdditional data file 3Recombination data for every linkage group of every individualA breakdown of the number of recombination events for every chromosome linkage group of every individual is given and the total and average for each individual and linkage group calculated.Click here for fileAdditional data file 4Unique progeny genotype dataThe name and relevant genotypes of the parental strains and 38 unique F1 progeny derived from the STIB 386 × STIB 247 crosses that were analysed for the construction of the T. b. gambiense link-age map. Inheritance of marker alleles from both parents for 2 mic-rosatellites (JS2 and PLC) and 3 minisatellites (CRAM, 292 and MS42) were used as genotyping markers.Click here for file
Acknowledgements
This work was supported by a Wellcome Trust grant to AT, CMRT and
AML, and a grant from Tenovus Scotland to AML; also, AML is supported
by a Fellowship from the Wellcome Trust.
References
1. Su X, Ferdig MT, Huang Y, Huynh CQ, Liu A, You J, Wootton JC,
Wellems TE: A genetic map and recombination parameters of
the human malaria parasite Plasmodium falciparum. Science
1999, 286:1351-1353.
2. Martinelli A, Hunt P, Fawcett R, Cravo PV, Walliker D, Carter R: An
AFLP-based genetic linkage map of Plasmodium chabaudi
chabaudi. Malar J 2005, 4:11.
3. Khan A, Taylor S, Su C, Mackey AJ, Boyle J, Cole R, Glover D, Tang
K, Paulsen IT, Berriman M, Boothroyd JC, Pfefferkorn ER, Dubey JP,
Ajioka JW, Roos DS, Wootton JC, Sibley LD: Composite genome
map and recombination parameters derived from three
archetypal lineages of Toxoplasma gondii. Nucleic Acids Res
2005, 33:2980-2992.
4. Shirley MW, Harvey DA: A genetic linkage map of the apicom-
plexan protozoan parasite Eimeria tenella. Genome Res 2000,
10:1587-1593.
5. Su X, Kirkman LA, Fujioka H, Wellems TE: Complex polymor-
phisms in an approximately 330 kDa protein are linked to
chloroquine-resistant P. falciparum in Southeast Asia and
Africa. Cell 1997, 91:593-603.
6. Ferdig MT, Cooper RA, Mu J, Deng B, Joy DA, Su XZ, Wellems TE:
Dissecting the loci of low-level quinine resistance in malaria
parasites. Mol Microbiol 2004, 52:985-997.
7. Su C, Howe DK, Dubey JP, Ajioka JW, Sibley LD: Identification of
quantitative trait loci controlling acute virulence in Toxo-
plasma gondii. Proc Natl Acad Sci USA 2002, 99:10753-10758.
8. Taylor S, Barragan A, Su C, Fux B, Fentress SJ, Tang K, Beatty WL,
Hajj HE, Jerome M, Behnke MS, White M, Wootton JC, Sibley LD: A
secreted serine-threonine kinase determines virulence in
the eukaryotic pathogen Toxoplasma gondii. Science 2006,
314:1776-1780.
9. Saeij JP, Boyle JP, Coller S, Taylor S, Sibley LD, Brooke-Powell ET,
Ajioka JW, Boothroyd JC: Polymorphic secreted kinases are key
virulence factors in toxoplasmosis. Science 2006,
314:1780-1783.
10. Saeij JP, Coller S, Boyle JP, Jerome ME, White MW, Boothroyd JC:
Toxoplasma co-opts host gene expression by injection of a
polymorphic kinase homologue. Nature 2007, 445:324-327.
11. Martinelli A, Cheesman S, Hunt P, Culleton R, Raza A, Mackinnon M,
Carter R: A genetic approach to the de novo identification of
targets of strain-specific immunity in malaria parasites. Proc
Natl Acad Sci USA 2005, 102:814-819.
12. Sibley LD, LeBlanc AJ, Pfefferkorn ER, Boothroyd JC: Generation of
a restriction fragment length polymorphism linkage map for
Toxoplasma gondii. Genetics 1992, 132:1003-1015.
13. National Centre for Biotechnology Information
[http:www.ncbi.nlm.nih.gov/projects/Malaria/Mapsmarkertabphysdis-
tvsgmu.html]
14. Jenni L, Marti S, Schweizer J, Betschart B, Le Page RW, Wells JM, Tait
A, Paindavoine P, Pays E, Steinert M: Hybrid formation between
African trypanosomes during cyclical transmission. Nature
1986, 322:173-175.
15. Gibson W, Stevens J: Genetic exchange in the trypanosomati-
dae. Adv Parasitol 1999, 43:1-46.
16. Turner CM, Sternberg J, Buchanan N, Smith E, Hide G, Tait A: Evi-
dence that the mechanism of gene exchange in Trypanosoma
brucei involves meiosis and syngamy. Parasitology 1990, 101(Pt
3):377-386.
17. MacLeod A, Tweedie A, McLellan S, Hope M, Taylor S, Cooper A,
Sweeney L, Turner CM, Tait A: Allelic segregation and independ-
ent assortment in T. brucei crosses: proof that the genetic
system is Mendelian and involves meiosis. Mol Biochem Parasitol
2005, 143:12-19.
18. Tait A, Masiga D, Ouma J, MacLeod A, Sasse J, Melville S, Lindegard
Genome Biology 2008, 9:R103
Genome Biology 2008, Volume 9, Issue 6, Article R103 Cooper et al. R103.12
G, McIntosh A, Turner M: Genetic analysis of phenotype in
Trypanosoma brucei: a classical approach to potentially com-
plex traits. Philos Trans R Soc Lond B Biol Sci 2002, 357:89-99.
19. Ploeg LH Van der, Cornelissen AW, Barry JD, Borst P: Chromo-
somes of kinetoplastida. Embo J 1984, 3:3109-3115.
20. Melville SE, Leech V, Gerrard CS, Tait A, Blackwell JM: The molec-
ular karyotype of the megabase chromosomes of Trypano-
soma brucei and the assignment of chromosome markers.
Mol Biochem Parasitol 1998, 94:155-173.
21. Gottesdiener K, Garcia-Anoveros J, Lee MG, Ploeg LH Van der:
Chromosome organization of the protozoan Trypanosoma
brucei. Mol Cell Biol 1990, 10:6079-6083.
22. Ploeg LH Van der, Cornelissen AW, Michels PA, Borst P: Chromo-
some rearrangements in Trypanosoma brucei. Cell 1984,
39:213-221.
23. Weiden M, Osheim YN, Beyer AL, Ploeg LH Van der: Chromosome
structure: DNA nucleotide sequence elements of a subset of
the minichromosomes of the protozoan Trypanosoma brucei.
Mol Cell Biol 1991, 11:3823-3834.
24. Williams RO, Young JR, Majiwa PA: Genomic environment of T.
brucei VSG genes: presence of a minichromosome. Nature
1982, 299:417-421.
25. Berriman M, Ghedin E, Hertz-Fowler C, Blandin G, Renauld H, Bar-
tholomeu DC, Lennard NJ, Caler E, Hamlin NE, Haas B, Bohme U,
Hannick L, Aslett MA, Shallom J, Marcello L, Hou L, Wickstead B, Als-
mark UC, Arrowsmith C, Atkin RJ, Barron AJ, Bringaud F, Brooks K,
Carrington M, Cherevach I, Chillingworth TJ, Churcher C, Clark LN,
Corton CH, Cronin A, et al.: The genome of the African
trypanosome Trypanosoma brucei. Science 2005, 309:416-422.
26. MacLeod A, Tweedie A, McLellan S, Taylor S, Hall N, Berriman M, El-
Sayed NM, Hope M, Turner CM, Tait A: The genetic map and
comparative analysis with the physical map of Trypanosoma
brucei. Nucleic Acids Res 2005, 33:6688-6693.
27. WHO: Human African trypanosomiasis (sleeping sickness):
epidemiological update. Wkly Epidemiol Rec 2006, 81:71-80.
28. Simarro PP, Jannin J, Cattand P: Eliminating human African
trypanosomiasis: where do we stand and what comes next?
PLoS Med 2008, 5:e55.
29. Gibson WC: Will the real Trypanosoma b. gambiense please
stand up. Parasitol Today 1986, 2:255-257.
30. Hide G, Cattand P, LeRay D, Barry JD, Tait A: The identification of
Trypanosoma brucei subspecies using repetitive DNA
sequences. Mol Biochem Parasitol 1990, 39:213-225.
31. Paindavoine P, Zampetti-Bosseler F, Coquelet H, Pays E, Steinert M:
Different allele frequencies in Trypanosoma brucei brucei and
Trypanosoma brucei gambiense populations. Mol Biochem
Parasitol 1989, 32:61-71.
32. Turner CM, McLellan S, Lindergard LA, Bisoni L, Tait A, MacLeod A:
Human infectivity trait in Trypanosoma brucei: stability, her-
itability and relationship to sra expression. Parasitology 2004,
129:445-454.
33. Benson G: Tandem repeats finder: a program to analyze DNA
sequences. Nucleic Acids Res 1999, 27:573-580.
34. Manly KF, Cudmore RH Jr, Meer JM: Map Manager QTX, cross-
platform software for genetic mapping. Mamm Genome 2001,
12:930-932.
35. Petes TD: Meiotic recombination hot spots and cold spots.
Nat Rev Genet 2001, 2:360-369.
36. El-Sayed NM, Ghedin E, Song J, MacLeod A, Bringaud F, Larkin C,
Wanless D, Peterson J, Hou L, Taylor S, Tweedie A, Biteau N, Khalak
HG, Lin X, Mason T, Hannick L, Caler E, Blandin G, Bartholomeu D,
Simpson AJ, Kaul S, Zhao H, Pai G, Van Aken S, Utterback T, Haas B,
Koo HL, Umayam L, Suh B, Gerrard C, et al.: The sequence and
analysis of Trypanosoma brucei chromosome II. Nucleic Acids
Res 2003, 31:4856-4863.
37. Hall N, Berriman M, Lennard NJ, Harris BR, Hertz-Fowler C, Bart-
Delabesse EN, Gerrard CS, Atkin RJ, Barron AJ, Bowman S, Bray-
Allen SP, Bringaud F, Clark LN, Corton CH, Cronin A, Davies R, Dog-
gett J, Fraser A, Gruter E, Hall S, Harper AD, Kay MP, Leech V, Mayes
R, Price C, Quail MA, Rabbinowitsch E, Reitter C, Rutherford K, Sasse
J, et al.: The DNA sequence of chromosome I of an African
trypanosome: gene content, chromosome organisation,
recombination and polymorphism. Nucleic Acids Res 2003,
31:4864-4873.
38. Tait A, Buchanan N, Hide G, Turner CM: Self-fertilisation in
Trypanosoma brucei. Mol Biochem Parasitol 1996, 76:31-42.
39. Janse CJ: Chromosome size polymorphism and DNA rear-
rangements in plasmodium. Parasitol Today 1993, 9:19-22.
40. Lanzer M, de Bruin D, Wertheimer SP, Ravetch JV: Organization of
chromosomes in Plasmodium falciparum: a model for gener-
ating karyotypic diversity. Parasitol Today 1994, 10:114-117.
41. Lanzer M, de Bruin D, Ravetch JV: Transcriptional differences in
polymorphic and conserved domains of a complete cloned P.
falciparum chromosome. Nature 1993, 361:654-657.
42. Ravel C, Wincker P, Blaineau C, Britto C, Bastien P, Pages M:
Medium-range restriction maps of five chromosomes of
Leishmania infantum and localization of size-variable regions.
Genomics 1996, 35:509-516.
43. Wincker P, Ravel C, Blaineau C, Pages M, Jauffret Y, Dedet JP, Bastien
P: The Leishmania genome comprises 36 chromosomes con-
served across widely divergent human pathogenic species.
Nucleic Acids Res 1996, 24:1688-1694.
44. Blaineau C, Bastien P, Rioux JA, Roizes G, Pages M: Long-range
restriction maps of size-variable homologous chromosomes
in Leishmania infantum
. Mol Biochem Parasitol 1991, 46:292-302.
45. Henriksson J, Porcel B, Rydaker M, Ruiz A, Sabaj V, Galanti N, Caz-
zulo JJ, Frasch AC, Pettersson U: Chromosome specific markers
reveal conserved linkage groups in spite of extensive chro-
mosomal size variation in Trypanosoma cruzi. Mol Biochem
Parasitol 1995, 73:63-74.
46. Melville SE, Leech V, Navarro M, Cross GA: The molecular kary-
otype of the megabase chromosomes of Trypanosoma brucei
stock 427. Mol Biochem Parasitol 2000, 111:261-273.
47. El-Sayed NM, Myler PJ, Blandin G, Berriman M, Crabtree J, Aggarwal
G, Caler E, Renauld H, Worthey EA, Hertz-Fowler C, Ghedin E, Pea-
cock C, Bartholomeu DC, Haas BJ, Tran AN, Wortman JR, Alsmark
UC, Angiuoli S, Anupama A, Badger J, Bringaud F, Cadag E, Carlton
JM, Cerqueira GC, Creasy T, Delcher AL, Djikeng A, Embley TM,
Hauser C, Ivens AC, et al.: Comparative genomics of trypano-
somatid parasitic protozoa. Science 2005, 309:404-409.
48. Callejas S, Leech V, Reitter C, Melville S: Hemizygous subtelom-
eres of an African trypanosome chromosome may account
for over 75% of chromosome length. Genome Res 2006,
16:1109-1118.
49. Baker BS, Carpenter AT, Esposito MS, Esposito RE, Sandler L: The
genetic control of meiosis. Annu Rev Genet 1976, 10:53-134.
50. Anderson TJ, Haubold B, Williams JT, Estrada-Franco JG, Richardson
L, Mollinedo R, Bockarie M, Mokili J, Mharakurwa S, French N, Whit-
worth J, Velez ID, Brockman AH, Nosten F, Ferreira MU, Day KP:
Microsatellite markers reveal a spectrum of population
structures in the malaria parasite Plasmodium falciparum.
Mol Biol Evol 2000, 17:1467-1482.
51. Venter JC, Adams MD, Myers EW, Li PW, Mural RJ, Sutton GG, Smith
HO, Yandell M, Evans CA, Holt RA, Gocayne JD, Amanatides P,
Ballew RM, Huson DH, Wortman JR, Zhang Q, Kodira CD, Zheng
XH, Chen L, Skupski M, Subramanian G, Thomas PD, Zhang J, Gabor
Miklos GL, Nelson C, Broder S, Clark AG, Nadeau J, McKusick VA,
Zinder N, et al.: The sequence of the human genome. Science
2001, 291:1304-1351.
52. Wellems TE, Walker-Jonah A, Panton LJ: Genetic mapping of the
chloroquine-resistance locus on Plasmodium falciparum
chro-
mosome 7. Proc Natl Acad Sci USA 1991, 88:3382-3386.
53. Sasse J: The development of genetic markers for the T. brucei
genome. University of Cambridge; 1998.
54. MacLeod A, Turner CM, Tait A: A high level of mixed Trypano-
soma brucei infections in tsetse flies detected by three hyper-
variable minisatellites. Mol Biochem Parasitol 1999, 102:237-248.
55. Trypanosoma brucei GeneDB [ />tryp/index.jsp]
56. Tandem Repeats Finder [ />mit.options.html]
57. PRIDE [ />search_primer]
58. Trypanosome Genetic Mapping Database
[http:www.gla.ac.uk/centres/wcmp/researcmacleotrypanosomege
neticmappingdatabase]