Báo cáo y học: "At-TAX: a whole genome tiling array resource for developmental expression analysis and transcript identification in Arabidopsis thaliana" pps
Bạn đang xem bản rút gọn của tài liệu. Xem và tải ngay bản đầy đủ của tài liệu tại đây (2.56 MB, 16 trang )
Genome Biology 2008, 9:R112
Open Access
2008Laubingeret al.Volume 9, Issue 7, Article R112
Method
At-TAX: a whole genome tiling array resource for developmental
expression analysis and transcript identification in Arabidopsis
thaliana
Sascha Laubinger
*
, Georg Zeller
*†
, Stefan R Henz
*
, Timo Sachsenberg
*
,
Christian K Widmer
†
, Naïra Naouar
‡§
, Marnik Vuylsteke
‡§
,
Bernhard Schölkopf
¶
, Gunnar Rätsch
†
and Detlef Weigel
*
Addresses:
*
Department of Molecular Biology, Max Planck Institute for Developmental Biology, Spemannstr. 37-39, 72076 Tübingen,
Germany.
†
Friedrich Miescher Laboratory of the Max Planck Society, Spemannstr. 39, 72076 Tübingen, Germany.
‡
Department of Plant
Systems Biology, VIB, Technologiepark 927, 9052 Ghent, Belgium.
§
Department of Molecular Genetics, Ghent University, Technologiepark
927, 9052 Ghent, Belgium.
¶
Department of Empirical Inference, Max Planck Institute for Biological Cybernetics, Spemannstr. 38, 72076
Tübingen, Germany.
Correspondence: Detlef Weigel. Email:
© 2008 Laubinger et al.; licensee BioMed Central Ltd.
This is an open access article distributed under the terms of the Creative Commons Attribution License ( which
permits unrestricted use, distribution, and reproduction in any medium, provided the original work is properly cited.
Arabidopsis expression atlas<p>A developmental expression atlas, At-TAX, based on whole-genome tiling arrays, is presented along with associated analysis meth-ods.</p>
Abstract
Gene expression maps for model organisms, including Arabidopsis thaliana, have typically been
created using gene-centric expression arrays. Here, we describe a comprehensive expression atlas,
Arabidopsis thaliana Tiling Array Express (At-TAX), which is based on whole-genome tiling arrays.
We demonstrate that tiling arrays are accurate tools for gene expression analysis and identified
more than 1,000 unannotated transcribed regions. Visualizations of gene expression estimates,
transcribed regions, and tiling probe measurements are accessible online at the At-TAX homepage.
Background
The generation of genome-wide gene expression data for the
reference plant Arabidopsis thaliana yielded important
insights into transcriptional control of development, with
genome-wide expression maps having become an indispensa-
ble tool for the research community. Specific gene expression
profiles for various plant organs, developmental stages,
growth conditions, treatments, mutants, or even single cell
types are available (for example [1-7]). These data have
helped to elucidate transcriptional networks and attending
promoter motifs, to uncover gene functions, and to reveal
molecular explanations for mutant phenotypes (for review
[8]).
The most widely used platform for Arabidopsis is the Affyme-
trix ATH1 array [9,10]. Its design used prior information in
the form of experimentally confirmed transcripts and gene
predictions, and was intended to provide information on
most known transcripts. Although the ATH1 array includes
more than 22,500 probe sets, it lacks almost one-third of the
32,041 genes found in the most recent TAIR7 annotation [11].
All users of ATH1 arrays are confronted with a problem; as
the number of newly discovered genes is rising, expression
analysis becomes more and more restricted.
More unbiased detection of transcriptional activity can be
achieved by sequencing techniques such as massively parallel
signature sequencing and serial analysis of gene expression
Published: 9 July 2008
Genome Biology 2008, 9:R112 (doi:10.1186/gb-2008-9-7-r112)
Received: 15 May 2008
Revised: 12 June 2008
Accepted: 9 July 2008
The electronic version of this article is the complete one and can be
found online at />Genome Biology 2008, 9:R112
Genome Biology 2008, Volume 9, Issue 7, Article R112 Laubinger et al. R112.2
or, alternatively, by microarrays that interrogate the entire
genomic sequence, so called 'whole genome tiling arrays' [12-
14]. In contrast to arrays that are focused on gene expression,
which contain only probes complementary to annotated
genes, whole-genome tiling arrays are designed irrespectively
of gene annotations and contain probes that are regularly
spaced throughout the nonrepetitive portion of the genome
[15]. This includes intergenic and intronic regions, and
whole-genome tiling arrays can therefore measure transcrip-
tion from annotated genes, identify new splice and transcript
variants of known genes, and even lead to the discovery of
entirely new transcripts.
Outside the context of plants, tiling arrays have been used to
detect transcriptional activity in the genome of several organ-
isms, including baker's yeast, Caenorhabtidis elegans, Dro-
sophila melanogaster, and humans [16-22]. Apart from the
discovery of new transcripts, tiling arrays are useful for map-
ping the 5' and 3' ends of transcripts, and for the identifica-
tion of introns (for example [23]). Perhaps most importantly,
these studies have expanded our understanding of genome
organization. Apparently, genomes give rise to many more
transcripts than was previously assumed. Most of these are
noncoding RNAs emerging from intergenic regions, a large
portion of which had previously been underrated as 'junk'
DNA [24]. Although the functional relevance of the majority
of these transcripts remains unclear, their abundance and the
fact that they have escaped ab initio gene predictions high-
light the advantages of whole-genome tiling arrays. Another
group of transcripts that has frequently been ignored in the
past are nonpolyadenylated transcripts. Up to 50% of distinct
transcripts in human and C. elegans lack polyA tails; this phe-
nomenon is neglected by most gene expression studies, which
typically use polyA(+) RNA as starting material or oligo-dT-
primers for reverse transcription [19,20].
The first tiling array analyses of Arabidopsis and rice com-
bined with sequencing of full-length cDNAs delivered impor-
tant information about gene content, gene structure, and
genome organization [14,25-30]. Furthermore, gene expres-
sion profiling with tiling arrays of Arabidopsis mutants led to
the identification of hundreds of noncoding transcripts that
are normally silenced or removed by the exosome [31,32].
In line with findings in yeast and animals, Yamada and col-
leagues [14] reported that many Arabidopsis genes are also
transcribed in anti-sense orientation, implicating anti-sense
transcription in gene regulation. More recent studies in yeast
and mammals suggested that at least some of the signals may
be due to artifacts of reverse transcription methods used to
generate the probes for array hybridization [33,34].
Here, we use the Affymetrix GeneChip
®
Tiling 1.0R Array
(Affymetrix Inc., Santa Clara, CA, USA) to provide an initial
whole-genome expression atlas for A. thaliana, dubbed 'Ara-
bidopsis thaliana Tiling Array Express' (At-TAX), using RNA
samples from 11 different tissues collected at various stages of
plant development. We directly compare the performance of
the tiling array, which contains one 25-base probe in each
nonrepetitive 35 base pair (bp) window of the reference
genome, with that of the 'gold standard' ATH1 array. We also
report on the expression profile of over 9,000 annotated
genes that are not represented on the ATH1 array. Applying a
recently developed computational method for transcript
identification to the tiling array data allowed us to identify
regions not previously annotated as transcribed [35]. Our
data also suggest that most Arabidopsis transcripts expressed
at detectable levels are polyadenylated. To benefit the Arabi-
dopsis research community, we provide an online tool for vis-
ualization of gene expression estimates, along with a
customized genome browser [36].
Results
A tiling array based expression atlas of polyadenylated
transcripts
We isolated RNA from ten tissues and different developmen-
tal stages, ranging from young seedlings to senescing leaves,
and roots to fruits of the A. thaliana Col-0 referenced strain.
In addition, we made use of inflorescence apices from the
clavata3 (clv3) mutant [37] to enrich for shoot and floral
meristems (Additional data file 1). We used both GeneChip
®
Tiling 1.0R and ATH1 gene expression arrays to obtain tripli-
cate expression estimates from all samples. Because our pri-
ority was to detect transcribed regions, we decided to use
double-stranded DNA (dsDNA) as hybridization targets for
the tiling arrays. Consequently, we did not obtain information
about the strand from which a signal originates. However,
several recent reports have raised the question of how reliable
the detection of antisense transcripts on tiling arrays is
[33,34]. Another advantage is that DNA targets exhibit higher
specificity than RNA targets [38].
To profile the expression of annotated genes on tiling arrays,
we extracted probe information for all genes that can be ana-
lyzed in a robust manner (see Materials and methods [below]
for details). Consequently, we ignored small transcription
units such as tRNA genes, which are represented by an insuf-
ficient number of probes. Having each gene represented by a
set of probes allowed us to apply a standard algorithm, robust
multichip analysis (RMA), to both microarray platforms,
thereby minimizing differences resulting from different ana-
lytical procedures [39]. A total of 20,583 genes were repre-
sented on both platforms; an additional 136 and 9,645 genes
were exclusively represented on ATH1 and the tiling array,
respectively. Resulting RMA log2 expression values for tiling
and ATH1 arrays spanned 11 to 12 log2 units in both cases.
To compare the expression values derived from ATH1 array
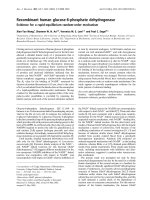
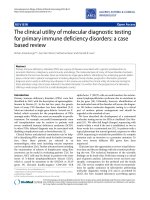
and tiling array, we generated scatter plots and calculated
pair-wise Pearson correlation coefficients (PCCs) for all sam-
ples (Figure 1a,b and Table 1). Expression values for all genes
Genome Biology 2008, Volume 9, Issue 7, Article R112 Laubinger et al. R112.3
Genome Biology 2008, 9:R112
in a given sample were well correlated across platforms, with
PCCs ranging from 0.854 to 0.882 (P < 10
-15
), indicating that
both produce comparable results. Transcripts with expres-
sion estimates close to background correlate the least
between platforms, as a result of higher variance of tiling
array estimates (Figure 1a,b).
We were particularly interested in the power of the tiling
array to detect differential gene expression. To this end, we
compared two samples, roots and inflorescences, which are
known to have very different expression profiles [5]. Applying
the RankProduct method (RankProd) [40,41], we detected
2,484 and 2,294 differentially expressed genes (P < 0.05) on
ATH1 and tiling arrays, respectively, with 1,780 genes in com-
mon. A PCC of 0.92 (P < 10
-15
) indicated a good agreement for
detecting expression differences of individual genes across
platforms (Figure 1c). In addition, we generated a 'corre-
spondence at the top' (CAT) plot using P values to rank the
genes (Figure 1d) [42]. In the top 200 and 1,500 lists, 150 and
1,308 genes, respectively, were found in common, further
supporting high concordance between the two types of arrays.
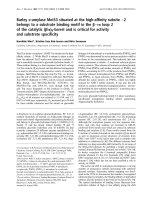
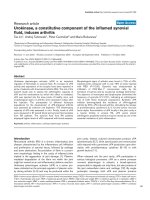
Comparing the platforms across all samples, we found that
more than 70% of all genes showed a correlation of 0.8 or
greater (Figure 2a). Genes with low correlation between plat-
forms tend to be those that are represented by a comparably
small number of tiling probes (Figure 2b). Qualitatively, the
same is true for genes that, because of the improved annota-
tion, are represented by only a limited number of probes on
the ATH1 array (Additional data file 4) or by strongly overlap-
ping probes on ATH1 (Figure 2b). These results indicate that
gene expression estimates based on ten or more tiling array
probes are highly robust. More than 27,000 annotated genes
fulfill this requirement for the Affymetrix Arabidopsis 1.0R
tiling array, making it a powerful tool for gene expression
studies.
Expression of annotated genes not represented on the
ATH1 array
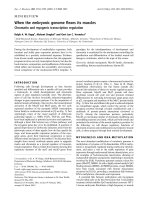
The tiling array allows the analysis of 9,645 genes, corre-
sponding to 31.9% of all annotated genes, that are not repre-
sented on the ATH1 array. The average expression levels of
these genes across all 11 samples are clearly lower than of
those that are also present on the ATH1 array. Although only
15% of genes represented on both the tiling and ATH1 array
platform have average expression level of less than six log
2
units, this applies to more than 50% of the genes found only
on the tiling array (Figure 3a). This is consistent with priority
during the ATH1 design being given to genes with prior
expression evidence [9]. Nevertheless, many genes absent
from ATH1 are expressed more highly in at least one sample
(Figure 3b).
Of the 9,645 genes, 1,065 genes had z scores exceeding 2.5
across the 11 samples, making them good candidates for hav-
ing tissue-specific or stage-specific expression patterns
Comparison of expression estimates on tiling and ATH1 array platformsFigure 1
Comparison of expression estimates on tiling and ATH1 array platforms.
Scatter plot of expression estimates in (a) roots and (b) inflorescences.
(c) Correlation between expression changes between roots and
inflorescences. (d) CAT (correspondence at the top) plot for genes
identified differentially expressed in roots and inflorescences. Proportion
of genes in common is shown as a function of increasing size of subsets
containing the n genes with the highest P values.
0 500 1000 1500 2000
0
0.2
0.4
0.6
0.8
1.0
Size of gene lists
Common fraction
(a)
24681012
4
6
8
10
12
14
-6 -4 -2 0 2 4 6
-6
-4
-2
0
2
4
6
(b)
(c)
(d)
24681012
4
6
8
10
12
14
Expression tiling (log
2
)
Expression ATH1 (log
2
)
Expression tiling (log
2
)
Expression ATH1 (log
2
)
Fold change tiling (log
2
)
Fold change ATH1 (log
2
)
Genome Biology 2008, 9:R112
Genome Biology 2008, Volume 9, Issue 7, Article R112 Laubinger et al. R112.4
(Additional data file 9, Table 1, and Figure 3c). The number of
easily detectable transcripts was higher in roots or senescing
leaves than in young leaves or seedlings, which is in agree-
ment with previous observations [5].
Identification of new transcripts across different
developmental stages
To identify transcripts that are not present in the current
genome annotation, we adopted a computational method,
margin-based segmentation of tiling array data (mSTAD), for
the segmentation of tiling array data into exonic, intronic,
and intergenic regions [35]. Extending a segmentation
method developed for yeast tiling arrays [43], we modeled
spliced transcripts with ten discrete expression levels and
incorporated a more flexible error model. Moreover, mSTAD
is a supervised machine-learning algorithm with internal
parameters that are estimated on hybridization data together
with information on the location of annotated genes. After
training, it can make predictions based on hybridization data
alone.
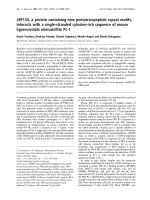
When comparing a genome-wide sample of all mSTAD exon
predictions with annotated genes, we found that the predic-
tions were generally accurate for the more highly expressed
half of genes (Figure 4a; see Materials and methods [below]
for details). For each sample, we further analyzed a set of
high-confidence exon predictions (Figure 4b and Additional
data file 5). These contained a minimum number of four
probes, had predicted discrete expression level between 6 and
10, and had at most 25% repetitive probes. From these high-
confidence exon predictions, which make up 37% to 50% of
the total length of all predictions depending on the tissue ana-
lyzed, more than 97% overlap at least 25 bp with annotated
exons (Figure 4c). Between 26% and 36% of the remainder
overlap with cDNAs and expressed sequence tags (ESTs) but
not with annotated transcripts.
In summary there are between 1,107 and 1,947 predicted
high-confidence exons per sample, for a total length of 242 to
406 kilobases (kb), that are neither included in the current
annotation nor covered by sequenced cDNA clones. A com-
plete list of all high-confidence exons with chromosome start
and end position can be downloaded from the At-TAX
homepage [36]. Among the unannotated high-confidence
predictions, 14% to 31% are specifically detected in a single
sample, with inflorescences and senescing leaves showing the
highest proportion (Figure 4d). Whether these predictions
indeed correspond to expressed transcripts was tested for
some of these by RT-PCR. From high-confidence predictions
that do not overlap with known cDNAs or ESTs, a subset of 47
segments was selected so that different lengths as well as dif-
ferent predicted expression strengths were covered. We could
confirm by RT-PCR that more than three-quarters (37) of
these 47 predicted segments as transcribed (Figure 4e and
Additional data file 6).
Analysis of nonpolyadenylated transcripts
Previous analyses with whole-genome tiling arrays have
focused on the polyadenylated portion of the Arabidopsis
transcriptome [14,30-32]. However, studies conducted in
several other organisms have suggested that there is a large
fraction of nonpolyadenylated RNAs (for example [19,20]). In
order to revisit this question in Arabidopsis, we isolated total
RNA from two different tissues, whole seedlings and inflores-
cences, and depleted it for rRNA using a mix of locked nucleic
acid (LNA) oligonucleotides. This RNA preparation was used
for reverse transcription with either an oligo-dT primer
(which targets only polyA [+] RNA) or random primers
(which target both polyA [+]and polyA [-] RNAs). After con-
version to dsDNA, samples were hybridized to tiling arrays.
For both tissues analyzed, there was a good correlation
between polyA(+) samples and polyA(±)samples (PCC =
0.84; P < 10
-15
; Figure 5a). Nevertheless, we found many tran-
scripts that were more easily detected in polyA(+) samples
Table 1
Correlation of ATH1 and tiling arrays expression values across the analyzed samples
Sample Description PCC Potential tissue-specific transcripts
1 Roots 0.86 378
2 Seedlings 0.88 5
3 Expanding leaves 0.87 13
4 Senescing leaves 0.87 301
5Stem 0.8734
6 Vegetative shoot meristem 0.86 19
7 Inflorescence shoot meristem 0.87 14
8 Whole inflorescences 0.85 152
9 Whole inflorescences (clv3-7)0.86
10 Flowers 0.88 51
11 Fruits 0.86 98
Presented are the correlations for gene expression estimates between ATH1 and tiling array platform, and number of candidates for tissue-specific
genes (z score > 2.5 across all samples and most abundant in this tissue) detected in each sample. PCC, Pearson correlation coefficient.
Genome Biology 2008, Volume 9, Issue 7, Article R112 Laubinger et al. R112.5
Genome Biology 2008, 9:R112
than in polyA(±) samples. This probably reflects the fact that
mean signal intensities are for unknown reasons generally
lower toward the 3' end after random priming (Additional
data file 7). Hence, expression values of short transcripts in
particular may be underestimated with random-primed
hybridization targets.
Only a small proportion of annotated genes produced a much
higher polyA(±) signal compared with the polyA(+) fraction
Platform concordance and factors affecting it for genes represented on both ATH1 and tiling arraysFigure 2
Platform concordance and factors affecting it for genes represented on both ATH1 and tiling arrays. (a) Pearson correlation coefficients (PCCs) of
expression estimates. (b) Box plots showing expression correlation for genes that were either categorized by the number of probes on tiling arrays or
categorized by the total length of nonredundant sequence spanned by ATH1 probes. The boxes have lines at the lower quartile, median, and upper
quartile values. Whiskers extend to the most extreme value within 1.5 times the interquartile range from the ends of the corresponding box. Box plots
are based on genes represented on both the ATH1 and the tiling array, with the total number of genes per category on the respective platform indicated
at the top.
1.0
-1.0
0.0
0.5
-0.5
Length spanned by ATH1 probes (bases)
1-50
51-75
76-100
101-125
126-150
151-175
176-200
201-225
>225
3-5 6 7 8 9 10 >14
(b)
(a)
59
104
112
201
360
922
2,067
4,406
12,488
1.0
-1.0
0.0
0.5
-0.5
11 12 13 14
844
393
333
355
424
434
25,475
441
489
520
520
Number of tiling probes
PCC
PCC
-1 -0.8 -0.6 -0.4 -0.2 0 0.2 0.4 0.6 0.8 1
0
0.3
0.2
0.1
PCC
0
1
4
9
18
51
74
180
210
231
317
131
376
428
548
747
1,008
1,619
2,798
5,948
5,885
Fraction of genes
Genome Biology 2008, 9:R112
Genome Biology 2008, Volume 9, Issue 7, Article R112 Laubinger et al. R112.6
(Table 2). Large differences were detected for two structural
RNAs: a U12 small nuclear RNA and an H/ACA-box small
nucleolar RNA (Table 2). The majority of snRNAs undergo 3'
end processing that is very distinct from polyadenylation
[44,45], indicating that our method appears suitable for
detecting nonpolyadenylated transcripts. Most other tran-
Analysis of genes represented only on tiling arraysFigure 3
Analysis of genes represented only on tiling arrays. (a) Average or (b) maximum expression levels for all genes across all samples. (c) Expression values of
genes with an apparent tissue-specific or stage-specific expression pattern across all samples. Twenty genes with the highest z scores and maximum
expression in root, senescing leaf, inflorescence, or flowers are shown.
<6 6-7 7-8 8-9 9-10 10-11 11-12 >12
(a) (b)
0
0.2
0.4
0.6
Fraction of genes
ATH1 & tiling
Tiling array only
4
6
8
10
5
6
7
8
9
4
6
8
10
5
6
7
8
9
10
11
Roots Senescing leaves
WT infl. clv3-7 infl.
Flowers
Expression value (log
2
)
Tissue Tissue
(c)
<6 6-7 7-8 8-9 9-10 10-11 11-12 >12
ATH1 & tiling
Tiling array only
Expression value (log
2
)
Expression value (log
2
) Expression value (log
2
)
0
0.2
0.4
0.6
Fraction of genes
Genome Biology 2008, Volume 9, Issue 7, Article R112 Laubinger et al. R112.7
Genome Biology 2008, 9:R112
De novo segmentation of tiling array dataFigure 4
De novo segmentation of tiling array data. (a) Segmentation accuracy for roots across ten discrete expression levels (see inset). Sensitivity is defined as the
proportion of exonic probes contained in predicted segments relative to all annotated exonic probes, or the proportion of identified exon segments to all
annotated exons. Specificity indicates how many predicted expressed probes or predicted exons are annotated as such. (b) Sensitivity and specificity of
predicted exon segments for roots in comparison with annotated exons, plotted in a sliding window across 2,000 exons along chromosome 4 together
with information on repetitive probes (window of 5,000 probes; see inset). The heterochromatic knob, the centromere and peri-centromeres are
depicted below the x-axis (for other chromosomes, see Additional data file 5). (c) Proportion of predicted exon segments, high-confidence exon segments
(see text for definition), and unannotated exon segments (high-confidence predictions that do not overlap with any annotated exon by at least 25 base
pairs). Numbers are based on combined length of each class. (d) Proportion of sample-specific exon segments among all unannotated high-confidence
predictions. (e) Examples of RT-PCR validation of predicted novel transcripts.
(a)
(b)
(d)
Predicted
intronic /
intergenic
64.9%
Predicted exonic
35.1%
High confidence
exon segments
17.6%
Unannotated
0.4%
(c)
Per probe Exon overlap
0
0.2
0.4
0.6
0.8
1.0
Fraction
Per probe Exon overlap
Sensitivity Specificity
low
high
Predicted
expression
level
0
Seedling
Leaf
Senesc. leaf
Stem
Veg. apex
Infl. apex
Infloresc.
200
400
600
Root
Flower
Fruit
clv3-7
Combined length [kbp]
Repetitive probes
Sensitivity
(exon overlap)
Specificity
(exon overlap)
51015
0.2
0.4
0.6
0.8
1.0
Fraction
Position on chromosome 4 (Mbp)
0
0
(e)
Predicted
segment length
+RT -RT gDNA
>10 probes
<10 probes
Predicted expression level
high medium low
+RT -RT gDNA+RT -RT gDNA
Unannotated Tissue-specific
Genome Biology 2008, 9:R112
Genome Biology 2008, Volume 9, Issue 7, Article R112 Laubinger et al. R112.8
scripts that were much more abundant in polyA(±) than in
polyA(+) samples emanate from transposons and pseudo-
genes (Table 2). These results suggest that in Arabidopsis the
overwhelming majority of known protein coding transcripts
possess a polyA tail.
Non-polyad transcriptsFigure 5
Non-polyadenylated transcripts. (a) Correlation between expression levels for polyA(+) and polyA(±) samples. (b) Proportion of unannotated transcripts
found in common or exclusively in either polyA(+) samples and polyA(±) samples, respectively, as determined with two independent methods.
(b)
polyA (+/-)
polyA (+)
Combined length (kb)
(a)
polyA (+/-)
polyA (+)
0
100
200
300
400
558
1,716
0
250
500
750
1000
1,696
4,844
In common Specific proportion
High-confidence
mSTAD segments
Non-repetitve
transfrags
2
4
6
8
10
12
14
16
2 4 6 8 10 12 14 16
2
4
6
8
10
12
14
16
2 4 6 8 10 12 14 16
PolyA(+) signal (log
2
)
PolyA(+) signal (log
2
)
PolyA(+/-) signal (log
2
)
Combined length (kb)
Seedlings Inflorescence
Genome Biology 2008, Volume 9, Issue 7, Article R112 Laubinger et al. R112.9
Genome Biology 2008, 9:R112
Table 2
Transcripts that are more abundant in polyA(±) samples than in polyA(+) samples
Locus TAIR7 annotation PolyA(+) (log2) PolyA(±) (log2)
AT1G12013 H/ACA-box snoRNA 9.07 13.51
AT1G15405 Unknown gene 11.07 14.59
AT1G31960 Unknown protein 5.34 8.74
AT1G33860 Unknown protein 8.10 11.78
AT1G34700 Mutator-like transposase family 4.69 8.14
AT1G35080 Similar to unknown protein 3.70 7.03
AT1G35640 Unknown protein 5.91 9.29
AT1G41726 Pseudogene 6.73 10.30
AT1G61275 U12 snRNA 7.11 12.45
AT2G01022 Gypsy-like retrotransposon family 5.72 9.43
AT2G05567 Pseudogene 4.62 8.59
AT2G06250 Pseudogene 6.45 9.87
AT2G06370 Pseudogene 6.36 9.71
AT2G07709 Pseudogene 7.40 11.28
AT2G07711 Pseudogene 7.05 10.42
AT2G07712 Pseudogene 6.90 10.87
AT2G07717 Pseudogene 7.72 11.22
AT2G08986 Similar to unknown protein 6.64 10.15
AT2G10285 Similar to unknown protein 6.16 9.85
AT2G10720 Pseudogene 7.15 10.67
AT2G10790 Pseudogene 7.03 10.86
AT2G12240 CACTA-like transposase family 5.30 9.98
AT2G12320 Similar to unknown protein 6.56 10.05
AT2G12750 Gypsy-like retrotransposon family 7.20 10.71
AT2G13860 Gypsy-like retrotransposon 6.88 10.29
AT2G25255 Encodes a defensin-like (DEFL) family protein 5.65 9.04
AT3G24370 Similar to unknown protein 5.06 9.58
AT3G29570 Similar to ATEXT3 5.41 9.60
AT3G30846 Gypsy-like retrotransposon family 6.78 10.21
AT3G32010 Gypsy-like retrotransposon family (Athila) 5.37 9.41
AT3G32880 Gypsy-like retrotransposon family (Athila) 6.37 10.60
AT3G42251 Pseudogene 5.82 9.24
AT3G42750 Similar to unknown protein 4.44 7.85
AT3G43154 Pseudogene 5.21 9.22
AT3G43160 MEE38 7.42 11.95
AT3G43862 Athila retroelement ORF2-related 6.07 10.44
AT4G05290 Similar to unknown protein 5.39 10.08
AT4G06531 Pseudogene 4.21 7.93
AT4G06573 Athila retroelement ORF1 protein 7.25 11.01
AT4G06710 Pseudogene 6.53 11.72
AT4G06736 Pseudogene 6.27 9.75
AT4G08080 Gypsy-like retrotransposon family (Athila) 6.84 10.74
AT5G32400 Hypothetical protein 6.92 10.32
AT5G32404 Pseudogene 4.90 9.12
AT5G32475 Athila retroelement ORF2-related 5.75 9.37
AT5G32483 Pseudogene 6.41 9.89
AT5G32495 Pseudogene 5.74 9.44
AT5G32517 Pseudogene 5.91 9.34
AT5G33150 Pseudogene 7.33 10.75
AT5G34970 Similar to unknown protein 5.16 8.63
Genome Biology 2008, 9:R112
Genome Biology 2008, Volume 9, Issue 7, Article R112 Laubinger et al. R112.10
We also applied the above described mSTAD algorithm to the
two polyA(±) samples, to detect transcription from unanno-
tated regions. When we subtracted high-confidence segments
found in at least one polyA(+) sample from the segments
found in both polyA(±) samples, segments totaling less than
100 kb were identified as potential polyA(-) transcripts (Fig-
ure 5b). These regions represent less than 0.1% of the entire
genome, which appears to be very low compared with results
reported for C. elegans tiling array studies using the transfrag
method [19]. To rule out the possibility that this discrepancy
is a computational artifact, we applied the transfrag method
to our tiling array data also [46]. This method led to similar
estimates of polyA(±) specific transcribed fragments (transf-
rags), with a combined length of about 250 kb, or 0.2% of the
genome (Figure 5b). These results imply that nonpolyade-
nylated transcripts are much less abundant in Arabidopsis
than in C. elegans and humans [20,47].
Online resources for visualization of Arabidopsis tiling
array data
To make our results easily accessible to the research commu-
nity, we created an online resource that consists of two parts:
a web-tool that reports expression values for user-specified
genes, and a customized generic genome browser [48].
The At-TAX gene expression visualization tool can be fed with
TAIR (The Arabidopsis Information Resource) locus IDs
[49]. Expression estimates for input gene(s) are displayed in
all analyzed samples and on both ATH1 and tiling arrays,
where available (Figure 6a). This not only provides a conven-
ient means of analyzing genes not represented on the ATH1
array, but also allows simple cross-platform comparison. The
generic genome browser displays transcriptional active
regions as predicted by mSTAD across the genome, as well as
all raw expression values for each probe in all analyzed sam-
ples [50] (Figure 6b).
Discussion
In this study, we present an RNA expression atlas, At-TAX, of
the A. thaliana reference strain Col-0 based on the Gene-
Chip
®
Arabidopsis Tiling 1.0R Array. Expression data have
been collected across a series of tissues and developmental
stages for the vast majority of annotated genes, including
more than 9,000 genes that are not represented on the older
ATH1 gene expression array. Moreover, our systematic com-
parison of the performance of the two arrays should provide
valuable information for anybody considering experiments
on either one of these two platforms.
Gene expression profiling with whole genome tiling
arrays
Tiling arrays have several advantages compared with focused
gene expression arrays such as the ATH1 platform, because
tiling arrays allow detection of all transcripts irrespective of
their annotation status as well as different splice forms.
However, because probes have not been optimized in a simi-
lar manner, especially for uniform isothermal hybridization
behavior, it has been unclear how broadly suitable they are for
routine expression analysis. To address this issue, we used
both array types to analyze 11 different samples covering dif-
ferent tissues and developmental stages. The resulting gene
expression estimates on both array platforms are highly cor-
related, including measures of expression changes between
tissues. We conclude that whole genome tiling arrays are
indeed an appropriate tool for standard gene expression anal-
yses. However, expression estimates derived from the two dif-
ferent platforms can differ for various reasons, indicating that
expression data must be interpreted carefully. Discrepancies
are often due to the selection of probes on the ATH1 arrays,
which are biased towards the 3' end of transcripts and some-
times overlap, thus violating assumptions of independence.
Conversely, expression analysis with tiling arrays can be inac-
curate for small genes represented by very few probes, espe-
cially if these have unfavorable hybridization properties.
Uncertainty in gene annotations is another source of error,
because expression may erroneously be measured from
intronic probes.
Compared with the ATH1 array, a disproportionately high
number of genes that are represented only on the tiling array
produced very low hybridization signals. This is not unex-
pected because the genes selected for the ATH1 array were
supported by cDNAs and ESTs, whereas the tiling array
includes hypothetical genes that lack any experimental evi-
dence of expression. In addition, the number of annotated
pseudogenes in A. thaliana has been increasing dramatically.
The first annotation released in 2001 (TIGR1) contained
1,274 pseudogenes, whereas the recent TAIR7 annotation
includes 3,889 pseudogenes [11].
The dark matter of the Arabidopsis genome
Identification of unannotated transcribed regions is a major
motivation for tiling array experiments. That our segmenta-
tion algorithm generated highly reliable predictions is evident
from the observation that there was very good overlap with
annotated genes as well as high success rates for RT-PCR val-
idation experiments. Despite extensive cDNA cloning and
previous use of tiling arrays (for example, [14]), we could
detect more than 1,000 additional transcripts. We found that
exonic regions in the different tissues comprise on average
about one-third of the genome. Despite the finding of unan-
notated transcripts, the ratio of annotated exons to polyA(+)
transcripts detectable on tiling arrays appears to be much
higher in Arabidposis than in some other organisms [51].
Interestingly, tiling array analysis of Arabidopsis mutants
impaired in DNA methylation or RNA quality control has
revealed more than 200 noncoding transcripts that are nor-
mally transcriptionally silenced, indicating that the Arabi-
dopsis genome has at least the potential to generate a large
number of transcripts from intergenic regions [31,32].
Genome Biology 2008, Volume 9, Issue 7, Article R112 Laubinger et al. R112.11
Genome Biology 2008, 9:R112
The nonpolyadenylated Arabidopsis transcriptome
Tiling array studies of human and C. elegans indicated that
about half of all transcripts are not polyadenylated [20]. In
contrast, our data suggest that nonpolyadenylated RNAs
make a more limited contribution to the Arabidopsis tran-
scriptome. It is already known that specific classes of plants
transcripts are generated in a different manner than in ani-
mals. For example, some human microRNA precursors are
At-TAX online resources for gene expression analysisFigure 6
At-TAX online resources for gene expression analysis. (a) At-TAX gene expression estimates derived from tiling (right) and ATH1 arrays across all
analyzed samples in TileViz. Included in this example is a gene not represented on the ATH1 array (red line). (b) Display of predicted expressed segments
(middle) and raw hybridization signals (bottom) along the chromosome (top) in a generic genome browser.
(a)
(b)
Unannotated
transcribed region
Raw values Segments TAIR 7 genes
Genome Biology 2008, 9:R112
Genome Biology 2008, Volume 9, Issue 7, Article R112 Laubinger et al. R112.12
transcribed by RNA polymerase III and hence are not polya-
denylated, whereas Arabidopsis microRNA precursors fea-
ture characteristics of RNA polymerase II generated
transcripts [52,53]. Another reason might be differences in 3'
end processing. For example, histone mRNAs in land plants
are polyadenylated, which is in contrast to histone mRNAs in
animals, which are subject to a unique form of 3' end process-
ing resulting in a hairpin that protects the 3' end from RNA
degrading enzymes [54-58].
We found that many nonpolyadenylated RNAs in Arabidop-
sis are derived from pseudogenes and transposons. Several
examples of actively transcribed pseudogenes have been
reported [59], and many pseudogenes become transcription-
ally activated in methylation-deficient mutants [31]. Known
mechanisms for the transcriptional silencing of pseudogenes
involve small RNAs that are generated through the RNA-
dependent-RNA-polymerase (RDR)2/DICER-LIKE 3 bio-
genesis pathway [60,61]. Interestingly, improperly termi-
nated, nonpolyadenylated RNAs derived from transgenes can
be subject to a silencing pathway that involves another RNA-
dependent-RNA-polymerase, namely RDR6, which can use
both polyadenylated and nonpolyadenylated transcripts as a
substrate [62,63]. Therefore, our observation that RNAs cor-
responding to a subset of pseudogenes are much more abun-
dant in the polyA(±) fraction is compatible with a scenario in
which these pseudogenes are transcribed into polyA(-) RNAs
that subsequently serve as template for RDR-dependent
amplification. However, transcripts from some pseudogenes
are also detectable in polyA(+) samples. These pseudogenes
might either be transcribed into both polyA(+) RNAs and
polyA(-) RNA or, alternatively, polyA(-) RNAs derived from
polyA(+) RNAs accumulate during RNA amplification and
processing steps.
Outlook
We have demonstrated that the use of the GeneChip
®
Arabi-
dopsis Tiling 1.0R Array for routine expression analyses does
not have any apparent disadvantages compared with the
ATH1 array. Rather, it has many advantages, including the
ability to provide information on genes that are not repre-
sented on ATH1, as well as the ability to analyze additional
aspects of gene expression, such as alternative transcript ini-
tiation and 3' end formation or splicing, all of which might be
under physiological or developmental control [64,65]. Tiling
arrays might be the platform of choice to further resolve tran-
scriptional activity over developmental stages and cell types,
especially when combined with techniques for the isolation of
specific cells by laser microdissection or cell sorting (for
review [66]).
Materials and methods
Plant material and RNA isolation
Wild-type Col-0 and clv3-7 plants [37] were grown on soil or
on solid MS medium under continuous light at 23°C. Addi-
tional data file 1 describes each sample. Tissue samples were
frozen in liquid nitrogen and total RNA was isolated using the
RNeasy Plant Mini Kit (Qiagen, Hilden, Germany). RNA
integrity was determined on a Bioanalyzer with the RNA
6000 Series II Nano kit (Agilent, Santa Clara, CA, USA).
Probe preparation and array hybridization
For synthesis of probes (targets) for ATH1 and tiling arrays, 1
μg of total RNA was used as template for generation of cRNA
using the MessageAmp II-Biotin Enhanced Kit (Ambion,
Austin, TX, USA). We followed the manufacturer's instruc-
tions with one exception; for tiling arrays, biotinylated NTPs
were replaced by unmodified NTPs (stock solution 25 mmol/
l each). Sixteen micrograms of biotinylated cRNA (for ATH1
arrays) was fragmented using 5× Fragmentation Buffer.
Seven micrograms of unmodified cRNA (for tiling arrays) was
converted into dsDNA (GeneChip
®
WT Double-Stranded
cDNA Synthesis Kit; Affymetrix Inc.) and dsDNA was
purified using the MinElute Reaction Cleanup Kit (Qiagen). A
total of 7.5 μg dsDNA was fragmented and labeled using the
GeneChip
®
WT Double-Stranded DNA Terminal Labeling Kit
(Affymetrix Inc.). Targets were hybridized to ATH1 and Ara-
bidopsis Tiling 1.0R arrays for 14 hours at 42°C, washed (Flu-
idics Station 450, wash protocol EukGE-WS2_V4 for ATH1
arrays or wash protocol FS450_0001 for tiling arrays) and
scanned using a GeneChip
®
Scanner 3000 7 G.
For comparison of polyA(+) and polyA(±), rRNA was
depleted from 10 μg total RNA using RiboMinus™ Yeast
Transcriptome Isolation Kit (Invitrogen) and an Arabidopsis
specific RiboMinus™ LNA oligonucleotide mix kindly pro-
vided by Invitrogen, Carlsbad, CA, USA. rRNA depleted RNA
was precipitated and resuspended in 12 μl water, from which
11 μl were used for reverse transcription using MessageAmp
II-Biotin Enhanced Kit (Ambion) with an oligo-dT-T7 primer
(MessageAmp II-Biotin Enhanced Kit) or a random-T7
primer (included in the GeneChip
®
WT Amplified Double-
Stranded cDNA Synthesis Kit; Affymetrix Inc.). All subse-
quent steps were performed exactly as described above.
Repetitive probe annotation
To assess the potential of each 25 mer oligonucleotide probe
on the tiling array to crosshybridize to transcripts from differ-
ent locations, we determined whether its sequence occurred
more than once in the A. thaliana genome. To this end we
applied a method proposed previously [67], which annotates
25 mers occurring as exact duplicates elsewhere in the
genome, those which align with identity at the innermost 21
nucleotides, and those that have a single mismatch in the 25
mer alignment. Probes with exact 25 mer matches were
excluded from tiling array expression measurements, and all
types of repetitive probes were used to annotate and filter
exon segments predicted by mSTAD and transfrags.
Genome Biology 2008, Volume 9, Issue 7, Article R112 Laubinger et al. R112.13
Genome Biology 2008, 9:R112
Probe set definitions
In order to analyze annotated genes, we mapped tiling probes
to Arabidopsis gene models as per TAIR7 annotation [68].
Probe sets for individual genes were defined as follows. From
all probes mapped to exons (either coding or untranslated
region) in their entire length, we retained only those for
expression analysis that correspond to constitutive exons in
all annotated splice forms of the same gene. We further
excluded probes that mapped to more than one (overlapping)
gene model, and in order to reduce cross-hybridization
artifacts we also removed repetitive probes whose 25 mer
sequence occurred multiple times in the genome. For expres-
sion measurements from tiling arrays we only considered the
set of 30,228 annotated genes that are represented by at least
three probes.
For the ATH1 array, probe sets were defined according to the
A. thaliana CDF version 10 provided by the Microarray Lab at
the Molecular and Behavioral Neurobiology Institute of the
University of Michigan [69].
Expression estimates
In order to minimize artificial expression level differences
between platforms only resulting from differences in the com-
putational analyses procedures, the RMA method was
applied to hybridization data from both platforms [39]. RMA
proceeds in three steps. First, background correction and
quantile normalization were applied before gene expression
levels were calculated with the median polish method. Data
from ATH1 arrays were analyzed using the RMA implementa-
tion in the Bioconductor package affy [70-72]. For the analy-
sis of tiling arrays, we constructed a pipeline that combined
the same background and quantile normalization methods
from Bioconductor (BufferedMatrixMethods package by BM
Bolstad), with the median polish routine extracted from Bio-
conductor sources (preprocessCore package by BM Bolstad)
and adopted for the analysis of custom probe sets.
Detection of differentially expressed genes and CAT
plot analysis
We applied the Rank Product method (Bioconductor package
RankProduct) [40,73] to identify significantly expressed
genes at a cut-off of P < 0.05. The P values were also used to
assess platform concordance by CAT analysis, in which gene
lists ordered by P value were compared between platforms.
The proportion of most significant genes in common between
platforms was plotted as a function of list sizes increasing in
steps of ten [42]. As a measure of tissue-specific expression, z
scores were calculated as described by Schmid and coworkers
[5].
Segmentation of tiling array data
We preprocessed the hybridization signal to reduce a bias due
to divergent probe sequences using a transcript normaliza-
tion method [35,74] and subsequently applied a modified ver-
sion of the mSTAD algorithm [35].
For each sample, we trained mSTAD separately on mean
intensities across replicates and used the trained instance
only for prediction of array data from the same sample. To
obtain unbiased whole-genome predictions we employed
cross-validation. After splitting the genome between pairs of
neighboring genes, one instance of mSTAD was trained on
500 of these genic regions and hyper-parameters were tuned
on another 500 genic regions. We trained and tuned a second
instance of mSTAD on two further disjoint sets of 500 genes
each. For region-wise whole-genome predictions, we chose
the mSTAD instance that had not seen the particular region
during training and hyperparameter tuning (or a random
instance if neither of them had). From the predicted labeling
of tiling probes we extracted exon segments by assigning the
genomic coordinates corresponding to the start of the first
and the end of the last probe of a run of consecutive exon
labels. The resulting segmentations are available as gff files
and visualized in the At-TAX Generic Genome Browser.
Prediction accuracy was determined on genomic regions that
had not been used for training or parameter tuning of the
mSTAD instance evaluated. Sensitivity and specificity were
assessed in comparison to annotated genes on a per-probe
level as well as for the overlap between annotated and
predicted exons. Figure 4a shows mean performance across
1,000 genic test regions (with at least five probes annotated as
exonic and at least ten probes in total) chosen randomly for
each of the mSTAD instances used to make whole-genome
predictions for root data. Accuracy on probe level was also
calculated for whole-genome (test) predictions for all other
samples (see Additional data file 2).
To determine overlap with annotated regions, we used the
TAIR7 annotation [11] and direct alignments with EST and
cDNA sequences (downloaded from TAIR on 15 August 2007)
[75]. Sample-specific segments were obtained as residual
after computing the overlap between predicted exon
segments in the tissue of interest to those from all other tis-
sues (Figure 4d). Similarly, we obtained predictions specifi-
cally made for polyA(±) conditions as exon segments that
were predicted for both polyA(±) samples (ones that over-
lapped between samples), but did not overlap to predictions
for any polyA(+) sample (Figure 5c).
RT-PCR validation
One microgram of RNA from seedlings and young leaves was
treated with DNaseI (MBI Fermentas, St. Leon-Rot, Ger-
many) and converted into cDNA using the RevertAid™ First
Strand cDNA Synthesis Kit (MBI Fermentas). One microliter
of the resulting cDNA solution was used as a template in a
PCR reaction with primers lying within the predicted tran-
scribed region. The sizes of PCR products ranged from about
150 to 300 bp. A complete list of all used primers is available
in Additional data file 3.
Genome Biology 2008, 9:R112
Genome Biology 2008, Volume 9, Issue 7, Article R112 Laubinger et al. R112.14
Computation of transcribed fragments (transfrags)
As an independent method to compare transcriptional activ-
ity between polyA(+) and polyA(±) samples, we computed
transfrags as described previously [76] and implemented in
the Affymetrix Tiling Analysis Software version 1.1 build 2. In
order to select optimal parameters, we evaluated transfrags
generated for root tissues for 900 different combinations of
parameters in comparison with annotated genes (bandwidth
in steps of 25 between 50 and 150, signal threshold between 5
and 13, minimum run in steps of 20 between 20 and 100, and
maximum gap in steps of 20 between 40 and 100). As optimal
setting for all transfrag computations we chose the one with
maximal sensitivity at a precision similar to mSTAD predic-
tions (bandwidth 100, signal threshold 6, minimum run 100,
maximum gap 40; see Additional data file 8). Among non-
repetitive transfrags (at most 25% repetitive probes) compris-
ing at least four probes and without overlap to annotated
transcripts, the ones specific to polyA(+) or polyA(±) samples
were computed the same way as for high-confidence mSTAD
predictions (Figure 5d).
Abbreviations
At-TAX, Arabidopsis thaliana Tiling Array Express; bp, base
pair; CAT, correspondence at the top; dsDNA, double-
stranded DNA; EST, expressed sequence tag; kb, kilobases;
LNA, locked nucleic acid; mSTAD, margin-based segmenta-
tion of tiling array data; PCC, Pearson correlation coefficient;
RDR, RNA-dependent-RNA-polymerase; RMA, robust mul-
tichip analysis; RT-PCR, reverse transcription polymerase
chain reaction; TAIR, The Arabidopsis Information
Resource.
Authors' contributions
SL, GZ, MV, BS, GR, and DW designed the study. SL carried
out target preparation and array hybridization. GZ, SRH, TS
and NN developed tools for tiling array analysis. GZ, SRH, SL,
and TS analyzed the data. TS and CKW developed online vis-
ualization tools. SL, GZ, GR, and DW wrote the manuscript.
All authors read and approved the final manuscript.
Additional data files
The following additional data are available with the online
version of this paper. Additional data file 1 lists all analyzed
samples, including growth conditions and plant age.
Additional data file 2 shows segmentation accuracy of
mSTAD. Additional data file 3 lists oligonucleotide primers
that were used for RT-PCR validation of new transcripts.
Additional data file 4 shows correlation between platform
concordances and probe numbers on the ATH1 array. Addi-
tional data file 5 shows segmentation accuracy achieved by
mSTAD along the five Arabidopsis chromosomes. Additional
data file 6 shows the results of all RT-PCR validation experi-
ments. Additional data file 7 shows a comparison of mean
hybridization intensities in random-primed and oligo-dT-
primed samples. Additional data file 8 shows a comparison of
segmentation accuracy for mSTAD and the transfrag method.
Additional data file 9 contains gene identifiers with corre-
sponding expression values and z-scores in all samples we
analyzed.
Additional data file 1All analyzed samplesListed are all analyzed samples, including growth conditions and plant age.Click here for fileAdditional data file 2Segmentation accuracy of mSTADShown is the segmentation accuracy of mSTAD.Click here for fileAdditional data file 3oligonucleotide primers that were used for RT-PCRShown are the oligonucleotide primers that were used for RT-PCR validation of new transcripts.Click here for fileAdditional data file 4Correlation between platform concordances and probe numbers on the ATH1 arrayShown is the correlation between platform concordances and probe numbers on the ATH1 array.Click here for fileAdditional data file 5Segmentation accuracy achieved by mSTAD along the five Arabi-dopsis chromosomesShown is the segmentation accuracy achieved by mSTAD along the five Arabidopsis chromosomes.Click here for fileAdditional data file 6Results of all RT-PCR validation experimentsPresented are the results of all RT-PCR validation experiments.Click here for fileAdditional data file 7Comparison of mean hybridization intensities in random-primed and oligo-dT-primed samplesPresented is a comparison of mean hybridization intensities in ran-dom-primed and oligo-dT-primed samples.Click here for fileAdditional data file 8Comparison of segmentation accuracy for mSTAD and the trans-frag methodPresented is a comparison of segmentation accuracy for mSTAD and the transfrag method.Click here for fileAdditional data file 9Gene identifiers with corresponding expression values and z-scoresPresented are gene identifiers with corresponding expression val-ues and z-scores in all samples we analyzed.Click here for file
Acknowledgements
We are grateful to Jan Lohmann and Markus Schmid for discussion, and
Wolfgang Busch, Joffrey Fitz, Stephan Ossowski, Korbinian Schneeberger,
and Norman Warthmann for helpful suggestions and critical reading of the
manuscript. Funded by FP6 IP AGRON-OMICS (contract LSHG-CT-2006-
037704) and the Max Planck Society.
References
1. Birnbaum K, Shasha DE, Wang JY, Jung JW, Lambert GM, Galbraith
DW, Benfey PN: A gene expression map of the Arabidopsis
root. Science 2003, 302:1956-1960.
2. Cai S, Lashbrook CC: Stamen abscission zone transcriptome
profiling reveals new candidates for abscission control.
Enhanced retention of floral organs in transgenic plants
overexpressing Arabidopsis Zinc Finger Protein 2. Plant Physiol
2008, 146:1305-1321.
3. Kilian J, Whitehead D, Horak J, Wanke D, Weinl S, Batistic O,
D'Angelo C, Bornberg-Bauer E, Kudla J, Harter K: The AtGenEx-
press global stress expression data set: protocols, evaluation
and model data analysis of UV-B light, drought and cold
stress responses. Plant J 2007, 50:347-363.
4. Nawy T, Lee JY, Colinas J, Wang JY, Thongrod SC, Malamy JE, Birn-
baum K, Benfey PN: Transcriptional profile of the Arabidopsis
root quiescent center. Plant Cell 2005, 17:1908-1925.
5. Schmid M, Davison TS, Henz SR, Pape UJ, Demar M, Vingron M,
Schölkopf B, Weigel D, Lohmann JU: A gene expression map of
Arabidopsis thaliana development. Nat. Genet 2005, 37:501-506.
6. Spencer MW, Casson SA, Lindsey K: Transcriptional profiling of
the Arabidopsis embryo. Plant Physiol 2007, 143:924-940.
7. Allemeersch J, Durinck S, Vanderhaeghen R, Alard P, Maes R, Seeuws
K, Bogaert T, Coddens K, Deschouwer K, Van Hummelen P, Vuyl-
steke M, Moreau Y, Kwekkeboom J, Wijfjes AH, May S, Beynon J,
Hilson P, Kuiper MT: Benchmarking the CATMA microarray.
A novel tool for Arabidopsis transcriptome analysis. Plant
Physiol 2005, 137:588-601.
8. Busch W, Lohmann JU: Profiling a plant: expression analysis in
Arabidopsis. Curr Opin Plant Biol 2007, 10:136-141.
9. Redman JC, Haas BJ, Tanimoto G, Town CD: Development and
evaluation of an Arabidopsis whole genome Affymetrix probe
array.
Plant J 2004, 38:545-561.
10. Zimmermann P, Hirsch-Hoffmann M, Hennig L, Gruissem W: GEN-
EVESTIGATOR. Arabidopsis microarray database and analy-
sis toolbox. Plant Physiol 2004, 136:2621-2632.
11. Swarbreck D, Wilks C, Lamesch P, Berardini TZ, Garcia-Hernandez
M, Foerster H, Li D, Meyer T, Muller R, Ploetz L, Radenbaugh A, Singh
S, Swing V, Tissier C, Zhang P, Huala E: The Arabidopsis Informa-
tion Resource (TAIR): gene structure and function
annotation. Nucleic Acids Res 2008:D1009-D1014.
12. Brenner S, Johnson M, Bridgham J, Golda G, Lloyd DH, Johnson D,
Luo S, McCurdy S, Foy M, Ewan M, Roth R, George D, Eletr S, Albre-
cht G, Vermaas E, Williams SR, Moon K, Burcham T, Pallas M,
DuBridge RB, Kirchner J, Fearon K, Mao J, Corcoran K: Gene
expression analysis by massively parallel signature sequenc-
ing (MPSS) on microbead arrays. Nat Biotechnol 2000,
18:630-634.
13. Velculescu VE, Vogelstein B, Kinzler KW: Analysing uncharted
transcriptomes with SAGE. Trends Genet 2000, 16:423-425.
14. Yamada K, Lim J, Dale JM, Chen H, Shinn P, Palm CJ, Southwick AM,
Wu HC, Kim C, Nguyen M, Pham P, Cheuk R, Karlin-Newmann G,
Liu SX, Lam B, Sakano H, Wu T, Yu G, Miranda M, Quach HL, Tripp
M, Chang CH, Lee JM, Toriumi M, Chan MM, Tang CC, Onodera CS,
Deng JM, Akiyama K, Ansari Y, et al.: Empirical analysis of tran-
scriptional activity in the Arabidopsis genome. Science 2003,
302:842-846.
Genome Biology 2008, Volume 9, Issue 7, Article R112 Laubinger et al. R112.15
Genome Biology 2008, 9:R112
15. Mockler TC, Chan S, Sundaresan A, Chen H, Jacobsen SE, Ecker JR:
Applications of DNA tiling arrays for whole-genome
analysis. Genomics 2005, 85:1-15.
16. David L, Huber W, Granovskaia M, Toedling J, Palm CJ, Bofkin L,
Jones T, Davis RW, Steinmetz LM: A high-resolution map of tran-
scription in the yeast genome. Proc Natl Acad Sci USA 2006,
103:5320-5325.
17. Samanta MP, Tongprasit W, Sethi H, Chin CS, Stolc V: Global iden-
tification of noncoding RNAs in Saccharomyces cerevisiae by
modulating an essential RNA processing pathway. Proc Natl
Acad Sci USA 2006, 103:4192-4197.
18. Manak JR, Dike S, Sementchenko V, Kapranov P, Biemar F, Long J,
Cheng J, Bell I, Ghosh S, Piccolboni A, Gingeras TR: Biological func-
tion of unannotated transcription during the early
development of Drosophila melanogaster. Nat Genet 2006,
38:1151-1158.
19. He H, Wang J, Liu T, Liu XS, Li T, Wang Y, Qian Z, Zheng H, Zhu X,
Wu T, Shi B, Deng W, Zhou W, Skogerbo G, Chen R: Mapping the
C. elegans noncoding transcriptome with a whole-genome
tiling microarray. Genome Res 2007, 17:1471-1477.
20. Cheng J, Kapranov P, Drenkow J, Dike S, Brubaker S, Patel S, Long J,
Stern D, Tammana H, Helt G, Sementchenko V, Piccolboni A,
Bekiranov S, Bailey DK, Ganesh M, Ghosh S, Bell I, Gerhard DS, Gin-
geras TR: Transcriptional maps of 10 human chromosomes at
5-nucleotide resolution. Science 2005, 308:1149-1154.
21. Kapranov P, Drenkow J, Cheng J, Long J, Helt G, Dike S, Gingeras TR:
Examples of the complex architecture of the human tran-
scriptome revealed by RACE and high-density tiling arrays.
Genome Res 2005, 15:987-997.
22. Bertone P, Stolc V, Royce TE, Rozowsky JS, Urban AE, Zhu X, Rinn
JL, Tongprasit W, Samanta M, Weissman S, Gerstein M, Snyder M:
Global identification of human transcribed sequences with
genome tiling arrays. Science 2004,
306:2242-2246.
23. Juneau K, Palm C, Miranda M, Davis RW: High-density yeast-tiling
array reveals previously undiscovered introns and extensive
regulation of meiotic splicing. Proc Natl Acad Sci USA 2007,
104:1522-1527.
24. Johnson JM, Edwards S, Shoemaker D, Schadt EE: Dark matter in
the genome: evidence of widespread transcription detected
by microarray tiling experiments. Trends Genet 2005,
21:93-102.
25. Jiao Y, Jia P, Wang X, Su N, Yu S, Zhang D, Ma L, Feng Q, Jin Z, Li L,
Xue Y, Cheng Z, Zhao H, Han B, Deng XW: A tiling microarray
expression analysis of rice chromosome 4 suggests a chro-
mosome-level regulation of transcription. Plant Cell 2005,
17:1641-1657.
26. Li L, Wang X, Sasidharan R, Stolc V, Deng W, He H, Korbel J, Chen
X, Tongprasit W, Ronald P, Chen R, Gerstein M, Deng XW: Global
identification and characterization of transcriptionally active
regions in the rice genome. PLoS ONE 2007, 2:e294.
27. Li L, Wang X, Stolc V, Li X, Zhang D, Su N, Tongprasit W, Li S, Cheng
Z, Wang J, Deng XW: Genome-wide transcription analyses in
rice using tiling microarrays. Nat Genet 2006, 38:124-129.
28. Li L, Wang X, Xia M, Stolc V, Su N, Peng Z, Li S, Wang J, Wang X,
Deng XW: Tiling microarray analysis of rice chromosome 10
to identify the transcriptome and relate its expression to
chromosomal architecture. Genome Biol 2005, 6:R52.
29. Hanada K, Zhang X, Borevitz JO, Li WH, Shiu SH: A large number
of novel coding small open reading frames in the intergenic
regions of the Arabidopsis thaliana genome are transcribed
and/or under purifying selection. Genome Res 2007, 17:632-640.
30. Stolc V, Samanta MP, Tongprasit W, Sethi H, Liang S, Nelson DC,
Hegeman A, Nelson C, Rancour D, Bednarek S, Ulrich EL, Zhao Q,
Wrobel RL, Newman CS, Fox BG, Phillips GN Jr, Markley JL, Sussman
MR: Identification of transcribed sequences in Arabidopsis
thaliana by using high-resolution genome tiling arrays. Proc
Natl Acad Sci USA 2005, 102:4453-4458.
31. Zhang X, Yazaki J, Sundaresan A, Cokus S, Chan SW, Chen H, Hend-
erson IR, Shinn P, Pellegrini M, Jacobsen SE, Ecker JR: Genome-wide
high-resolution mapping and functional analysis of DNA
methylation in Arabidopsis
. Cell 2006, 126:1189-1201.
32. Chekanova JA, Gregory BD, Reverdatto SV, Chen H, Kumar R,
Hooker T, Yazaki J, Li P, Skiba N, Peng Q, Alonso J, Brukhin V, Gross-
niklaus U, Ecker JR, Belostotsky DA: Genome-wide high-resolu-
tion mapping of exosome substrates reveals hidden features
in the Arabidopsis transcriptome. Cell 2007, 131:1340-1353.
33. Perocchi F, Xu Z, Clauder-Munster S, Steinmetz LM: Antisense arti-
facts in transcriptome microarray experiments are resolved
by actinomycin D. Nucleic Acids Res 2007, 35:e128.
34. Wu JQ, Du J, Rozowsky J, Zhang Z, Urban AE, Euskirchen G, Weiss-
man S, Gerstein M, Snyder M: Systematic analysis of transcribed
loci in ENCODE regions using RACE sequencing reveals
extensive transcription in the human genome. Genome Biol
2008, 9:R3.
35. Zeller G, Henz SR, Laubinger S, Weigel D, Rätsch G: Transcript
normalization and segmentation of tiling array data. Pac
Symp Biocomput 2008:527-538.
36. At-TAX homepage [ />microarray/at-tax]
37. Fletcher JC, Brand U, Running MP, Simon R, Meyerowitz EM: Signal-
ing of cell fate decisions by CLAVATA3 in Arabidopsis shoot
meristems. Science 1999, 283:1911-1914.
38. Eklund AC, Turner LR, Chen P, Jensen RV, deFeo G, Kopf-Sill AR,
Szallasi Z: Replacing cRNA targets with cDNA reduces micro-
array cross-hybridization. Nat Biotechnol 2006, 24:1071-1073.
39. Irizarry RA, Hobbs B, Collin F, Beazer-Barclay YD, Antonellis KJ,
Scherf U, Speed TP: Exploration, normalization, and summa-
ries of high density oligonucleotide array probe level data.
Biostatistics 2003, 4:249-264.
40. Breitling R, Herzyk P: Rank-based methods as a non-parametric
alternative of the T-statistic for the analysis of biological
microarray data. J Bioinform Comput Biol 2005, 3:1171-1189.
41. Hong F, Breitling R, McEntee CW, Wittner BS, Nemhauser JL, Chory
J: RankProd: a bioconductor package for detecting differen-
tially expressed genes in meta-analysis. Bioinformatics 2006,
22:2825-2827.
42. Irizarry RA, Warren D, Spencer F, Kim IF, Biswal S, Frank BC, Gabri-
elson E, Garcia JG, Geoghegan J, Germino G, Griffin C, Hilmer SC,
Hoffman E, Jedlicka AE, Kawasaki E, Martínez-Murillo F, Morsberger
L, Lee H, Petersen D, Quackenbush J, Scott A, Wilson M, Yang Y, Ye
SQ, Yu W: Multiple-laboratory comparison of microarray
platforms. Nat Methods 2005, 2:345-350.
43. Huber W, Toedling J, Steinmetz LM: Transcript mapping with
high-density oligonucleotide tiling arrays. Bioinformatics 2006,
22:1963-1970.
44. Filipowicz W, Pogacic V: Biogenesis of small nucleolar
ribonucleoproteins. Curr Opin Cell Biol 2002, 14:319-327.
45. Weiner AM: E Pluribus Unum: 3' end formation of polyade-
nylated mRNAs, histone mRNAs, and U snRNAs. Mol Cell
2005, 20:168-170.
46. Kampa D, Cheng J, Kapranov P, Yamanaka M, Brubaker S, Cawley S,
Drenkow J, Piccolboni A, Bekiranov S, Helt G, Tammana H, Gingeras
TR: Novel RNAs identified from an in-depth analysis of the
transcriptome of human chromosomes 21 and 22. Genome
Res 2004, 14:331-342.
47. He H, Wang J, Liu T, Liu XS, Li T, Wang Y, Qian Z, Zheng H, Zhu X,
Wu T, Shi B, Deng W, Zhou W, Skogerbo G, Chen R: Mapping the
C. elegans noncoding transcriptome with a whole-genome
tiling microarray. Genome Res 2007, 17:1471-1477.
48. Stein LD, Mungall C, Shu S, Caudy M, Mangone M, Day A, Nickerson
E, Stajich JE, Harris TW, Arva A, Lewis S: The generic genome
browser: a building block for a model organism system
database. Genome Res 2002, 12:1599-1610.
49. At-TAX TileViz [ />50. At-TAX Gbrowse [ />51. Kapranov P, Cheng J, Dike S, Nix DA, Duttagupta R, Willingham AT,
Stadler PF, Hertel J, Hackermüller J, Hofacker IL, Bell I, Cheung E,
Drenkow J, Dumais E, Patel S, Helt G, Ganesh M, Ghosh S, Piccolboni
A, Sementchenko V, Tammana H, Gingeras TR: RNA maps reveal
new RNA classes and a possible function for pervasive
transcription. Science 2007, 316:1484-1488.
52. Borchert GM, Lanier W, Davidson BL: RNA polymerase III tran-
scribes human microRNAs. Nat Struct Mol Biol 2006,
13:1097-1101.
53. Xie Z, Allen E, Fahlgren N, Calamar A, Givan SA, Carrington JC:
Expression of Arabidopsis MIRNA genes. Plant Physiol 2005,
138:2145-2154.
54. Chaboute ME, Chaubet N, Clement B, Gigot C, Philipps G: Polyade-
nylation of histone H3 and H4 mRNAs in dicotyledonous
plants. Gene 1988, 71:217-223.
55. Chaboute ME, Chaubet N, Gigot C, Philipps G: Histones and his-
tone genes in higher plants: structure and genomic
organization. Biochimie 1993, 75:523-531.
56. Chaubet N, Chaboute ME, Clement B, Ehling M, Philipps G, Gigot C:
The histone H3 and H4 mRNAs are polyadenylated in maize.
Nucleic Acids Res 1988, 16:1295-1304.
Genome Biology 2008, 9:R112
Genome Biology 2008, Volume 9, Issue 7, Article R112 Laubinger et al. R112.16
57. Dominski Z, Marzluff WF: Formation of the 3' end of histone
mRNA: getting closer to the end. Gene 2007, 396:373-390.
58. Wu SC, Gyorgyey J, Dudits D: Polyadenylated H3 histone tran-
scripts and H3 histone variants in alfalfa. Nucleic Acids Res 1989,
17:3057-3063.
59. Balakirev ES, Ayala FJ: Pseudogenes: are they 'junk' or functional
DNA? Annu Rev Genet 2003, 37:123-151.
60. Kasschau KD, Fahlgren N, Chapman EJ, Sullivan CM, Cumbie JS, Givan
SA, Carrington JC: Genome-wide profiling and analysis of Ara-
bidopsis siRNAs. PLoS Biol 2007, 5:e57.
61. Lu C, Kulkarni K, Souret FF, MuthuValliappan R, Tej SS, Poethig RS,
Henderson IR, Jacobsen SE, Wang W, Green PJ, Meyers BC: Micro-
RNAs and other small RNAs enriched in the Arabidopsis
RNA-dependent RNA polymerase-2 mutant. Genome Res
2006, 16:1276-1288.
62. Luo Z, Chen Z: Improperly terminated, unpolyadenylated
mRNA of sense transgenes is targeted by RDR6-mediated
RNA silencing in Arabidopsis. Plant Cell 2007, 19:943-958.
63. Curaba J, Chen X: Biochemical activities of Arabidopsis RNA-
dependent RNA polymerase 6. J Biol Chem 2008, 283:3059-3066.
64. Reddy AS: Alternative splicing of pre-messenger RNAs in
plants in the genomic era. Annu Rev Plant Biol 2007, 58:267-294.
65. Ner-Gaon H, Fluhr R: Whole-genome microarray in Arabidop-
sis facilitates global analysis of retained introns. DNA Res 2006,
13:111-121.
66. Galbraith DW, Birnbaum K:
Global studies of cell type-specific
gene expression in plants. Annu Rev Plant Biol 2006, 57:451-475.
67. Clark RM, Schweikert G, Toomajian C, Ossowski S, Zeller G, Shinn
P, Warthmann N, Hu TT, Fu G, Hinds DA, Chen H, Frazer KA, Huson
DH, Schölkopf B, Nordborg M, Rätsch G, Ecker JR, Weigel D: Com-
mon sequence polymorphisms shaping genetic diversity in
Arabidopsis thaliana. Science 2007, 317:338-342.
68. Rhee SY, Beavis W, Berardini TZ, Chen G, Dixon D, Doyle A, Garcia-
Hernandez M, Huala E, Lander G, Montoya M, Miller N, Mueller LA,
Mundodi S, Reiser L, Tacklind J, Weems DC, Wu Y, Xu I, Yoo D,
Yoon J, Zhang P: The Arabidopsis Information Resource
(TAIR): a model organism database providing a centralized,
curated gateway to Arabidopsis biology, research materials
and community. Nucleic Acids Res 2003, 31:224-228.
69. Dai M, Wang P, Boyd AD, Kostov G, Athey B, Jones EG, Bunney WE,
Myers RM, Speed TP, Akil H, Watson SJ, Meng F: Evolving gene/
transcript definitions significantly alter the interpretation of
GeneChip data. Nucleic Acids Res 2005, 33:e175.
70. Gautier L, Cope L, Bolstad BM, Irizarry RA: affy: analysis of
Affymetrix GeneChip data at the probe level. Bioinformatics
2004, 20:307-315.
71. Gentleman RC, Carey VJ, Bates DM, Bolstad B, Dettling M, Dudoit S,
Ellis B, Gautier L, Ge Y, Gentry J, Hornik K, Hothorn T, Huber W,
Iacus S, Irizarry R, Leisch F, Li C, Maechler M, Rossini AJ, Sawitzki G,
Smith C, Smyth G, Tierney L, Yang JY, Zhang J: Bioconductor: open
software development for computational biology and
bioinformatics. Genome Biol 2004, 5:R80.
72. Bioconducter []
73. Hong F, Breitling R: A comparison of meta-analysis methods
for detecting differentially expressed genes in microarray
experiments. Bioinformatics 2008, 24:374-382.
74. Royce TE, Rozowsky JS, Gerstein MB: Assessing the need for
sequence-based normalization in tiling microarray
experiments. Bioinformatics 2007, 23:988-997.
75. The Arabidopsis Information Resource (TAIR)
[http://
www.arabidopsis.org]
76. Kampa D, Cheng J, Kapranov P, Yamanaka M, Brubaker S, Cawley S,
Drenkow J, Piccolboni A, Bekiranov S, Helt G, Tammana H, Gingeras
TR: Novel RNAs identified from an in-depth analysis of the
transcriptome of human chromosomes 21 and 22. Genome
Res 2004, 14:331-342.