Báo cáo y học: "Center for Biotechnology and Genomic Medicine, Medical College of Georgia" docx
Bạn đang xem bản rút gọn của tài liệu. Xem và tải ngay bản đầy đủ của tài liệu tại đây (990.2 KB, 18 trang )
Genome Biology 2008, 9:R119
Open Access
2008Zhouet al.Volume 9, Issue 7, Article R119
Research
The IL-10 and IFN-γ pathways are essential to the potent
immunosuppressive activity of cultured CD8
+
NKT-like cells
Li Zhou
*†
, Hongjie Wang
*
, Xing Zhong
*
, Yulan Jin
*
, Qing-Sheng Mi
*†
,
Ashok Sharma
*
, Richard A McIndoe
*†
, Nikhil Garge
*
, Robert Podolsky
*‡
and
Jin-Xiong She
*†
Addresses:
*
Center for Biotechnology and Genomic Medicine, Medical College of Georgia, 15th Street, Augusta, GA 30912, USA.
†
Department
of Pathology, Medical College of Georgia, 15th Street, Augusta, GA 30912, USA.
‡
Department of Medicine, Medical College of Georgia, 15th
Street, Augusta, GA 30912, USA.
Correspondence: Jin-Xiong She. Email:
© 2008 Zhou et al.; licensee BioMed Central Ltd.
This is an open access article distributed under the terms of the Creative Commons Attribution License ( which
permits unrestricted use, distribution, and reproduction in any medium, provided the original work is properly cited.
CD8
+
NKT-like cell profiling<p>Global gene expression profiling of <it>in vitro</it> cultured CD8<sup>+ </sup>T cells that express natural killer cell markers revealed differential expression of about 3,000 genes between these cells and naïve CD8<sup>+ </sup>T cells.</p>
Abstract
Background: CD8
+
NKT-like cells are naturally occurring but rare T cells that express both T cell
and natural killer cell markers. These cells may play key roles in establishing tolerance to self-
antigens; however, their mechanism of action and molecular profiles are poorly characterized due
to their low frequencies. We developed an efficient in vitro protocol to produce CD8
+
T cells that
express natural killer cell markers (CD8
+
NKT-like cells) and extensively characterized their
functional and molecular phenotypes using a variety of techniques.
Results: Large numbers of CD8
+
NKT-like cells were obtained through culture of naïve CD8
+
T
cells using anti-CD3/anti-CD28-coated beads and high dose IL-2. These cells possess potent activity
in suppressing the proliferation of naïve responder T cells. Gene expression profiling suggests that
the cultured CD8
+
NKT-like cells and the naïve CD8
+
T cells differ by more than 2-fold for about
3,000 genes, among which 314 are upregulated by more than 5-fold and 113 are upregulated by
more than 10-fold in the CD8
+
NKT-like cells. A large proportion of the highly upregulated genes
are soluble factors or surface markers that have previously been implicated in immune suppression
or are likely to possess immunosuppressive properties. Many of these genes are regulated by two
key cytokines, IL-10 and IFN-γ. The immunosuppressive activities of cells cultured from IL-10
-/-
and
IFN-γ
-/-
mice are reduced by about 70% and about 50%, respectively, compared to wild-type mice.
Conclusion: Immunosuppressive CD8
+
NKT-like cells can be efficiently produced and their
immunosuppressive activity is related to many surface and soluble molecules regulated by IL-10 and
IFN-γ.
Background
T cells comprise a heterogeneous population of cells that have
different phenotypes and functions. The primary function of
T cells is to mount an immune response against invading
pathogens, but some T cells can mount an immune response
against self-proteins and thus cause a variety of autoimmune
Published: 29 July 2008
Genome Biology 2008, 9:R119 (doi:10.1186/gb-2008-9-7-r119)
Received: 5 June 2008
Accepted: 29 July 2008
The electronic version of this article is the complete one and can be
found online at />Genome Biology 2008, 9:R119
Genome Biology 2008, Volume 9, Issue 7, Article R119 Zhou et al. R119.2
diseases if they are not properly controlled by a T cell popula-
tion known as regulatory T cells (Treg cells). There are several
well defined Treg cell subsets and the best studied is the
CD4
+
CD25
+
Treg cells, which possess potent activity in sup-
pressing the proliferation of both CD4
+
and CD8
+
effector T
cells in vitro and in vivo. Certain CD8
+
T cells have also been
recognized to have suppressive function but the CD8
+
Treg is
poorly defined. T cells with natural killer (NK) cell activity
have been identified in both mice and humans [1-4] and these
cells are referred to as NKT cells. Murine NKT cells express
phenotypic markers that are typically found on T cells, such
as CD3 and the αβ T-cell receptor (TCR), and markers for NK
cells, such as NK1.1 and DX5 [5]. Two major NKT cell popula-
tions have been recognized in mice [6,7]. The first population
is the well-characterized invariant NKT (iNKT) cells that
express invariant Vα14-Jα18 TCR in mice [8-10]. These iNKT
cells are restricted by the major histocompatibility complex
(MHC) class I-like molecule Cd1d and recognize glycolipid
antigen α-galactosylceramide, a synthetic variant of a murine
sponge-derived glycolipid [8,11]. These iNKT cells produce
large amounts of interleukin (IL)-4 and interferon (IFN)-γ
upon activation and have been shown to play a critical role in
regulating the immune response [8,11]. The second popula-
tion of NKT cells expresses a variable TCR repertoire and is
not restricted by Cd1d. These NKT cells express mainly CD8
or are negative for both CD8 and CD4 [6]. The whole
αβTCR
+
NK1.1
+
NKT population represents 1-2% of spleno-
cytes in B6 mice, and, of these cells, approximately 20% are
CD8
+
[6]. It has been shown that neonatal tolerance is associ-
ated with increased CD8
+
NKT-like cells, suggesting that
CD8
+
NKT-like cells may have immunoregulatory properties
[12].
Due to the very low frequency of the CD8
+
NKT-like cells,
their function and the molecular mechanism underlying their
function are poorly understood. Therefore, a number of
investigators have attempted to develop in vitro and in vivo
expansion protocols to investigate these rare cells. The Cd1d-
independent CD8
+
NKT-like cells are increased in certain
genetically manipulated mice. For example, three different
MHC class I-restricted TCR-transgenic mouse strains (OT-I,
P14 and H-Y) contain higher but still low frequencies of trans-
genic CD8
+
T cells that co-express NK cell marker NK1.1 [13].
These transgenic CD8
+
NKT-like cells are endowed with
effector properties, such as cytokine production and antigen-
specific cytotoxicity. Tumor-bearing C57BL/6 mice were
shown to have a population of NKT cells that co-express CD8
and NK1.1 [14]. These cells can be maintained in long-term
culture with IL-4 but produce large amounts of IFN-γ follow-
ing activation. These CD8
+
NKT-like cells show a potent NK-
like cytotoxic activity against multiple tumor targets and their
cytotoxic activity is Cd1d-independent [14]. CD8
+
cells with
NK phenotype can also be expanded in vitro using a culture
condition that includes IFN-γ, anti-CD3 and IL-2 [15]. Such
expanded CD8
+
NKT-like cells can efficiently kill tumor cells
in vitro and in vivo but have limited capacity to cause graft-
versus-host disease [15]. However, the amplification effi-
ciency for these cells is variable and slight changes in culture
conditions may result in cells with very different phenotypes
and functions. Cell culture with anti-CD3/anti-CD28-coated
beads and high dose IL-2 was previously shown to expand
CD4
+
Treg cells that can suppress the proliferation of
responder T cells and prevent the development of autoim-
mune diseases in certain models [16,17]. Using a similar pro-
tocol, we can efficiently produce, from the total splenic CD8
+
T cell population, large numbers of CD8
+
T cells that co-
express various NK markers. These cells are therefore
referred to as CD8
+
NKT-like cells. We demonstrate that
these cells possess potent immunosuppressive activity and
report the molecular profiles of these cells assayed using
microarray analysis coupled with multiple confirmation tech-
niques, including RT-PCR, enzyme-linked immunosorbent
assay (ELISA) and flow cytometry. Guided by the genomic
information, we further demonstrate that IL-10 and IFN-γ are
two key pathways implicated in the function of these immu-
nosuppressive CD8
+
NKT-like cells.
Results
In vitro culture of CD8
+
T cells
In vitro cultures with anti-CD3/anti-CD28-coated beads in
the presence of high dose IL-2 can efficiently expand
CD4
+
CD25
+
Treg cells that suppress the proliferation of effec-
tor T cells. However, the small number of natural CD4
+
Treg
cells available for expansion limits the use of this approach.
Therefore, we attempted to obtain Treg cells from the more
abundant total CD4
+
and CD8
+
T cell populations from the
mouse spleen. Freshly purified splenic CD8
+
or Mo-Flow
sorted CD4
+
T cells from 7-8-week old mice were cultured
with an expansion protocol consisting of anti-CD3/anti-
CD28-coated beads and high dose IL-2. By the end of the 10-
13 days of expansion, the number of cells had generally
increased by over 1,000-fold. The cultured cells were pheno-
typed for a number of surface markers (Figure 1). The vast
majority of the cultured cells from CD8
+
T cells were positive
for CD8 (>95%) and the activation marker CD25 (98%) at the
end of the culture. Consistent with the activation of these
cells, the percentages of CD62L
+
cells gradually decreased
and became very low near the end of the culture (around
10%). Similarly, the culture conditions can efficiently expand
CD4
+
T cells. At the end of the culture, the cultured cells
remained CD4
+
(97%) and became positive for the activation
marker CD25 (99%).
Cultured CD8
+
T cells possess potent
immunosuppressive properties
The cultured CD8
+
and CD4
+
T cells were tested for their abil-
ity to inhibit the proliferation of CD4
+
CD25
-
naïve T cells (Tn
cells) using two different in vitro suppression assays. In the
first assay, the naïve T cells were labeled with carboxyfluores-
cein succinimidyl ester (CFSE) and T cell proliferation was
assessed by the dilution of CFSE signal using fluorescence-
Genome Biology 2008, Volume 9, Issue 7, Article R119 Zhou et al. R119.3
Genome Biology 2008, 9:R119
activated cell sorting (FACS) analysis. As shown in Figure 2a,
the cultured CD8
+
T cells efficiently suppressed proliferation
of naïve CD4
+
CD25
-
T cells. The suppressive activity of the
cultured CD8
+
T cells is dose-dependent and strong suppres-
sion can be seen at the 1:16 expanded CD8
+
T to Tn cell ratio
(Tr/Tn; Figure 2b). In the second suppression assay, T cell
proliferation was measured by incorporation of [
3
H]thymi-
dine. As shown in Figure 2c, the dose-dependent suppression
activity of the CD8
+
T cells was confirmed. Furthermore, the
cultured CD8
+
T cells did not proliferate in response to anti-
CD3 and antigen presenting cell (APC) stimulation. This
anergic phenotype is consistent with the observation on
CD4
+
CD25
+
Treg cells [18,19]. Finally, the cultured CD8
+
cells
appeared to suppress better than freshly isolated CD4
+
CD25
+
Treg cells (Figure 2c; p < 10
-6
). The cultured CD4
+
T cells also
had some suppressive function at the high Tr/Tn ratio of 1:1,
while the suppressive activity for the cells gradually became
undetectable, suggesting that the suppressive activity of the
cultured CD8
+
T cells was much higher than the CD4
+
T cells
cultured under the same conditions (Figure 1c). Therefore,
most subsequent studies focused on the phenotype of the cul-
tured CD8
+
T cells.
Gene expression profiles of cultured CD8
+
T cells
To gain further insight into the phenotypes and functions of
the cultured CD8
+
and CD4
+
T cells, we carried out microar-
ray analyses using Affymetrix GeneChips that cover the whole
mouse transcriptome (>45,000 transcripts). Five independ-
ent cultures of CD8
+
T cells and three independent cultures of
CD4
+
T cells as well as two groups of control cells were
included in the microarray analysis. The first group of control
cells included two freshly isolated naïve CD8
+
T cells and the
second control group consisted of two CD8
+
T cells activated
by a low dose of soluble anti-CD3 and anti-CD28 (activation
protocol). Naïve CD8
+
T cells as well as activated CD8
+
T cells
do not possess suppression function. This data set was ana-
lyzed as described in Materials and methods and the results
are summarized in Table 1. As expected, the expression of
thousands of genes was changed by the expansion protocol
and the activation protocol compared to naïve CD8
+
T cells
(Figure 3). Surprisingly, over 100 genes were changed by >10-
fold and a few dozen genes were changed by 40- to 800-fold
in the cultured CD8
+
and CD4
+
T cells compared to naïve
CD8
+
T cells.
To elucidate the molecular basis of the function of the cul-
tured CD8
+
T cells, we functionally annotated the 314 genes
with >5-fold differences (including 113 genes with >10-fold
differences) between the cultured and naïve CD8
+
T cells
(Table 2). The largest group of differentially expressed genes
(17% for >5-fold difference and 31% for >10-fold difference)
is, as expected, involved in immunity and defense. The genes
with >10-fold differences are enriched by 6-fold compared to
the frequency of this functional group in the genome (p = 7.7
× 10
-15
). Other significantly enriched gene groups with con-
siderable interest include those involved in apoptosis, cell
cycle, cell proliferation and differentiation, and cell adhesion
(Table 2). Twenty-three cell cycle genes were upregulated by
>5-fold, including 11 genes that were upregulated by >10-fold
in the cultured CD8
+
T cells (Table 2). Twenty-one genes in
the cell proliferation and differentiation category were upreg-
ulated and twenty-five upregulated genes belong to the apop-
tosis group. A number of these genes were selected for
confirmation using a combination of real-time RT-PCR, flow
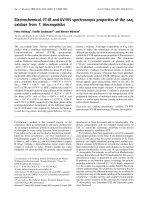
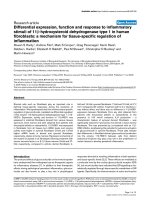
Surface marker expression of cultured CD8
+
T cellsFigure 1
Surface marker expression of cultured CD8
+
T cells. The expression profiles of CD8, CD4, CD25, CD62L, CD69, CD122, GITR and CTLA-4 were
analyzed by flow cytometory in the tenth day of culture for CD8
+
T cells.
M1
CD8
99.3%
M1
CD4
0.22%
M1
CD25
99.9%
M1
CD69
87.2%
M1
CD122
0.72%
M1
GITR
72.8%
M1
CTLA-4
2.28%
M1
CD62L
11.5%
Antibody staining
Isotype control
Genome Biology 2008, 9:R119
Genome Biology 2008, Volume 9, Issue 7, Article R119 Zhou et al. R119.4
cytometry and ELISA. All selected genes have been confirmed
and will be discussed in more detail later.
Up- and downregulation of transcription factors
The expression of a large number of transcription factors
(TFs) was changed in the CD8
+
and CD4
+
T cells cultured
using the expansion protocol (Table 3). Most of the differen-
tially expressed TF genes were upregulated, while a small
number were downregulated in the cultured cells. The
expression patterns of the TF genes share some similarity but
also have significant differences in the cultured CD8
+
, cul-
tured CD4
+
, activated CD8
+
T cells and naïve CD8
+
T cells.
Many of the TF genes still have unknown biological functions
and their roles in T cells have not been investigated. However,
several TF factors are known to be critical for the immune
system and may play a role in gaining suppressive function
Cultured CD8
+
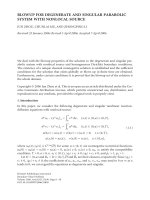
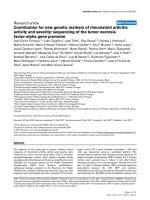
T cells suppress naïve T cell proliferationFigure 2
Cultured CD8
+
T cells suppress naïve T cell proliferation. (a) Dose-dependent suppression of CD4
+
CD25
-
responder T cells by cultured CD8
+
T cells.
CFSE-labeled CD4
+
CD25
-
naïve T cells (Tn) isolated from B6 spleens were stimulated with anti-CD3 (1.5 μg/ml) in the presence of irradiated splenic APCs
with graded numbers of cultured CD8
+
T cells (Tr). After 72 h in the culture, CFSE dilution in the responder CD4
+
T cells was analyzed by flow cytometry.
T cells in the M2 zone are undivided cells and T cells in the M3 zone with lower CFSE are divided cells. Data are representative of five independent
experiments. (b) Naïve CD4
+
CD25
-
splenic T cells were cultured in the same condition as shown in (a). The cultures were pulsed with 1 μCi/well
[
3
H]thymidine at 72 h and the level of proliferation was assessed by [
3
H]thymidine incorporation in the last 16 h of culture. (c) Cultured CD8
+
T cells
(NKT-like), freshly isolated CD4
+
CD25
+
Treg cells and cultured CD4
+
cells (cCD4) were compared for their ability to suppress the proliferation of
CD4
+
CD25
-
responder T cells. Data are presented as percentage of suppression based on the CFSE dilution with standard deviation. ANOVA test
suggests that the suppressive ability is significantly different between these cells (p < 10
-6
).
(a)
0
10,000
20,000
30,000
40,000
50,000
Tr/Tn
1
:
1
1
:
4
1
:
1
6
0
:
1
1
:
0
CPM
(b)
Tr:Tn
0:1
M1
M2
M3
CFSE
Tr:Tn
1:16
Tr:Tn
1:1
Tr:Tn
1:4
(c)
M1
M2
M3
M1
M2
M3
M1
M2
M3
Tr/Tn
1:1 1:4
1:16
NKT-like
nTreg
cCD4
% of suppression
0 102030400 102030400 102030400 10203040
10
0
10
1
10
2
10
3
10
4
10
0
10
1
10
2
10
3
10
4
10
0
10
1
10
2
10
3
10
4
10
0
10
1
10
2
10
3
10
4
120
100
80
60
40
20
0
-20
CountsCountsCountsCounts
Genome Biology 2008, Volume 9, Issue 7, Article R119 Zhou et al. R119.5
Genome Biology 2008, 9:R119
for the cultured CD8
+
T cells. The V-myc myelocytomatosis
viral related oncogene, neuroblastoma derived (Mycn) is
essential to cell proliferation and differentiation [20]. This
was the most upregulated TF gene (21-fold) in the cultured
CD8
+
T cells but not in cultured CD4
+
(2-fold) or activated
CD8
+
(1-fold) T cells (Table 3). RT-PCR analyses confirmed
the expression differences observed with the microarray anal-
ysis (Figure 4). This may be a key gene for the cultured CD8
+
T cell phenotype. The Eomesodermin homolog (Eomes) is a
T-box transcription factor that is highly homologous to T-bet.
Eomes and T-bet may have cooperative or redundant func-
tions in regulating the genes encoding IFN-γ and cytolitic
molecules in CD8
+
T cells [21], and determine the fate of
effector and memory CD8
+
T cells [22]. Furthermore, they are
responsible for inducing enhanced expression of Il2rb
(CD122) [22], a marker for some CD8
+
Treg cells [23]. Eomes
was upregulated four-fold in the cultured CD8
+
T cells while
it was downregulated five-fold in the cultured CD4
+
T cells
and was unchanged by our activation protocol (Table 3). The
upregulation of Eomes may be responsible for the increased
expression of IFN-γ, perforin, granzymes, CD122 and other
genes in cultured CD8
+
T cells. It could be a critical TF for the
suppressive function of the cultured CD8
+
T cells. Runt
related transcription factor 2 (Runx2) may be another critical
transcription factor. Runx2 was highly upregulated in the cul-
tured CD8
+
T cells (8.6-fold) and moderately upregulated in
the cultured CD4
+
(3.5-fold) and activated CD8
+
(1.8-fold) T
cells. Runx2 plays an important role in early T cell develop-
ment [24]. Over-expression of Runx2 increases the propor-
tion of single positive CD8
+
T cells [25]. Other potentially
important TFs include Litaf, Jun (AP1), Zbtb32 (Rog), Zfp608
and Rnf13, which had higher expression levels in the cultured
CD8
+
T cells than in the other three types of cells. The expres-
sion of Foxp3, which is an important TF for CD4
+
Treg cells,
was not detectable by RT-PCR (data not shown) in the CD8
+
T cells cultured under this condition.
The cultured CD8
+
T cells are CD8
+
NKT-like cells
Several genes encoding surface markers on NK cells were
highly upregulated in the cultured CD8
+
T cells (19-fold for
CD244, 13-fold for Ly49e, 4.4-fold for NK1.1, 8.0-fold for
NKG2A and 6-fold for NKG2D; Figure 5a) but not in the cul-
tured CD4
+
or activated CD8
+
T cells. To confirm these find-
ings, FACS analysis was carried out for a number of surface
markers. As already mentioned, these cultured cells remained
positive for CD8 (~99%) and negative for CD4 (Figure 1).
They were activated T cells as indicated by the high expres-
sion levels of CD25 and CD69 as well as the low expression
level of CD62L (Figure 1). Consistent with the low frequency
of NKT cells among naïve CD8
+
T cells, <1% of the CD8
+
T
cells were positive for these markers after three days of cul-
ture (Figure 5b), while the majority of the cells became posi-
tive for NK1.1 and CD244 after about 10 days of culture. The
percentages of cells positive for the NK markers may vary
from culture to culture. By day 10-13, 75-95% of the cells were
normally positive for NK1.1 and CD244. NKG2A was upregu-
lated by 8-fold in the cultured CD8
+
T cells according to the
microarray data (Figure 5a) and 25-30% of the cultured CD8
+
T cells stained positive for NKG2A. Although CD94 and DX5
were not upregulated in the cultured CD8
+
NKT-like cells
according to the microarray data (Figure 5a), FACS analyses
indicated that 15-30% of the cultured CD8
+
T cells were posi-
tive for these NK markers. It is unclear if these discrepancies
are due to an imperfect correlation between gene and protein
expression. Since the vast majority of the cultured CD8
+
T
cells expressed NK markers, the cultured CD8
+
T cells had
similar phenotypes to NKT cells, which are defined as cells
expressing both T cell and NK cell markers. Furthermore,
these cells were negative for the α-galactosylceramide-loaded
Cd1d tetramer (data not shown), suggesting that they were
not Cd1d-restricted iNKT cells. It is unclear at this time what
the source of these cultured CD8
+
NKT-like cells was. As the
CD8
+
NKT-like cell precursors in the total CD8
+
T cell pool
were very rare, we believe that the cultured CD8
+
NKT-like
cells were probably expanded from the conventional CD8
+
T
cells, which acquired NK markers during the expansion.
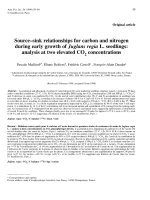
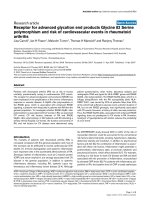
Heat map for genes differentially expressed among the four groups of T cellsFigure 3
Heat map for genes differentially expressed among the four groups of T
cells. Only those genes with a FDR (q) ≤0.01 and fold change ≥5 are
included in this map. Data for each gene are standardized separately
before being plotted, as is standard in drawing heat maps, so that all genes
have a similar scale and the relative differences for all genes can be
visualized on a single plot.
-2
CD8 NKT-like
cCD4: cultured CD4
+
nCD8: naïve CD8
+
aCD8: activated CD8
+
cCD4 nCD8 aCD8
02
Genome Biology 2008, 9:R119
Genome Biology 2008, Volume 9, Issue 7, Article R119 Zhou et al. R119.6
According to a recent classification of NKT cells [7], these cul-
tured cells belong to the CD8
+
NKT-like category of NKT cells.
Upregulation of secreted molecules with potential
suppression functions
Using the 318 genes that are upregulated by >5-fold in the
cultured CD8
+
NKT-like cells, we established molecular net-
works to understand the functional relationships of the genes
upregulated in the CD8
+
NKT-like cells. The largest network
consists of genes involved in immunity and defense (Figure
6). This network highlights the importance of two central
nodes: IL-10 and IFN-γ. Upon stimulation by anti-CD3/CD28
and IL-2, IL-10 and IFN-γ are highly upregulated (by 47- and
51-fold, respectively; Table 4). These proteins and pathways
are known to influence the expression of many genes involved
in immune responses, including those encoding the activa-
tion marker IL-2 receptor (Il2ra, or CD25), granzymes, the
tumor necrosis factor (TNF) family genes, cytokines, chemok-
ines and their receptors. Many of these genes are significantly
upregulated in the CD8
+
NKT-like cells (Tables 4 and 5). To
confirm the microarray data, we used ELISA to measure the
levels of secreted cytokines in the culture medium of CD8
+
NKT-like cells and natural CD4
+
CD25
+
Treg cells stimulated
by anti-CD3 and APC (Figure 7a). Consistent with the micro-
array data, the cultured CD8
+
NKT-like cells secreted more
IL-10 and IFN-γ but a similar level of IL-4 when compared to
fresh CD4
+
CD25
+
Treg cells (Figure 7a). The secretion of IFN-
γ was particularly high in the CD8
+
NKT-like cells. The
expression of IFN-γ and lack of expression of IL-4 are also
consistent with the observation on other NKT-like cells [7].
IL-10 and IFN-γ are immunosuppressive cytokines known to
be involved in the suppressive function of CD4
+
Treg cells and
may contribute to the suppressive function of the expanded
CD8
+
NKT-like cells. Transforming growth factor (TGF)-β is
another important immunosuppressive cytokine that might
be important for the suppressive function of the CD8
+
NKT-
Table 1
Summary of differentially expressed genes*
Fold change NKT/nCD8 cCD4/nCD8 aCD8/nCD8 NKT/cCD4 NKT/aCD8 cCD4/aCD8
>10 fold up 113 126 40 26 64 36
5-10 fold up 201 300 27 46 67 47
2-5 fold up 1,742 1,647 3 161 190 47
2-5 fold down 681 693 6 243 76 4
5-10 fold down 100 100 35 59 24 15
>10 fold down 56 59 36 32 15 9
*Only those genes with q-values <0.01 are included in this table. NKT, CD8
+
NKT-like cells; nCD8, naïve CD8
+
T cells; cCD4, cultured CD4
+
T cells;
aCD8, activated CD8
+
T cells.
Table 2
Major biological processes modified in the cultured CD8
+
NKT-like cells
≥5 fold (314) ≥10 fold (113)
Biological process Number of genes % genes p-value OR Number of genes % genes p-value OR
Immunity and defense 56 17.80% 2.0E-11 3.1 35 31.00% 7.7E-15 6.3
Apoptosis 25 8.00% 8.8E-10 4.8 19 16.80% 2.2E-13 11.3
Lipid, fatty acid metabolism 25 8.00% 7.5E-06 2.9 6 5.30% 0.1161 1.9
Signal transduction 74 23.60% 3.4E-05 1.8 28 24.80% 0.0041 1.9
Cell structure and motility 25 8.00% 0.0004 2.2 11 9.70% 0.0036 2.8
Cell cycle 23 7.30% 0.0004 2.3 11 9.70% 0.0015 3.1
Oncogenesis 14 4.50% 0.0005 3.0 8 7.10% 0.0004 4.9
Protein metabolism and modification 60 19.10% 0.0009 1.6 23 20.40% 0.0152 1.8
Cell proliferation and differentiation 21 6.70% 0.0023 2.1 13 11.50% 0.0001 3.8
Carbohydrate metabolism 14 4.50% 0.0053 2.3 2 1.80% 0.6720 0.9
Sulfur metabolism 5 1.60% 0.0059 4.6 0
Other metabolism 13 4.10% 0.0159 2.0 6 5.30% 0.0319 2.6
Cell adhesion 12 3.80% 0.0528 1.7 6 5.30% 0.0424 2.5
Others 176 56.10% 53 24.80%
OR, odds ratio.
Genome Biology 2008, Volume 9, Issue 7, Article R119 Zhou et al. R119.7
Genome Biology 2008, 9:R119
like cells. Our microarray and RT-PCR data (Figure 4) indi-
cate that the TGF-β mRNA level was about two-fold higher in
CD8
+
NKT-like cells compared to naïve CD8
+
cells. As TGF-β
cannot be accurately measured from serum-containing cul-
ture medium, we performed blocking experiments using an
anti-TGF-β antibody to assess the role of TGF-β. Our results
(Figure S1 in Additional data file 1) indicate that TGF-β block-
ade cannot block the suppression function of the CD8
+
NKT-
like cells.
A number of other secreted molecules were also highly upreg-
ulated in the CD8
+
NKT-like cells based on the microarray
data (Table 4). Many of these secreted molecules are known
to have immunosuppressive function or potentially contrib-
ute to the suppression function. Perforin (Prf1) and
granzymes are among the most noticeable. Perforin and
granzyme expression is regulated by IFN-γ (Figure 6). Both
natural and adaptive CD4
+
CD25
+
Treg cells in human display
perforin-dependent cytotoxicity against autologous target
cells, suggesting that the perforin/granzyme pathway is one
of the mechanisms that Treg cells can use to control immune
responses [26]. Prf1 was upregulated by 29-fold in the CD8
+
NKT-like cells (with potent suppression activity; Table 4), but
unchanged in cultured CD4
+
cells (with weak suppression
activity) and activated CD8
+
T cells (without suppression
activity). Several granzymes were highly upregulated (834-,
535-, 446-, 329-, 105-, 63-, 61- and 23-fold for granzymes D,
E, C, G, B, F, K and A, respectively). These molecules were
generally upregulated to a much lesser degree in the cultured
CD4
+
T cells and were unchanged in activated CD8
+
T cells
(except Gzmk). The large expression differences for Prf1 and
selected granzymes were confirmed using RT-PCR (Figure 4).
Several secreted molecules can potentially be implicated in
the immunosuppressive function. The most noticeable
include Esm1, Spp1, Fgl2, Tnfrsf11b, Lgals3, Lgals1, and IL-24
(Table 4). Esm1 (endothelial cell-specific molecule 1) was
upregulated in the CD8
+
NKT-like cells by 75-fold and was
only slightly increased in the cultured CD4
+
T cells (2.8-fold)
and was unchanged in the activated CD8
+
T cells. The expres-
sion pattern was confirmed by RT-PCR (Figure 4). Esm1 is a
proteoglycan mainly secreted by endothelial cells under the
control of inflammatory cytokine. It binds to LFA-1 integrin
on the surface of lymphocytes and monocytes [27] and there-
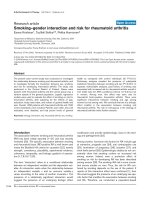
RT-PCR analysis of selected genes in four cell groupsFigure 4
RT-PCR analysis of selected genes in four cell groups. Quantitative RT-PCR was performed in duplicate using cDNA (equivalent of 10 ng total RNA) and
already-developed TaqMan gene expression assays (Applied Biosystems) on the ABI 7900 HT Fast Real-Time PCR System. Data were normalized based on
18srRNA and GAPDH expression. The mean expression level for naïve CD8
+
T cells was artificially scaled to one for each tested gene. Data are
presented as mean ± standard deviation.
Perforin
Perforin
NKT
nCD8
cCD4
aCD8
FasL
GrazA
NKT
nCD8
cCD4
aCD8
GrazB
TGFβ-1
GrazC
MYCN
Runx2
Spp1
Cgals3
Eomes
Esm1
Tnfrs11b
Icos
Fgl2
CD137
FasL
Tnfrs11b
Esm1
30
20
10
0
30,000
20,000
10,000
0
2,000
1,000
0
2,000
1,000
0
15
10
5
0
Fgl2
Eomes
6
4
2
0
4
2
0
TGFβ-1
100
50
0
GrazA
600
400
200
0
MYCN
60
40
20
0
Spp1
100,000
50,000
0
CD137
100
50
0
Icos
10
5
0
Cgals3
150
100
50
0
Runx2
6
4
2
0
GrazB
1,500
1,000
500
0
NKT
nCD8
cCD4
aCD8
NKT
nCD8
cCD4
aCD8
NKT
nCD8
cCD4
aCD8
NKT
nCD8
cCD4
aCD8
NKT
nCD8
cCD4
aCD8
NKT
nCD8
cCD4
aCD8
NKT
nCD8
cCD4
aCD8
NKT
nCD8
cCD4
aCD8
NKT
nCD8
cCD4
aCD8
NKT
nCD8
cCD4
aCD8
NKT
nCD8
cCD4
aCD8
NKT
nCD8
cCD4
aCD8
NKT
nCD8
cCD4
aCD8
NKT
nCD8
cCD4
aCD8
GrazC
Genome Biology 2008, 9:R119
Genome Biology 2008, Volume 9, Issue 7, Article R119 Zhou et al. R119.8
fore inhibits the binding of intercellular adhesion molecules
(ICAMs) to LFA-1 and influences leukocyte adhesion and
activation. Spp1 (secreted phosphoprotein 1) is better known
as osteopondin. In addition to its well known function in bone
formation, it functions as a cytokine and chemokine to regu-
late cell-cell and cell-tissue interaction. Much less well known
is its function in suppressing T cells and activating B cells
[28]. Osteopondin is believed to be the most abundant
protein secreted by activated T cells, which is consistent with
our microarray data (7.4-fold higher expression in activated
CD8
+
T cells versus naïve T cells). Osteopondin was
upregulated by 252-fold in the CD8
+
NKT-like cells and 204-
fold in the cultured CD4
+
T cells based on the microarray data
(Table 4). Based on the RT-PCR data, Osteopondin (Spp1)
was greatly increased (by 25,000-fold) in the CD8
+
NKT-like
cells compared to the naïve CD8
+
T cells (Figure 4). It is pos-
sible that Osteopondin contributed to the suppression activ-
ity of both the CD8
+
and CD4
+
T cells cultured using our
protocol. Tnfrsf11b, also known as Osteoprotegerin (Opg), is
a member of the TNF receptor superfamily. Opg is a decoy
receptor of RANKL and inhibits the binding of RANKL
(Receptor activator for nuclear factor κB ligand) to its recep-
tor RANK. Opg is secreted as a disulfide-linked homodimer
[29]. Opg can inhibit the inflammatory effect of RANKL
secreted by activated T cells [30,31] and RANKL blockade can
significantly prolong heart allograft survival [32]. Opg was
upregulated by 29-fold in the CD8
+
NKT-like cells and
unchanged in the cultured CD4
+
and activated CD8
+
T cells.
The expression changes were also confirmed by RT-PCR (Fig-
ure 4). Fgl2 (Fibrinogen-like protein 2) is a member of the
fibrinogen-related protein superfamily. In addition to its well
established role in triggering thrombosis, it is known to be
secreted by T cells under the control of IFN-γ [33]. Fgl2 has
been shown to exhibit immunomodulatory properties capa-
ble of inhibiting dendritic cells (DC) maturation and T cell
proliferation stimulated by alloantigens or anti-CD3/anti-
CD28 antibodies in a dose-dependent manner [34]. Fgl2 was
upregulated by 33-fold in the CD8
+
NKT-like cells but was
unchanged in the cultured CD4
+
and activated CD8
+
T cells.
Thus, Fgl2 could be a critical factor for the suppression mech-
Table 3
Transcription factors differentially expressed in CD8
+
NKT-like cells
Symbol Function NKT/nCD8 CD4/nCD8 aCD8/nCD8 NKT/nCD8 (q) CD4/nCD8 (q) aCD8/nCD8 (q)
Nfil3 NF 19.7 22.3 4.3 4.0E-04 3.6E-04 3.4E-02
Mycn (Nmyc1) TF 20.8 2.2 1.1 8.0E-05 2.7E-02 6.8E-01
Irf8 (Icsbp1) TF 14.4 1.9 19.2 1.7E-04 3.2E-02 3.7E-03
Irf4 TF 4.7 24.7 18.2 1.6E-03 4.7E-05 6.2E-03
Litaf TF 10.3 5.0 4.8 4.5E-05 1.4E-04 1.6E-02
Runx2 TF 8.6 3.5 1.8 2.2E-04 5.2E-02 3.4E-01
Pbx3 TF 5.8 6.2 1.6 4.1E-04 4.8E-04 3.6E-01
Jun (AP1) TF 5.8 2.9 2.6 8.9E-04 8.8E-02 1.2E-01
Cgrrf1 TF 4.9 4.9 2.8 2.2E-04 2.7E-03 7.7E-02
Eomes TF 4.0 0.2 0.6 9.7E-04 3.8E-04 4.5E-01
Atf4 TF 3.8 2.0 3.1 6.4E-03 3.1E-03 2.0E-02
Zbtb32 (Rog) TF (ZF) 9.3 1.8 3.9 1.2E-03 3.9E-02 1.6E-02
Zdhhc2 TF (ZF) 4.9 2.6 1.5 9.3E-04 1.5E-03 4.6E-01
Zfp313 TF (ZF) 4.3 2.2 1.2 1.9E-02 6.6E-03 6.8E-01
Zfp608 TF (ZF) 3.9 1.2 1.7 4.2E-04 1.1E-01 1.3E-01
Rnf128 TF (RF) 6.2 10.4 1.0 5.8E-04 7.8E-04 8.0E-01
Rnf13 TF (RF) 4.0 1.7 1.2 8.5E-04 7.3E-02 7.0E-01
Socs2 Suppressor 48.6 104.0 27.8 3.5E-05 3.3E-05 3.9E-03
Cish (Socs) Suppressor 8.8 9.5 4.9 1.2E-04 5.2E-05 1.3E-02
Tcf7 TF 0.012 0.061 0.274 5.7E-07 1.4E-03 7.7E-02
Klf3 TF (KR) 0.012 0.014 0.034 9.4E-08 5.9E-06 8.1E-03
Klf2 TF (KR) 0.04 0.03 0.01 4.3E-04 5.5E-04 2.7E-03
Klf1 TF (KR) 0.05 0.05 0.06 3.5E-05 1.7E-04 1.0E-02
Rkhd3 TF (RF) 0.15 0.17 0.16 1.1E-04 1.7E-04 9.1E-03
Bcl11a TF (ZF) 0.15 0.16 0.15 2.4E-04 1.1E-03 2.3E-02
Zbtb20 TF (ZF) 0.20 0.15 0.16 1.2E-04 3.2E-04 6.3E-03
NKT, CD8
+
NKT-like cells; nCD8, naïve CD8
+
T cells; cCD4, cultured CD4
+
T cells; aCD8, activated CD8
+
T cells. KR, Kruppel-like factor; NF,
nuclear factor; RF, ring finger; TF, transcription factor; ZF, zinc finger. The table is split into two parts based on the expression ratio of NKT/nCD8.
Genome Biology 2008, Volume 9, Issue 7, Article R119 Zhou et al. R119.9
Genome Biology 2008, 9:R119
anism of the CD8
+
NKT-like cells. Lgals3 and Lgals1, also
known as Galectin (Gal)-3 and Gal1, are members of the beta-
galactoside-binding gene family. They are multifunctional
proteins implicated in a variety of biological functions,
including tumor cell adhesion, proliferation, differentiation,
angiogenesis, cancer progression and metastasis. It was
recently shown that Gal3 secreted by tumor cells induces T
cell apoptosis [35]. The expression of Gal3 has been positively
correlated with the level of apoptosis of tumor-associated
lymphocytes [36]. Treatment with the Gal3 gene is also ben-
eficial against asthma in mice [37]. Finally, IL-24 is a member
of the IL-10 family of cytokines [38]. Over-expression of IL-
24 induces apoptosis in cancer cells [39]. Therefore, IL-24
appears to be an immunosuppressive cytokine.
Cultured CD8
+
NKT-like cells upregulate many
suppressive surface markers
A large number of surface molecules were highly upregulated
in the CD8
+
NKT-like cells, while a few surface molecules
were down regulated (Table 5). Many of the upregulated mol-
ecules have been implicated in immunosuppressive function.
Most notably, many of the genes are related to IFN-γ and
some belong to the TNF family receptors and ligands. The
expression patterns for these genes are clearly different
among the cells cultured under different conditions or differ-
ent cell types cultured under the same condition. The overall
pattern seems to correlate well with their cellular functions.
The genes already implicated in suppressive function or hav-
ing suppressive potential were highly upregulated in the
CD8
+
NKT-like cells, which have potent suppression activity,
while these genes were only moderately upregulated or
unchanged in the cultured CD4
+
T cells and activated CD8
+
T
cells, which have only weak or no suppression activity.
Ifitm1 (Interferon induced transmembrane protein 1) is the
most upregulated surface molecule in the CD8
+
NKT-like cells
(90-fold increase compared to naïve CD8
+
T cells; Table 5).
This gene is not upregulated by the conventional activation
Expression of NK cell markersFigure 5
Expression of NK cell markers. (a) Summary of microarray data for NK cell markers. Ratios of expression values and FDR (q) values are presented. (b)
NK cell marker expression on the surface of cultured CD8
+
NKT-like cells.
Symbol
NKT/
nCD8
cCD4/
nCD8
aCD8/
nCD8
NKT/ nCD8
(Q)
cCD4/
nCD8 (Q)
aCD8/ nCD8
(Q)
Cd244 18.9 0.8 0.8 1.1E-04 4.6E-02 4.4E-01
Klra5 (Ly49e) 13.2 0.7 0.8 3.0E-02 5.4E-02 6.1E-01
Klrc1 (NKG2A) 8.0 0.3 1.4 2.2E-02 1.2E-02 5.5E-01
Klrb1c (NK1.1) 4.4 0.7 0.8 3.7E-04 5.8E-02 4.0E-01
Klrk1 (NKG2D) 6.0 0.7
1.9 2.2E-02
7.0E-02 9.9E-02
Klrd1 (CD94) 1.0
0.02
0.08
3.4E-01 1.1E-04 1.0E-02
Itga2 (DX5) 0.9 1.0 1.0 1.7E-01 3.4E-01
8.2E-01
(a)
cCD4:cultured CD4
+
nCD8:naïve CD8
+
aCD8:activated CD8
+
Day 3
Day 10
(b)
CD8
CD8
032105B6CD83d.012
0.460.36
0.30
0.34
0.04
0.340.10
0.56
0.08
NKG2A
NK1.1 CD94 DX5CD244
0.16
69.138.22
75.17
20.41
0.84
16.26
0.63 16.130.54
8.18
Genome Biology 2008, 9:R119
Genome Biology 2008, Volume 9, Issue 7, Article R119 Zhou et al. R119.10
protocol and upregulated to a much lesser degree in the cul-
tured CD4
+
T cells. Ifitm1 has been shown to be a key mole-
cule in the anti-proliferative function of IFN-γ [40]. Two
other interferon-induced transmembrane genes (Ifitm2 and
Ifitm3) were also highly upregulated in the CD8
+
NKT-like
cells (45- and 24-fold, respectively). It is highly likely that
these proteins are involved in the suppressive function of the
CD8
+
NKT-like cells.
Lilrb4 (Leukocyte immunoglobulin-like receptor, subfamily
B, member 4) is a member of the leukocyte immunoglobulin-
like receptor (LIR) family. The encoded protein belongs to the
subfamily B class of LIR receptors with a transmembrane
domain, extracellular immunoglobulin domains, and cyto-
plasmic immunoreceptor tyrosine-based inhibitory motifs.
The receptor expressed on immune cells binds to MHC class
I molecules on antigen-presenting cells and transduces a neg-
ative signal that inhibits stimulation of an immune response.
The receptor can also function in antigen capture and presen-
tation. It may be involved in controlling inflammatory
responses and cytotoxicity to help focus the immune response
and limit autoreactivity. This gene was highly upregulated in
both the CD8
+
NKT-like cells and cultured CD4
+
T cells.
Havcr2 (Hepatitis A virus cellular receptor 2), more com-
monly known as Tim3, was upregulated by 36-fold in the
CD8
+
NKT-like cells and 5-fold in the cultured CD4
+
T cells
compared to naïve CD8
+
T cells. Tim3
-/-
mice have
exacerbated diabetes due partly to a defect in CD4
+
CD25
+
Treg cell function [41]. Therefore, Tim3 may be important for
CD8
+
NKT-like cell suppression function. Tnfrsf9, also
known as 4-1BB and CD137, was highly upregulated in the
CD8
+
NKT-like cells (30-fold) and only slightly upregulated
in the cultured CD4
+
T cells (5-fold). 4-1BB is a costimulatory
molecule that may be very important for Treg cell function. 4-
1BB-primed CD8
+
T cells possess suppressive function [42]
and an agonist monoclonal antibody specific for 4-1BB can
mitigate autoimmunity [43-47]. 4-1BB
-/-
mice exhibit
Molecular network for the highly upregulated immunity and defense genesFigure 6
Molecular network for the highly upregulated immunity and defense genes. The network was created by extracting the direct interactions between these
genes from the literature. Three types of relationship are shown in the pathway, binding, expression and regulation. Binding refers to physical interactions
between molecules. Expression indicates that the regulator changes the protein level of the target by means of regulating its gene expression or protein
stability. Regulation indicates that the regulator changes the activity of the target; the mechanism of the regulation is either unknown or has not been
specified in the sentence describing the relationship. This network highlights the importance of two key nodes, IFN-γ and IL-10, which regulate many genes
in this network. These genes are also critical for the immunosuppressive function of the CD8
+
NKT-like cells.
Expression
Regulation
Binding
Direct regulation
Genome Biology 2008, Volume 9, Issue 7, Article R119 Zhou et al. R119.11
Genome Biology 2008, 9:R119
enhanced T cell proliferation [48]. GITR (Tnfrsf18) is an
important molecule for CD4
+
Treg cell function. GITR was
upregulated 5-fold in the CD8
+
NKT-like cells and 10-fold in
the cultured CD4
+
T cells. Clearly, GITR could contribute to
the suppressive function of both CD4
+
and CD8
+
Treg cells.
Other upregulated costimulatory molecules, such as Pdcd1
(5.6-fold), PDL2 (4.6-fold) and Icos (4.3-fold), Ctla4 (5-fold)
and CD28 (3.9-fold), may be good candidate molecules
involved in the suppressive function. CD24a is one of the few
costimulatory molecules that was downregulated in the CD8
+
NKT-like cells (0.03-fold) but unchanged in the cultured
CD4
+
T cells (1.2-fold).
Genes for several TNF family proteins, such as Fas-L,
RANKL, TRAIL and OX40, were all upregulated in the CD8
+
NKT-like cells and the cultured CD4
+
T cells. All these mole-
cules could be implicated in the suppression function. Fas-L
expression was 25-fold higher in the CD8
+
NKT-like cells
compared to naïve CD8
+
T cells while CD4
+
T cells cultured in
the same condition did not upregulate Fas-L. Fas/Fas-L is
one of the two pathways of lymphocyte-mediated cell killing
[49].
Several lymphocyte receptors were upregulated - Gpr105 (65-
fold), Ptger3 (13.1-fold), Ptger2 (4.3-fold), Fcer1g (13.7-fold) -
and a few other receptors were downregulated by the expan-
sion protocol (Table 4). Prostaglandin E receptor 3 (subtype
EP3; Ptger3) may have pro-inflammatory or anti-inflamma-
tory properties depending on the physiological condition
[50]. EP2, EP3 and EP4 receptors have been shown to be
important for the immunosuppressive function of PGE2 [51].
Cytokine and chemokine receptors were up- or downregu-
lated by the expansion protocol (Table 5). Notably, Il2ra
(CD25) was highly upregulated in the CD8
+
NKT-like and cul-
tured CD4
+
T cells as well as activated CD8
+
T cells. These
expected results were confirmed by FACS analysis (Figure 1).
Ccr5 and Ccr2 were highly upregulated in the CD8
+
NKT-like
cells but unchanged or slightly upregulated in the cultured
CD4
+
T cells and activated CD8
+
T cells. Ccr5 has been shown
to be important for the suppression function of CD4
+
CD25
+
T
cells [52]. CCR5 and several other CCR members (CCR2)
were highly upregulated in the CD8
+
NKT-like cells (Table 3)
and they should be excellent candidate molecules for further
studies.
A large number of adhesion molecules were highly upregu-
lated in the CD8
+
NKT-like cells and only slightly upregu-
lated/unchanged or even decreased in the cultured CD4
+
T
cells (Table 5). Several of these genes (Tjp1, Emilin2, Nov)
were confirmed by RT-PCR (Figure 4) and Sell (CD62L) was
confirmed by FACS analysis (Figure 1).
IL-10 and IFN-γ are two key pathways for the
conversion and function of the CD8
+
NKT-like cells
Immunosuppressive cytokines can enhance the suppressive
activity of Treg cells. For example, naturally occurring
CD4
+
CD25
+
Treg cells use a combination of IL-10 and TGF-β
to suppress immune responses [53-57]. As IL-10 and IFN-γ
are two key nodes of the molecular network modified in the
CD8
+
NKT-like cells (Figure 6), we further tested their role in
the function and generation of these cells using two different
approaches. First, an anti-IL-10 antibody was used in the sup-
pression assay to determine whether IL-10 neutralization
could block or reduce the suppression function of the CD8
+
NKT-like cells. Blockade using anti-IL-10 could slightly
reduce the suppression but could not completely block the
suppressive function of the CD8
+
NKT-like cells (data not
shown). Since the levels of IL-10 and IFN-γ secreted by the
CD8
+
NKT-like cells was very high, antibody blocking may
not have been efficient. Furthermore, the antibody blockade
experiment evaluated only the role of these cytokines in the
suppression function but did not allow us to assess the role of
these molecules in the generation of the CD8
+
NKT-like cells.
Therefore, we tested the potential roles of IL-10 and IFN-γ in
The role of IL-10 and IFN-γ in the generation and function of the CD8
+
NKT-like cellsFigure 7
The role of IL-10 and IFN-γ in the generation and function of the CD8
+
NKT-like cells. (a) Cytokine levels in the cell culture media. Cultured
CD8
+
NKT-like cells and freshly isolated CD4
+
CD25
+
Treg cells were
stimulated with anti-CD3 (1.5 μg/ml) and splenic APCs. At 72 h of
culturing, the culture supernatant was saved and used for measuring IL-10,
IL-4 and IFN-γ using ELISA. Results are representative of two independent
experiments. (b) Suppression activity of CD8
+
NKT-like cells cultured
from IFN-γ
-/-
and IL-10
-/-
mice. CD8
+
NKT-like cells (Tr) cultured from
knockout mice and wild-type B6 (WT) mice were co-cultured with naïve
CD4
+
CD25
-
responder T cells (Tn) at different Tr/Tn ratios in the
presence of splenic APCs and anti-CD3. The cultures were pulsed with 1
μCi/well of [
3
H]thymidine at 72 h and proliferation (cpm) was measured
by [
3
H]thymidine incorporation in the last 16 h. Results are expressed as
the mean of triplicate cultures. ANOVA p-values are <0.0004 for IFN-γ
-/-
and 0.001 for IL-10
-/-
when compared to wild-type mice. Error bars are
standard deviation.
(a)
CD8
+
NKT-like
CD4
+
CD25
+
Tregs
IL-10
IFN-γ
0
200
400
600
800
1,000
1,200
1,400
0
2,000
4,000
6,000
8,000
10,000
0
5
10
15
20
25
30
IL-4
pg/ml
1:4
1:16
1:1
1:4
1:16
1:1
1:4
1:16
1:1
CPM
Tr:Tn
0:1
0
10,000
20,000
30,000
40,000
(b)
WT
IL-10
-/-
IFN-γ
-/-
Genome Biology 2008, 9:R119
Genome Biology 2008, Volume 9, Issue 7, Article R119 Zhou et al. R119.12
CD8
+
NKT-like function/generation using IL-10
-/-
and
IFN-γ
-/-
mice. CD8
+
NKT-like cells can be cultured using
naïve CD8
+
T cells from both knockout mice; however, at the
later stages of culture, the viability of cells from IFN-γ
-/-
mice
is not as good as those from wild-type mice and IL-10
-/-
mice.
Addition of IFN-γ in the culture medium can improve the via-
bility of the cultured cells (Figure S2 in Additional data file 1).
Although the CD8
+
NKT-like cells cultured from both knock-
out mice had good suppressive activity at a high ratio (Tr/Tn
= 1:1) of suppressor (CD8
+
NKT-like) to responder (naïve
CD4
+
T cells), the reduction in suppressive activity for the
CD8
+
NKT-like cells cultured with naïve CD8
+
T cells from
both knockout mice became very clear at lower suppressor to
responder T cell ratios (Figure 7b), which provides a more
accurate estimate of the suppressive activity. At the 1:16 Tr/
Tn ratio, the suppressive activity of CD8
+
NKT-like cells cul-
tured from IL-10
-/-
mice was reduced to 30-35% of that for
CD8
+
NKT-like cells cultured from wild-type B6 mice (Figure
7b), suggesting that the vast majority of the suppressive activ-
ity of the CD8
+
NKT-like cells can be attributed to the IL-10
pathway. Similarly, almost 50% of the CD8
+
NKT-like sup-
pression could be attributed to the IFN-γ pathway (Figure 7b).
These results together suggest that IL-10 and IFN-γ play an
important role in the in vitro generation and function of CD8
+
NKT-like cells.
Discussion
Naïve CD8
+
T cells cultured with anti-CD3/anti-CD28-coated
beads in the presence of a high concentration of IL-2 can gen-
erate CD8
+
NKT-like cells. This highly efficient culture system
can produce large numbers of CD8
+
NKT-like cells. The cul-
tured CD8
+
NKT-like cells can potently suppress the prolifer-
ation of responder T cells. In this study, we extensively
characterized the molecular mechanisms underlying the sup-
pression function of the cultured CD8
+
NKT-like cells using a
variety of techniques. We first compared the gene expression
profiles of four different cells with different phenotypes with
regard to suppression function. The CD8
+
NKT-like cells cul-
tured with the expansion protocol were highly potent sup-
pressor cells (Figure 2). The suppressive activity of these
NKT-like cells was actually much more potent than that of
natural CD4
+
CD25
+
Treg cells, which are known to be highly
suppressive. To identify candidate genes that might be related
to the suppressive activity, the CD8
+
NKT-like cells with
potent suppressive activity were compared to three different
control cells: CD4
+
T cells (with very weak suppression) cul-
tured under the same conditions as a control for culture con-
dition; naïve CD8 T cells as the baseline expression level; and
CD8
+
T cells activated using conventional activation proto-
cols. The last two cell populations do not possess suppressive
activity. This data set allows us to examine a number of differ-
Table 4
Expression of genes encoding secreted molecules with potential suppressive function
Symbol Function NKT/nCD8 CD4/nCD8 aCD8/nCD8 NKT/nCD8 (q) CD4/nCD8 (q) aCD8/nCD8 (q)
Spp1 Suppression 251.4 203.8 7.4 9.9E-06 2.6E-06 1.2E-02
Lgals3 (Gal3) Suppression 87.0 38.5 3.1 2.6E-07 1.7E-04 4.9E-02
Esm1 Suppression 74.5 2.8 1.2 4.2E-04 2.2E-02 5.8E-01
Fgl2 Suppression 32.7 0.9 0.9 9.2E-05 3.0E-01 6.3E-01
Tnfrsf11b (Opg) Suppression 29.0 1.1 1.1 2.4E-04 3.0E-01 7.0E-01
Lgals1 (Gal1) Suppression 27.1 22.3 6.0 1.4E-04 7.8E-04 6.1E-02
Gzmd Killing 834.8 25.8 1.1 2.1E-07 1.0E-02 6.6E-01
Gzme Killing 524.9 27.3 0.9 2.3E-06 6.8E-03 6.4E-01
Gzmc Killing 446.4 25.7 2.1 2.7E-07 3.3E-02 1.8E-01
Gzmg Killing 328.8 5.5 1.0 1.2E-05 1.8E-02 8.0E-01
Gzmb Killing 104.6 60.2 85.6 2.2E-06 2.4E-04 2.8E-03
Gzmf Killing 63.5 1.8 1.3 6.9E-04 9.4E-03 4.1E-01
Gzma Killing 61.5 17.1 0.4 1.2E-05 6.8E-03 1.2E-01
Prf1 Killing 29.0 1.0 1.7 4.4E-04 4.1E-01 2.8E-01
Gzmk Killing 23.3 0.5 0.6 1.5E-04 1.7E-02 2.7E-01
Ifng Cytokine 51.2 50.3 258.7 3.3E-03 1.5E-02 8.2E-04
Il10 Cytokine 47.2 122.8 2.1 1.8E-03 1.6E-05 4.0E-02
Il24 Cytokine 5.5 33.0 1.0 5.1E-02 3.5E-04 8.1E-01
Lta Cytokine 3.9 5.1 27.8 3.1E-03 2.2E-04 2.7E-03
Ccl3 Chemokine 86.2 162.4 177.9 3.4E-04 1.2E-03 1.3E-03
Ccl4 Chemokine 25.5 20.8 18.7 6.6E-04 3.5E-03 4.1E-03
Ccl9 Chemokine 11.3 53.7 4.4 1.5E-02 5.2E-04 4.5E-02
Cklfsf7 Chemokine 4.7 1.2 0.9 3.4E-03 1.8E-01 7.1E-01
NKT, CD8
+
NKT-like cells; nCD8, naïve CD8
+
T cells; cCD4, cultured CD4
+
T cells; aCD8, activated CD8
+
T cells.
Genome Biology 2008, Volume 9, Issue 7, Article R119 Zhou et al. R119.13
Genome Biology 2008, 9:R119
Table 5
Gene expression levels for genes encoding critical surface markers
Symbol Function NKT/nCD8 CD4/nCD8 aCD8/nCD8 NKT/nCD8 (q) CD4/nCD8 (q) aCD8/nCD8 (q)
Ifitm1 Suppression 89.9 7.1 1.5 2.8E-07 2.2E-03 2.4E-01
Lilrb4 (ILT3) Suppression 50.3 43.8 7.6 3.6E-04 4.0E-05 5.6E-03
Ifitm2 Suppression 45.6 11.4 1.6 6.0E-07 2.1E-03 2.8E-01
Havcr2 (Tim3) Suppression 36.5 10.4 0.7 1.6E-04 2.0E-03 2.4E-01
Tnfrsf9 (4-1BB) Suppression 28.2 12.5 12.8 2.4E-04 3.2E-03 1.1E-02
Tnfsf6 (FASL) Suppression 24.4 4.3 3.2 1.2E-05 6.1E-02 4.5E-02
Ifitm3 Suppression 24.3 15.6 0.8 2.5E-05 1.4E-03 6.6E-01
Ctla4 Suppression 5.3 18.7 21.5 2.8E-03 4.8E-03 2.7E-03
Tnfrsf18 (GITR) Suppression 4.8 11.1 4.4 2.7E-03 4.3E-05 1.7E-02
Pdcd1lg2 Suppression 4.6 7.3 3.3 5.4E-04 2.5E-04 3.0E-02
Icos Suppression 4.6 4.0 3.6 2.8E-03 3.5E-03 3.2E-02
Tnfsf11 (RANKL) Suppression 3.9 8.1 27.0 7.6E-03 2.4E-03 3.4E-03
Tnfsf10 (TRAIL) Suppression 3.1 3.2 1.8 2.7E-03 9.5E-03 6.6E-02
Tnfrsf4 (OX40) Suppression 3.0 23.8 11.3 1.6E-02 7.6E-06 5.7E-03
P2ry14 (Gpr105) Receptor 65.4 6.9 1.1 2.1E-05 2.3E-03 6.8E-01
Fcer1g Receptor 12.7 0.7 0.7 7.4E-04 1.4E-02 2.2E-01
Ptger3 Receptor 12.0 1.2 1.1 3.5E-04 2.3E-01 6.9E-01
Il12rb1 Receptor 10.6 11.3 4.0 8.9E-04 2.7E-05 1.8E-02
Ltb4r1 Receptor 8.8 1.2 0.9 2.9E-03 1.8E-01 7.0E-01
Gabarapl1 Receptor 8.7 5.3 3.4 2.4E-04 1.8E-03 1.4E-01
Ly6a Receptor 7.3 11.3 3.0 3.5E-04 1.7E-04 5.3E-02
Tcrg Receptor 6.3 0.2 0.3 1.9E-03 1.4E-03 6.9E-02
Il12rb2 Receptor 5.8 18.2 6.2 1.1E-04 1.6E-04 1.0E-02
Pilrb Receptor 5.8 0.9 0.8 1.1E-03 1.5E-01 5.2E-01
Tmem2 Receptor 5.8 4.6 2.0 5.4E-03 8.5E-04 1.1E-01
Gpr171 Receptor 4.6 7.4 2.9 8.8E-03 1.3E-03 1.2E-01
Gpr34 Receptor 4.5 0.6 0.7 2.7E-02 1.1E-02 3.6E-01
Gpr160 Receptor 3.7 1.1 1.4 4.8E-03 3.0E-01 3.5E-01
Oprm1 Receptor 0.20 0.08 0.49 1.6E-03 3.6E-04 1.1E-01
Tlr1 Receptor 0.12 0.11 0.19 1.3E-04 3.5E-04 2.2E-02
Trat1 Receptor 0.12 0.15 0.25 1.3E-04 2.2E-03 4.3E-02
Edg1 Receptor 0.10 0.17 0.13 2.9E-04 1.0E-02 3.0E-02
Il2ra (CD25) CR 48.4 66.9 28.1 1.7E-05 1.2E-05 2.7E-03
Il2rb (CD122) CR 7.1 4.3 1.9 1.4E-03 1.4E-03 2.7E-01
Il7r CR 0.12 0.17 0.05 3.4E-04 1.0E-04 4.9E-03
Il6ra CR 0.11 0.26 0.16 6.3E-06 1.0E-02 9.2E-03
Il6st CR 0.08 0.11 0.16 2.7E-07 3.7E-05 5.3E-03
Sema6d Costimulation 6.1 0.9 1.4 2.1E-02 3.2E-01 2.5E-01
Pdcd1 Costimulation 4.5 4.0 4.6 8.3E-03 5.2E-03 1.7E-02
Ptger2 Costimulation 4.5 18.3 5.3 1.1E-04 6.8E-05 1.5E-02
Cd28 Costimulation 4.0 6.3 2.2 2.0E-03 2.6E-04 1.1E-01
Cd80 Costimulation 3.6 2.1 1.3 7.8E-03 5.3E-03 4.7E-01
Cd24a Costimulation 0.03 0.82 0.78 4.2E-04 2.8E-01 6.4E-01
Ccr5 CCR 18.3 3.9 1.6 1.1E-05 4.3E-04 1.4E-01
Ccr2 CCR 15.7 0.7 0.5 2.4E-04 6.1E-02 4.0E-02
Cxcr6 CCR 5.0 1.9 0.1 5.5E-03 1.9E-01 3.6E-02
Ccr7 CCR 0.10 0.39 1.43 1.1E-03 6.2E-02 7.0E-01
Cxcr4 CCR 0.06 0.46 0.10 6.3E-06 2.1E-02 9.2E-03
Genome Biology 2008, 9:R119
Genome Biology 2008, Volume 9, Issue 7, Article R119 Zhou et al. R119.14
ent questions; however, we focus on the suppressive mecha-
nism of the cultured CD8
+
NKT-like cells in this paper.
The number of genes modified by the expansion protocol in
both CD8
+
and CD4
+
T cells was quite extensive. Approxi-
mately 3,000 genes were changed by the culture. While some
genes were downregulated, most genes were upregulated by
the expansion protocol. In contrast, the number of genes sig-
nificantly changed by the activation protocol was much less.
Another surprise with this dataset is the extent of the gene
expression changes in a large number of genes. Several doz-
ens of genes were changed by 40- to 800-fold. Whereas the
exact extent of gene expression changes may not be accurately
measured for all genes, confirmatory studies using a variety of
techniques did provide evidence that many of the genes
showed large differences.
If one focuses on the upregulated genes with a false discovery
rate (FDR) (q) of <0.01 and >5-fold difference between CD8
+
NKT-like cells and naïve CD8
+
T cells, a large number of genes
encode proteins that have already been implicated in immune
suppression or have functions consistent with immune sup-
pression, the critical phenotype for these cultured CD8
+
NKT-
like cells. The proteins with immunosuppressive properties
include both surface molecules and soluble/secreted mole-
cules. Many of the surface molecules belong to the TNF family
and interferon-regulated proteins (Table 5). Many of these
molecules were highly upregulated in the CD8
+
NKT-like cells
but not upregulated in the cultured CD4
+
T cells or activated
CD8
+
T cells. Which of these molecules are involved in sup-
pressing T cell proliferation by the CD8
+
NKT-like cells
remains to be investigated in future studies. It is likely that
these molecules may work cooperatively to confer suppres-
sive function. Multiple molecules may have to be blocked to
demonstrate the suppression function of these molecules.
Furthermore, the CD8
+
NKT-like cells upregulated a large
number of genes encoding secreted proteins that are known,
or have the potential, to be implicated in the suppression
function. These molecules include Fas-L, perforin,
granzymes, Spp1, Lgals3, Lgal1 and others. Again, any of
these molecules may confer some suppression function and
the potent suppressive function of the CD8
+
NKT-like cells
may be related to more than one of these molecules. Our cell
culture system provides an excellent model to further investi-
gate the function of these molecules in immune suppression.
Pathway analysis of the expression data identified IL-10 and
IFN-γ as two critical nodes linking many of the upregulated
genes that may be implicated in immune suppression (Figure
6). Microarray and ELISA data both suggest that the CD8
+
NKT-like cells express high levels of IL-10 and IFN-γ. Previ-
ous studies suggested that these immunosuppressive
cytokines could be directly involved in the immune suppres-
sive function. The suppressive activities of some regulatory T
cells like Tr1 cells have been attributed to their IL-10 produc-
tion [58,59], while CD4
+
CD25
+
T cells produce less IL-10 and
can suppress via IL-10-dependent or -independent mecha-
nisms [54,56]. Some studies demonstrated production of
both IL-10 and IFN-γ by CD4
+
Treg cells [60]. IFN-γ has also
been reported to be a suppressive cytokine secreted by T cells
[42,61]. In certain models, IFN-γ is identified as part of a sup-
pressive pathway [62]. Thus, despite its pro-inflammatory
functions, IFN-γ may contribute to the regulation of T-cell
responses [63,64] as shown in IFN-γ
-/-
mice [65] and in graft
versus host responses [66,67]. Our studies using IL-10
-/-
and
IFN-γ
-/-
mice clearly indicate that IL-10 and IFN-γ both play a
role in the generation and/or function of CD8
+
NKT-like cells.
However, IL-10 or IFN-γ alone cannot completely explain the
suppressive function of the cultured CD8
+
NKT-like cells. It
will be interesting to find out whether IL-10
-/-
-IFN-γ
-/-
double
Ccr9 CCR 0.03 0.03 0.04 3.1E-07 7.6E-06 2.7E-03
Adam8 Adhesion 16.9 6.1 0.8 3.9E-04 4.4E-03 4.5E-01
Tjp1 Adhesion 14.6 0.4 0.4 2.9E-05 6.7E-03 5.0E-02
Emp1 Adhesion 14.4 13.7 1.3 1.2E-03 2.2E-03 6.3E-01
Emilin2 Adhesion 13.6 0.8 1.1 2.4E-04 2.0E-01 7.6E-01
Itgav Adhesion 10.6 3.6 2.3 3.6E-05 1.0E-03 8.1E-02
Nov Adhesion 10.6 1.0 1.1 1.4E-02 4.3E-01 7.5E-01
Alcam Adhesion 8.2 18.3 8.5 3.0E-04 2.9E-04 1.9E-02
Cdh1 Adhesion 6.9 0.8 0.9 3.3E-03 8.6E-02 6.2E-01
Adam9 Adhesion 6.9 7.1 2.3 4.0E-04 1.2E-03 2.6E-01
Tjp2 Adhesion 5.7 4.7 2.0 1.8E-04 9.1E-05 1.0E-01
Dsc2 Adhesion 5.0 0.9 0.9 5.8E-02 2.0E-01 7.1E-01
Itga6 Adhesion 0.14 0.12 0.48 4.2E-04 1.6E-04 1.5E-01
Itgae Adhesion 0.08 0.10 0.09 3.8E-06 7.1E-05 4.2E-03
Sell (CD62L) Adhesion 0.04 0.23 0.19 2.4E-04 3.6E-04 1.4E-02
NKT, CD8
+
NKT-like cells; nCD8, naïve CD8
+
T cells; cCD4, cultured CD4
+
T cells; aCD8, activated CD8
+
T cells. CCR, chemokine receptor; CR,
cytokine receptor.
Table 5 (Continued)
Gene expression levels for genes encoding critical surface markers
Genome Biology 2008, Volume 9, Issue 7, Article R119 Zhou et al. R119.15
Genome Biology 2008, 9:R119
knockout can completely abolish the conversion and/or func-
tion of CD8
+
NKT-like cells. It is possible that other compen-
satory pathways may exist for the production and/or function
of CD8
+
NKT-like cells. In addition, it will be interesting to
identify the signaling pathways upstream of IL-10 and IFN-γ.
In both regards, further investigation of the large number of
differentially expressed transcription factors may provide
important clues.
Conclusion
This study demonstrates that CD8
+
NKT-like cells generated
from in vitro culture possess potent immune suppressive
activity. Gene and protein expression studies using a variety
of techniques, including microarray analysis, RT-PCR, ELISA
and FACS analyses as well as functional characterization
using knockout mice, demonstrate the involvement of two
key molecular pathways, IL-10 and IFN-γ, in the function of
these potent suppressor T cells. Our culture system and the
molecular information provide a valuable platform for the
further dissection of the molecular and functional pathways
implicated in the conversion and function of suppressor T
cells.
Materials and methods
Mice
C57BL/6 (B6), B6.IL-10
-/-
and B6.IFN-γ
-/-
mice were pur-
chased from Jackson Lab (Bar Harbor, ME, USA) and
housed/bred under specific pathogen-free conditions at the
Medical College of Georgia Animal Barrier Facility. This study
was approved by the Medical College of Georgia IACUC
committee.
Cell sorting and flow cytometry
CD8
+
T cells were enriched from spleens by negative selection
using an AutoMACS from Miltenyi Biotec (Auburn, CA, USA).
The resulting CD8
+
cell purity was around 90-95%. High
purity CD4
+
T cells were obtained by sorting splenic T cells
using a Mo-Flow cytometer (Dako, Carpinteria, CA, USA).
Flow cytometric analyses were performed on a FACScalibur™
flow cytometer with CELLQuest™ software (Becton Dickin-
son, Franklin Lakes, NJ, USA).
In vitro culture of CD8
+
and CD4
+
T cells
AutoMACS-purified naïve CD8
+
or Mo-Flow sorted CD4
+
T
cells at 10
6
cells/ml were cultured with anti-CD3 and anti-
CD28 coupled to 4.5 mm paramagnetic Dynal beads (Invitro-
gen, Carlsbad, CA, USA) supplemented with 2,000 IU/ml
rIL-2 (PeproTech, Rocky Hill, NJ, USA) in complete medium,
which consisted of 10% heat-inactivated fetal bovine serum
(Sigma-Aldrich, St. Louis, MO, USA), nonessential amino
acids, 0.5 mM sodium pyruvate, 5 mM Hepes, 1 mM glutaMax
I (all from Invitrogen, Carlsbad, CA, USA), and 55 μM
mercaptoethanol (Sigma-Aldrich) in DMEM base. The cul-
tures were monitored daily and maintained at 1-1.5 × 10
6
cells/ml by diluting with IL-2-supplemented complete
medium for 8-13 days. At the end of the culture, the anti-CD3
and anti-CD28 beads were removed using a Dynal MPC-L
magnet (Dynal Biotech), and the cells were routinely assayed
for CD8, CD4, CD62L, and CD25 expression by flow cytome-
try and for in vitro suppression assays.
In vitro suppression assays
Two different types of suppression assays were performed in
this study. Most of the studies were performed using the
CFSE system. Briefly, naïve CD4
+
CD25
-
responder T cells
were labeled with 2.5 μM CFSE. These labeled responder cells
(1 × 10
5
) were cocultured at 37°C with different numbers of
suppressor cells (CD8
+
NKT-like cells, cultured CD4
+
T cells
or CD4
+
CD25
+
Treg cells) in the presence of 1.5 × 10
5
irradi-
ated (2,000 rads) splenic APC (T cell depleted spleen cells)
and 1.5 μg/ml anti-CD3 in a U-bottomed 96-well plate. After
72 h of culture, responder T cell proliferation was assessed by
determining the dilution of CFSE using flow cytometry. The
second type of suppression assay has identical culture condi-
tions but the responder T cells were not labeled. The cultures
were pulsed with 1 μCi/well [
3
H]thymidine for the last 16 h of
72 h culture and the level of proliferation was assessed by
[
3
H]thymidine incorporation using scintillation counting
after cell harvesting.
Cytokine analysis by ELISA
Cells were cultured in 96-well plates with 1 × 10
5
CD4
+
CD25
-
T cells/well, 1.5 × 10
5
/well irradiated splenic APC and 1.5 μg/
ml anti-CD3 in the presence or absence of 1 × 10
5
/well CD8
+
NKT-like cells or fresh CD4
+
CD25
+
Treg cells. The level of IL-
10, IFN-γ, IL-4 and IL-2 in the culture supernatant was deter-
mined by ELISA kits purchased from R&D Systems (Minne-
apolis, MN, USA).
Microarray experiments
Total RNA was extracted from cultured or fresh T cells using
the Qiashredder column and RNeasy Mini kit (Qiagen Inc.,
Valencia, CA, USA). All RNA extracted was analyzed for
quantity and quality using the Agilent 2100 Bioanalyzer sys-
tem (Agilent Technologies, Palo Alto, CA, USA). Gene expres-
sion profiling was performed using the mouse genome 430
2.0 chips (GeneChip™, Affymetrix, Santa Clara, CA, USA). An
aliquot of 1 μg of total RNA was converted into double-
stranded cDNA (ds-cDNA) by using SuperScript Choice Sys-
tem (Gibco BRL Life Technologies, Carlsbad, CA, USA) with
an oligo-dT primer containing a T7 RNA polymerase pro-
moter (Genset, San Diego, CA, USA). After second-strand
synthesis, the reaction mixture was extracted with phenol-
chloroform-isoamyl alcohol, and ds-cDNA was recovered by
ethanol precipitation. In vitro transcription was performed
on the above ds-cDNA using the Enzo RNA transcript Labe-
ling kit. Biotin-labeled cRNA was purified by using an RNeasy
affinity column (Qiagen), and fragmented randomly to sizes
ranging from 35-200 bases by incubating at 94°C for 35 min-
utes. The hybridization solutions contained 100 mM MES [2-
Genome Biology 2008, 9:R119
Genome Biology 2008, Volume 9, Issue 7, Article R119 Zhou et al. R119.16
(N-morpholino)ethanesulfonic acid], 1 M Na
+
, 20 mM EDTA,
and 0.01% Tween 20. The final concentration of fragmented
cRNA was 0.05 μg/μl in hybridization solution. Target for
hybridization was prepared by combining 40 μl of frag-
mented transcript with sonicated herring sperm DNA (0.1
mg/ml), bovine serum albumin and 5 nM control oligonucle-
otide in a buffer containing 1.0 M NaCl, 10 mM Tris.HCl
(pH7.6), and 0.005% Triton X-100. Target was hybridized for
16 h at 45°C to a set of oligonuceotide arrays (Affymetrix).
Arrays were then washed at 50°C with stringent solution,
then again at 30°C with non-stringent washes. Arrays were
then stained with streptavidin-phycoerythrin (Invitrogen).
DNA chips were read at a resolution of 3 μm with a Hewlett-
Packard GeneArray Scanner and were analyzed with the
GENECHIP software (Affymetrix GCOS 1.1). Both the CEL
and DAT files for each hybridization have been uploaded to
our server running GeneTraffic v3.2 (Iobion Informatics LLC,
La Jolla, CA, USA).
Data analysis
Microarray data were first normalized using RMA [68] and
normalized data were subsequently analyzed using the
LIMMA [69] package in R. All groups were compared pair-
wise, and the resulting p-values were adjusted using the
pFDR of Storey [70] and the qvalue package in R. We consid-
ered all probesets with a q-value ≤0.01 as being significant.
The heatmap was constructed using the heatmap.2 function
in R. Differentially expressed genes showing more than five-
fold change between CD8
+
NKT-like and naïve CD8
+
T cells
were annotated with respect to their involvement in biological
processes and pathways using the PANTHER (Protein
ANalysis THrough Evolutionary Relationships) classification
system [71]. Of the 314 genes, biological processes for 257
were found by PANTHER. One-tailed p-values for enrich-
ment of particular biological processes were obtained using
the standard Fisher's exact test, to determine if the observed
number of counts exceeded the expected counts. Gene lists
from each significantly enriched (p < 0.05) biological process
were further analyzed by pathway analysis. A network depict-
ing the molecular interactions between the given set of genes
was constructed using Pathway Studio Version 5.0 software
and ResNet mammalian database (Ariadne Genomics, Rock-
ville, MD, USA). ResNet is a very large database of molecular
interactions and biological relationships extracted from the
biomedical literature. The found interactions between the
given set of genes were manually curated by reading sen-
tences from which the relationship or interaction was
derived. Only manually curated interactions were used for the
final pathway visualization.
RT-PCR analysis
An aliquot of total RNA (2 μg per sample) were arrayed in 96-
well plates and then converted to cDNA using a High Capacity
cDNA Reverse Transcription Kit (Applied Biosystems, Foster
City, CA, USA) and a programmable thermal cycler (Applied
Biosystems). The cDNA products were diluted and an aliquot
of cDNA equivalent to 10 ng total RNA was used for quantita-
tive RT-PCR performed using ready-to-use TaqMan gene
expression assays from Applied Biosystems. 18srRNA and
GAPDH were used as endogenous controls for normalizing
RNA concentration. RT-PCR was performed in 384-well
plates with the ABI 7900HT Fast Real-Time PCR System
(Applied Biosystems). Standard thermal cycling conditions
(10 minutes at 95°C, 40 cycles for 15 s at 95°C, 1 minute at
60°C) was used for all genes. All samples were analyzed on
the same plate and each sample was analyzed in duplicate.
Cycle threshold (C
T
) values for each test gene and 18SrRNA
and GAPDH were obtained for each sample using the SDS2.3
and analyzed with RQ Manager 1.2 software (Applied Biosys-
tems). Differences in C
T
values between a test gene and
18srRNA (ΔC
T
) for each sample were calculated and used for
statistical analyses.
Abbreviations
APC, antigen presenting cell; CFSE, carboxyfluorescein suc-
cinimidyl ester; ds-cDNA, double-stranded cDNA; ELISA,
enzyme-linked immunosorbent assay; FACS, fluorescence-
activated cell sorting; FDR, false discovery rate; Fgl, Fibrino-
gen-like protein; Gal, Galectin; Ifitm, Interferon induced
transmembrane protein; IFN, interferon; IL, interleukin;
MHC, major histocompatibility complex; NK, natural killer;
NKT, natural killer T cell; Opg, Osteoprotegerin; RANK,
Receptor activator for nuclear factor κB; RANKL, RANK lig-
and; TCR, T cell receptor; TF, transcription factor; TGF,
transforming growth factor; Tn, naïve T; TNF, tumor necrosis
factor; Treg, regulatory T.
Authors' contributions
LZ performed most experiments and drafted the manuscript.
HW carried out most RT-PCR analyses. XZ participated in the
cellular studies. YJ performed RT-PCR analyses. QM partici-
pated in experimental design and data interpretation. RAM
participated in data analysis and interpretation. NG and RP
performed statistical analysis. J-XS participated in experi-
mental design, data analysis and interpretation, writing and
editing of the manuscript.
Additional data files
The following additional data are available. Additional data
file 1 contains two figures showing that anti-TGF-β cannot
block the suppression function of CD8
+
NKT-like cells and
that IFN-γ restores the viability of in vitro cultured CD8
+
NKT-like cells from IFN-γ
-/-
mouse.
Additional data file 1Supplementary figures S1 and S2Figure S1: anti-TGF-β cannot block the suppression function of CD8
+
NKT-like cells. Figure S2: INF-γ restores the viability of in vitro cultured CD8
+
NKT-like cells from INF-γ
-/-
mouse.Click here for file
Acknowledgements
The study was partially supported by a grant from the National Institutes of
Health (2P01 AI-42288) to JXS. Ashok Sharma performed pathway analysis.
Genome Biology 2008, Volume 9, Issue 7, Article R119 Zhou et al. R119.17
Genome Biology 2008, 9:R119
References
1. Ballas ZK, Rasmussen W: NK1.1+ thymocytes. Adult murine
CD4-, CD8- thymocytes contain an NK1.1+, CD3+, CD5hi,
CD44hi, TCR-V beta 8+ subset. J Immunol 1990, 145:1039-1045.
2. Sykes M: Unusual T cell populations in adult murine bone
marrow. Prevalence of CD3+CD4-CD8- and alpha beta
TCR+NK1.1+ cells. J Immunol 1990, 145:3209-3215.
3. Lanier LL, Le AM, Civin CI, Loken MR, Phillips JH: The relationship
of CD16 (Leu-11) and Leu-19 (NKH-1) antigen expression on
human peripheral blood NK cells and cytotoxic T
lymphocytes. J Immunol 1986, 136:4480-4486.
4. Schmidt RE, Murray C, Daley JF, Schlossman SF, Ritz J: A subset of
natural killer cells in peripheral blood displays a mature T
cell phenotype. J Exp Med 1986, 164:351-356.
5. MacDonald HR: NK1.1+ T cell receptor-alpha/beta+ cells: new
clues to their origin, specificity, and function. J Exp Med 1995,
182:633-638.
6. Eberl G, Lees R, Smiley ST, Taniguchi M, Grusby MJ, MacDonald HR:
Tissue-specific segregation of CD1d-dependent and CD1d-
independent NK T cells. J Immunol 1999, 162:6410-6419.
7. Godfrey DI, MacDonald HR, Kronenberg M, Smyth MJ, Van Kaer L:
NKT cells: what's in a name? Nat Rev Immunol 2004, 4:231-237.
8. Bendelac A, Rivera MN, Park SH, Roark JH: Mouse CD1-specific
NK1 T cells: development, specificity, and function. Annu Rev
Immunol 1997, 15:535-562.
9. Ohteki T, MacDonald HR: Major histocompatibility complex
class I related molecules control the development of CD4+8-
and CD4-8- subsets of natural killer 1.1+ T cell receptor-
alpha/beta+ cells in the liver of mice. J Exp Med 1994,
180:699-704.
10. Yoshimoto T, Paul WE: CD4pos, NK1.1pos T cells promptly
produce interleukin 4 in response to in vivo challenge with
anti-CD3. J Exp Med 1994, 179:1285-1295.
11. Kronenberg M, Gapin L:
The unconventional lifestyle of NKT
cells. Nat Rev Immunol 2002, 2:557-568.
12. Kawamura H, Kameyama H, Kosaka T, Kuwahara O, Bannai M, Kawa-
mura T, Watanabe H, Abo T: Association of CD8+ natural killer
T cells in the liver with neonatal tolerance phenomenon.
Transplantation 2002, 73:978-992.
13. Wingender G, Berg M, Jungerkes F, Diehl L, Sullivan BA, Kronenberg
M, Limmer A, Knolle PA: Immediate antigen-specific effector
functions by TCR-transgenic CD8+ NKT cells. Eur J Immunol
2006, 36:570-582.
14. Stremmel C, Exley M, Balk S, Hohenberger W, Kuchroo VK: Char-
acterization of the phenotype and function of CD8(+), alpha/
beta(+) NKT cells from tumor-bearing mice that show a nat-
ural killer cell activity and lyse multiple tumor targets. Eur J
Immunol 2001, 31:2818-2828.
15. Baker J, Verneris MR, Ito M, Shizuru JA, Negrin RS: Expansion of
cytolytic CD8(+) natural killer T cells with limited capacity
for graft-versus-host disease induction due to interferon
gamma production. Blood 2001, 97:2923-2931.
16. Earle KE, Tang Q, Zhou X, Liu W, Zhu S, Bonyhadi ML, Bluestone JA:
In vitro expanded human CD4+CD25+ regulatory T cells
suppress effector T cell proliferation. Clin Immunol 2005,
115:3-9.
17. Tang Q, Henriksen KJ, Bi M, Finger EB, Szot G, Ye J, Masteller EL,
McDevitt H, Bonyhadi M, Bluestone JA: In vitro-expanded antigen-
specific regulatory T cells suppress autoimmune diabetes. J
Exp Med 2004, 199:1455-1465.
18. Thornton AM, Shevach EM: CD4+CD25+ immunoregulatory T
cells suppress polyclonal T cell activation in vitro by inhibiting
interleukin 2 production. J Exp Med 1998, 188:287-296.
19. Itoh M, Takahashi T, Sakaguchi N, Kuniyasu Y, Shimizu J, Otsuka F,
Sakaguchi S: Thymus and autoimmunity: production of
CD25+CD4+ naturally anergic and suppressive T cells as a
key function of the thymus in maintaining immunologic self-
tolerance. J Immunol 1999, 162:5317-5326.
20. Knoepfler PS, Cheng PF, Eisenman RN: N-myc is essential during
neurogenesis for the rapid expansion of progenitor cell pop-
ulations and the inhibition of neuronal differentiation. Genes
Dev 2002, 16:2699-2712.
21. Pearce EL, Mullen AC, Martins GA, Krawczyk CM, Hutchins AS,
Zediak VP, Banica M, DiCioccio CB, Gross DA, Mao CA, Shen H,
Cereb N, Yang SY, Lindsten T, Rossant J, Hunter CA, Reiner SL: Con-
trol of effector CD8+ T cell function by the transcription fac-
tor Eomesodermin. Science 2003, 302:1041-1043.
22. Intlekofer AM, Takemoto N, Wherry EJ, Longworth SA, Northrup JT,
Palanivel VR, Mullen AC, Gasink CR, Kaech SM, Miller JD, Gapin L,
Ryan K, Russ AP, Lindsten T, Orange JS, Goldrath AW, Ahmed R,
Reiner SL: Effector and memory CD8+ T cell fate coupled by
T-bet and eomesodermin. Nat Immunol 2005, 6:1236-1244.
23. Endharti AT, Rifa'i M, Shi Z, Fukuoka Y, Nakahara Y, Kawamoto Y,
Takeda K, Isobe K, Suzuki H: Cutting edge: CD8+CD122+ regu-
latory T cells produce IL-10 to suppress IFN-gamma produc-
tion and proliferation of CD8+ T cells. J Immunol 2005,
175:7093-7097.
24. Komori T, Yagi H, Nomura S, Yamaguchi A, Sasaki K, Deguchi K,
Shimizu Y, Bronson RT, Gao YH, Inada M, Sato M, Okamoto R, Kita-
mura Y, Yoshiki S, Kishimoto T: Targeted disruption of Cbfa1
results in a complete lack of bone formation owing to matu-
rational arrest of osteoblasts. Cell 1997, 89:755-764.
25. Vaillant F, Blyth K, Andrew L, Neil JC, Cameron ER: Enforced
expression of Runx2 perturbs T cell development at a stage
coincident with beta-selection. J Immunol 2002, 169:2866-2874.
26. Grossman WJ, Verbsky JW, Barchet W, Colonna M, Atkinson JP, Ley
TJ: Human T regulatory cells can use the perforin pathway to
cause autologous target cell death. Immunity 2004, 21:589-601.
27. Béchard D, Scherpereel A, Hammad H, Gentina T, Tsicopoulos A,
Aumercier M, Pestel J, Dessaint JP, Tonnel AB, Lassalle P: Human
endothelial-cell specific molecule-1 binds directly to the
integrin CD11a/CD18 (LFA-1) and blocks binding to inter-
cellular adhesion molecule-1. J Immunol 2001, 167:3099-3106.
28. Weber GF, Cantor H: The immunology of Eta-1/osteopontin.
Cytokine Growth Factor Rev 1996, 7:241-248.
29. Walsh MC, Choi Y: Biology of the TRANCE axis.
Cytokine Growth
Factor Rev 2003, 14:251-263.
30. Saidenberg Kermanac'h N, Bessis N, Cohen-Solal M, De Vernejoul
MC, Boissier MC: Osteoprotegerin and inflammation. Eur
Cytokine Netw 2002, 13:144-153.
31. Saidenberg-Kermanac'h N, Cohen-Solal M, Bessis N, De Vernejoul
MC, Boissier MC: Role for osteoprotegerin in rheumatoid
inflammation. Joint Bone Spine 2004, 71:9-13.
32. Guillonneau C, Louvet C, Renaudin K, Heslan JM, Heslan M, Tesson
L, Vignes C, Guillot C, Choi Y, Turka LA, Cuturi MC, Anegon I, Josien
R: The role of TNF-related activation-induced cytokine-
receptor activating NF-kappa B interaction in acute allograft
rejection and CD40L-independent chronic allograft
rejection. J Immunol 2004, 172:1619-1629.
33. Hancock WW, Szaba FM, Berggren KN, Parent MA, Mullarky IK,
Pearl J, Cooper AM, Ely KH, Woodland DL, Kim IJ, Blackman MA,
Johnson LL, Smiley ST: Intact type 1 immunity and immune-
associated coagulative responses in mice lacking IFN
gamma-inducible fibrinogen-like protein 2. Proc Natl Acad Sci
USA 2004, 101:3005-3010.
34. Chan CW, Kay LS, Khadaroo RG, Chan MW, Lakatoo S, Young KJ,
Zhang L, Gorczynski RM, Cattral M, Rotstein O, Levy GA: Soluble
fibrinogen-like protein 2/fibroleukin exhibits immunosup-
pressive properties: suppressing T cell proliferation and
inhibiting maturation of bone marrow-derived dendritic
cells. J Immunol 2003, 170:4036-4044.
35. Nakahara S, Oka N, Raz A: On the role of galectin-3 in cancer
apoptosis. Apoptosis 2005, 10:267-275.
36. Zubieta MR, Furman D, Barrio M, Bravo AI, Domenichini E, Mordoh
J: Galectin-3 expression correlates with apoptosis of tumor-
associated lymphocytes in human melanoma biopsies. Am J
Pathol 2006, 168:1666-1675.
37. López E, del Pozo V, Miguel T, Sastre B, Seoane C, Civantos E, Llanes
E, Baeza ML, Palomino P, Cárdaba B, Gallardo S, Manzarbeitia F,
Zubeldia JM, Lahoz C: Inhibition of chronic airway inflamma-
tion and remodeling by Galectin-3 gene therapy in a murine
model. J Immunol 2006, 176:1943-1950.
38. Tan Z, Wang M, Liang P:
Identification by differential display of
IL-24 autocrine loop activated by ras oncogenes. Methods Mol
Biol 2006, 317:207-218.
39. Gupta P, Walter MR, Su Zz, Lebedeva IV, Emdad L, Randolph A,
Valerie K, Sarkar D, Fisher PB: BiP/GRP78 is an intracellular tar-
get for MDA-7/IL-24 induction of cancer-specific apoptosis.
Cancer Res 2006, 66:8182-8191.
40. Yang G, Xu Y, Chen X, Hu G: IFITM1 plays an essential role in
the antiproliferative action of interferon-gamma. Oncogene
2007, 26:594-603.
41. Sanchez-Fueyo A, Tian J, Picarella D, Domenig C, Zheng XX, Sabatos
CA, Manlongat N, Bender O, Kamradt T, Kuchroo VK, Gutiérrez-
Ramos JC, Coyle AJ, Strom TB: Tim-3 inhibits T helper type 1-
Genome Biology 2008, 9:R119
Genome Biology 2008, Volume 9, Issue 7, Article R119 Zhou et al. R119.18
mediated auto- and alloimmune responses and promotes
immunological tolerance. Nat Immunol 2003, 4:1093-1101.
42. Myers L, Croft M, Kwon BS, Mittler RS, Vella AT: Peptide-specific
CD8 T regulatory cells use IFN-gamma to elaborate TGF-
beta-based suppression. J Immunol 2005, 174:7625-7632.
43. Sun Y, Lin X, Chen HM, Wu Q, Subudhi SK, Chen L, Fu YX: Admin-
istration of agonistic anti-4-1BB monoclonal antibody leads
to the amelioration of experimental autoimmune
encephalomyelitis. J Immunol 2002, 168:1457-1465.
44. Sun Y, Chen HM, Subudhi SK, Chen J, Koka R, Chen L, Fu YX: Cos-
timulatory molecule-targeted antibody therapy of a sponta-
neous autoimmune disease. Nat Med 2002, 8:1405-1413.
45. Foell J, Strahotin S, O'Neil SP, McCausland MM, Suwyn C, Haber M,
Chander PN, Bapat AS, Yan XJ, Chiorazzi N, Hoffmann MK, Mittler
RS: CD137 costimulatory T cell receptor engagement
reverses acute disease in lupus-prone NZB × NZW F1 mice.
J Clin Invest 2003, 111:1505-1518.
46. Foell JL, Diez-Mendiondo BI, Diez OH, Holzer U, Ruck P, Bapat AS,
Hoffmann MK, Mittler RS, Dannecker GE: Engagement of the
CD137 (4-1BB) costimulatory molecule inhibits and reverses
the autoimmune process in collagen-induced arthritis and
establishes lasting disease resistance. Immunology 2004,
113:89-98.
47. Seo SK, Choi JH, Kim YH, Kang WJ, Park HY, Suh JH, Choi BK, Vinay
DS, Kwon BS: 4-1BB-mediated immunotherapy of
rheumatoid arthritis. Nat Med 2004, 10:1088-1094.
48. Kwon BS, Hurtado JC, Lee ZH, Kwack KB, Seo SK, Choi BK, Koller
BH, Wolisi G, Broxmeyer HE, Vinay DS: Immune responses in 4-
1BB (CD137)-deficient mice. J Immunol 2002, 168:5483-5490.
49. Kägi D, Ledermann B, Bürki K, Zinkernagel RM, Hengartner H:
Molecular mechanisms of lymphocyte-mediated cytotoxic-
ity and their role in immunological protection and pathogen-
esis in vivo. Annu Rev Immunol 1996,
14:207-232.
50. Hata AN, Breyer RM: Pharmacology and signaling of prostag-
landin receptors: multiple roles in inflammation and
immune modulation. Pharmacol Ther 2004, 103:147-166.
51. Fujimoto Y, Iwagaki H, Ozaki M, Ogino T, Murata H, Sun DS, Sada-
mori H, Takahashi HK, Tanaka N, Yagi T: Involvement of prostag-
landin receptors (EPR2-4) in in vivo immunosuppression of
PGE2 in rat skin transplant model. Int Immunopharmacol 2005,
5:1131-1139.
52. Wysocki CA, Jiang Q, Panoskaltsis-Mortari A, Taylor PA, McKinnon
KP, Su L, Blazar BR, Serody JS: Critical role for CCR5 in the func-
tion of donor CD4+CD25+ regulatory T cells during acute
graft-versus-host disease. Blood 2005, 106:3300-3307.
53. Read S, Malmström V, Powrie F: Cytotoxic T lymphocyte-associ-
ated antigen 4 plays an essential role in the function of
CD25(+)CD4(+) regulatory cells that control intestinal
inflammation. J Exp Med 2000, 192:295-302.
54. Asseman C, Mauze S, Leach MW, Coffman RL, Powrie F: An essen-
tial role for interleukin 10 in the function of regulatory T
cells that inhibit intestinal inflammation. J Exp Med 1999,
190:995-1004.
55. Kingsley CI, Karim M, Bushell AR, Wood KJ: CD25+CD4+ regula-
tory T cells prevent graft rejection: CTLA-4- and IL-10-
dependent immunoregulation of alloresponses. J Immunol
2002, 168:1080-1086.
56. Belkaid Y, Piccirillo CA, Mendez S, Shevach EM, Sacks DL:
CD4+CD25+ regulatory T cells control Leishmania major
persistence and immunity. Nature 2002, 420:502-507.
57. Filaci G, Suciu-Foca N: CD8+ T suppressor cells are back to the
game: are they players in autoimmunity? Autoimmun Rev 2002,
1:279-283.
58. Vieira PL, Christensen JR, Minaee S, O'Neill EJ, Barrat FJ, Boonstra A,
Barthlott T, Stockinger B, Wraith DC, O'Garra A: IL-10-secreting
regulatory T cells do not express Foxp3 but have compara-
ble regulatory function to naturally occurring CD4+CD25+
regulatory T cells. J Immunol 2004, 172:5986-5993.
59. Barrat FJ, Cua DJ, Boonstra A, Richards DF, Crain C, Savelkoul HF,
de Waal-Malefyt R, Coffman RL, Hawrylowicz CM, O'Garra A: In
vitro generation of interleukin 10-producing regulatory
CD4(+) T cells is induced by immunosuppressive drugs and
inhibited by T helper type 1 (Th1)- and Th2-inducing
cytokines. J Exp Med 2002, 195:603-616.
60. Trinchieri G: Regulatory role of T cells producing both inter-
feron gamma and interleukin 10 in persistent infection. J Exp
Med 2001, 194:F53-F57.
61. Pauels HG, Austrup F, Becker C, Schmitt E, Rüde E, Kölsch E: Lym-
phokine profile and activation pattern of two unrelated anti-
gen- or idiotype-specific T suppressor cell clones. Eur J
Immunol 1992, 22:1961-1966.
62. Fallarino F, Grohmann U, Hwang KW, Orabona C, Vacca C, Bianchi
R, Belladonna ML, Fioretti MC, Alegre ML, Puccetti P: Modulation
of tryptophan catabolism by regulatory T cells. Nat Immunol
2003, 4:1206-1212.
63. Cauley LS, Miller EE, Yen M, Swain SL: Superantigen-induced CD4
T cell tolerance mediated by myeloid cells and IFN-gamma.
J Immunol 2000, 165:6056-6066.
64. Yu XZ, Albert MH, Martin PJ, Anasetti C: CD28 ligation induces
transplantation tolerance by IFN-gamma-dependent deple-
tion of T cells that recognize alloantigens. J Clin Invest 2004,
113:1624-1630.
65. Dalton DK, Pitts-Meek S, Keshav S, Figari IS, Bradley A, Stewart TA:
Multiple defects of immune cell function in mice with dis-
rupted interferon-gamma genes. Science 1993, 259:1739-1742.
66. Huchet R, Bruley-Rosset M, Mathiot C, Grandjon D, Halle-Pannenko
O: Involvement of IFN-gamma and transforming growth fac-
tor-beta in graft-vs-host reaction-associated
immunosuppression. J Immunol 1993, 150:2517-2524.
67. Wall DA, Hamberg SD, Reynolds DS, Burakoff SJ, Abbas AK, Ferrara
JL: Immunodeficiency in graft-versus-host disease. I. Mecha-
nism of immune suppression. J Immunol 1988, 140:2970-2976.
68. Bolstad BM, Irizarry RA, Astrand M, Speed TP: A comparison of
normalization methods for high density oligonucleotide
array data based on variance and bias. Bioinformatics
2003,
19:185-193.
69. Smyth GK: Linear models and empirical bayes methods for
assessing differential expression in microarray experiments.
Stat Appl Genet Mol Biol 2004, 3:Article3.
70. Storey JD: A direct approach to false discovery rates. J Roy Stat
Soc B Stat Meth 2002, 64:479-498.
71. Thomas PD, Campbell MJ, Kejariwal A, Mi H, Karlak B, Daverman R,
Diemer K, Muruganujan A, Narechania A: PANTHER: a library of
protein families and subfamilies indexed by function. Genome
Res 2003, 13:2129-2141.