Báo cáo y học: "Segmentation-based detection of allelic imbalance and loss-of-heterozygosity in cancer cells using whole genome SNP arrays" ppsx
Bạn đang xem bản rút gọn của tài liệu. Xem và tải ngay bản đầy đủ của tài liệu tại đây (2.94 MB, 18 trang )
Genome Biology 2008, 9:R136
Open Access
2008Staafet al.Volume 9, Issue 9, Article R136
Method
Segmentation-based detection of allelic imbalance and
loss-of-heterozygosity in cancer cells using whole genome SNP
arrays
Johan Staaf
*†
, David Lindgren
*
, Johan Vallon-Christersson
*†
,
Anders Isaksson
‡
, Hanna Göransson
‡
, Gunnar Juliusson
§
,
Richard Rosenquist
¶
, Mattias Höglund
*
, Åke Borg
*†§
and Markus Ringnér
*†
Addresses:
*
Department of Oncology, Clinical Sciences, Lund University, SE-22185 Lund, Sweden.
†
CREATE Health Strategic Centre for
Clinical Cancer Research, Lund University, SE-22184 Lund, Sweden.
‡
Department of Medical Sciences, Cancer Pharmacology and Informatics,
Uppsala University, SE-75185 Uppsala, Sweden.
§
Lund Strategic Research Center for Stem Cell Biology and Cell Therapy, Lund University, SE-
22184 Lund, Sweden.
¶
Department of Genetics and Pathology, Uppsala University, SE-75185 Uppsala, Sweden.
Correspondence: Markus Ringnér. Email:
© 2008 Staaf et al.; licensee BioMed Central Ltd.
This is an open access article distributed under the terms of the Creative Commons Attribution License ( which
permits unrestricted use, distribution, and reproduction in any medium, provided the original work is properly cited.
Detecting allelic imbalance<p>A strategy is presented for detection of loss-of-heterozygosity and allelic imbalance in cancer cells from whole genome SNP genotyping data.</p>
Abstract
We present a strategy for detection of loss-of-heterozygosity and allelic imbalance in cancer cells
from whole genome single nucleotide polymorphism genotyping data. Using a dilution series of a
tumor cell line mixed with its paired normal cell line and data generated on Affymetrix and Illumina
platforms, including paired tumor-normal samples and tumors characterized by fluorescent in situ
hybridization, we demonstrate a high sensitivity and specificity of the strategy for detecting both
minute and gross allelic imbalances in heterogeneous tumor samples.
Background
Cancer development involves genomic aberrations such as
gene copy number gains or losses and allele-specific imbal-
ances [1]. Array-based comparative genomic hybridization
(aCGH) [2] has, since its introduction, become a widely
adopted tool for identification and quantification of DNA
copy number alterations (CNAs) in tumor genomes [3]. The
introduction of whole genome genotyping (WGG) arrays
based on single nucleotide polymorphism (SNP) genotyping
[4,5] allows for combined DNA copy number (SNP-CGH) and
loss-of-heterozygosity (LOH) analysis at high resolution [6].
Current SNP arrays can genotype several hundreds of thou-
sands of SNPs simultaneously. LOH analysis has in the past
been a vital tool for the discovery of chromosomal regions
harboring tumor-suppressor genes when inactivated by the
classic mechanism of allelic loss [7]. LOH occurs as a conse-
quence of reduction in copy number in a diploid genome but
it may also appear as copy number-neutral LOH resulting
from uniparental disomy or mitotic recombination events.
The latter type of changes is not detectable by conventional
aCGH platforms. Moreover, increases in copy number due to,
for example, mono-allelic amplification may falsely be
detected as LOH [8]. Therefore, by combining LOH and copy
number analysis, regions of LOH derived from either copy
number loss or neutral events may be identified. Conven-
tional LOH studies compare the genotype of a tumor to its
matched constitutional genotype. Current generations of
WGG arrays have been reported to provide sufficiently high
marker density to infer regions of LOH by the absence of het-
erozygous loci without the use of a matched control [9]. How-
Published: 16 September 2008
Genome Biology 2008, 9:R136 (doi:10.1186/gb-2008-9-9-r136)
Received: 2 July 2008
Revised: 2 September 2008
Accepted: 16 September 2008
The electronic version of this article is the complete one and can be
found online at /> Genome Biology 2008, Volume 9, Issue 9, Article R136 Staaf et al. R136.2
Genome Biology 2008, 9:R136
ever, the increased marker density disqualifies the
assumption of independence between allele calls of adjacent
SNPs due to linkage disequilibrium. This may lead to detec-
tion of non-tumor specific homozygous regions based solely
on the marker density. In the absence of a matched normal,
haplotype correction methods may be required to remove
such non-informative regions [9]. WGG arrays may eventu-
ally replace conventional aCGH platforms based on bacterial
artificial chromosome clones or oligonucleotides due to their
ability to generate both copy number and genotyping data [6].
However, this presumption has not been thoroughly investi-
gated.
As previously described, allelic imbalances can conveniently
be visualized in B allele frequency (BAF) plots representing
the proportion of the two investigated alleles [6]. In BAF plots
a value of 0.5 indicates a heterozygous genotype (AB),
whereas 0 and 1 indicate homozygous genotypes (AA and BB,
respectively). In a normal sample, three bands are expected in
the BAF plot, a band centered at 0.5 for heterozygous SNPs, a
band at 0 for SNPs genotyped as AA and a band at 1 for SNPs
genotyped as BB. Allelic imbalances in tumor samples are
observed in BAF plots as a deviation from 0.5 of SNPs heter-
ozygous in cells with constitutional genotype. Detection of
regions with LOH or allelic imbalance from WGG data has
frequently been performed by methods incorporating hidden
Markov models (HMMs) for which several different software
packages exist, for example, dChipSNP [10], CNAT [11], Pen-
nCNV [12] and QuantiSNP [13]. Unfortunately, several of the
existing software packages for LOH detection are currently
only applicable for use with one of the two widely used WGG
platforms, either Affymetrix or Illumina.
WGG arrays are increasingly employed for the analysis of
tumor specimens. However, such samples often contain nor-
mal cell components and tumor cell subpopulations causing a
dilution of tumor cell-specific imbalances. Such dilution
reduces the sensitivity in LOH detection using SNP call-based
methods [14]. Dilution of tumor cell specific allelic imbal-
ances is seen in BAF plots as a compression of the split heter-
ozygous populations towards the heterozygous center (at BAF
= 0.5). Different methods have been proposed as solutions for
Affymetrix GeneChip SNP arrays [14-16]. For Illumina,
SOMATICs [17] was recently reported to allow for detection of
allelic imbalance in tissues containing 40-75% tumor cells.
Here we describe a segmentation-based strategy for detection
of LOH and allelic imbalances from WGG array data. The
strategy allows for a large proportion of normal cell compo-
nents and/or tumor cell clone heterogeneity. Transformation
of B allele frequency profiles into a data representation free of
allele association together with removal of non-tumor specific
homozygous SNPs allows for direct application of segmenta-
tion algorithms from DNA copy number analysis, for exam-
ple, circular binary segmentation (CBS) [18]. Segmented
regions of similar allelic proportion are called as allelic imbal-
ance by comparison to either a fixed threshold or a sample
adaptive threshold as proposed for the normalization of copy
number data [19]. Furthermore, the segmented value of an
allelic imbalance can be used for accurate estimation of the
proportion of affected cells.
We tested the performance of the segmentation strategy in
simulated Illumina WGG data and in five experimental tumor
WGG data sets. The results are compared to several other
reported methods. The investigated data sets contain both
paired tumor-normal samples, as well as unpaired tumor
samples obtained from primary solid tumors and leukemias.
The included tumors display a large set of different CNAs,
including high level amplifications and homozygous dele-
tions, as well as varying tumor heterogeneity and normal cell
contamination. The data sets were generated on Illumina
Genotyping BeadChips (300k, 370k and 550k) as well as on
Affymetrix GeneChipArrays (250k), demonstrating the appli-
cability of the segmentation strategy to different WGG plat-
forms. Compared to currently used methods, we demonstrate
that the proposed segmentation strategy has a high sensitivity
and specificity for detecting allelic imbalances originating
from DNA copy number gain, loss, and neutral events in het-
erogenic tumor specimens. We also demonstrate that the seg-
mentation strategy can be used to accurately estimate the
fraction of cells affected by allelic imbalance.
Results and discussion
This study is outlined as follows with results and discussion
presented accordingly. First we demonstrate that segmenta-
tion methods used in DNA copy number analysis can directly
be applied to matched tumor-normal samples for identifica-
tion of regions of similar allelic proportions. Next, the seg-
mentation approach is generalized for use with unpaired
tumor samples. The performance of the segmentation strat-
egy in comparison to other methods is comprehensively eval-
uated using simulated as well as experimental data sets from
different Illumina WGG platforms. Then, we describe how the
segmentation approach with high accuracy and sensitivity
detects and estimates the fraction of cells affected by an allelic
imbalance. Finally, we describe how the segmentation
approach can be adapted to Affymetrix WGG data.
Segmentation identifies regions of identical allelic
proportions in matched tumor-normal samples
Allelic imbalances in tumor samples may conveniently be dis-
played using BAF plots, which illustrate the presence and
location of genomic regions of apparently the same allelic
proportion (Figure 1a). The nature of an allelic imbalance
may be revealed by comparison to the corresponding copy
number profile (Figure 1b). In conventional LOH analysis a
matched normal sample is used for detection of LOH. SNPs
that are homozygous in constitutional cells are non-informa-
tive for LOH analysis. For paired tumor-normal samples ana-
lyzed using WGG platforms, non-informative homozygous
Genome Biology 2008, Volume 9, Issue 9, Article R136 Staaf et al. R136.3
Genome Biology 2008, 9:R136
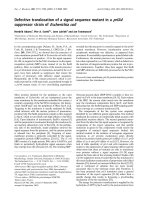
Transformation of B allele frequency data for a paired tumor sampleFigure 1
Transformation of B allele frequency data for a paired tumor sample. (a) BAF for chromosome 8 of breast tumor 2 (data set 1). (b) Copy number profile
of chromosome 8 with CBS segmentation profile superimposed in red. Gains (red bars) and losses (green bars) are called by comparison of the CBS
profile to log
2
-ratio thresholds (± 0.15). (c) B allele frequency for chromosome 8 with SNPs homozygous in the matched normal sample removed.
Horizontal dashed lines indicate positions of 0.97, 0.9, 0.1, 0.03 and 0.5 in BAF. (d) Transformation of BAF into mBAF for chromosome 8. SNPs
homozygous in the matched normal sample removed. Horizontal dashed lines indicate positions of 0.97, 0.9 and 0.5 in mBAF. (e) Segmentation of a paired
breast cancer mBAF profile. CBS was applied to mBAF data for chromosome 8 of breast tumor 2 (data set 1) after removal of SNPs homozygous in the
matched normal sample. CBS segmentation profile is superimposed in orange. Horizontal dashed lines indicate positions of 0.97, 0.9 and 0.5 in mBAF.
0.0
0.2
0.4
0.6
0.8
1.0
BAF
p23.3
p23.1
p21.3
p21.1
p11.21
q11.1
q11.22
q12.1
q12.3
q13.2
q21.11
q21.13
q21.3
q22.2
q23.1
q23.3
q24.12
q24.21
q24.23
-1
0
1
Log R ratio
p23.3
p23.1
p21.3
p21.1
p11.21
q11.1
q11.22
q12.1
q12.3
q13.2
q21.11
q21.13
q21.3
q22.2
q23.1
q23.3
q24.12
q24.21
q24.23
0.5
-0.5
(d)
(c)
(b)
(a)
0.0
0.2
0.4
0.6
0.8
1.0
BAF
0.6
0.8
1.0
mBAF
0.9
0.7
0.5
p23.3
p23.1
p21.3
p21.1
p11.21
q11.1
q11.22
q12.1
q12.3
q13.2
q21.11
q21.13
q21.3
q22.2
q23.1
q23.3
q24.12
q24.21
q24.23
p23.3
p23.1
p21.3
p21.1
p11.21
q11.1
q11.22
q12.1
q12.3
q13.2
q21.11
q21.13
q21.3
q22.2
q23.1
q23.3
q24.12
q24.21
q24.23
0.6
0.8
1.0
mBAF
0.9
0.7
0.5
p23.3
p23.1
p21.3
p21.1
p11.21
q11.1
q11.22
q12.1
q12.3
q13.2
q21.11
q21.13
q21.3
q22.2
q23.1
q23.3
q24.12
q24.21
q24.23
(e)
Genome Biology 2008, Volume 9, Issue 9, Article R136 Staaf et al. R136.4
Genome Biology 2008, 9:R136
SNPs may be identified and removed by comparison of SNP
genotype calls between the tumor and the matched normal,
resulting in a tumor-specific BAF profile (Figure 1c). Further-
more, since alleles for SNPs are, with respect to haplotypes,
arbitrarily called A or B, a set of genomically consecutive
SNPs will appear in BAF plots as horizontal bands that are
expected to be symmetrically positioned around 0.5. By per-
forming a reflection of BAF data along the 0.5 axis, we obtain
mirrored BAF (mBAF) estimates resembling a copy number
profile (Figure 1d). Homozygous SNPs (AA or BB) are thus
positioned at 1, while heterozygous SNPs are positioned at
0.5. A similar transformation was used in the recently
reported SOMATICs algorithm [17].
In DNA copy number analysis, segmentation methods such as
CBS [18] have been extensively tested for their ability to iden-
tify CNAs [20]. CBS can be directly applied to the mBAF
tumor profile in Figure 1d to identify the breakpoints of the
observed allelic imbalances (Figure 1e). When comparing the
segmented mBAF profile (Figure 1e) to the copy number pro-
file (Figure 1b) we find that the segmentation accurately
detects regions of allelic imbalance due to copy number loss
on 8p23.3 to 8p12 and 8q11.23 to 8q21.3, allelic imbalance
due to copy number gain on 8p11.23 to 8p11.21 and 8q22.2 to
8q24.12, and apparent copy neutral LOH on 8q24.13 to
8q24.3. In conclusion, we find that a segmentation-based
approach can be applied to Illumina WGG data to identify
regions of allelic imbalance in matched tumor-normal sam-
ples.
Generalization of the segmentation approach to
unpaired tumor samples
The initial step in the segmentation approach is to remove
non-informative homozygous SNPs from the tumor mBAF
profile. Thus, generalization of the segmentation approach to
unpaired tumor samples requires identification of non-
informative SNPs when a matched normal sample is not
available. Since the B allele frequency is a quantitative esti-
mate of the allelic proportion for a given SNP, expected mBAF
values for different types of allelic imbalances can be calcu-
lated for diploid genomes. An estimate of the tumor content
of the analyzed sample can thus be translated into a maximal
obtainable expected mBAF value for different types of allelic
imbalances. The highest expected mBAF value, 1, is obtained
for hemizygous loss or copy neutral LOH in a sample with
100% tumor content and no tumor heterogeneity. The highest
achievable expected mBAF value decreases when contami-
nating normal cells and/or tumor cell sub-clones are present.
An estimation of tumor content can be used for generalization
of the segmentation approach to unpaired tumor samples.
Based on tumor content, the maximal obtainable expected
mBAF value can be calculated and SNPs above this value can
be removed as in the procedure for matched tumor-normal
samples. For example, SNPs informative for a hemizygous
deletion are, on average, not expected to obtain mBAF values
larger than 0.91 for tumor samples with 10% normal cell con-
tamination. On the other hand, for samples of purity above
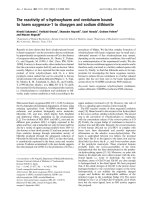
approximately 95%, using a fixed mBAF threshold for
removal of non-informative homozygous SNPs may be inap-
propriate. The reason is that the range in mBAF of SNPs
homozygous in all analyzed cells is often 0.97 to 1, as seen for
normal samples analyzed on Illumina BeadChips (Table 1,
Figure 2a). This variation makes non-informative
homozygous SNPs difficult to distinguish from SNPs affected
by tumor specific allelic imbalances for pure tumor samples.
Still, for tumor samples of purity below 90-95%, or tumor
samples of higher purity but with tumor cell subpopulations,
a fixed mBAF threshold is an effective single parameter
method for removing non-informative homozygous SNPs.
Applying a maximal mBAF cut-off of 0.97 to breast tumor 2
for removal of non-informative homozygous SNPs followed
by segmentation results in a similar segmentation profile
(Figure 2b) as when using the paired normal sample (Figure
1e). However, a fixed threshold may not fully remove non-
informative SNPs if it is set too high. See, for example, Figure
2b, where some SNPs with high mBAF values (mBAF >0.9)
are not removed compared to the matched case (Figure 1e).
To remove such remaining non-informative SNPs, we first
identify them by the absolute sum of the difference in mBAF
between an investigated SNP and the SNPs that, in the maxi-
mal mBAF filtered data, precede and succeed the SNP. Next,
SNPs having a deviation in mBAF from their neighboring
SNPs larger than a set threshold are removed. This filtering
process, herein referred to as triplet filtering (see Materials
Table 1
mBAF statistics for homozygous SNPs in HapMap samples analyzed on Illumina BeadChips
Data set Illumina platform Number of samples 95
th
percentile
mBAF
AA+BB
99
th
percentile
mBAF
AA+BB
Mean mBAF
AA
± SD Mean mBAF
BB
± SD
Reference 1 300k v1 111 0.99 0.973 0.998 ± 0.006 0.998 ± 0.006
Reference 2 300k v2 120 0.989 0.968 0.997 ± 0.005 0.998 ± 0.006
Reference 3 370k 123 0.98 0.961 0.993 ± 0.008 0.996 ± 0.009
Reference 4 550k 120 0.982 0.966 0.993 ± 0.008 0.998 ± 0.006
SD, standard deviation.
Genome Biology 2008, Volume 9, Issue 9, Article R136 Staaf et al. R136.5
Genome Biology 2008, 9:R136
and methods), is illustrated in Figure S1 in Additional data
file 1. To systematically evaluate the effect of triplet filtering,
we applied it to the paired urothelial tumors in data set 2. We
found that the addition of triplet filtering significantly
improved the removal of non-informative SNPs (Figure S1 in
Additional data file 1; Additional data file 2). In conclusion,
the segmentation strategy can be generalized for unpaired
tumor analysis by filtering out putative non-informative
homozygous SNPs based on their mBAF values. Furthermore,
normal cell contamination is advantageous for the segmenta-
tion strategy in unpaired tumor analysis, as the analyzed cells
are a mix of cells with allelic imbalance (tumor cells) and cells
with no imbalance (matched normal cells). This mix results in
a compression of BAF estimates that distinguishes tumor-
specific regions of allelic imbalance from non-informative
regions of homozygosity.
Calling of segmented regions as allelic imbalance
As illustrated in Figures 1e and 2b, segmentation can deline-
ate regions of apparently the same allelic proportions for both
paired and unpaired tumor samples. To differentiate regions
of allelic imbalance from the heterozygous state, we can apply
similar approaches as for calling CNAs from segmented data
in DNA copy number analysis. In its simplest form we use a
fixed mBAF threshold to compare segmented values against.
If the segmented value of a genomic region is above the
threshold, it is called as allelic imbalance. A fixed mBAF
threshold may be given biological meaning through the equa-
tions giving expected mBAF values for different types of
allelic imbalances (see Materials and methods). For example,
to detect hemizygous loss in 20% of analyzed cells implies a
maximum mBAF threshold of 0.56. We may also employ a
sample adaptive approach for estimating the mBAF threshold
as described for copy number analysis [19].
Figure 3 shows a schematic overview of the analysis steps in
the segmentation approach with parameters for paired and
unpaired tumor analysis. Using fixed thresholds, the number
of parameters to optimize is typically one for paired tumor
analysis (threshold for calling allelic imbalance) and two for
unpaired analysis (threshold for removing non-informative
SNPs and threshold for calling allelic imbalance). For the Illu-
mina data sets we have analyzed, we have not found that
other parameters (triplet-filtering cut-off, segmentation algo-
rithm parameters, and minimum segment size) need to be
tuned. If the threshold for removing non-informative SNPs in
an unpaired analysis is set too high, a large number of non-
informative SNPs may, for noisier samples, remain in the
tumor mBAF profile. Such SNPs may form non-informative
homozygous regions detected by the segmentation and falsely
identified as regions of allelic imbalance. If the threshold is
not optimized properly, haplotype correction [9] or size filter-
ing of segments with high mBAF values needs to be employed
to reduce the number of such false positive calls. When the
tumor content of the analyzed cells is known, false positive
segments can be filtered out on the basis of their segmented
mBAF values.
Evaluation and comparison of sensitivity and specificity
using simulated Illumina data
To investigate the sensitivity and specificity of the segmenta-
tion approach compared to other methods, we created a sim-
ulated data set based on experimental 550k Illumina data for
HapMap sample NA06991 (as described in Additional data
file 3). Briefly, to the diploid HapMap sample we added a
number of different CNAs and regions of copy neutral LOH to
Generalization of the segmentation approach to unpaired tumor samples using a fixed mBAF thresholdFigure 2
Generalization of the segmentation approach to unpaired tumor samples
using a fixed mBAF threshold. (a) Histogram of mBAF values for the
HapMap sample NA06991 (reference data set 4) hybridized on an Illumina
Infinium 550k BeadChip. Bins with homozygous SNPs (AA and BB) are
colored red. Bins containing heterozygous SNPs are colored yellow. (b)
mBAF profile of chromosome 8 for breast tumor 2 (data set 1) with SNPs
>0.97 in mBAF removed. CBS segmentation profile is superimposed in
red. Horizontal dashed line indicates position of 0.9 in mBAF.
(a)
(b)
0.6
0.8
1.0
mBAF
0.9
0.7
0.5
p23.3
p23.1
p21.3
p21.1
p11.21
q11.1
q11.22
q12.1
q12.3
q13.2
q21.11
q21.13
q21.3
q22.2
q23.1
q23.3
q24.12
q24.21
q24.23
mBAF
Number of SNPs
0
100,000
200,000
300,000
0.5 0.6 0.7 0.8 0.9 1
Flow chart of the analysis steps for the segmentation approach with parameters (in red) for paired and unpaired tumor analysisFigure 3
Flow chart of the analysis steps for the segmentation approach with
parameters (in red) for paired and unpaired tumor analysis.
Paired tumor - normal sample
Remove non-informative
homozygous SNPs
in tumor by comparison to
genotype in normal sample
Segmentation
− α
- Segment size
Unpaired tumor sample
Remove non-informative SNPs
in tumor with a fixed mBAF
threshold with triplet filter
Calling allelic imbalances
- Fixed mBAF threshold
Re
mov
e
non-in
f
orm
a
tiv
e
homozygous
S
NPs
i
n tumor
by
compar
i
son to
g
enotype
i
n norma
l
samp
le
- Threshold
- Triplet cut-off
Remove non-informative
S
NPs
in t
u
mor with
a
fix
ed
mBAF
t
hreshold with tri
p
let
f
ilter
-
Threshold
-
T
r
i
p
l
et cut-o
f
f
Genome Biology 2008, Volume 9, Issue 9, Article R136 Staaf et al. R136.6
Genome Biology 2008, 9:R136
mimic a tumor sample. The simulated tumor sample was next
diluted with normal cells creating a dilution series ranging
from 0-100% tumor cell content in 5% increments. The ability
to detect SNPs in allelic imbalance was evaluated for the seg-
mentation strategy in both a paired and an unpaired setting.
The performance of the segmentation strategy was compared
with three published copy number variation (CNV) or allelic
imbalance algorithms: PennCNV [12], QuantiSNP [13] and
SOMATICs [17]. PennCNV and QuantiSNP are HMM-based
methods developed for CNV analysis and should only detect
allelic imbalances originating from DNA copy number gain
and loss, whereas SOMATICSs also detects copy neutral
allelic imbalances.
First, we evaluated whether the methods identified regions of
allelic imbalance regardless of whether the methods also cor-
rectly identified the type of aberration (gain, loss or copy neu-
tral). We calculated sensitivities for each allelic imbalance
and overall specificities using SNPs heterozygous in the orig-
inal HapMap sample. In this analysis, the sensitivity for a
simulated allelic imbalance is the fraction of its SNPs that are
called as allelic imbalance, and the overall specificity is the
fraction of SNPs outside of all simulated allelic imbalances
that are not called.
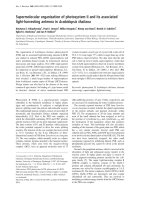
Sensitivities for detecting simulated allelic imbalances
regardless of whether the correct type of aberration was iden-
tified are shown in Figure 4. For lower normal cell contami-
nations (<40%), all methods showed high sensitivity and
concordance for detecting allelic imbalance originating from
copy number gains and losses. For higher normal cell con-
taminations the segmentation strategy outperformed both
PennCNV and QuantiSNP in both a paired and an unpaired
analysis setting. Compared to SOMATICs, the segmentation
strategy showed similar sensitivity throughout the dilution
range. Even though PennCNV and QuantiSNP should not
detect copy neutral events, we note that reducing calling to
allelic imbalance or not cause both methods to erroneously
detect copy neutral LOH regions, for example, chromosome
5p. The overall specificity was high (>99.99%) for PennCNV,
QuantiSNP and the segmentation strategy across the dilution
range (Figure 5a). SOMATICs showed the lowest specificity
across the dilution range (ranging from approximately 97% to
99%), mainly due to a large number of erroneously called
SNPs in the so-called red band of the algorithm. Additionally,
SOMATICs identified the largest erroneously called seg-
ments, ranging up to larger than and exceeding 500 hetero-
zygous SNPs in size (Figure 5b). Hence, SOMATICs obtains
sensitivities similar to the segmentation strategy at the
expense of identifying a larger number of false positive
regions.
The detection of copy neutral imbalances using PennCNV and
QuantiSNP led us to evaluate whether the methods, when
they identify a region in allelic imbalance, also call the correct
type of the aberration (gain, loss or copy neutral). In this sec-
ond evaluation, the sensitivity for a simulated allelic imbal-
ance is the fraction of its SNPs that are called as the correct
type of imbalance. The overall specificity is calculated as in
the previous evaluation with the addition that SNPs within an
imbalance called as the incorrect type also contribute to low-
ering the overall specificity. For the segmentation strategy we
used fixed cut-offs for the average log R ratio of SNPs in
regions called as allelic imbalance to also call the type of aber-
ration (see Materials and methods). The segmentation strat-
egy had higher sensitivity than SOMATICs for correctly
identifying gains and losses (Figure S2 in Additional data file
1). The CNV calling algorithm in SOMATICs repeatedly failed
to call several regions of gain and loss correctly. Compared to
only identifying allelic imbalance, the overall specificity for
correct identification of the type of simulated allelic imbal-
ance was considerably lower for PennCNV, QuantiSNP and
SOMATICs, whereas it was high for the segmentation strat-
egy also in this case (Figure 5c).
The segmentation strategy was, with the simulated data, able
to detect regions of copy neutral LOH when the tumor con-
tent was only 15%. For hemizygous loss the maximum normal
cell contamination that allowed detection was 75-80%, which
corresponds well to the used mBAF threshold of 0.56 for call-
ing allelic imbalance (hemizygous loss in >21% of analyzed
cells). Single copy gain was detected with up to 75% normal
cell contamination. Differences in sensitivity between paired
and unpaired segmentation were seen for small allelic imbal-
ances in samples of high tumor content. The low sensitivity
for the 126 kb hemizygous loss on 13q13.1 for unpaired seg-
mentation with 0-10% normal cell contamination is due to
the fixed mBAF threshold of 0.97 for removing putatively
non-informative homozygous SNPs (Figure 4). With this
threshold value several of the tumor-specific homozygous
SNPs for this CNA are removed, making it difficult to detect
by segmentation.
BAF and copy number profiles for the simulated data set with
regions called as allelic imbalance marked for PennCNV,
QuantiSNP, SOMATICs, unpaired segmentation, and paired
segmentation are available as described in Additional data
file 4. In conclusion, we find that the segmentation strategy
can sensitively detect different types of allelic imbalances in
highly heterogeneous samples and perform well compared
with other published methods.
Evaluation and comparison of sensitivity using an
experimental Illumina dilution series
To investigate the ability of the segmentation approach to
detect allelic imbalances in experimental Illumina data, we
generated a dilution series of the CRL-2324 breast cancer cell
line on Illumina 370k BeadChips (data set 3). In addition to
the methods applied to the simulated data (segmentation,
PennCNV, QuantiSNP, and SOMATICs), we also included
dChipSNP in this comparison. Since dChipSNP is a SNP gen-
otype call-based method it could not be applied to the simu-
Genome Biology 2008, Volume 9, Issue 9, Article R136 Staaf et al. R136.7
Genome Biology 2008, 9:R136
lated data in which genotype calls were not simulated. CRL-
2324 cells display a complex genetic make-up with polyploid
cell populations having varying ploidy indices [21]. Aneu-
ploidy may confound normalization and data interpretation
of Illumina WGG data [6]. Normalization of Illumina WGG
data in BeadStudio is made under the assumption that
homozygous SNPs exist, on average, in two copies [6], an
assumption that can lack validity for aneuploid tumor sam-
ples. Substantiating this concern, we observed for the CRL-
2324 dilution series that BeadStudio normalization results in
copy number profiles that are centered differently as the
tumor content decreases (Figure 6a-c). As a consequence of
Comparison of sensitivity for detecting ten simulated allelic imbalances for different methodsFigure 4
Comparison of sensitivity for detecting ten simulated allelic imbalances for different methods. Heterozygous SNPs in NA06991 were used to estimate the
sensitivity for the methods in detecting allelic imbalances in the simulated data set with increasing normal cell contamination. Sensitivity was calculated for
each method based on calls for allelic imbalance or not. Lines correspond to sensitivity for PennCNV (black), QuantiSNP (green), unpaired segmentation
(red), paired segmentation (orange), and SOMATICs (blue).
Copy Neutral LOH chr 5p Hemizygous loss chr 5q22
Single copy gain chr 8p Single copy gain chr 8q24
Hemizygous loss chr 9p Hemizygous loss chr 10q23.1−q23.33
Trisomi chr 12 Hemizygous loss chr 13q13.1
Copy Neutral LOH chr 17p13.1−p12 Copy Neutral LOH chr 17q
Sensitivity
0
0.2
0.4
0.6
0.8
1
Sensitivity
0
0.2
0.4
0.6
0.8
1
Normal cell contamination (%)
0 10 203040506070 8090100
Normal cell contamination (%)
0 102030405060708090100
Sensitivity
0
0.2
0.4
0.6
0.8
1
Sensitivity
0
0.2
0.4
0.6
0.8
1
Normal cell contamination (%)
0 102030405060708090100
Normal cell contamination (%)
0 102030405060708090100
Sensitivity
0
0.2
0.4
0.6
0.8
1
Sensitivity
0
0.2
0.4
0.6
0.8
1
Normal cell contamination (%)
0 102030405060708090100
Normal cell contamination (%)
0 102030405060 708090100
Sensitivity
0
0.2
0.4
0.6
0.8
1
Sensitivity
0
0.2
0.4
0.6
0.8
1
Normal cell contamination (%)
0 102030405060 708090100
Normal cell contamination (%)
0 102030405060708090100
Sensitivity
0
0.2
0.4
0.6
0.8
1
Sensitivity
0
0.2
0.4
0.6
0.8
1
Normal cell contamination (%)
0 102030405060708090100
Normal cell contamination (%)
0 102030405060708090100
Unpaired segmentation
Paired segmentation
QuantiSNP
PennCNV
SOMATICs
Genome Biology 2008, Volume 9, Issue 9, Article R136 Staaf et al. R136.8
Genome Biology 2008, 9:R136
this variation in centering, many of the methods will call the
same type of allelic imbalance differently (gain, loss, or copy
neutral) depending on how much the tumor is diluted. There-
fore, we evaluated the methods using calls of allelic imbalance
without regarding the type of aberrations.
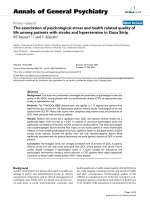
Sensitivity was determined for eight different CNAs having
BAF values in the undiluted cancer cell line consistent with
presence in all tumor cells (Figure 7). We found that the seg-
mentation approach outperformed PennCNV, QuantiSNP
and dChipSNP in sensitivity when tumor content was less
than 50%. SNP call-based methods, such as dChipSNP, have
been reported to be unable to detect regions of LOH when
tumor content is less than 50% (corresponding to an mBAF of
0.66 for hemizygous loss), despite available paired constitu-
tive DNA [14]. Aneuploidy is problematic for model-based
HMM methods when detecting allelic imbalances. For exam-
ple, using Penn CNV and QuantiSNP, the single copy gain on
chromosome 13q11-q12.3 is not detected in the pure breast
cancer cell line (Figures 6a and 7). This failure is a conse-
quence of how BeadStudio centers the copy number profile. A
further investigation of the normalization of tumor samples
analyzed on Illumina WGG arrays is thus warranted. In con-
cordance with the simulated data, the segmentation approach
showed similar sensitivity as SOMATICs with decreasing
tumor content for all allelic imbalances; except for the single
copy gain on chromosome 20p, which was better detected by
SOMATICs (Figure 7).
Application of the segmentation approach to
experimental Illumina tumor data sets
To investigate the performance of the segmentation approach
in solid tumors, we applied it to two data sets containing
matched tumor-normal samples (data sets 1 and 2). By
removal of SNPs homozygous in the paired normal sample we
generated a tumor specific BAF profile for each sample (as in
Figure 1c), which was transformed to an mBAF profile (as in
Figure 1d). A method for sensitive detection of allelic imbal-
ances in tumors should detect genomic regions containing
SNPs with small but distinct differences in mBAF compared
to the 0.5 mBAF baseline. Consequently, to compare meth-
ods, we calculated the number of SNPs detected as allelic
imbalance across a data set for different tumor specific mBAF
values (Figure 8). We found that the segmentation strategy
outperforms PennCNV, QuantiSNP and dChipSNP for both
data sets in detecting SNPs at lower mBAF values. The seg-
mentation strategy performs similar to SOMATICs in both
data sets down to mBAF values as low as 0.56, which was used
as the cut-off to call allelic imbalance in the segmentation
strategy. Paired BAF and copy number profiles for seven
paired tumor samples (data sets 1 and 2) with regions called
as allelic imbalance marked for PennCNV, QuantiSNP,
dChipSNP, SOMATICs, and unpaired segmentation are avail-
able as described in Additional data file 4.
Detection of homozygous deletions using the B allele fre-
quency alone can be challenging [22]. In the case of complete
homozygous deletion in all investigated cells no genetic mate-
rial remains and the BAF estimates become essentially ran-
dom due to the low SNP signal intensity [22]. With an
increasing fraction of normal cell contamination, BAF esti-
mates for homozygously deleted regions will eventually
become indistinguishable from regions of 2N (Figure 6a-c).
However, homozygous deletions frequently occur within
regions of somatic LOH in tumor specimens. Such events can
create a clearly distinguishable pattern detectable by the seg-
Comparison of specificity for detecting simulated allelic imbalances for different methodsFigure 5
Comparison of specificity for detecting simulated allelic imbalances for
different methods. Heterozygous SNPs in NA06991 were used to
estimate the specificity of methods for detecting allelic imbalances with
increasing normal cell contamination in the simulated data set. (a)
Specificity for calls of allelic imbalance or not in the simulated data set.
Lines correspond to specificity for PennCNV (black), QuantiSNP (green),
unpaired segmentation (red), paired segmentation (orange), and
SOMATICs (blue). (b) Size and number of erroneously called regions for
PennCNV (black), QuantiSNP (green), unpaired segmentation (red),
paired segmentation (orange), and SOMATICs (blue) across the entire
simulated data set. Segment size is in consecutive erroneously called
heterozygous SNPs. Only regions larger than four heterozygous SNPs are
shown. (c) Specificity for correct calling of the type of allelic imbalance in
the simulated data set. Lines correspond to specificity for PennCNV
(black), QuantiSNP (green), unpaired segmentation (red), paired
segmentation (orange), and SOMATICs (blue).
(a)
(b)
Normal cell contamination (%)
0 102030405060708090100
Specificity
0.95
0.96
0.97
0.98
0.99
1
PennCNV
QuantiSNP
Unpaired segmentation
Paired segmentation
SOMATICs
0
40
80
120
Segments
Segment size (heterozygous SNPs)
4-10 10-20 20-100 100-200 200-700
Normal cell contamination (%)
0 102030405060708090100
(c)
Specificity
0.8
0.84
0.88
0.92
0.96
1
Genome Biology 2008, Volume 9, Issue 9, Article R136 Staaf et al. R136.9
Genome Biology 2008, 9:R136
mentation approach (Figure 9). Nevertheless, homozygous
deletions are, in general, probably best detected from analyz-
ing copy number ratios [6].
While the segmentation strategy is designed to identify LOH
and allelic imbalances in heterogeneous cancer samples,
germline CNVs can be either missed or detected depending
Allelic imbalances in CRL-2324 cells used for estimation of tumor dilution percentage by segmentationFigure 6
Allelic imbalances in CRL-2324 cells used for estimation of tumor dilution percentage by segmentation. CRL-2324 breast cancer cells were hybridized on
Illumina 370k BeadChips in a dilution series with matched normal DNA (data set 3). For all parts, the left panel shows B allele frequency estimates and the
right panel log R ratios. Bars indicate allelic imbalances detected by unpaired segmentation (red), SOMATICs (blue), PennCNV (black), QuantiSNP (green)
and dChipSNP (purple). (a) Copy neutral LOH on 13q21.31-qter and single copy gain on 13q11-q12.3 in 100% CRL-2324 cells. (b) Copy neutral LOH on
13q21.31-qter and single copy gain on 13q11-q12.3 with 50% tumor fraction. (c) Copy neutral LOH on 13q21.31-qter and single copy gain on 13q11-q12.3
with 30% tumor fraction. (d) Hemizygous loss on chromosome 18q21.32-q22.3 with 50% tumor fraction.
(b)
0
1
0.8
0.6
0.4
0.2
BAF
0
1
-1
13q12.3
13q11
13q21.31
13q12.3
13q
11
13q21.31
13q12.3
13q11
13q21.31
13q12.3
13q11
13q21.31
13q12.3
13q
1
1
13q21.31
13q12.3
13q
1
1
13q21.31
2
-2
Log R ratio
0
1
-1
2
-2
Log R ratio
0
1
-1
2
-2
Log R ratio
0
1
0.8
0.6
0.4
0.2
BAF
0
1
0.8
0.6
0.4
0.2
BAF
0
1
0.8
0.6
0.4
0.2
BAF
0
1
-1
2
-2
Log R ratio
18q22.3
18q21.32
18q22.3
18q21.32
Unpaired segmentation
dChipSNP
QuantiSNP
PennCNV
SOMATICs
(a)
(c)
(d)
Genome Biology 2008, Volume 9, Issue 9, Article R136 Staaf et al. R136.10
Genome Biology 2008, 9:R136
on their genotype and size. Germline CNVs involving loss
result in BAF profiles identical to hemizygous loss in pure
tumor samples and hence may be detected due to the absence
of heterozygous loci if the CNVs are sufficiently large. Small
germline CNVs involving gain of genetic material are not
detected if the affected SNPs only show a homozygous geno-
type (for example, AAA or BBB, giving mBAF values close to
1). Larger germline CNVs involving gain may be detected sim-
ilarly as for tumors with gain of genetic material.
Estimating cellular composition of samples from
segmented B allele frequencies
BAF values in combination with copy number status allow for
a direct estimation of the proportion of cells displaying a cer-
tain allelic imbalance [22]. For a diploid genome, theoretical
BAF values for allelic imbalances such as single copy gain,
hemizygous loss or copy neutral LOH can be determined for
varying percentages of normal cell contamination. Further-
more, knowledge of the sample purity can be used to estimate
the fraction of tumor cells affected by an allelic imbalance.
Two studies have used different approaches to demonstrate
how BAF data can be used to estimate normal cell contamina-
Comparison of sensitivity for detecting eight different allelic imbalances in the CRL-2324 dilution series for five methodsFigure 7
Comparison of sensitivity for detecting eight different allelic imbalances in the CRL-2324 dilution series for five methods. Lines correspond to sensitivity
for PennCNV (black), QuantiSNP (green), unpaired segmentation (red), SOMATICs (blue), and dChipSNP (purple).
Hemizygous loss 6q14.3−mid q15 Hemizygous loss mid 6q15−16
Sensitivity
0
0.2
0.4
0.6
0.8
1
Single copy gain 13q11−q12 Amplification 13q13.1−mid q13
Copy Neutral LOH 13q14.2−13q14
Copy Neutral LOH 13q21.31−qter
100 79 50 47 45 34 30 23 21 14 10 0
Hemizygous loss 18q21.32−q22 Single copy gain 20p
Sensitivity
0
0.2
0.4
0.6
0.8
1
Sensitivity
0
0.2
0.4
0.6
0.8
1
Sensitivity
0
0.2
0.4
0.6
0.8
1
Sensitivity
0
0.2
0.4
0.6
0.8
1
Sensitivity
0
0.2
0.4
0.6
0.8
1
Sensitivity
0
0.2
0.4
0.6
0.8
1
Sensitivity
0
0.2
0.4
0.6
0.8
1
100 79 50 47 45 34 30 23 21 14 10 0
100 79 50 47 45 34 30 23 21 14 10 0 100 79 50 47 45 34 30 23 21 14 10 0
100 79 50 47 45 34 30 23 21 14 10 0 100 79 50 47 45 34 30 23 21 14 10 0
Tumor (%)
100 79 50 47 45 34 30 23 21 14 10 0 100 79 50 47 45 34 30 23 21 14 10 0
Unpaired segmentation
dChipSNP
QuantiSNP
PennCNV
SOMATICs
Tumor (%)
Tumor (%)
Tumor (%)
Tumor (%)
Tumor (%)
Tumor (%)
Tumor (%)
Genome Biology 2008, Volume 9, Issue 9, Article R136 Staaf et al. R136.11
Genome Biology 2008, 9:R136
tion for tumor samples [17,22]. We have derived equations for
how mBAF values expected for different types of allelic imbal-
ances depend on the fraction of cells harboring the imbalance
(see Materials and methods). Nancarrow et al. [22] do not
present equations, but for the different allelic imbalances in
the simulated dilution series we obtain, using their software
SiDCoN, theoretical BAF values identical to those obtained
with our equations. We conclude that the equations we have
derived are identical to the approach used by Nancarrow et al.
Since the segmented mBAF value of a genomic region repre-
sents an average of the investigated SNPs, it can directly be
used for estimation of the fraction of cells not affected by an
allelic imbalance. We first evaluated the accuracy of the seg-
mented value as a tool for estimation of tumor content in het-
erogeneous samples using the simulated data set. The
simulated tumor content was compared to the value calcu-
lated from the observed segmented mBAF values for three
different types of allelic imbalances. The segmentation
approach finds the theoretical values with high accuracy and
provides close estimates of the simulated tumor content
(Table 2). The discrepancy for the unpaired tumor setting
Total number of tumor specific SNPs detected as allelic imbalance in two paired tumor data sets plotted against their mBAF values for five methodsFigure 8
Total number of tumor specific SNPs detected as allelic imbalance in two
paired tumor data sets plotted against their mBAF values for five methods.
From each tumor, SNPs homozygous in the matched blood were
removed. Only SNPs in segments of allelic imbalance >5 SNPs in size and
with an average mBAF value ≥0.56 were counted and summarized across
all samples in a data set. Lines correspond to the different methods:
PennCNV (black), QuantiSNP (green), unpaired segmentation (red),
SOMATICs (blue), and dChipSNP (purple). Vertical solid line corresponds
to 0.56 in mBAF. (a) Total number of SNPs detected as allelic imbalance at
different mBAF levels for the paired urothelial tumor data set (data set 2).
(b) Cumulative number of SNPs detected at different mBAF levels for the
paired urothelial tumor data set. (c) Total number of SNPs detected as
allelic imbalance at different mBAF levels for the paired breast/colon
tumor data set (data set 1). (d) Cumulative number of SNPs detected at
different mBAF levels for the paired breast/colon tumor data set.
0
60
40
20
0.5 10.6 0.7 0.8 0.9
0.5 10.6 0.7 0.8 0.9
mBAF
mBAF
0
500
400
300
200
100
(a)
(b)
0.5 10.6 0.7 0.8 0.9
mBAF
0.5 10.6 0.7 0.8 0.9
mBAF
(c)
(d)
0
150
50
100
0
50
40
30
20
10
SNPs (x10
3
)
SNPs (x10
3
) SNPs (x10
3
)
SNPs (x10
3
)
Unpaired segmentation
dChipSNP
QuantiSNP
PennCNV
SOMATICs
Detection of homozygous deletions in various tumor samples by the segmentation approachFigure 9
Detection of homozygous deletions in various tumor samples by the
segmentation approach. All samples are hybridized on Illumina 300k or
370k BeadChips. For all parts, the upper panel shows the mirrored B allele
frequency profile and the bottom panel shows the copy number profile.
Red lines represents the CBS segmentation profile. Horizontal dashed
lines in the mBAF panel represents the threshold for calling allelic
imbalance (0.56). (a) Chromosome 13 of CLL sample 7 (data set 4) with a
homozygous deletion on 13q14 in 80% of analyzed tumor cells. (b)
Homozygous deletion of CDKN2A on chromosome 9p21.3 in urothelial
tumor UC211_R (data set 2). (c) Homozygous deletions on chromosome
2q34 and 2q37.2 in breast tumor 1 (data set 1).
0.5
0.6
0.7
0.8
0.9
1.0
mBAF
−3
−2
−1
0
1
2
Log R Ratio
13q14.2
3
0.5
0.6
0.7
0.8
0.9
1.0
mBAF
−6
−4
−2
0
2
Log R Ratio
9p21.3
9p21.3
0.5
0.6
0.7
0.8
0.9
1.0
mBAF
−10
−5
0
Log R Ratio
2q34 2q37.2
2q34 2q37.2
(a)
(b)
(c)
Genome Biology 2008, Volume 9, Issue 9, Article R136 Staaf et al. R136.12
Genome Biology 2008, 9:R136
Table 2
Estimation of tumor cell content from simulated data using segmentation
Tumor Tumor cells using hemizygous loss (%)* Tumor cells using single copy gain (%)
†
Tumor cells using copy neutral LOH (%)
‡
cells (%) Paired Unpaired Paired Unpaired Paired Unpaired
0- - - - - -
5- - - - - -
10 - - - - - -
15 - - - - 15 15
20 - - - - 21 21
25 26 26 - - 25 25
30 30 30 31 31 30 30
35 35 35 36 36 35 35
40 40 40 41 41 40 40
45 45 45 45 45 45 45
50 50 50 50 50 49 49
55 55 55 55 55 55 55
60 59 59 60 60 60 61
65 65 65 65 65 64 65
70 70 70 70 70 69 70
75 75 75 75 75 75 75
80 80 80 80 80 80 80
85 85 85 85 85 85 84
90 90 90 90 90 89 86
95 95 93 96 96 94 88
100 99 95 101 101 97 89
*Hemizygous loss on chromosome 10q23.1-q23.33.
†
Mono allelic gain on chromosome 8p.
‡
Copy neutral LOH on 17p13.1-p12. Dashes indicate 'not
detected'.
Table 3
Estimation of tumor content by segmentation in the CRL-2324 dilution series (data set 3)
Hemizygous loss 18q21.32-q22.3
†
Single copy gain 13q11-q12.3
‡
CNN LOH 13q21.31-qter
§
Tumor (%)* Expected
mBAF
Observed
mBAF
Tumor (%) Expected
mBAF
Observed
mBAF
Tumor (%) Expected
mBAF
Observed
mBAF
Tumor (%)
0 0.5 0.53 12 0.5 0.53 15 0.5 0.53 6
10 (7-12) 0.53 0.53 11 0.52 0.53 12 0.55 0.54 7
14 (10-17) 0.54 0.53 12 0.53 0.53 12 0.57 0.55 9
21 (17-26) 0.56 0.55 18 0.55 0.54 16 0.6 0.58 16
23 (18-28) 0.56 0.6 32 0.55 0.56 28 0.62 0.64 28
30 (24-35) 0.59 0.58 27 0.57 0.55 21 0.65 0.62 24
34 (28-40) 0.60 0.59 31 0.57 0.55 23 0.67 0.64 29
45 (38-51) 0.65 0.61 37 0.59 0.56 27 0.72 0.67 33
47 (40-54) 0.65 0.65 46 0.6 0.57 35 0.74 0.71 42
50 (43-57) 0.67 0.64 43 0.6 0.57 30 0.75 0.7 39
79 (74-83) 0.83 0.84 81 0.64 0.6 51 0.9 0.89 77
100 1 0.93 93 0.67 0.65 88 1 0.95 89
*95% confidence interval within parentheses.
†
Hemizygous loss chr18:54400001-71300000.
‡
Single copy gain chr13:16000001-31100000.
§
Copy
number neutral LOH chr13:60500001-114142980.
Genome Biology 2008, Volume 9, Issue 9, Article R136 Staaf et al. R136.13
Genome Biology 2008, 9:R136
when tumor content is above 95% is due to the fixed mBAF
threshold of 0.97 used to filter our SNPs believed to be non-
tumor specific.
To verify the accuracy of the segmented value in experimental
Illumina data, we applied it to the CRL-2324 dilution series
(data set 3). Three different allelic imbalances with 100%
penetrance in CRL-2324 cells were selected (Figure 6) for
comparing the tumor content estimated by segmentation
with the dilution percentage. In concordance with the simu-
lated data, we found that the segmentation approach provides
close estimates of the theoretical mBAF values and can accu-
rately estimate tumor content in experimental Illumina data
(Table 3). The discrepancy for 100% tumor content is due to
the fixed mBAF threshold of 0.97. Furthermore, the expected
value for 0% tumor content is not in reality 0.5 due to the
transformation from BAF to mBAF. The experimental CRL-
2324 dilution series shows the expected linear compression of
mBAF for the 13q21.31-qter copy neutral LOH region (Figure
10a). Tumor content appears to be best estimated from
regions of hemizygous loss or copy neutral LOH, due to their
larger span in mBAF (Figure 10b). Discrepancies between the
dilution percentage and the estimated percentage from seg-
mentation may in part be explained by uncertainty in the
measured DNA content, which introduces bias in the
expected dilution percentages (Table 3). Such bias may
explain differences seen in sensitivity between the simulated
data set (Figure 4) and the CRL-2324 dilution series (Figure
7) for low tumor contents. Due to the chosen mBAF threshold
of 0.56 for calling allelic imbalance, hemizygous loss cannot
be detected below 20%, and single copy gain not below 25%
tumor content.
When the tumor content of the analyzed cells is known, the
segmentation strategy can be used to estimate the tumor sub-
clone content for allelic imbalances. A reported comparison
of four different array platforms for detection of CNAs and
LOH in chronic lymphocytic leukemias (CLLs) included fluo-
rescent in situ hybridization (FISH) verifications of a number
of hemizygous losses observed in tumor cell subpopulations
[23]. We applied the segmentation strategy to the Illumina
data from this CLL study (data set 4). Our results demon-
strate that the tumor cell sub-clone content for hemizygous
losses can be accurately estimated from the segmented mBAF
value (Table 4). Furthermore, the percentage of cells affected
by copy number neutral LOH can also be estimated using the
segmented value. CLL sample 7 was shown to be copy neutral
for chromosome 13, besides a homozygous loss of 13q14 [23]
(Figure 9a). Of the tumor cells, 11% were found to have
hemizygous loss of 13q14 and 80% to have homozygous loss
by FISH [23]. However, the mBAF profile reveals allelic
imbalance of the whole chromosome, implying copy neutral
LOH (Figure 9a). Using the segmented value for chromosome
13, excluding 13q14, we estimated the percentage of tumor
cells affected by the copy neutral LOH to be 83%. Intrigu-
ingly, this estimated percentage closely matches the fraction
of tumor cells shown to have the homozygous loss by FISH
(80%) [23]. This observation suggests that a small fraction of
tumor cells carry only the hemizygous loss of 13q14 found by
FISH, while the larger population has both the bi-allelic loss
on 13q14 and loss of one allele followed by duplication of the
remaining allele for chromosome 13.
Estimation of tumor content is difficult and usually rare for
solid tumors. Tumor content and tumor cell sub-clone con-
tent can be estimated with the segmentation approach under
certain assumptions. For example, by assuming that a certain
allelic imbalance occurs in all tumor cells, normal cell con-
tamination becomes the sole driving force behind BAF com-
pression. In this case, the tumor cell content can be estimated
from the segmented value of the imbalance. Once the tumor
cell content is estimated, the fraction of tumor cells affected
by every other allelic imbalance can be calculated. In conclu-
sion, we have shown that the segmentation strategy can be
Theoretical and observed mBAF values for different types of allelic imbalances with increasing tumor content for the CRL-2324 dilution seriesFigure 10
Theoretical and observed mBAF values for different types of allelic
imbalances with increasing tumor content for the CRL-2324 dilution
series. (a) Linearity of segmented mBAF values for the copy neutral LOH
region on 13q21.31-qter across the CRL-2324 dilution series. The red line
corresponds to expected mBAF values and the gray line to a linear
regression fit for experimental data between 0% and 100% tumor content,
for which c represents the tumor fraction. (b) Theoretical mBAF values
for different allelic imbalances: hemizygous loss (black line), copy number
neutral LOH (red line), single copy gain (green line), and 4N amplification,
for example, BBBA (blue line).
Tumor content (%)
mBAF
0 102030405060708090100
0.5
0.6
0.7
0.8
0.9
1.0
Hemizygous loss (B)
CNN LOH (BB)
Single copy gain (BBA)
4N amplification (BBBA)
0.5
0.6
0.7
0.8
0.9
1.0
mBAF
mBAF = 0.475c + 0.485 with R
2
= 0.95
Tumor content (%)
0 102030405060708090100
(a)
(b)
Genome Biology 2008, Volume 9, Issue 9, Article R136 Staaf et al. R136.14
Genome Biology 2008, 9:R136
used to accurately estimate normal cell contamination and
the fraction of cells affected by an allelic imbalance.
Application of the segmentation approach to
Affymetrix WGG data
Allelic imbalances for Affymetrix data are usually not dis-
played using BAF plots. BAF estimates can, however, be gen-
erated for Affymetrix WGG data in a similar fashion as for
Illumina [23]. Technical variation in BAF estimates appears
to differ between Affymetrix and Illumina WGG data as
observed in Gunnarsson et al. [23]. The difference is further
illustrated in Figure S3 in Additional data file 1 for an urothe-
lial carcinoma hybridized on an Illumina 370k BeadChip and
on an Affymetrix 250k Nsp array. The values for the thresh-
olds in the segmentation strategy need to be modified in order
for the strategy to handle the larger variation in Affymetrix
BAF estimates (Figure S4 in Additional data file 1). Due to
larger variation for homozygous SNPs, both the mBAF
threshold and the triplet cut-off need to be reduced to filter
out non-informative SNPs. As a consequence, the sensitivity
is reduced for tumor samples of high purity. Additionally, the
increased mBAF variation results in increased average values
for segments. By replacing the mean with the median in the
CBS algorithm when determining the segmented value for a
genomic region, such increases can be counteracted.
Applying the segmentation strategy to two urothelial tumors
analyzed on Affymetrix 250k Nsp arrays demonstrates how
regions of allelic imbalance in solid tumors, missed by both
dChipSNP and CNAG [24], can be detected (Figure 11). To
estimate the tumor fraction affected by specific allelic imbal-
ances, we applied the segmentation approach to Affymetrix
data for CLL cases 8, 9 and 10 (data set 4) and investigated the
same hemizygous deletions as we did using the Illumina data.
For the hemizygous losses we obtained the tumor content
estimates 75%, 56% and 85%, respectively, which are compa-
rable to the results for the Illumina data (Table 4) and also
closely match the FISH results. The percentage of tumor cells
affected by copy neutral LOH on chromosome 13 in CLL sam-
ple 7 was, as for the Illumina data, estimated to be 83% using
the segmented mBAF value. B allele frequency and copy
number profiles for the two urothelial tumors in data set 5
with regions called as allelic imbalance marked for CNAG,
dChipSNP, and unpaired segmentation are available as
described in Additional data file 4. In conclusion, the segmen-
tation approach can be applied to Affymetrix WGG data with
Table 4
Estimation of tumor cell sub-clone content by segmentation for hemizygous loss in CLL samples
Sample* CLL cells (%)
†
Genomic region Hemizygous loss by FISH (%) Hemizygous loss by segmentation (%)
‡
8 87 17p13.3-p11.1 73 77
9 90 11q22.1-q23.3 56 58
10 86 17p13.3-p11.2 90 94
*Data set 4. mBAF cut-off for each sample based on the maximum theoretical value for copy neutral LOH for the respective tumor content.
†
Percent CLL cells (CD5
+
/CD23
+
) were estimated by flow cytometry.
‡
The average segmented value for the region was used.
Application of the segmentation strategy to urothelial tumors hybridized on Affymetrix 250 k Nsp arraysFigure 11
Application of the segmentation strategy to urothelial tumors hybridized on Affymetrix 250k Nsp arrays. Bars indicate allelic imbalances detected by
unpaired segmentation (red), CNAG (blue), and dChipSNP (purple). In both parts, the top panel shows BAF estimates and the lower panel copy number
estimates for two samples in data set 2. (a) Chromosome 9 of urothelial tumor UC1. (b) Chromosome 3 of urothelial tumor UC3.
0
0.2
0.4
0.6
0.8
1
2
-2
0
-1
1
BAFLog R ratio
Chromosome 9
Chromosome 9
0
0.2
0.4
0.6
0.8
1
2
-2
0
-1
1
BAFLog R ratio
Chromosome 3
Chromosome 3
(a) (b)
Unpaired segmentation
dChipSNP
CNAG
Genome Biology 2008, Volume 9, Issue 9, Article R136 Staaf et al. R136.15
Genome Biology 2008, 9:R136
modified parameter values to address the larger variation in
BAF estimates for this platform.
Conclusion
We demonstrate that a segmentation-based strategy may suc-
cessfully be applied to WGG data for sensitive detection of
regions affected by LOH or allelic imbalance in samples with
a high degree of heterogeneity. The strategy can be applied to
data derived from different WGG platforms both for unpaired
and paired LOH analysis. We obtain results highly concord-
ant with several other methods but with increased sensitivity
and high specificity for detecting allelic imbalances in hetero-
geneous samples. We also demonstrate that the segmentation
strategy can be used to identify allelic imbalances only
present in sub-clones and to provide accurate estimates of the
fraction of cells affected by allelic imbalances. The proposed
segmentation strategy represents a valuable new platform
independent tool for analysis of high density WGG data.
Materials and methods
Experimental data sets
We used five tumor data sets to evaluate and compare the
proposed segmentation strategy together with reference data
sets for the different Illumina platforms. Data set 1 consists of
six hybridizations on Illumina HumanHap300 version 1 Gen-
otyping BeadChips representing one colon cancer and two
breast cancer tumors, with matched normal samples (Cour-
tesy of Illumina Inc., San Diego, CA, USA). Data set 2 consists
of 15 urothelial carcinomas hybridized on HumanCNV370
Genotyping BeadChips together with matched normal sam-
ples. Data set 3 consists of a dilution series for the breast can-
cer cell line CRL-2324 [21] hybridized on HumanCNV370
Genotyping BeadChips. Genomic DNA from CRL-2324 and
its matched normal cell line (CRL-2325) was obtained from
ATCC [25]. Dilutions (0, 10, 14, 21, 23, 30, 34, 45, 47, 50, 79
and 100% tumor DNA content) were made by mixing tumor
DNA with normal matched DNA. DNA concentrations were
determined using the Qubit picogreen fluorometric assay
(Invitrogen, Carlsbad, CA, USA). To obtain confidence inter-
vals for the tumor DNA content of the dilutions, a series of
replicate measurements of DNA concentrations were per-
formed and a coefficient of variation (CV) of 10% was
obtained. This CV is similar to findings by others for
picogreen assays [26,27]. A CV of 10% was, using error prop-
agation, turned into an estimated standard deviation of the
tumor DNA fraction for each dilution experiment. These
standard deviations were turned into 95% confidence inter-
vals using a normal approximation. Data set 4 consists of ten
CLL cases hybridized on Illumina HumanHap300 version 2
Genotyping BeadChips and Affymetrix 250k Nsp arrays [23].
Data set 5 consists of two urothelial carcinomas obtained
from the same patient and a matched normal sample hybrid-
ized on Affymetrix 250k Nsp arrays. Call rates for data set 5
were 97.2%, 97.3% and 95.9%, respectively, using the DM
algorithm. Reference data set 1 consists of 111 HapMap [28]
samples hybridized on Illumina HumanHap300 version 1
Genotyping BeadChips (Courtesy of Illumina Inc.). Reference
data set 2 consists of 120 HapMap samples hybridized on Illu-
mina HumanHap300 version 2 Genotyping BeadChips
(Courtesy of Illumina Inc.). Reference data set 3 consists of
123 HapMap samples hybridized on Illumina
HumanCNV370 Genotyping BeadChips (Courtesy of Illu-
mina Inc.). Reference data set 4 consists of 120 HapMap sam-
ples hybridized on Illumina HumanHap550 Genotyping
BeadChips (Courtesy of Illumina Inc.). Illumina hybridiza-
tions for data set 4 were performed at the SNP technology
platform in Uppsala, Sweden [29] according to the manufac-
turer's instructions. Illumina hybridizations for data sets 2
and 3 and Affymetrix hybridizations for data set 5 were per-
formed at the SCIBLU Genomics Centre at Lund University,
Sweden [30] according to the manufacturer's instructions.
Data preprocessing
For Illumina data, fluorescent signals were imported into the
BeadStudio software (Illumina Inc.) and normalized. The
normalized fluorescence signals for a sample were compared
with the signal intensities of a set of reference genotypes, and
the log
2
-ratios between the sample and the reference signals
were calculated. In addition, the frequency of the B-allele for
the sample was estimated based on the reference genotype
clusters [6]. For Affymetrix data, quality control, genotype
calling, and copy number analyses were made in the Affyme-
trix GeneChip
®
Genotyping Analysis Software (GTYPE) 4.1.
Genotype calls were made using the BRLMM algorithm [31].
The HMM algorithm in the Copy Number Analysis Tool
(CNAT) 4.0.1 was used with the following parameter settings:
transition decay 5 Mb, median normalization, and no
smoothing to generate log
2
-ratio estimates for Affymetrix
data. The reference data set for copy number analyses was 96
CEU samples from the HapMap project [28]. B allele frequen-
cies for Affymetrix data were estimated as described [23].
BAF data were reflected into mBAF along the 0.5 axes by the
transformation mBAF = abs(BAF - 0.5) + 0.5, where abs
stands for taking the absolute value. Data for chromosomes 1-
22 were used in subsequent comparisons.
Equations for allelic imbalances in diploid genomes
Since BAF is a measurement of N
B
/(N
B
+ N
A
), where N
A
and
N
B
are the number of alleles, a region of hemizygous loss can,
for a diploid genome, be estimated to have an expected mBAF
of 1/(1 + x), where x is the fraction of cells not showing the
allelic imbalance, for example, contaminating normal cells.
Similarly, a copy neutral event can be estimated to have an
expected mBAF of (2 - x)/2 and a single copy gain to have an
expected mBAF of (2 - x)/(3 - x). More complex aberrations,
such as AAAB/BBBA, corresponding to 4N, can be estimated
to have an expected mBAF of (3 - 2x)/(4 - 2x), AAABB/
BBBAA to have (3 - 2x)/(5 - 3x), AAAAB/BBBBA to have (4 -
3x)/(5 - 3x), AAA/BBB to have (3 - 2x)/(3 - x), AAAA/BBBB
Genome Biology 2008, Volume 9, Issue 9, Article R136 Staaf et al. R136.16
Genome Biology 2008, 9:R136
to have (4 - 3x)/(4 - 2x), and AAAAA/BBBBB to have (5 - 4x)/
(5 - 3x).
Simulated data sets for evaluation of sensitivity and
specificity
A simulated Illumina data set was created for evaluation of
the sensitivity and specificity of the proposed segmentation
method compared to PennCNV, QuantiSNP and SOMATICs.
The simulated data set was based on the diploid HapMap
sample NA06991 hybridized on an Illumina HumanHap550
Genotyping BeadChip (reference data set 4). Different types
of allelic imbalances were added to NA06991 at distinct
genomic locations using the equations for the theoretical
mBAF levels of single copy gain, hemizygous loss and copy
neutral LOH. The simulated data set consists of 21 versions of
the modified NA06991 sample with varying degrees of nor-
mal cell contamination, starting from 0% up to 100% with 5%
increments. The construction and analysis of the simulated
data set is described in detail in Additional data file 3.
DChipSNP, PennCNV, QuantiSNP, SOMATICs and
CNAG analyses
Tumor-only LOH analysis was performed using the software
dChipSNP [10] with the consider haplotype option for both
Affymetrix and Illumina data. For Affymetrix, the reference
data were 250k Nsp data from 60 CEPH parents [32]. For
Illumina, the reference data were the 32 CEU parents selected
from the HumanHap300 genotyping data set. Regions where
LOH was called in more than 10% of the reference data were
removed from further analysis. PennCNV analysis was per-
formed with default settings (Additional data file 3) as previ-
ously described [12]. Only regions of copy number gain and
loss are detected. QuantiSNP analysis (QuantiSNP ver 1.0)
was performed with default settings (Additional data file 3) as
previously described [13]. Only regions of copy number gain
and loss are detected. GC correction was not employed. Calls
were set as -1 (undefined), 2 (normal), 1 (copy number loss)
or 3 (copy number gain). SOMATICs analysis was performed
with default settings as previously described [17], with the
exception that the average heterozygosity rate was set to 0.31
and that a BAF p-value of 0.05 was used to filter detected
allelic imbalances. Modules 1 to 4 in the R script (Additional
data file 3) from [33] were used for analysis. Calls were set as
-1 (copy number loss), 0 (copy neutral allelic imbalance) or 1
(copy number gain). CNAG analysis was performed on
Affymetrix data using version 2 of CNAG in an unpaired test
setting [24]. For urothelial data set 5 the matched blood was
set as an unpaired reference sample. Cut-off for the LOH like-
lihood was decreased to 5 for increased sensitivity compared
to the default 30. For all other parameters default settings
were used.
SNP enrichment for segmentation of paired tumor
samples
Non-informative homozygous SNPs were removed from
matched tumor-normal samples by comparison of genotype
calls. SNPs genotyped as AA or BB in the matched normal
samples were removed from the corresponding tumor BAF
profile before transformation to mBAF.
SNP enrichment for segmentation of unpaired tumor
samples
For unpaired tumor analysis non-informative homozygous
SNPs may be removed from the tumor mBAF profile by using
an mBAF threshold. SNPs above the threshold are considered
non-informative and removed. Triplet filtering is next applied
to the mBAF threshold filtered data to further improve the
removal (Figure S1 in Additional data file 1; Additional data
file 2). For each SNP the absolute sum of the difference in
mBAF between the investigated SNP and the pre- and suc-
ceeding SNP (neighboring SNPs are identified in the mBAF
threshold filtered data) is calculated and added to the SNPs
distance from the 0.5 baseline. For a SNP with index i:
triplet sum[i] = abs(mBAF[i - 1] - mBAF[i]) +
abs(mBAF[i + 1] - mBAF[i]) + mBAF[i] - 0.5
Triplet sums are compared against a threshold. SNPs with tri-
plet sums above the threshold are considered outliers and
removed. The triplet filtering is designed to remove non-
informative homozygous SNPs that, due to experimental
noise, obtain mBAF values lower than the mBAF threshold.
The small numbers of remaining non-informative SNPs that
are not removed by triplet filtering (Additional data file 2)
include consecutive non-informative homozygous SNPs that
all obtain mBAF values below the mBAF threshold. In this
study we used an mBAF threshold of 0.97 and a triplet sum
threshold of 0.8 for Illumina data. For Affymetrix data, we
used an mBAF threshold of 0.9 and a triplet sum threshold of
0.6.
Segmentation of allelic proportions
CBS [18] (DNAcopy [34]) was used to identify breakpoints of
genomic regions of apparently identical allelic proportion.
Segmentation was performed on mBAF profiles after removal
of non-informative homozygous SNPs. In this study default
settings of CBS were used, except for the significance level for
accepting change-points (α), which was set to 0.001.
Calling of allelic imbalances for the segmentation
approach
Regions of allelic imbalance may be called by comparison of
the respective segmented mBAF value to an mBAF threshold.
Values above the threshold imply allelic imbalance. Thresh-
olds may be either fixed or sample adaptive. Sample adaptive
thresholds may be generated using enriched mBAF data sim-
ilarly to as previously described for copy number analysis
[19]. The AsCNAR software has been reported to be able to
detect allelic imbalance with up to 80% contaminating nor-
mal cells for Affymetrix WGG arrays [14]. For hemizygous
loss, this level of normal cell contamination corresponds to a
theoretical mBAF value of 0.555. Consequently, in this study
Genome Biology 2008, Volume 9, Issue 9, Article R136 Staaf et al. R136.17
Genome Biology 2008, 9:R136
we used a fixed threshold in mBAF of 0.56 for both Affymetrix
and Illumina data to call allelic imbalance. Segments called as
allelic imbalance and smaller than four SNPs in size were
removed from further analysis. A simple method for also call-
ing the type of aberration (gain, loss, or copy neutral) for
regions called as allelic imbalance by the segmentation strat-
egy was constructed. Types of aberrations were called using
fixed cut-offs for the average log R ratio of SNPs in regions
called as allelic imbalance. The fixed mBAF threshold of 0.56
used to call allelic imbalance corresponds to a fraction of less
than 80% unaffected cells for hemizygous loss. Similarly, this
mBAF threshold corresponds to a fraction of 73% unaffected
cells for single copy gain. These fractions can, utilizing an
investigation of how log R ratios depend on copy numbers [6],
be turned into the log R ratio cutoffs -0.15 and 0.073 for losses
and gains, respectively (Additional data file 3). Consequently,
we called allelic imbalances with an average log R ratio above
0.06 relative to the median log R ratio of the entire sample as
gain, below -0.14 as loss, and in between as copy neutral.
Availability
An implementation of the proposed segmentation strategy,
BAFsegmentation, is available together with the simulated
data set [35]. The implementation of the segmentation strat-
egy can generate analysis bookmarks of identified regions for
use with the Illumina BeadStudio software. Four matched
tumor-normal pairs in data set 2 and the CRL-2324 dilution
series (data set 3) are available through Gene Expression
Omnibus [36] with accession GSE11976.
Abbreviations
aCGH, array-based CGH; BAF, B allele frequency; CBS, circu-
lar binary segmentation; CGH, comparative genomic hybrid-
ization; CLL, chronic lymphocytic leukemia; CNA, copy
number aberration; CNV, copy number variation; CV, coeffi-
cient of variation; FISH, fluorescent in situ hybridization;
HMM, hidden Markov model; LOH, loss of heterozygosity;
mBAF, mirrored B allele frequency; SNP, single nucleotide
polymorphism; WGG, whole genome genotyping.
Authors' contributions
JS conceived the study. JS developed and implemented the
method and performed data analysis with assistance from
MR. JS generated the experimental dilution series. JS, MR,
JVC and DL proposed analyses and interpreted results. JS
and MR wrote the manuscript. AI and HG performed dChip-
SNP analysis and calculated B allele frequencies for Affyme-
trix data. GJ, RR, MH and ÅB contributed samples. All
authors approved the final manuscript.
Additional data files
The following additional data are available. Additional data
file 1 is a set of figures describing the implementation of the
segmentation approach and analysis using the approach.
Additional data file 2 is a table describing results using triplet
filtering. Additional data file 3 is a document describing the
generation and analysis of the simulated data set. Additional
data file 4 is a document describing the analysis of experi-
mental data available at the project web site [35].
Additional data file 1Implementation of the segmentation approach and analysis using the approachImplementation of the segmentation approach and analysis using the approach.Click here for fileAdditional data file 2Results using triplet filteringResults using triplet filtering.Click here for fileAdditional data file 3Generation and analysis of the simulated data setGeneration and analysis of the simulated data set.Click here for fileAdditional data file 4Analysis of experimental data available at the project web site [35]Analysis of experimental data available at the project web site [35].Click here for file
Acknowledgements
Financial support was provided by the Swedish Cancer Society, the Knut &
Alice Wallenberg Foundation, the Foundation for Strategic Research
through the Lund Centre for Clinical Cancer Research (CREATE Health),
the American Cancer Society and the IngaBritt and Arne Lundberg Foun-
dation. The SCIBLU Genomics center is supported by governmental fund-
ing of clinical research within the national health services (ALF) and by Lund
University.
References
1. Albertson DG, Collins C, McCormick F, Gray JW: Chromosome
aberrations in solid tumors. Nat Genet 2003, 34:369-376.
2. Pinkel D, Segraves R, Sudar D, Clark S, Poole I, Kowbel D, Collins C,
Kuo WL, Chen C, Zhai Y, Dairkee SH, Ljung BM, Gray JW, Albertson
DG: High resolution analysis of DNA copy number variation
using comparative genomic hybridization to microarrays.
Nat Genet 1998, 20:207-211.
3. Pinkel D, Albertson DG: Array comparative genomic hybridiza-
tion and its applications in cancer. Nat Genet 2005,
37(Suppl):S11-S17.
4. Matsuzaki H, Dong S, Loi H, Di X, Liu G, Hubbell E, Law J, Berntsen
T, Chadha M, Hui H, Yang G, Kennedy GC, Webster TA, Cawley S,
Walsh PS, Jones KW, Fodor SP, Mei R: Genotyping over 100,000
SNPs on a pair of oligonucleotide arrays. Nat Methods 2004,
1:109-111.
5. Gunderson KL, Steemers FJ, Lee G, Mendoza LG, Chee MS: A
genome-wide scalable SNP genotyping assay using micro-
array technology. Nat Genet 2005, 37:549-554.
6. Peiffer DA, Le JM, Steemers FJ, Chang W, Jenniges T, Garcia F, Haden
K, Li J, Shaw CA, Belmont J, Cheung SW, Shen RM, Barker DL,
Gunderson KL: High-resolution genomic profiling of chromo-
somal aberrations using Infinium whole-genome genotyping.
Genome Res 2006, 16:1136-1148.
7. Hanahan D, Weinberg RA: The hallmarks of cancer. Cell 2000,
100:57-70.
8. LaFramboise T, Weir BA, Zhao X, Beroukhim R, Li C, Harrington D,
Sellers WR, Meyerson M: Allele-specific amplification in cancer
revealed by SNP array analysis. PLoS Comput Biol 2005, 1:e65.
9. Beroukhim R, Lin M, Park Y, Hao K, Zhao X, Garraway LA, Fox EA,
Hochberg EP, Mellinghoff IK, Hofer MD, Descazeaud A, Rubin MA,
Meyerson M, Wong WH, Sellers WR, Li C: Inferring loss-of-heter-
ozygosity from unpaired tumors using high-density oligonu-
cleotide SNP arrays. PLoS Comput Biol 2006, 2:e41.
10. Lin M, Wei LJ, Sellers WR, Lieberfarb M, Wong WH, Li C: dChip-
SNP: significance curve and clustering of SNP-array-based
loss-of-heterozygosity data. Bioinformatics 2004, 20:1233-1240.
11. Affymetrix []
12. Wang K, Li M, Hadley D, Liu R, Glessner J, Grant SF, Hakonarson H,
Bucan M: PennCNV: an integrated hidden Markov model
designed for high-resolution copy number variation detec-
tion in whole-genome SNP genotyping data. Genome Res 2007,
17:1665-1674.
13. Colella S, Yau C, Taylor JM, Mirza G, Butler H, Clouston P, Bassett
AS, Seller A, Holmes CC, Ragoussis J: QuantiSNP: an Objective
Bayes Hidden-Markov Model to detect and accurately map
copy number variation using SNP genotyping data. Nucleic
Acids Res 2007, 35:2013-2025.
14. Yamamoto G, Nannya Y, Kato M, Sanada M, Levine RL, Kawamata N,
Hangaishi A, Kurokawa M, Chiba S, Gilliland DG, Koeffler HP, Ogawa
S: Highly sensitive method for genomewide detection of
allelic composition in nonpaired, primary tumor specimens
by use of affymetrix single-nucleotide-polymorphism geno-
typing microarrays. Am J Hum Genet 2007, 81:114-126.
15. Lamy P, Andersen CL, Dyrskjot L, Torring N, Wiuf C: A Hidden
Genome Biology 2008, Volume 9, Issue 9, Article R136 Staaf et al. R136.18
Genome Biology 2008, 9:R136
Markov Model to estimate population mixture and allelic
copy-numbers in cancers using Affymetrix SNP arrays. BMC
Bioinformatics 2007, 8:434.
16. Li C, Beroukhim R, Weir BA, Winckler W, Garraway LA, Sellers WR,
Meyerson M: Major copy proportion analysis of tumor samples
using SNP arrays. BMC Bioinformatics 2008, 9:204.
17. Assié G, LaFramboise T, Platzer P, Bertherat J, Stratakis CA, Eng C:
SNP arrays in heterogeneous tissue: highly accurate collec-
tion of both germline and somatic genetic information from
unpaired single tumor samples. Am J Hum Genet 2008,
82:903-915.
18. Venkatraman ES, Olshen AB: A faster circular binary segmenta-
tion algorithm for the analysis of array CGH data. Bioinformat-
ics 2007, 23:657-663.
19. Staaf J, Jönsson G, Ringnér M, Vallon-Christersson J: Normalization
of array-CGH data: influence of copy number imbalances.
BMC Genomics 2007, 8:382.
20. Lai WR, Johnson MD, Kucherlapati R, Park PJ: Comparative analy-
sis of algorithms for identifying amplifications and deletions
in array CGH data. Bioinformatics 2005, 21:3763-3770.
21. Gazdar AF, Kurvari V, Virmani A, Gollahon L, Sakaguchi M, Wester-
field M, Kodagoda D, Stasny V, Cunningham HT, Wistuba II, Tomlin-
son G, Tonk V, Ashfaq R, Leitch AM, Minna JD, Shay JW:
Characterization of paired tumor and non-tumor cell lines
established from patients with breast cancer. Int J Cancer 1998,
78:766-774.
22. Nancarrow DJ, Handoko HY, Stark MS, Whiteman DC, Hayward NK:
SiDCoN: a tool to aid scoring of DNA copy number changes
in SNP chip data. PLoS ONE 2007, 2:e1093.
23. Gunnarsson R, Staaf J, Jansson M, Ottesen AM, Göransson H, Liljedahl
U, Ralfkiaer U, Mansouri M, Buhl AM, Smedby KE, Hjalgrim H,
Syvänen AC, Borg A, Isaksson A, Jurlander J, Juliusson G, Rosenquist
R: Screening for copy-number alterations and loss of hetero-
zygosity in chronic lymphocytic leukemia - a comparative
study of four differently designed, high resolution microarray
platforms. Genes Chromosomes Cancer 2008, 47:697-711.
24. Nannya Y, Sanada M, Nakazaki K, Hosoya N, Wang L, Hangaishi A,
Kurokawa M, Chiba S, Bailey DK, Kennedy GC, Ogawa S: A robust
algorithm for copy number detection using high-density oli-
gonucleotide single nucleotide polymorphism genotyping
arrays. Cancer Res 2005, 65:6071-6079.
25. ATCC []
26. Haque KA, Pfeiffer RM, Beerman MB, Struewing JP, Chanock SJ, Ber-
gen AW: Performance of high-throughput DNA quantifica-
tion methods. BMC Biotechnol 2003, 3:20.
27. Rengarajan K, Cristol SM, Mehta M, Nickerson JM: Quantifying
DNA concentrations using fluorometry: a comparison of
fluorophores. Mol Vis 2002, 8:416-421.
28. HapMap []
29. SNP Technology Platform in Uppsala, Sweden [http://
www.genotyping.se]
30. SCIBLU Genomics, Lund University, Sweden [http://
www.lth.se/sciblu]
31. Rabbee N, Speed TP: A genotype calling algorithm for affyme-
trix SNP arrays. Bioinformatics 2006, 22:7-12.
32. dChip []
33. Lerner Research Institute, Integrative Genomic Analysis
Core [ />34. BioConductor []
35. BAFsegmentation [ />se.lu.onk.BAFsegmentation]
36. Gene Expression Omnibus [ />