Báo cáo y học: "Systematic bioinformatic analysis of expression levels of 17,330 human genes across 9,783 samples from 175 types of healthy and pathological tissues" ppt
Bạn đang xem bản rút gọn của tài liệu. Xem và tải ngay bản đầy đủ của tài liệu tại đây (2.28 MB, 14 trang )
Genome Biology 2008, 9:R139
Open Access
2008Kilpinenet al.Volume 9, Issue 9, Article R139
Method
Systematic bioinformatic analysis of expression levels of 17,330
human genes across 9,783 samples from 175 types of healthy and
pathological tissues
Sami Kilpinen
¤
*†
, Reija Autio
¤
‡
, Kalle Ojala
*†
, Kristiina Iljin
*
,
Elmar Bucher
*
, Henri Sara
*
, Tommi Pisto
*
, Matti Saarela
‡
,
Rolf I Skotheim
*§
, Mari Björkman
*
, John-Patrick Mpindi
*
, Saija Haapa-
Paananen
*
, Paula Vainio
*
, Henrik Edgren
*†
, Maija Wolf
*†
, Jaakko Astola
‡
,
Matthias Nees
*
, Sampsa Hautaniemi
¶
and Olli Kallioniemi
*†
Addresses:
*
Medical Biotechnology, VTT Technical Research Centre and University of Turku, Itäinen pitkäkatu 4C, Turku, Finland.
†
Institute
for Molecular Medicine Finland (FIMM), University of Helsinki, Tukholmankatu 8, Helsinki, Finland.
‡
Department of Signal Processing,
Tampere University of Technology, Korkeakoulunkatu 1, Tampere, Finland.
§
Department of Cancer Prevention, Institute for Cancer Research,
Rikshospitalet-Radiumhospitalet Medical Centre, Oslo, NO-0310, Norway.
¶
Computational Systems Biology Laboratory, Institute of
Biomedicine and Genome-Scale Biology Research Program, University of Helsinki, Haartmaninkatu 8, Finland.
¤ These authors contributed equally to this work.
Correspondence: Olli Kallioniemi. Email:
© 2008 Kilpinen et al; licensee BioMed Central Ltd.
This is an open access article distributed under the terms of the Creative Commons Attribution License ( which
permits unrestricted use, distribution, and reproduction in any medium, provided the original work is properly cited.
GeneSapiens<p>A method for the comparison of mRNA expression levels of most human genes across gene expression array experiments, and a data-base of the results, are presented.</p>
Abstract
Our knowledge on tissue- and disease-specific functions of human genes is rather limited and highly
context-specific. Here, we have developed a method for the comparison of mRNA expression
levels of most human genes across 9,783 Affymetrix gene expression array experiments
representing 43 normal human tissue types, 68 cancer types, and 64 other diseases. This database
of gene expression patterns in normal human tissues and pathological conditions covers 113 million
datapoints and is available from the GeneSapiens website.
Background
A fundamental challenge in the post-genome era is the iden-
tification of the context-specific functions of human genes
across healthy and disease tissues. Thousands of gene expres-
sion microarray measurements are performed each year by
the scientific community and many of the data are made pub-
licly available. In order to make use of this resource, integra-
tion of large collections of gene expression data from different
tissues and microarray platforms is required. Available data-
sets, however, are often discordant and challenging to inte-
grate due to the variety of the technologies used.
Nevertheless, meta-analyses have already been shown to
facilitate the analysis of gene expression across healthy and
disease states [1-3]. Due to the use of various microarray plat-
forms in studies, the multiple datasets are typically analyzed
separately [4-9], for instance, focusing on cancer-normal
comparisons within an organ type. Other studies have looked
for systematic co-expression patterns between genes across
Published: 19 September 2008
Genome Biology 2008, 9:R139 (doi:10.1186/gb-2008-9-9-r139)
Received: 15 May 2008
Revised: 7 August 2008
Accepted: 19 September 2008
The electronic version of this article is the complete one and can be
found online at /> Genome Biology 2008, Volume 9, Issue 9, Article R139 Kilpinen et al. R139.2
Genome Biology 2008, 9:R139
multiple datasets in order to predict functions of genes
[1,3,10-15]. While this is useful for the understanding of com-
mon shared functions of genes across different organs, highly
tissue- or disease-specific gene functions may be missed.
Here, we describe the development of a database of in silico
transcriptomics data that currently integrates 157 separate
studies involving 9,783 human specimens, from 43 normal
tissue types, 68 cancer types and 64 other disease types. The
launch of the database was made possible by the development
and validation of a novel method to normalize data arising
from different Affymetrix microarray generations. The array
data are linked with detailed clinical classifications and end-
points and are available through an interactive web interface
designed for exploration by biologists and available at the
GeneSapiens website [16]. We demonstrate here the applica-
tion of the GeneSapiens system to the tissue- and disease-spe-
cific expression profiles of human genes one at a time or as
gene clusters.
Results and discussion
Overview of the in silico transcriptomics data in the
GeneSapiens system
The database was constructed from 9,783 CEL files of
Affymetrix based gene expression measurements from nor-
mal and pathological human in vivo tissues and cells. We
selected data from the five most widely used Affymetrix array
generations (HG-U95A, HG-U95Av2, HG-U133A, HG-
U133B, HG-U133 Plus 2), which were then normalized
together. The detailed contents of the database are described
in Additional data files 3 and 4. Each sample was systemati-
cally manually annotated with detailed information (when
available) on sample collection procedures, demographic
data, anatomic location, disease type, and clinicopathological
details. These integrated data make it possible to generate
expression profiles of any gene across 175 human tissue and
disease types.
Custom software was developed to construct the database
from the collection of CEL files and manually curated annota-
tions linked to each sample. The software was based upon a
Perl wrapper calling several subprograms written in Perl, R
[17], C++ and MySQL and Linux Bash scripts. The subpro-
grams identify unique CEL files by using cyclic redundancy
checks, preprocess the files, perform the normalization steps,
fetch gene annotations from Ensembl and incorporate the
manually made annotation for each sample, create a complete
MySQL database and perform the final integrity checks. Vis-
ualization and analysis tools were implemented in R [17], and
the processed data are made available through a user-friendly
and interactive web site [16]. We also implemented a virtual
machine approach, the final result being a hardware-inde-
pendent and rapidly installable complete operating system
optimized for running the GeneSapiens database and web-
server for the visualization interface.
Development of the data normalization procedure
We implemented a three-step normalization strategy that
consisted of probe-level preprocessing, equalization transfor-
mation (Q) and array-generation-based gene centering
(AGC). We demonstrate that these steps resulted in data that
are comparable across the major Affymetrix array
generations.
Step I: data preprocessing at the probe level
We first used the MAS5.0 method [18] to preprocess raw data
in the .CEL files. MAS5.0 is an optimal algorithm for the pur-
pose of analyzing very large datasets [19] as it requires less
memory than other widely used methods, and the biological
representativity of the MAS5.0 normalized data is well docu-
mented [19]. In the three-step normalization approach, the
subsequent normalization stages also minimized possible
problems generated by the MAS5.0 preprocessing algorithm.
Importantly, we mapped the probes from each array genera-
tion type directly to Ensembl gene IDs by using alternative
CDF files (version 10) [20] to avoid inaccuracies generated by
the original probeset design of Affymetrix arrays. Therefore,
this resulted in the optimal redefinition of the gene specifici-
ties of the probes and excluded those probes that, according
to the recent genome assembly, mapped to multiple genes or
nowhere in the genome.
Step II: Q normalization
After preprocessing, we performed sample-wise normaliza-
tion of the entire dataset at the gene level. This was done by
equalization transformation [21] (Q), which is similar to the
widely used quantile normalization [22] in which the samples
are transformed by substituting their values with the means
of quantiles in the entire dataset. In the Q procedure, we
transformed each sample to follow a normal distribution that
was estimated from the log
2
-transformed values of the entire
dataset (Additional data file 1). The estimated parameters
were a mean of 8 and standard deviation of 2. This step of the
sample-wise normalization was necessary to prevent a small
number of aberrant samples from dominating the mean val-
ues for genes within an array generation used in the AGC
correction.
Step III: array-generation-based gene centering (AGC normalization)
We developed a novel AGC method to avoid the bias caused
by the different oligos quantifying the same gene in the differ-
ent Affymetrix array generations. The AGC method is based
on the availability of data, on each array generation, from a
large number of samples representing different tissues or dis-
eases. In the AGC method, a correction factor is calculated for
each gene in each array generation. These correction factors
are then used to normalize the gene expression distributions
across the whole database (see Materials and methods for
details).
Genome Biology 2008, Volume 9, Issue 9, Article R139 Kilpinen et al. R139.3
Genome Biology 2008, 9:R139
Validating the entire normalization protocol
We validated the AGC method as well as the entire normali-
zation procedure by a number of ways and demonstrated that
we had achieved improved comparability of the data across
the multiple array generations. First, analysis by multi-
dimensional scaling (MDS) showed that samples from 15 nor-
mal human tissues tested clustered initially based on the four
array generations (Figure 1a, b), but after the AGC procedure,
the tissue of origin was the primary driver of the clustering
(Figure 1c, d). Second, in K-means clustering of the same
data, we showed that the corrected rand index [23] (a meas-
ure of the accuracy of the sample segregation into character-
istic clusters) for array generations decreased from 0.45 to
0.15 and that of the tissues jumped from 0.22 to 0.92 (Addi-
tional data file 5). Third, correlation of data from two large
datasets where the same samples had been analyzed on two
different array generations improved significantly after the
AGC correction (Figure 2), reaching across-generation corre-
lations of 0.9. Finally, and most importantly, we showed that
the gene profiles of multiple previously known tissue-specific
genes matched exactly with those expected based on litera-
ture data. Therefore, we expect poorly known genes to pro-
vide similarly informative results on their biological and
medical importance. These various validation steps are
described in more detail below.
Multi-dimensional scaling analysis
We applied MDS [24] to the data processed by Q normaliza-
tion alone or after the AGC correction. This was done to com-
pare the variability (that is, noise) caused by the array
generation with the biological variability in the data. We eval-
uated 1,137 healthy tissue samples having 7,390 genes in
common without any missing values. The samples repre-
sented 15 distinct anatomical locations with more than 20
samples from each site. The samples were measured with four
array generations (HG-U133A Plus 2, HG-U133A, HG-U95A
and HG-U95Av2). In Q normalized data, only some tissue-
associated variation could be observed (Figure 1a), while the
clusters were primarily driven by the array generations (Fig-
ure 1b). After the AGC step was applied, a major change in the
clustering of the samples was seen. Array generations no
longer defined clusters (Figure 1c), which were now formed
predominantly by the tissue types (Figure 1d). The effect was
very striking and defined, for example, a clear cluster of neu-
ronal, muscle, hematological and lung tissues. Even though
the MDS in three dimensions gives an illustrative example of
the segregation of these 15 tissues types, we do not expect the
clusters to be completely separated with MDS and only three
dimensions. The main reason is that there is significant bio-
logical similarity as well as biological variability within each
tissue type (such as multiple overlapping cell types). How-
ever, this analysis was not meant to provide a demonstration
of complete classification accuracy of human tissues but
rather to validate the biological relevance of our data. Taken
together, the analysis indicates clear improvement in overall
biological relevance of the data after our three-step normali-
zation procedure.
K-means clustering
We clustered the data before and after normalization with
four initial centroids using the median values of each array
generation, and again with 15 initial centroids using the
median values of each tissue type. This test was done for the
specific purpose of comparing the impact of the variation gen-
erated by the array generations before and after normaliza-
tion. We calculated the corrected rand indices [23] for each
clustering to see whether the array generations or the tissue
types form more accurate clusters. The corrected rand index
compares partitions defined by the K-means clustering to the
known partitions of the data (for example, partitions by array
generation or by tissue type). The index varies between [1, 0]
where one indicates that the partitions are identical and not
due to chance, whereas zero indicates that the found parti-
tions would be expected by chance. The corrected rand index
for the array generations went down from 0.45 to 0.15 when
we applied the AGC normalization, while the corrected rand
index for tissues jumped from 0.22 to 0.92. The percentages
of samples per array generation and per tissue type segre-
gated to the distinct clusters are given in Additional data file
5.
We also tested the impact of the Q normalization step by per-
forming the same clustering operations on AGC corrected
MAS5 data. In this case, the corrected rand index for array
generations was 0.11 and for tissue types 0.84. This result
showed that AGC could also significantly improve MAS5 data
even without the Q normalization, but that the three consec-
utive steps provided the optimal ability to distinguish biolog-
ically relevant signals.
Correlations of technical replicates
We then studied the correlations between technical replicates
of the same samples analyzed on different Affymetrix array
generations. While in itself this does not ensure optimal nor-
malization, such analyses have often been used to compare
data from different array generations in previous publications
[4,9,25]. Thus, we used data from three datasets as a basis for
these analyses [9,26,27]. We first used data for 14 samples of
human muscle biopsy samples from patients with inflamma-
tory myopathies [9]. For these cases, data from hybridiza-
tions on both HG-U95Av2 and HG-U133A human arrays
were available. The correlation coefficient of each replicate
pair was > 0.9 when normalized with the AGC method com-
pared to the correlation of the preprocessed and Q normal-
ized values, which were less than 0.75, a significant difference
(Figure 2a). We then utilized a dataset from St Jude Chil-
dren's Research Hospital [26,27] of 123 human leukemias,
each analyzed with the three array generations; HG-U95Av2,
HG-U133A and HG-U1331B. The mean value of the correla-
tions computed based on the AGC corrected data was signifi-
cantly higher, 0.78, than the mean of correlations computed
Genome Biology 2008, Volume 9, Issue 9, Article R139 Kilpinen et al. R139.4
Genome Biology 2008, 9:R139
based on pre-processed or Q normalized values, which was
0.5 (Figure 2b). For most comparisons, the Q normalized cor-
relations were also slightly higher than those with pre-
processing alone.
In summary, validation of the normalization approach (Fig-
ures 1a–d, 2a, b; Additional data file 5) together indicate that,
in our three-step data processing procedure, the samples
clustered mainly according to array generation, until the last
AGC correction is applied. After the last AGC step, the biolog-
ical origin of the samples, and not the array generation, drove
the clustering (Figure 1d). Therefore, our in silico transcrip-
tomics data have been integrated across all the array genera-
tions to the extent that biological variability caused by the
tissue and disease types will exceed the technical noise caused
by the array generations. This does not mean that the differ-
ences between array generations are non-existent, but they
will be smaller than most of the biological differences. The
final and most important validation of the method was the
demonstration that known tissue-and disease-specific genes
generated expected profiles across all tissues and diseases
(see examples below), thus validating that technical variation
is diminished enough to allow accurate biological findings to
be made.
Validating GeneSapiens expression profiles with known
tissue-specific genes
To evaluate the biological relevance of gene expression pro-
files from in silico transcriptomics data, we generated tissue-
and disease-wide expression profiles for well-known tissue-
specific marker genes. Figure 3 provides examples of the
GeneSapiens plots for TNNT2, ALPP and MAG. In these
plots, all the 9,783 samples are represented along the x-axis
in a pre-determined fixed order, first the normal tissues, then
cancers and then other diseases. The y-axis reflects the rela-
tive level of gene expression after the three-step normaliza-
tion approach.
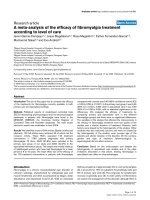
Multidimensional scaling (MDS) of Q normalized data before and after AGC correctionFigure 1
Multidimensional scaling (MDS) of Q normalized data before and after AGC correction. MDS was performed using 1,137 healthy in vivo samples
representing 15 tissue categories with 7,390 genes in common without missing values. Color codes show the array generation of each sample for panles
on the left-hand side and the high level anatomical system from which samples originate for panels on the right-hand side. (a, b) Clustering of samples in
Q normalized data without AGC correction. (a) Clustering driven dominantly by the array generations, but some biological division can be seen in the
form of some division within the large clusters. (b) Several tissue classes are separated into two or more clusters due to the different array generation of
origin. (c, d) After QAGC, array generations no longer define clusters (c) but instead tissue types form distinct clusters (d).
(a)
(b)
(c)
(d)
Genome Biology 2008, Volume 9, Issue 9, Article R139 Kilpinen et al. R139.5
Genome Biology 2008, 9:R139
Troponin T (TNNT2) showed highly specific expression in
heart tissue, as expected for a clinically used cardiac biomar-
ker [28] (Figure 3a). Heart samples in our database originate
from four different array generations and comprise only 0.5%
of the samples. Therefore, finding an expected tissue-specific
expression profile for these samples demonstrates the per-
formance of the normalization even for such a small propor-
tion of samples measured on multiple array generations.
Interestingly, TTNT2 is also rather highly expressed in many
rhabdomyosarcomas and some Muellerian ovarian tumors.
There is one report in the literature for a single case of rhab-
domyosarcoma showing increased Troponin T levels in
serum [29], while our GeneSapiens profile demonstrated that
this gene is indeed likely to be upregulated in the two afore-
mentioned tumor types. This demonstrates how GeneSapiens
profiles can give additional information even from well-
known genes. Expression of placental alkaline phosphatase
(PLAP; ALPP) was seen predominantly in healthy placenta
(Figure 3b), as expected [30], but also often in tumors of the
uterus and ovary and rarely in some other tumor types. This
observation fits well with the known oncodevelopmental
nature of PLAP, with ectopic expression being common in
various types of cancers, with uterine and ovarian cancers
being particularly well defined as PLAP-positive [31,32].
Finally, MAG, a neuronal cell marker [33], showed the high-
est expression in central nervous system, and to a lesser
extent in gliomas (Figure 3c), again a GeneSapiens profile
that could be expected for this well-known marker gene.
Additional examples are given in Additional data files 4 and 5,
and dozens of known tissue-specific genes or biomarkers can
be evaluated through the online tool for exploring tissue- and
disease-specific gene expression patterns. For example, KLK3
(PSA) is the best-known prostate-specific gene [34] and its
GeneSapiens expression profile (Additional data file 2)
showed expression only in normal and cancerous human
prostate tissues. GFAP is a glial fibrillar acidic protein and
showed the expected [35] high level of expression in normal
and pathological tissues from the central nervous system
(Additional data file 2). Insulin shows the expected extremely
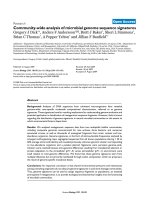
Boxplots of correlations between the replicated samples after each step of the data normalization processFigure 2
Boxplots of correlations between the replicated samples after each step of the data normalization process. All boxes for which notches do not overlap
vertically have significantly (α = 0.05) different median values. On the left is a sample set from 14 human muscle biopsy samples measured with array
generations U95Av2 and U133A. The correlations computed based on the QAGC-normalized data are significantly higher when compared to MAS5 and
Q methods. On the right, all correlations between 123 leukemia samples are plotted. The samples are from three different array generations U95Av2,
U133A, and U133B. The first column illustrates correlations between all replicates together (369 correlation values), and in the other columns the
correlations are grouped based on the array generation pairs. When the mean values of the correlations computed with each method were compared, the
values in the QAGC data were significantly higher.
MAS5 Q QAGC
0.65
0.7
0.75
0.8
0.85
0.9
0.95
Technical replicates:
Muscle samples
MAS5 Q QAGC
0.3
0.4
0.5
0.6
0.7
0.8
0.9
Technical replicates:
Leukemia samples
MAS5 Q QAGC MAS5 Q QAGC MAS5 Q QAGC
U95Av2 vs.
U133A
U95Av2 vs.
U133B
U133A vs.
U133B
Genome Biology 2008, Volume 9, Issue 9, Article R139 Kilpinen et al. R139.6
Genome Biology 2008, 9:R139
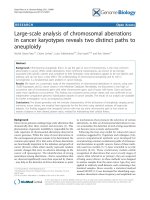
Detailed expression profiles of TNNT2, ALPP and MAGFigure 3
Detailed expression profiles of TNNT2, ALPP and MAG. (a) TNNT2 is a clinically used cardiac biomarker and, as expected, it shows heart-specific
expression. In addition, it has been shown that TNNT2 has elevated expression in some cases of rhabdomyosarcoma, also visible from the profile. (b) ALPP
had high expression in placenta and somewhat elevated expression in uterine tumors. Additionally, serous ovarian tumors showed elevated expression
when compared to the mucinous ones. (c) Known neuronal marker gene MAG similarly shows an expression profile that was highly central nervous
system specific.
2000 4000 6000 8000
0
5000
10000 15000
TNNT2, ENSG00000118194
Samples
circulating reticulocyte
heart
peripheral nerv.system
pancreas
ALL
sarcoma
mesothelioma
peritoneal cancer
2000 4000 6000 8000
0
100 200 300 400
ALPP, ENSG00000163283
Samples
circulating reticulocyte
peripheral nerv.system
endocrine system
liver
uterus
placenta
ALL
peritoneal cancer
ovarian cancer
uterine cancer
cervical cancer
2000 4000 6000 8000
0
1000 2000 3000 4000 5000 6000
MAG, ENSG00000105695
Samples
central nerv. system glioma
Anatomical system
Hematological
Connect. and musc.
Respiratory
Nervous
Endocrine & Salivary
GI tract & organs
Urogenital
Gynegological & Breast
Stem cells
(a)
(b)
(c)
Genome Biology 2008, Volume 9, Issue 9, Article R139 Kilpinen et al. R139.7
Genome Biology 2008, 9:R139
pancreas-specific expression (Additional data file 6). LDHC,
a known germ-cell specific marker [36], showed a strong tes-
tis-specific expression profile (Additional data file 6).
GeneSapiens makes it possible to generate gene expression
profiles for 17,330 genes across 175 systematically annotated
human tissues in a uniform scale with 2,265 to 9,783 data
points per gene. Due to the breadth of the tissue and disease
spectrum, this kind of analysis provides novel insights into
the biological, medical and clinical associations of genes. Fur-
thermore, the expression levels of a given gene can be com-
pared across all normal tissues and all disease types, not just
between specific test and control samples (like normal and
tumor tissues from the same organ as is usually done). Figure
4a, b illustrate the power of this global tissue- and disease-
wide analysis, displaying the expression profile of the PRAME
gene. PRAME (preferentially expressed melanoma antigen)
showed high expression in normal testis, but was very highly
over-expressed in a large variety of human cancers. PRAME
over-expression has been previously described in many can-
cer forms [37] and is known to function as a dominant repres-
sor of retinoic acid receptor signaling [37].
'Body-map' analysis to visualize expression profiles for
groups of genes across all tissues and diseases
To illustrate the power of GeneSapiens analysis in the study of
gene expression profiles of human cancer genes (as defined
by Sanger Center human cancer gene census), we produced a
clustered map of the mean expression levels of 342 cancer
genes across 110 healthy and malignant human tissues (Fig-
ure 5). Clustering along the sample type (y-axis) revealed that
based on the expression profiles of these cancer genes, the
samples could be divided into three overall classes: solid
tumors (84.4% of sample types were malignant in this class),
normal tissues (82.1% of sample types were healthy in this
class) and hematological samples (100% sample types were
normal or malignant hematological samples in this class).
Thus, the group of classic cancer genes had distinctly differ-
ent expression between healthy and malignant solid tissues,
but in hematological samples, cancer and normal samples
could not be separated.
Clustering of the cancer genes according to their mean body-
wide expression profiles revealed five characteristic sub-
groups. Expression of MKI67 (Ki-67) [38] and PCNA [39]
genes, two cell proliferation markers, showed the highest cor-
relations with specific branches of the cancer genes (Figure 5,
purple branch). KRT19 (a known epithelial marker) [40] and
PTPRC (an established marker for hematopoiesis) [41]
revealed a correlation with genes in the orange and blue
branches. Genes most highly associated with proliferation
markers were clearly the ones with gain of expression in solid
malignant tissues. The branch colored red contained enrich-
ments of Gene Ontology classes [42,43] related to differenti-
ation, cell adhesion and catabolic processes (data not shown),
which fits with the tendency for down-regulation of this group
of cancer genes in malignant tumors.
This kind of body-wide expression map of genes can also be
used to pinpoint medically interesting associations for indi-
vidual genes (three examples marked with rectangles and
labeled A, B and C). KIT had the highest GeneSapiens expres-
sion level in gastrointestinal stromal tumors (GISTs; Figure 5,
rectangle A, and Figure 6). KIT is a key therapeutic target of
Gleevec in GIST tumors [44]. The body-wide expression pro-
files of GeneSapiens would have therefore readily identified
this association of KIT with GIST samples along with this
therapeutic opportunity.
The second example is FEV (Figure 5, rectangle B, and Addi-
tional data file 7), a gene known to have functions in healthy
nervous system. This ETS-family transcription factor showed
low, but detectable, expression in healthy central nervous sys-
tem and in prostate. In malignant tissues FEV had highly ele-
vated expression in synovial sarcoma, neuroblastoma,
malignant peripheral nerve sheath tumors, and small intesti-
nal adenocarcinoma, and somewhat elevated expression in
prostate cancer.
The third example of cancer gene profiles is C1orf56, also
known as AF1Q or MLLT11 (Figure 5, rectangle C, and Addi-
tional data file 8). In healthy tissues it was expressed only in
the nervous system, but in malignant tissues there was gain of
expression in T-cell acute lymphoid leukemia, Ewing sar-
coma, lung small cell cancer, and nephroblastoma, and
extreme overexpression in neuroblastoma. MLLT11 is known
to be fused to the MLL gene in acute leukemias [45]. This
raises the possibility that MLLT11 could be a fusion gene tar-
get [46,47] or undergoing activating mutations in a range of
tumor types. Alternatively, the high levels of expression in
these tumors suggest that this gene is often activated in can-
cer by other mechanisms.
Conclusion
The major advantage of the GeneSapiens data mining meth-
odology is that it provides an integrated view of human gene
expression levels across thousands of samples representing
hundreds of different tissue and disease types. GeneSapiens
offers unprecedented possibilities to study gene expression
levels not only between a particular tumor type and the corre-
sponding normal tissue, but by providing body-wide over-
views of gene expression levels across all kinds of normal and
disease states. While meta-analysis of microarray data
[48,49] has been previously demonstrated to be powerful in
taking advantage of the enormous amounts of publicly avail-
able data [1,2,50] most existing methods, such as Oncomine
[2] and Genvestigator [51], are based on the analysis of one
study at a time. Others, like the Celsius resource, provide the
analysis option on one Affymetrix array generation only,
therefore providing data from a more limited spectrum of tis-
Genome Biology 2008, Volume 9, Issue 9, Article R139 Kilpinen et al. R139.8
Genome Biology 2008, 9:R139
sues and diseases. In comparison, GeneSapiens provides
insights on 'body- and disease-wide' expression of 17,330
genes in approximately 10,000 human samples. Its value is
evidenced by the capturing of much of the known data on bio-
logical and medical associations for several tissue-specific
marker genes (Figures 3, 4, 5, 6), as well as in providing new
Detailed gene expression profile of PRAMEFigure 4
Detailed gene expression profile of PRAME. (a) Body-wide expression profile of the PRAME gene across the database. Each dot represents the expression
of PRAME in one sample. Anatomical origins of each sample are marked with colored bars below the gene plot. Sample types having higher than average
expression or an outlier expression profile are additionally colored in the figure (legend at the top left corner). The PRAME gene is a highly testis-specific
gene in normal samples, but is ectopically expressed across the majority of human cancers. Gene plots like these can easily be used to identify outlier
expression profiles, like as can be seen for kidney cancer in this case, where only a small fraction of the tumors are PRAME positive. (b) Box plot analysis
of the PRAME expression levels across a variety of normal and cancer tissues. The number of samples in each category is shown in parentheses. Normal
tissues are shown with green boxes and cancerous ones with red boxes. The box refers to the quartile distribution (25-75%) range, with the median
shown as a black horizontal line. In addition, the 95% range and individual outlier samples are shown.
2000 4000 6000 8000
0
1000 2000 3000 4000 5000
PRAME, ENSG00000185686
Samples
circulating reticulocyte
peripheral nervous system
liver
pancreas
testis
uterus
ALL
sarcoma
peritoneal cancer
lung cancer
neuroblastoma
adrenal gland cancer
kidney cancer
testicular cancer
other urogenital tumor
ovarian cancer
uterine cancer
breast cancer
Anatomical system
Hematological
Connectivity and muscular
Respiratory
Nervous
Endocrine & Salivary
GI tract & organs
Urogenital
Gynegological & Breast
Stem cells
Blood lymphoid cell (96)
Blood myeloid cell (32)
Blood unspecified leukocyte (28)
Bone marrow myeloid cell (10)
Bone marrow (8)
Hematopoietic stem cell (26)
Circulating reticulocyte (30)
Whole blood (41)
Lymphatic system (96)
Mus cle (73)
Tongue (11)
Heart (49)
Blood vessel (8)
Adipose tissue (16)
Hair follicle (16)
Central nervous system (425)
Peripheral nervous system (20)
Salivary gland (9)
Respiratory system (123)
Colorectal (23)
Other GIsystem (33)
Liver (15)
Liver and biliary system (9)
Pancreas (17)
Endocrine system (52)
Kidney (59)
Bladder (20)
Testis (22)
Prostate (147)
Breast (15)
Ovary (10)
Uterus (30)
Placenta (48)
Other urogenital system (11)
Mesenchymal stem cell (10)
Adult stem cell (10)
B-ALL (793)
T-ALL (68)
B-CLL (101)
AML (322)
Plasma cell leukemia (6)
Myeloma (102)
B-cell lymphoma (198)
Burkitts lymphoma (36)
T-cell lymphoma (43)
Chondrosarcoma (15)
Osteo sarc oma (11)
Ewings sarcoma (18)
Synovial sarcoma (12)
Leiomyosarcoma (12)
Rhabdomyosarcoma (37)
Liposarcoma (16)
Sarcoma, NOS (9)
Melanoma (8)
Glioma (275)
Neuroblastoma (123)
Oral squamous cell carcinoma (34)
Laryngopharynx squamous cell carcinoma (9)
Lung adenocarcinoma (311)
Lung, large cell cancer (8)
Lung, small cell cancer (6)
Lung, squamous cell carcinoma (83)
Lung, carcinoid tumor (27)
Mes oth elio ma (35)
Esophagus adenocarcinoma (13)
Gastric adenocarcinoma (21)
GIST (6)
Small intestine,adenocarcinoma (6)
Colorectal carcinoma (505)
Liver cancer (7)
Pancreatic cancer (29)
Adrenal tumors (11)
Thyroid carcinoma (58)
Renal cancer (209)
Nephroblastoma (33)
Bladder cancer (174)
Testis, seminoma (15)
Testis, non-seminoma (90)
Prostate adenocarcinoma (349)
Breast ductal cancer (327)
Breast lobular cancer (46)
Breast medullary cancer (12)
Breast cancer, others (15)
Breast carcinoma, NOS (652)
Ovarian, clear cell carcinoma (20)
Ovarian,endometrioid carcinoma (37)
Ovarian,mucinous carcinoma (19)
Ovarian, serous carcinoma (141)
Ovarian adenocarcinoma, NOS (59)
Ovarian tumor, others (10)
Peritoneum adenocarcinoma (13)
Uterine sarcoma (14)
Uterine adenocarcinoma (140)
Uterine, Mullerian tumor (15)
Cervical adenocarcinoma (8)
Cervical squamous cell carcinoma (57)
Vagina/Vulva carcinoma (9)
0
1000
2000
3000
4000
(a)
(b)
Genome Biology 2008, Volume 9, Issue 9, Article R139 Kilpinen et al. R139.9
Genome Biology 2008, 9:R139
insights on even well-studied cancer genes. GeneSapiens is
characterized by detailed anatomical, histopathological and
clinical annotations of disease states, a critically important
feature that is often missing in other more generic gene
expression database projects.
Virtually every gene we have studied in GeneSapiens has had
a distinct pattern of expression across the thousands of sam-
ples. Hence, GeneSapiens provides systematic biological and
medical annotation of individual human genes, which could
prove useful even in the case of relatively well-known and
abundantly studied cancer genes. For example, the fact that
by far the highest levels of KIT expression across all samples
available were seen in GISTs demonstrates that one could
identify key driver genes that are mutated or otherwise acti-
vated in human cancers and could, therefore, be of significant
therapeutic significance. This high level of overexpression of
KIT in GISTs probably reflects the selection pressure favoring
the expression of this gene during clonal cancer evolution.
GeneSapiens provides the exciting possibility that one could
find other previously unknown cancer genes with a similar
profile of high expression in one or a few cancer types only
that could also turn out to be driven by mutations or translo-
cations [47]. Conversely, even though we will see more and
more mutational data being generated from selected human
cancers, understanding the impact of the mutations on gene
expression will be important. Furthermore, it is extremely
useful to be able to characterize the expression of these 'can-
cer genes' across thousands of cancers and normal tissues of
different origins, as sequencing is typically done from a highly
selected group of samples. This is illustrated by our analysis
of the expression profiles for FEV and C1orf56 (MLLT11).
Besides the therapeutic importance, the data on several
serum biomarkers of disease, such as Troponin T and PSA,
indicate that the body-wide expression profiles of genes could
highlight genes with a high specificity to a single organ or dis-
Body-wide expression map of known cancer genesFigure 5
Body-wide expression map of known cancer genes. On the x-axis are 342 genes and on the y-axis are 110 in vivo tissues (both healthy and malignant) from
human. The color indicates the mean expression value of each gene in each tissue. Grey color signifies missing values. Values have been gene-wise scaled
(mean 0 and standard deviation 1). Both axes have been clustered by using Euclidean distance with complete linkage method. Below the expression map
are gene-wise Pearson correlation coefficients with four known cellular process/tissue-specific marker genes (Ki-67, PCNA, KRT19 and PTPRC).
Correlations have been calculated over 8,409 healthy and malignant samples using pairwise complete observations. Comparison of highest correlation
values and clusters of genes on the expression map confirm that through the analysis of in silico transcriptomics data it is possible to find both tissue
specificity and functional associations with processes such as cell cycle. For example, the orange colored branch contains genes having highest correlation
with epithelial marker KRT19, branches colored blue contain genes mostly expressed in the hematological system and they also correlate with PTPRC, a
marker for hematological tissues. Additionally, genes related to mitosis cluster together (purple branch), having highest correlations with Ki-67 and PCNA.
The rectangles (A, B, C) highlight three genes as examples of extreme expression in some cancers (see Figure 6 and Additional data files 7 and 8 for
enlargements of these areas).
Genome Biology 2008, Volume 9, Issue 9, Article R139 Kilpinen et al. R139.10
Genome Biology 2008, 9:R139
ease type, and, therefore, with potential value as serum
biomarkers.
The third important aspect of the GeneSapiens system is the
interactive nature of the analysis options that we have gener-
ated for making these data publicly available in a user-
friendly format. We have set up an interactive website [16] to
provide access to the in silico transcriptomics data with
detailed expression profiles for 17,330 genes across all the
9,783 annotated healthy and pathological human samples.
We provide the possibility to analyze the levels of gene
expression across all the tissues and malignant diseases (box-
and-whisker plots; Figure 3a–d), as well as to analyze gene
expression at the level of individual samples. The 'GeneSapi-
ens plot' (see, for example, Figure 4a) displays expression lev-
els of the genes in each of the 10,000 samples, arranged in
anatomical order and by disease type. The datapoints dis-
played are interactive and provide links to the specific type of
the sample, the histopathological diagnosis and the type of
the array generation used. We also provide filtered analysis
options where users can explore in detail a particular organ or
disease type as well as the option of analyzing the correlation
of any two genes across the whole database or subsets of tis-
sues or diseases. Taken together, we believe that the GeneSa-
piens analysis system provides a highly useful resource to the
biomedical research community.
Materials and methods
Data collection
This in silico collection of human transcriptomes was con-
structed by collecting 9,783 publicly available Affymetrix
microarray experiments in the form of CEL files as source
material. The uniqueness of the collected files was tested with
the cyclic redundancy check algorithm (cksum). For a com-
plete listing of the original source data from 157 separate
studies, please see Additional data file 3. We combined data
from the following Affymetrix generations (HG-U95A, HG-
U95Av2, HG-U133A, HG-U133B, HG-U133 Plus 2). Even
though HG-U133A and HG-U133B are not different genera-
tions, they do have 2,074 common genes, and we considered
them as such for the practical purposes of our normalization.
Data preprocessing
Data from all CEL files were pre-processed with the MAS5.0
algorithm [18] with default parameters. Although different
opinions exist about optimal preprocessing methods [52],
recent comparison studies indicate that MAS5.0 provides the
Bl
ood lympho
id
cell (96)
Bl
oo d myel
oi
dc
el
l(32
)
Bl
ood unspeci
fied
le
ukocyt
e(
28)
B
one
ma
rro w m
ye
lo
id cel
l(
10)
Bo
ne
ma
rro
w(8)
He
ma
to
poieti
cste
mc
el
l(26
)
Ci
rc
ul
at
in
gr
et
ic ul
o
cyt
e(
30)
W
hol
eblood(
41)
Lymphatic sys tem (96)
Musc le (73)
Tongue (11)
Heart (49)
Blood vesse
l(
8)
Adiposetissue(
16
)
Ha
ir fo llic le
(16)
Ce
nt
ra
ln
er
vous
sys
te
m(
425)
Pe
ri
pher
al nerv
ous syst
em
(2
0)
Salivary g
land (9
)
Resp
ir
at
ory sys
te
m (123)
Co
lo
re
ct
al (
23)
Othe
rG
Is
yste
m(
33
)
Liver
(15)
Li
ver and
b
ilia ry
syst
em
(9)
Pancreas (17)
E
ndocr
in e s
ystem (52)
Ki
dney (59)
Bl
adde
r(
20
)
Testis (22)
Prosta
te
(1
47
)
Br
east (
15)
Ovary (
10)
Uterus
(3
0)
Pl
acent a (
48
)
Ot
her u
rogeni ta
l syst em
(
11)
Me
senchy
ma
ls
te
m cell (
10
)
Adul t stem cell(
10
)
B-ALL (793)
T-
AL
L (68)
B-CLL(
101)
AML (322)
Pl
as
ma
cel
ll
eukem ia (6
)
Myel
om
a(
102)
B-cel
llym
phom
a(
198
)
Bu
rk
i
tts
lymphom
a(
36)
T-
ce
ll ly mp ho
ma
(43)
Chondr
osar
coma (
15)
Osteosar co
ma
(
11)
Ew
in
gs
sarco ma (18)
Synovi al sarcoma (12)
Le
io my
osar
coma (12)
Rhabdo myosarco ma (3
7)
Liposar co ma (
16)
Sarcom a,
NOS (
9)
Me
la
noma
(8
)
Glio
ma
(2
75
)
Ne
ur
ob
la
st
om
a(
123)
Or
al squa
mo us
ce
ll ca
rc
in
om
a(
34)
Lung
adenocar
ci
no
ma (311)
Lung
, large cell
cance
r(8)
Lung, smal
lc
ell c ancer (6)
Lung , squam ou s cell c
ar
cino ma (83)
Lung, car
ci
noi
d tumor (27)
Meso th e
lio
ma
(35)
Esophagu sa
denocar ci
noma
(13)
Ga
st
ri
ca
denoca rc
in
oma (
21)
GI
ST
(6
)
Small int
es
tine
,a
denocar
cino ma
(6
)
Co
lo
re
ct
al
ca
rc
in
oma (
505)
Li
ver
cance
r(
7)
Pa
ncr eat
ic cancer
(
29)
Ad
rena
lt
um
or
s(11)
Thy
ro
id
carcino ma (58)
Re
nal cance r (209)
Ne
phr obl astoma (33)
Bladder cance
r (174)
T
estis, s
em
i
nom a (15)
Testis, n
on
-s
em
in
oma (
90)
Pros
ta
te
adenocar
ci
nom
a(
349)
Br
east
duct
al cance
r(
327)
Br
east
lo
bu
lar c
ancer
(
46)
Br
eas
tm
edu llary cancer
(
12)
Br
east cancer
,o
th
ers (
15)
Br
east
carcinom
a,
NO
S (652)
Ov
arian,
cl
ear c ell carcino
ma (20)
Ovar
ia
n, endom et
ri
oid carcino ma (37)
Ovarian, mucinous carcinom a (19)
Ovarian, serous ca
rc
in om a (
141)
Ovarian adenocar ci
nom
a, NOS (59)
Ovar
ian t
um
or, o
th
er
s(
10
)
Peri
to
neum
adenocar
cino
ma
(1
3)
Uter
in
es
ar
co
ma
(1
4)
Uter
in
ea
denocar
cino ma
(1
40)
Ut
er
in
e, Mu
lle
ri
an
tu
mo
r(
15)
Ce
rv
ic
al adenocar
cino
ma
(8
)
Ce
rv
ic al s
quam
ous ce
ll ca
rc
in
oma (57)
Vagi
na
/V
ulva ca
rc
i
nom a (9)
0
1000
2000
3000
40
00
KIT ENSG00000157404
Heart (54)
Glioma (475)
Central nerv.system (426)
GIST (6)
Peripheral nerv.system (20)
Colorectal (6)
Skin (3)
TSHR
Wt1
CCDC6
DDX10
KIT
TAF15
BC
R
MLLT4
GNAS
Laryngopharynx squamous cell carcinoma (9 )
Expression profile for the KIT gene shows interesting patterns in the bodymap in Figure 5Figure 6
Expression profile for the KIT gene shows interesting patterns in the
bodymap in Figure 5. KIT exhibits extremely high expression in
gastrointestinal stromal tumors. KIT is known to be inhibited by Gleevec
®
,
demonstrating that findings like these pinpoint immediate possibilities for
drug repositioning.
Genome Biology 2008, Volume 9, Issue 9, Article R139 Kilpinen et al. R139.11
Genome Biology 2008, 9:R139
most faithful cellular network construction [53] and optimal
identification of differentially expressed genes [54]. In addi-
tion, other preprocessing methods may create false positive
results [53,55,56]. We used version 10 of the alternative CDF
files [20] summarizing the probe level intensities directly to
the Ensemble [57] gene IDs (Ensembl build 46). Probes map-
ping to multiple genes and other problems associated with old
generations of Affymetrix probe designs were thereby
excluded. Within our normalization process the term pre-
processing refers only to steps performed by the MAS5.0
algorithm, and subsequent normalization steps are described
below.
Sample-wise normalization with equalization
transformation
We utilized equalization transformation (Q) [21], a method
similar to widely used quantile normalization [22], to nor-
malize the pre-processed data. After Q normalization, the
dataset had the desired distribution that has been determined
prior to transformation. The normal distribution with mean
of 8 and standard deviation 2 (N(8, 4)) was selected as the
desired distribution since the distribution of logarithmic, pre-
processed values of all samples (N = 9,783) with median 7.92
and standard deviation 2.3 was near to this distribution
(Additional data file 1). EQ values were brought to exponen-
tial scale to maintain the scale of the original values.
The quantile normalization [22] would be another choice to
perform normalization but has considerable drawbacks in
this particular setting. First, it does not perform well when
there is variation in the number of genes between samples.
This problem is magnified when merging thousands of sam-
ples from different array generations. Also, the means of the
quantiles may vary substantially when new samples are
added to the dataset, whereas the change caused by the equal-
ization transformation is smaller. Quantile normalization is
also resource-intensive to compute for thousands of samples
with different numbers of measured genes. Thus, equaliza-
tion transformation (Q) [21] was the method of choice in this
study.
Array-generation-based gene centering (AGC)
To be able to compare the samples of in silico transcriptomics
also between the array generations, we developed a novel
method for gene-wise normalization of the data. In this AGC
method we assume that the mean of the expression values for
any particular gene in each array generation is the same. If the
mean value of some of the array generations differs substan-
tially from the others, the shift is assumed to be caused by the
array generation based variation, and the AGC method aims
to correct this variation. The AGC method requires that the
collection of samples to be analyzed is large enough so that
one can assume the distribution of values of each gene k to
represent the total distribution of all potential expression val-
ues across all tissues for each array generation i. Therefore,
the AGC method normalizes the data to have mean values
μ
i,
k
=
μ
all, k
for all array generations i, where
μ
all, k
is the mean of
all values of the gene k. Further, it is assumed that the mini-
mum and the maximum estimates for the gene value are
reached and the range of the gene k should approximately be
[a
k,
b
k
], where a
k
is the lowest 2% value and b
k
is the largest
2% value of gene k. AGC values should not go over this range.
However, if the new centered value exceeds the range, the dif-
ference is diminished towards the range limits with coeffi-
cient c, 0 ≤ c ≤ 1. Here, the coefficient is set to c = 1/5.
Coefficient c is necessary to prevent some extremely tissue-
specific genes from having arbitrarily large correction factors,
which is possible if the specific tissue is absent from one or
more array generation. The coefficient c affects 2.9% of all
correction factors. Of those cases, the proportion of the cor-
rection factor modified by coefficient c was, on the average,
7.6%. Thus, the coefficient c affected an extreme minority of
the corrections in a significant manner, but nevertheless, it
was found to be crucial for the AGC method. The centered val-
ues can now be obtained with:
where x
i, j, k
is the value of gene k in sample j from array gen-
eration i,
μ
i, k
is the mean of the values of gene k across array
generation I, and
μ
all, k
is the mean of the values of gene k
across all array generations. Further, the adjusted values are
computed based on the equation:
The resulting AGC values are now AGCvalue = 2
y
.
Some other methods [58,59] are useful to combine different
datasets. However, these are computationally very demand-
ing and probably impractical for datasets comprising almost
10,000 samples. Additionally, the performance of these
methods is not validated for integration of multiple datasets.
Sample annotation and manual curation
Annotation of the samples is important to make biological
and medical sense of the data. Since not all sources of CEL
files come with annotations following the MIAME standards
[60], we performed manual annotation of all the data in the
database. Annotation terms linked to each sample were
defined by a team of seven biologists and medical doctors.
The content of the database in terms of healthy, malignant
and other disease samples can be seen in Additional data file
4
Gene annotation
Gene annotation is based on Ensembl. The database has data
for each Ensembl gene, even those not featured on any arrays.
Gene data include transcript and protein product informa-
˘
()
,, ,, , ,
xx
ijk ijk ik allk
=−−
μμ
y
bcx b x b
acax
ijk
k i jk k i jk k
kkijk,,
,, ,,
,,
(
˘
),
˘
,
(
˘
),=
+− >
−−
for
forr
otherwise.
˘
,
˘
,
,,
,,
xa
x
ijk k
ijk
<
⎧
⎨
⎪
⎪
⎩
⎪
⎪
Genome Biology 2008, Volume 9, Issue 9, Article R139 Kilpinen et al. R139.12
Genome Biology 2008, 9:R139
tion, chromosome name and position (band and nucleotide
count), biotype (protein coding, miRNA, ribosomal, and so
on), and Hugo and Entrez IDs for each gene. These data were
downloaded from the Ensembl web site, using the same
Ensembl genome build version (release 46) as that used for
the construction of the used alternative CDF files [20].
Multidimensional scaling and clustering accuracy
We utilized classic MDS in order to diminish the number of
the dimensions within the data [24]. With MDS, 1,137 sam-
ples with 7,390 dimensions (that is, genes) were brought to
low-dimensional space so that the distance between each
sample pair with these new dimensions is very close to the
distance between the original values of the samples. As a dis-
tance metric, we used Manhattan distance.
K-means clustering and rand index analysis
K-means clustering was performed with default parameters
in R. The initial centroids were given as the median value of
each gene in array generations or tissues. The algorithm was
allowed to run for a maximum of 100,000 iterations for each
clustering. The corrected rand index [23] was calculated in R
with fpc library.
Replicate analysis
Replicate analysis was performed by comparing the correla-
tion coefficients of the logarithmic values of two or three
hybridizations from a single biological sample using standard
methods of computing the Pearson correlation coefficient.
This was done for all samples described in [9,26,27].
Body-wide expression profiles of genes
We visualize the expression profile of a single gene across all
human tissues with boxplots and with custom designed body-
wide expression plots. In the boxplots, the expression profiles
of a single gene are displayed and grouped into healthy sam-
ples (green boxes) and malignant samples (red boxes). Both
types are in anatomically meaningful order, allowing easy
comparison of related tissue types. Numbers of samples in
each tissue type are in parentheses.
Custom designed body-wide expression profiles show the
expression pattern of a single gene at the level of individual
samples, while its layout allows easy analysis of the biological
or medical significance of the profile. The y-axis provides the
expression level of the gene and the x-axis contains all sam-
ples arranged into a fixed order by the type of the sample
(healthy, malignant) and subsequently by the tissue type.
Thus, each dot describes the expression level of a particular
gene in one sample. The anatomical origin of each sample can
be seen from the color bar at the bottom of the image. Tissues
expressing the gene at a high level (more than one standard
deviation higher than the baseline for that gene or having a
group of outlier data points) are colored.
Body-wide gene expression heatmaps for human
cancer genes
Bodywide expression maps of genes are done with hierarchi-
cal clustering (Euclidean distance with Ward linkage) of
mean expression profile for 342 genes across 110 in vivo tis-
sues. The number of samples per tissue type is given in paren-
theses. Values for each gene are mean-centered at 0 with a
standard deviation of 1.
Availability of data
As the in silico transcriptomics data of this project are com-
posed of custom integration of already public microarray data
we provide a table describing the origins of the data used to
construct GeneSapiens (Additional data file 3). We have set
up a website [16] to allow browsing of expression profiles of
these genes and associated information as well as generation
of correlations/scatterplots between any pairs of genes across
any tissues.
Abbreviations
AGC: array-generation-based gene centering; GIST: gastroin-
testinal stromal tumor; MDS: multi-dimensional scaling;
PLAP: placental alkaline phosphatase; Q: quantile; QAGC: Q
normalized data to which AGC correction has been applied.
Competing interests
The institute has filed a patent application regarding the nor-
malization methodology.
Authors' contributions
SK contributed to the majority of data analysis, database con-
struction and development of normalization and writing of
the manuscript. RA and MS contributed to the development
and testing of the normalization. KO and EB contributed to
data collection and the annotation process. KO also contrib-
uted to data mining methods and checking of all annotations.
KI had a major contribution to the annotation. SH contrib-
uted to the development of normalization and supervised the
comparison and validation of the normalization methods. OK
supervised the entire project for database construction, data
mining and annotation efforts and participated in manuscript
writing and editing. The remaining authors contributed
towards annotation, data visualization and other methods as
well as editing the manuscript.
Additional data files
The following additional data are available with the online
version of this paper. Additional data file 1 shows the distri-
bution of preprocessed datapoints across the entire database
(solid line) and normal distribution (N(8, 4)) estimated from
it (dashed line). Additional data file 2 shows boxplots of vari-
ous known tissue-specific genes. Additional data file 3 lists
Genome Biology 2008, Volume 9, Issue 9, Article R139 Kilpinen et al. R139.13
Genome Biology 2008, 9:R139
the sources for all the raw expression data files used in this
study. Additional data file 4 lists the various healthy tissues,
cancers and non-cancer diseases represented by the samples
in the database and the amounts of samples in each of these
categories. Additional data file 5 lists rand indices for the dif-
ferent normalizations, and the distribution of array genera-
tions and tissues into clusters with Q and QAGC (Q
normalized data to which AGC correction has been applied)
normalized data. Additional data file 6 shows boxplots of var-
ious known tissue-specific genes. Additional data file 7 shows
that FEV has clearly elevated expression in several malignan-
cies, when compared to any healthy tissue. Most interestingly
this ETS-factor family member appears to have slightly ele-
vated expression in prostate cancer when compared to
healthy prostate. Additional data file 8 shows that expression
of the C1orf56 gene, also known as AF1Q or MLLT11, shows
extreme expression in several cancers, especially in
neuroblastoma.
Additional data file 1Distribution of preprocessed datapoints across the entire database and normal distribution (N(8, 4)) estimated from itDistribution of preprocessed datapoints across the entire database (solid line) and normal distribution (N(8, 4)) estimated from it (dashed line).Click here for fileAdditional data file 2Boxplots of various known tissue-specific genes(a) KLK3 (PSA) is a known prostate specific gene. This specificity is perfectly shown in its expression profile. (b) GFAP, a gene cod-ing for glial fibrillary acidic protein, is known to be expressed in central nervous system. Its expression profile perfectly confirms this prior knowledge.Click here for fileAdditional data file 3Sources for all the raw expression data files used in this studySources for all the raw expression data files used in this study.Click here for fileAdditional data file 4Various healthy tissues, cancers and non-cancer diseases repre-sented by the samples in the database and the amounts of samples in each of these categoriesVarious healthy tissues, cancers and non-cancer diseases repre-sented by the samples in the database and the amounts of samples in each of these categories.Click here for fileAdditional data file 5Rand indices for the different normalizations, and the distribution of array generations and tissues into clusters with Q and QAGC normalized dataRand indices for the different normalizations, and the distribution of array generations and tissues into clusters with Q and QAGC normalized data.Click here for fileAdditional data file 6Boxplots of various known tissue-specific genes(a) Insulin (INS) has pancreas specific expression, as one expects it to have. (b) LDHC is a known testis-specific gene and it is expressed above background only in healthy testis.Click here for fileAdditional data file 7FEV has clearly elevated expression in several malignancies, when compared to any healthy tissueMost interestingly this ETS-factor family member appears to have slightly elevated expression in prostate cancer when compared to healthy prostate.Click here for fileAdditional data file 8Expression of the C1orf56 gene shows extreme expression in sev-eral cancers, especially in neuroblastomaExpression of the C1orf56 gene, also known as AF1Q or MLLT11, shows extreme expression in several cancers, especially in neuroblastoma.Click here for file
Acknowledgements
The authors would like to acknowledge all annotators of the database as
well as Dr Outi Monni for providing facilities in the Biomedicum Biochip
Center. This study was supported by the Marie Curie Canceromics
(MEXT-CT-2003-2728) grant from the EU, EU-EPITRON (LSHC-CT-
2005-518417), Cancer Organizations of Finland, Sigrid Juselius Foundation,
Turku TE-Centre, and Academy of Finland (SysBio research program no.
5207532 and Centres of Excellence funding no. 213502) as well as personal
grants from the Emil Aaltonen Foundation, the Foundation of Technology,
the Finnish Konkordia Fund and the Foundation for Commercial and Tech-
nical Sciences (to RA). The authors would like to thank Kristine Kleivi,
Sirkku Pollari, Juha Rantala, Santosh Gupta and Kimmo Jaakkola for their
help in annotation of microarray data.
References
1. Lee HK, Hsu AK, Sajdak J, Qin J, Pavlidis P: Coexpression analysis
of human genes across many microarray datasets. Genome
Res 2004, 14:1085-1094.
2. Rhodes DR, Yu J, Shanker K, Deshpande N, Varambally R, Ghosh D,
Barrette T, Pandey A, Chinnaiyan AM: ONCOMINE: a cancer
microarray database and integrated data-mining platform.
Neoplasia 2004, 6:1-6.
3. Segal E, Shapira M, Regev A, Pe'er D, Botstein D, Koller D, Friedman
N: Module networks: identifying regulatory modules and
their condition-specific regulators from gene expression
data. Nat Genet 2003, 34:166-176.
4. Elo LL, Lahti L, Skottman H, Kylaniemi M, Lahesmaa R, Aittokallio T:
Integrating probe-level expression changes across genera-
tions of Affymetrix arrays. Nucleic Acids Res 2005, 33:e193.
5. Irizarry RA, Warren D, Spencer F, Kim IF, Biswal S, Frank BC, Gabri-
elson E, Garcia JG, Geoghegan J, Germino G, Griffin C, Hilmer SC,
Hoffman E, Jedlicka AE, Kawasaki E, Martinez-Murillo F, Morsberger
L, Lee H, Petersen D, Quackenbush J, Scott A, Wilson M, Yang Y, Ye
SQ, Yu W: Multiple-laboratory comparison of microarray
platforms[see comment][erratum appears in Nat Methods.
2005 Jun;2(6):477]. Nat Methods 2005, 2:345-350.
6. Jarvinen AK, Hautaniemi S, Edgren H, Auvinen P, Saarela J, Kallioniemi
OP, Monni O: Are data from different gene expression micro-
array platforms comparable? Genomics 2004, 83:1164-1168.
7. Larkin JE, Frank BC, Gavras H, Sultana R, Quackenbush J: Independ-
ence and reproducibility across microarray platforms[see
comment]. Nat Methods 2005, 2:337-344.
8. Marshall E: Getting the noise out of gene arrays. Science 2004,
306:630-631.
9. Hwang KB, Kong SW, Greenberg SA, Park PJ: Combining gene
expression data from different generations of oligonucle-
otide arrays. BMC Bioinformatics 2004, 5:159.
10. Eisen MB, Spellman PT, Brown PO, Botstein D: Cluster analysis
and display of genome-wide expression patterns. Proc Natl
Acad Sci USA 1998, 95:14863-14868.
11. Niehrs C, Pollet N:
Synexpression groups in eukaryotes. Nature
1999, 402:483-487.
12. Rhodes DR, Kalyana-Sundaram S, Mahavisno V, Barrette TR, Ghosh
D, Chinnaiyan AM: Mining for regulatory programs in the can-
cer transcriptome. Nat Genet 2005, 37:579-583.
13. Segal E, Yelensky R, Koller D: Genome-wide discovery of tran-
scriptional modules from DNA sequence and gene
expression. Bioinformatics 2003, 19(Suppl 1):i273-282.
14. Segal E, Friedman N, Koller D, Regev A: A module map showing
conditional activity of expression modules in cancer. Nat
Genet 2004, 36:1090-1098.
15. Zhang W, Morris QD, Chang R, Shai O, Bakowski MA, Mitsakakis N,
Mohammad N, Robinson MD, Zirngibl R, Somogyi E, Laurin N,
Eftekharpour E, Sat E, Grigull J, Pan Q, Peng WT, Krogan N, Green-
blatt J, Fehlings M, Kooy D van der, Aubin J, Bruneau BG, Rossant J,
Blencowe BJ, Frey BJ, Hughes TR: The functional landscape of
mouse gene expression. J Biol 2004, 3:21.
16. GeneSapiens []
17. R Development Core Team: R: A Language and Environment for Statis-
tical Computing Vienna, Austria: R Foundation for Statistical
Computing; 2007.
18. Statistical Algorithms Description Document [http://
www.affymetrix.com/support/technical/whitepapers/]
19. Pepper SD, Saunders EK, Edwards LE, Wilson CL, Miller CJ: The util-
ity of MAS5 expression summary and detection call
algorithms. BMC Bioinformatics 2007, 8:273.
20. Dai M, Wang P, Boyd AD, Kostov G, Athey B, Jones EG, Bunney WE,
Myers RM, Speed TP, Akil H, Watson SJ, Meng F: Evolving gene/
transcript definitions significantly alter the interpretation of
GeneChip data. Nucleic Acids Res 2005, 33:e175.
21. Kauraniemi P, Hautaniemi S, Autio R, Astola J, Monni O, Elkahloun A,
Kallioniemi A: Effects of Herceptin treatment on global gene
expression patterns in HER2-amplified and nonamplified
breast cancer cell lines. Oncogene 2004, 23:1010-1013.
22. Bolstad BM, Irizarry RA, Astrand M, Speed TP: A comparison of
normalization methods for high density oligonucleotide
array data based on variance and bias.
Bioinformatics 2003,
19:185-193.
23. Hubert Lawrence AP: Comparing partitions. J Classification
1985:193-218.
24. Khan J, Simon R, Bittner M, Chen Y, Leighton SB, Pohida T, Smith PD,
Jiang Y, Gooden GC, Trent JM, Meltzer PS: Gene expression pro-
filing of alveolar rhabdomyosarcoma with cDNA
microarrays. Cancer Res 1998, 58:5009-5013.
25. Bhattacharya S, Mariani TJ: Transformation of expression inten-
sities across generations of Affymetrix microarrays using
sequence matching and regression modeling. Nucleic Acids Res
2005, 33:e157.
26. Ross ME, Zhou X, Song G, Shurtleff SA, Girtman K, Williams WK, Liu
HC, Mahfouz R, Raimondi SC, Lenny N, Patel A, Downing JR: Classi-
fication of pediatric acute lymphoblastic leukemia by gene
expression profiling. Blood 2003, 102:2951-2959.
27. Yeoh EJ, Ross ME, Shurtleff SA, Williams WK, Patel D, Mahfouz R,
Behm FG, Raimondi SC, Relling MV, Patel A, Cheng C, Campana D,
Wilkins D, Zhou X, Li J, Liu H, Pui CH, Evans WE, Naeve C, Wong L,
Downing JR: Classification, subtype discovery, and prediction
of outcome in pediatric acute lymphoblastic leukemia by
gene expression profiling. Cancer Cell 2002, 1:133-143.
28. Christenson RH, Duh SH, Newby LK, Ohman EM, Califf RM, Granger
CB, Peck S, Pieper KS, Armstrong PW, Katus HA, Topol EJ: Cardiac
troponin T and cardiac troponin I: relative values in short-
term risk stratification of patients with acute coronary syn-
dromes. GUSTO-IIa Investigators. Clin Chem 1998, 44:494-501.
29. Isotalo PA, Greenway DC, Donnelly JG: Metastatic alveolar
rhabdomyosarcoma with increased serum creatine kinase
MB and cardiac troponin T and normal cardiac troponin I.
Clin Chem 1999, 45:1576-1578.
30. Plouzek CA, Leslie KK, Stephens JK, Chou JY: Differential gene
expression in the amnion, chorion, and trophoblast of the
human placenta. Placenta 1993, 14:277-285.
31. Kellen JA, Bush RS, Malkin A: Placenta-like alkaline phosphatase
in gynecological cancers. Cancer Res 1976, 36:269-271.
32. Ind TE, Iles RK, Carter PG, Lowe DG, Shepherd JH, Hudson CN,
Chard T: Serum placental-type alkaline phosphatase activity
in women with squamous and glandular malignancies of the
Genome Biology 2008, Volume 9, Issue 9, Article R139 Kilpinen et al. R139.14
Genome Biology 2008, 9:R139
reproductive tract. J Clin Pathol 1994, 47:1035-1037.
33. Philippe E, Omlin FX, Droz B: Myelin-associated glycoprotein
immunoreactive material: an early neuronal marker of dor-
sal root ganglion cells during chick development. Brain Res
1986, 392:275-277.
34. Shaw JL, Diamandis EP: Distribution of 15 human kallikreins in
tissues and biological fluids. Clin Chem 2007, 53:1423-1432.
35. Brenner M, Kisseberth WC, Su Y, Besnard F, Messing A: GFAP pro-
moter directs astrocyte-specific expression in transgenic
mice. J Neurosci 1994, 14:1030-1037.
36. Kalejs M, Erenpreisa J: Cancer/testis antigens and gametogene-
sis: a review and "brain-storming" session. Cancer Cell Int 2005,
5:4.
37. Epping MT, Wang L, Edel MJ, Carlee L, Hernandez M, Bernards R:
The human tumor antigen PRAME is a dominant repressor
of retinoic acid receptor signaling. Cell 2005, 122:835-847.
38. Schluter C, Duchrow M, Wohlenberg C, Becker MH, Key G, Flad HD,
Gerdes J: The cell proliferation-associated antigen of antibody
Ki-67: a very large, ubiquitous nuclear protein with numer-
ous repeated elements, representing a new kind of cell cycle-
maintaining proteins. J Cell Biol 1993, 123:513-522.
39. Martinez-Lara I, Gonzalez-Moles MA, Ruiz-Avila I, Bravo M, Ramos
MC, Fernandez-Martinez JA: Proliferating cell nuclear antigen
(PCNA) as a marker of dysplasia in oral mucosa. Acta Stomatol
Belg 1996, 93:29-32.
40. Lacroix M: Significance, detection and markers of dissemi-
nated breast cancer cells. Endocr Relat Cancer 2006,
13:1033-1067.
41. Aiuti A, Friedrich C, Sieff CA, Gutierrez-Ramos JC: Identification of
distinct elements of the stromal microenvironment that
control human hematopoietic stem/progenitor cell growth
and differentiation.
Exp Hematol 1998, 26:143-157.
42. Dennis G Jr, Sherman BT, Hosack DA, Yang J, Gao W, Lane HC, Lem-
picki RA: DAVID: Database for Annotation, Visualization, and
Integrated Discovery. Genome Biol 2003, 4:P3.
43. Ashburner M, Ball CA, Blake JA, Botstein D, Butler H, Cherry JM,
Davis AP, Dolinski K, Dwight SS, Eppig JT, Harris MA, Hill DP, Issel-
Tarver L, Kasarskis A, Lewis S, Matese JC, Richardson JE, Ringwald M,
Rubin GM, Sherlock G: Gene ontology: tool for the unification
of biology. The Gene Ontology Consortium. Nat Genet 2000,
25:25-29.
44. Demetri GD, von Mehren M, Blanke CD, Abbeele AD Van den, Eisen-
berg B, Roberts PJ, Heinrich MC, Tuveson DA, Singer S, Janicek M,
Fletcher JA, Silverman SG, Silberman SL, Capdeville R, Kiese B, Peng
B, Dimitrijevic S, Druker BJ, Corless C, Fletcher CD, Joensuu H: Effi-
cacy and safety of imatinib mesylate in advanced gastrointes-
tinal stromal tumors. N Engl J Med 2002, 347:472-480.
45. Tse W, Meshinchi S, Alonzo TA, Stirewalt DL, Gerbing RB, Woods
WG, Appelbaum FR, Radich JP: Elevated expression of the AF1q
gene, an MLL fusion partner, is an independent adverse
prognostic factor in pediatric acute myeloid leukemia. Blood
2004, 104:3058-3063.
46. Iljin K, Wolf M, Edgren H, Gupta S, Kilpinen S, Skotheim RI, Peltola M,
Smit F, Verhaegh G, Schalken J, Nees M, Kallioniemi O: TMPRSS2
fusions with oncogenic ETS factors in prostate cancer
involve unbalanced genomic rearrangements and are associ-
ated with HDAC1 and epigenetic reprogramming. Cancer Res
2006, 66:10242-10246.
47. Tomlins SA, Rhodes DR, Perner S, Dhanasekaran SM, Mehra R, Sun
XW, Varambally S, Cao X, Tchinda J, Kuefer R, Lee C, Montie JE, Shah
RB, Pienta KJ, Rubin MA, Chinnaiyan AM: Recurrent fusion of
TMPRSS2 and ETS transcription factor genes in prostate
cancer. Science 2005, 310:644-648.
48. Brazma A, Parkinson H, Sarkans U, Shojatalab M, Vilo J, Abeyguna-
wardena N, Holloway E, Kapushesky M, Kemmeren P, Lara GG,
Oezcimen A, Rocca-Serra P, Sansone SA: ArrayExpress - a public
repository for microarray gene expression data at the EBI.
Nucleic Acids Res 2003, 31:68-71.
49. Edgar R, Domrachev M, Lash AE: Gene Expression Omnibus:
NCBI gene expression and hybridization array data
repository. Nucleic Acids Res 2002, 30:207-210.
50. Day A, Carlson MR, Dong J, O'Connor BD, Nelson SF: Celsius: a
community resource for Affymetrix microarray data.
Genome Biol 2007, 8:R112.
51. Zimmermann P, Hirsch-Hoffmann M, Hennig L, Gruissem W: GEN-
EVESTIGATOR. Arabidopsis microarray database and anal-
ysis toolbox. Plant Physiol 2004, 136:2621-2632.
52. Seo J, Hoffman EP: Probe set algorithms: is there a rational best
bet? BMC Bioinformatics 2006, 7:395.
53. Lim WK, Wang K, Lefebvre C, Califano A: Comparative analysis
of microarray normalization procedures: effects on reverse
engineering gene networks. Bioinformatics 2007, 23:i282-288.
54. Choe SE, Boutros M, Michelson AM, Church GM, Halfon MS: Pre-
ferred analysis methods for Affymetrix GeneChips revealed
by a wholly defined control dataset. Genome Biol 2005, 6:R16.
55. Harr B, Schlotterer C: Comparison of algorithms for the analy-
sis of Affymetrix microarray data as evaluated by co-expres-
sion of genes in known operons. Nucleic Acids Res 2006, 34:e8.
56. Ploner A, Miller LD, Hall P, Bergh J, Pawitan Y: Correlation test to
assess low-level processing of high-density oligonucleotide
microarray data. BMC Bioinformatics 2005, 6:80.
57. Hubbard T, Andrews D, Caccamo M, Cameron G, Chen Y, Clamp M,
Clarke L, Coates G, Cox T, Cunningham F, Curwen V, Cutts T, Down
T, Durbin R, Fernandez-Suarez XM, Gilbert J, Hammond M, Herrero
J, Hotz H, Howe K, Iyer V, Jekosch K, Kahari A, Kasprzyk A, Keefe D,
Keenan S, Kokocinsci F, London D, Longden I, McVicker G, et al.:
Ensembl 2005. Nucleic Acids Res 2005, 33:D447-453.
58. Benito M, Parker J, Du Q, Wu J, Xiang D, Perou CM, Marron JS:
Adjustment of systematic microarray data biases. Bioinformat-
ics 2004, 20:105-114.
59. Gilks WR, Tom BD, Brazma A: Fusing microarray experiments
with multivariate regression. Bioinformatics 2005, 21(Suppl
2):ii137-143.
60. Brazma A, Hingamp P, Quackenbush J, Sherlock G, Spellman P,
Stoeckert C, Aach J, Ansorge W, Ball CA, Causton HC, Gaasterland
T, Glenisson P, Holstege FC, Kim IF, Markowitz V, Matese JC, Parkin-
son H, Robinson A, Sarkans U, Schulze-Kremer S, Stewart J, Taylor R,
Vilo J, Vingron M: Minimum information about a microarray
experiment (MIAME)-toward standards for microarray
data. Nat Genet 2001, 29:365-371.