Báo cáo y học: "Evolutionary rate and gene expression across different brain regions" ppt
Bạn đang xem bản rút gọn của tài liệu. Xem và tải ngay bản đầy đủ của tài liệu tại đây (429.77 KB, 11 trang )
Genome Biology 2008, 9:R142
Open Access
2008Tulleret al.Volume 9, Issue 9, Article R142
Research
Evolutionary rate and gene expression across different brain
regions
Tamir Tuller
*†
, Martin Kupiec
†
and Eytan Ruppin
*‡
Addresses:
*
School of Computer Sciences, Tel Aviv University, Ramat Aviv 69978, Israel.
†
Department of Molecular Microbiology and
Biotechnology, Tel Aviv University, Ramat Aviv 69978, Israel.
‡
School of Medicine, Tel Aviv University, Ramat Aviv 69978, Israel.
Correspondence: Tamir Tuller. Email: Eytan Ruppin. Email:
© 2008 Tuller et al.; licensee BioMed Central Ltd.
This is an open access article distributed under the terms of the Creative Commons Attribution License ( which
permits unrestricted use, distribution, and reproduction in any medium, provided the original work is properly cited.
Brain gene expression and evolution<p>Cortically expressed genes are more conserved than sub-cortical ones and gene expression levels exert stronger constraints on sequence evolution in cortical than in sub-cortical regions.</p>
Abstract
Background: The evolutionary rate of a protein is a basic measure of evolution at the molecular
level. Previous studies have shown that genes expressed in the brain have significantly lower
evolutionary rates than those expressed in somatic tissues.
Results: We study the evolutionary rates of genes expressed in 21 different human brain regions.
We find that genes highly expressed in the more recent cortical regions of the brain have lower
evolutionary rates than genes highly expressed in subcortical regions. This may partially result from
the observation that genes that are highly expressed in cortical regions tend to be highly expressed
in subcortical regions, and thus their evolution faces a richer set of functional constraints. The
frequency of mammal-specific and primate-specific genes is higher in the highly expressed gene sets
of subcortical brain regions than in those of cortical brain regions. The basic inverse correlation
between evolutionary rate and gene expression is significantly stronger in brain versus nonbrain
tissues, and in cortical versus subcortical regions. Extending upon this cortical/subcortical trend,
this inverse correlation is generally more marked for tissues that are located higher along the
cranial vertical axis during development, giving rise to the possibility that these tissues are also
more evolutionarily recent.
Conclusions: We find that cortically expressed genes are more conserved than subcortical ones,
and that gene expression levels exert stronger constraints on sequence evolution in cortical versus
subcortical regions. Taken together, these findings suggest that cortically expressed genes are
under stronger selective pressure than subcortically expressed genes.
Background
The evolutionary rate (ER) of a protein, the ratio between the
rate of its nonsynonymous to the rate of its synonymous
mutations, dN/dS, is a basic measure of evolution at the
molecular level (for example, see [1,2]). (Throughout the
report, when we talk about the ER of a gene we actually refer
to the ER of its corresponding protein.) It is affected by many
systemic factors, including gene dispensability, expression
level, the number of protein interactions, and the recombina-
tion rate [3-7]. Notably, functionally related genes tend to
have similar ERs [8,9]. The expression level of yeast genes has
been observed to be markedly and negatively correlated with
Published: 23 September 2008
Genome Biology 2008, 9:R142 (doi:10.1186/gb-2008-9-9-r142)
Received: 20 August 2008
Accepted: 23 September 2008
The electronic version of this article is the complete one and can be
found online at /> Genome Biology 2008, Volume 9, Issue 9, Article R142 Tuller et al. R142.2
Genome Biology 2008, 9:R142
their ER [5,10], even when controlling for the dispensability
of the genes [4]. This inverse relation extends to other eukary-
otes (including humans and other vertebrates) [11]. Obvi-
ously, when considering the relationship between ER and
gene expression in multicellular organisms, the expression
levels of genes in different tissues and cell types should be
considered separately. Indeed, previous studies [12-15] have
shown that genes vary in their rates of evolution according to
the tissues in which they are highly expressed, with genes
expressed in the brain evolving at significantly slower rates
than those expressed in other tissues. A general principle
arising from such studies has been that tissue-specific genes
have higher ERs than 'housekeeping' genes, which are
broadly expressed in most tissues [16-18].
To explain this observation, the tissue-driven hypothesis of
genomic evolution was recently proposed, starting from the
probable assumption that genes influence phenotypic charac-
ters by their expression in specific tissues [19]. Accordingly, if
a protein is expressed in several different tissues, then the
evolution of its sequence may be under multi-tissue-specific
constraints, resulting in a slower rate of evolution. Among
genes with similar expression broadness (genes that are
expressed in about the same number of tissues), those genes
expressed in tissues that are presumably under more strin-
gent evolutionary selection pressure (for example, neural tis-
sues) generally tend to evolve more slowly than those that are
expressed in tissues that presumably are under lesser selec-
tion pressure [19]. This hypothesis is concordant with the
notion that each tissue is associated with a certain level of
evolutionary constraints acting on the genes expressed in it,
with the brain imposing more constraints than other tissues
[15].
This study aims to go beyond previous investigations and to
study the tissue-driven hypothesis at higher resolution, in an
organ of central importance to human evolution: the brain.
To this end, we examine the evolution of genes that are highly
expressed in different brain tissues. Our work stems from the
basic observation that the transcriptomes of different brain
regions differ substantially from each other [20]. These dif-
ferences are likely to be functionally significant, because they
mainly involve genes that are associated with central func-
tions such as signal transduction and neurogenesis [20].
First, we are interested in examining whether the basic
inverse relationship between a gene's tissue specificity and its
ER also holds in different brain regions. Second, we examine
the ER of highly expressed genes in the more phylogenetically
recent cortical brain regions, compared with the ERs of genes
that are highly expressed in older brain regions. It was previ-
ously found that older genes (that arose earlier in evolution)
tend to evolve more slowly than newer ones [21,22]. Does this
finding translate to the brain tissue/region level? (Specifi-
cally, do genes expressed in older brain regions evolve more
slowly than those expressed in new ones?) Third, we examine
the extent to which the basic correlation between expression
level and sequence conservation varies across brain regions,
and learn from its variation about the selection forces that
drive sequence evolution of highly expressed genes.
Results
Brain region-specific indices of gene expression and
conservation
We analyze a dataset encompassing the expressions of 10,594
human genes, across 78 tissues (Additional data file 1) [23].
Twenty-one of these tissues are from different brain regions
(Table 1). First, these brain regions can be broadly divided
into two major phylogenetic classes: cortical regions, which
are primarily characteristic of the mammalian lineage; and
subcortical brain regions, which have a broad phyletic distri-
bution [24]. (No other vertebrates have a structure that
clearly resembles the isocortical regions studied here [25].)
Second, the brain regions are divided into four major devel-
opmental classes, including those that develop from the
embryonic forebrain, midbrain, hindbrain, and spinal cord
[26]. For each brain region we define a gene set, composed of
the genes that are over-expressed in that particular region. A
gene is defined as over-expressed in a given brain region if its
expression is at least 2 standard deviations higher than the
mean of its expression across all of the regions.
Our dataset encompasses 4,919 genes that are over-expressed
in at least one brain region. When this list of genes is analyzed
using the Gene Ontology (GO) process category, enrichment
for neural functions is found, attesting to their biologic rele-
vance (Additional data files 2 and 3). We focus on over-
expressed genes, following previous studies of expression sig-
natures of different brain regions [27]. Notably, the enriched
GO categories of under-expressed genes do not include neu-
rally related categories (Additional data file 4). We addition-
ally define for each brain region a more stringent specific
characteristic set (SCS), which includes genes that are solely
highly expressed in this region and in no other region.
We denote the brain expression specificity T
max
to be the ratio
between the highest expression level of a gene in a brain
region and the sum of its expression levels across all 21 brain
regions. The coefficient of variance (CV) of a gene is the vari-
ance of its expression levels across brain regions divided by its
mean expression. The CV thus estimates the expression vari-
ability of each gene across regions. The ERs of all of the genes
along the human lineage and along a longer, mammalian
range (human-mouse) were computed (see Materials and
methods, below) and were used to extract the median ERs of
over-expressed genes in each brain region (columns 4 and 5
in Table 1). Because the development of cortical and subcorti-
cal regions is not a human-specific morphologic trait but
already a mammalian one, we primarily report the results in
the main text using the human-mouse lineage for estimating
ERs, and provide the corresponding (qualitatively similar)
Genome Biology 2008, Volume 9, Issue 9, Article R142 Tuller et al. R142.3
Genome Biology 2008, 9:R142
results using the mammalian ERs in the supplementary
materials (Additional data file 5 [Supplementary note 1]).
A four-level estimation of gene age was computed following a
procedure similar to that in [21,22], by searching for
homologs of each human gene in four sets of organisms
(mammals, fish, insects and worms, and yeast and plants). A
gene with a homolog only in mammals is considered a mam-
malian gene, and a gene with a homolog only in the primates
is considered a primate gene (see Materials and methods,
below). Table 1 depicts the age group, developmental origin,
median ER (human lineage), median ER (human-mouse),
frequency of mammalian genes, frequency of mammalian
SCS genes, frequency of primate genes, and mean T
max
for
each brain region, computed for the genes over-expressed in
each region. The last column in the table includes the correla-
tion between the genes' ER (human-mouse), and their
expression levels in each region and a corresponding P value.
It can be seen that there is excellent agreement between the
maximally expressed gene set and the more stringent SCS
gene set, both in their ER (with both the mammalian and
human estimators) and in gene age.
Evolutionary rate, gene age and gene expression in
cortical vs sub-cortical regions
We computed the correlation between the ER and gene
expression levels in each region, and the median ER of its
over-expressed genes (see Figures 1 and 2 for the ER of each
tissue separately, and gene expression in the prefrontal cortex
versus their ERs).
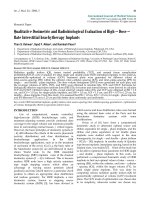
The ER of genes that are highly expressed in cortical brain
regions is significantly lower than that of genes highly
expressed in noncortical brain regions (mean ER of 0.1016
versus 0.1378; P < 10
-16
). The medians of the SCS genes of the
regions in the two sets exhibit a similar trend (P = 6 × 10
-5
).
This finding remains robust also after controlling for the total
gene expression of genes and their expression breadth (Addi-
tional data file 5 [Supplementary note 2]). Similarly, gene
compactness and gene essentiality, which are additional
important determinants of mammalian protein ER (essential
genes have lower ERs, and compact genes have higher ER val-
ues [28]), cannot explain the difference in ERs between corti-
cal and subcortical genes. The frequency of essential genes
among cortical genes is lower (15%) than among subcortical
Table 1
The 21 brain regions examined in this study and their characteristics
Index Brain tissue Developmental origin Median ER
(human
lineage)
Median ER
(mouse-human)
Frequency of
mammalian
genes
Frequency of
mammalian
genes for SCS
Frequency
of primate
genes
Brain region
specificity
index (T
max
)
Correlation (P value)
between ER and expression
level (human-mouse)
1 Dorsal root
ganglion
Spinal cord 0.31 0.167 0.17 0.12 0.016248 0.12 -0.0747 (1.4 × 10
-14
)
2 Medulla oblongata Hindbrain 0.28 0.102 0.12 0.14 0.005525 0.1 -0.1844 (<10
-16
)
3 Pons Hindbrain 0.27 0.13 0.17 0.13 0.013158 0.11 -0.1442 (<10
-16
)
4 Spinal cord Spinal cord 0.25 0.127 0.13 0.16 0.003704 0.11 -0.1664 (<10
-16
)
5 Olfactory bulb Subpallium (forebrain) 0.28 0.126 0.09 0.08 0 0.14 -0.1475 (<10
-16
)
6Trigeminal
ganglion
Different
developmental origin
0.31 0.161 0.17 0.17 0.021223 0.12 -0.0445 (4.7 × 10
-6
)
7 Ciliary ganglion Different
developmental origin
0.29 0.154 0.14 0.12 0.015152 0.12 -0.0710 (2.6 × 10
-13
)
8 Superior cervical
ganglion
Different
developmental origin
0.31 0.161 0.16 0.13 0.013664 0.12 -0.0335 (5.7 × 10
-4
)
9 Cerebellum Hindbrain 0.14 0.083 0.08 0.09 0.004357 0.11 -0.1799 (<10
-16
)
10 Cerebellum
peduncles
Hindbrain 0.17 0.096 0.08 0.09 0.005102 0.12 -0.1846 (<10
-16
)
11 Hypothalamus Diencephalon
(forebrain)
0.27 0.12 0.08 0.08 0 0.11 -0.1922 (<10
-16
)
12 Thalamus Diencephalon
(forebrain)
0.19 0.103 0.1 0.04 0 0.10 -0.1903 (<10
-16
)
13 Subthalamic
nucleus
Diencephalon
(forebrain)
0.23 0.11 0.14 0.2 0.005362 0.10 -0.1811 (<10
-16
)
14 Caudate nucleus Subpallium (forebrain) 0.26 0.105 0.09 0 0 0.11 -0.1817 (<10
-16
)
15 Globus pallidus Subpallium (forebrain) 0.23 0.107 0.12 0.1 0.010753 0.1 -0.1733 (<10
-16
)
16 Amygdala Subpallium (forebrain) 0.21 0.084 0.09 0.11 0.002151 0.1 -0.2294 (<10
-16
)
17 Cingulate cortex Pallium (forebrain) 0.2 0.094 0.07 0.05 0 0.1 -0.1931 (<10
-16
)
18 Occipital lobe (pallium) (forebrain) 0.2 0.089 0.05 0 0 0.09 -0.2199 (<10
-16
)
19 Parietal lobe Pallium (forebrain) 0.22 0.119 0.1 0.14 0 0.1 -0.1893 (<10
-16
)
20 Temporal lobe Pallium (forebrain) 0.21 0.104 0.13 0.1 0.006897 0.11 -0.2214 (<10
-16
)
21 Prefrontal cortex Pallium (forebrain) 0.22 0.089 0.08 0.06 0.002299 0.1 -0.1747 (<10
-16
)
ER, evolutionary rate; SCS, specific characteristic set.
Genome Biology 2008, Volume 9, Issue 9, Article R142 Tuller et al. R142.4
Genome Biology 2008, 9:R142
genes (16%), ruling out the possibility that the lower ER of
cortical genes is due to the fact that they include greater num-
bers of lethal genes; and the fact that the ER of cortical genes
is significantly lower than that of noncortical genes remains
robust even after controlling for gene compactness (Addi-
tional data file 5 [Supplementary note 3]).
Finally, genes that are over-expressed in both parts of the
brain have significantly lower median ERs than genes that are
over-expressed in nonbrain regions (Figure 2).
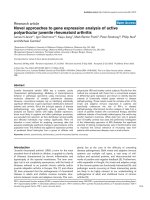
The correlation between the ER and expression levels is
higher in cortical than in subcortical brain regions (P = 0.038;
Figures 1 and 3), and higher in brain tissues than in other tis-
sues. The raw mean expression levels in cortical regions is
slightly lower than the subcortical regions (514 versus 518),
thus ruling out the possibility that this finding is actually an
indirect consequence of lower expression levels in subcortical
versus cortical regions (because, hypothetically, lower
expression levels could transcribe to a decreased signal-to-
noise ratio, and hence to decreased ER/expression
correlations).
We repeated our analysis (ER and ER/expression correla-
tions in cortical and subcortical regions) in two other organ-
isms: Mus musculus (mouse) and Pan troglodytes (chimp).
Although the gene expression measurements of these two
organisms is less abundant than in human, in both cases the
ER of the cortical genes was lower than that of the subcortical
genes (Additional data file 5 [Supplementary notes 4 and 5]
and Additional data files 6 and 7).
Interestingly, the prefrontal cortex exhibits the greatest cor-
relation between gene expression and ER among all of the 78
tissues (see Additional data files 8 and 9 for the ERs in all of
the tissues, and the correlation between ER and expression
level in each tissue). This cortical region is known to be asso-
ciated in primates and humans with complex associative cog-
nitive tasks such as those involving delayed response and
working memory. Other interesting phenomena are the very
low ER of the cerebellum, and the very low correlation
between expression level and ER in the various ganglia. We
verified that even after removing these tissues the ER of cor-
tical regions is still lower than that of subcortical regions (P =
1.3 × 10
-13
when considering all of the corresponding genes).
The very low correlation between expression level and ER
observed in the various ganglia may perhaps arise from the
very small tissue volume of the latter, which may attenuate
their effect in determining the ERs of their highly expressed
genes. The high conservation of genes that are highly
expressed in the cerebellum is a quandary; it is not a result of
potential lower tissue specificity of these genes, which is not
statistically different from the tissue specificity of the subcor-
tical or all brain genes. However, the cerebellar genes have
higher mean expression levels than the subcortical genes
(1.09 versus 0.72; P < 10
-16
), which can partially explain their
higher conservation.
The frequency of mammal-specific genes is higher in the
highly expressed gene sets of subcortical brain regions than in
those of cortical regions (with mean frequencies of 0.121 ver-
sus 0.086; P = 0.03). This difference remains similar also
when considering primate-specific genes. The mean fre-
quency is 0.0073 in subcortical versus 0.0018 in cortical
regions (P = 0.05). This difference is surprising, but it is con-
sistent with the negative correlation found between the genes'
age and ER (-0.23; P < 10
-16
). A similar inverse correlation
across all tissues was previously observed [21,22]. Genes that
are expressed in cortical regions have higher mean expression
levels across brain tissues than genes expressed in subcortical
regions (1.6 versus 1; P = 2.4 × 10
-10
) and across all somatic
tissues (0.9 versus 0.7; P < 10
-16
). This fact can partially
explain the lower ER values of cortical genes, because these
genes are likely to be subjected to diverse simultaneous selec-
tive pressures.
Relation between ER, expression level, and region
specificity
Previous work has demonstrated that housekeeping genes
tend to evolve more slowly than tissue-specific genes [17].
Gene expression across brain tissues manifests a similar
region-specificity relation between gene expression and ER;
genes highly expressed in fewer brain regions have higher ER
values (the Spearman correlation between T
max
and ER along
the mammalian lineage is 0.131 [P < 10
-16
] and along the
human lineage it is 0.0504 [P < 2 × 10
-7
). A similar trend is
observed by noting that genes with higher CV levels have
higher ER values (Spearman correlation along the mamma-
lian lineage is 0.1269 [P < 10
-16
] and along the human lineage
it is 0.0447 [P = 4.1 × 10
-6
]).
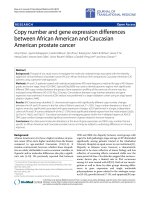
Expression in the prefrontal cortex versus ERFigure 1
Expression in the prefrontal cortex versus ER. Expression in the prefrontal
cortex is presented on the x-axis (log scale) and ER (human-mouse) on the
y-axis (log scale). ER, evolutionary rate.
-5 -4 -3
4
-2 -1 0 1 2 3-6
4
2
0
-2
-4
-6
-8
Genome Biology 2008, Volume 9, Issue 9, Article R142 Tuller et al. R142.5
Genome Biology 2008, 9:R142
Genes that are expressed in cortical regions are also less
region-specific than those expressed in subcortical regions;
the T
max
values of genes expressed in each cortical region are
significantly higher than those expressed in each subcortical
regions (mean T
max
of 0.10 versus 0.12; P = 0.02). Aggregat-
ing all genes expressed in cortical or subcortical regions
together yields a mean T
max
of 0.106 for cortical regions and
mean T
max
of 0.116 for subcortical ones (P = 3.4 × 10
-12
),
showing a similar trend. Thus, genes that are highly
expressed in cortical regions have a higher expression
breadth that may partly (Additional data file 5 [Supplemen-
tary note 6]) account for their overall lower ER values. This
reduced region specificity of cortical genes may arise due to a
'preferential attachment'-like process [29], in which the genes
that are highly expressed in the more recent cortical regions
in the mammalian lineage tend to be those that already have
a broad expression breadth in subcortical regions. In accord-
ance with that, we find a marked correlation of 0.28 (P < 10
-
16
) between the number of cortical and subcortical regions in
which a gene is expressed (Figure 4).
ER and gene expression: a developmental perspective
We divided the brain into five main developmental areas
[26]: three forebrain areas, including the pallium, subpal-
lium, and the diencephalon; the hind brain; and the spinal
cord (our data do not include midbrain structures, and addi-
tionally includes three cranial nuclei of different developmen-
tal origins).
These five developmental areas have an ordered placement
along the cranial vertical axis, with the spinal cord being the
lowest [26,30], then the hindbrain, followed by the dien-
cephalon, the subpallium, and the pallium (the highest). The
correlation between ER and gene expression levels exhibits
an interesting pattern; their magnitude manifests a signifi-
cant correlation with the region location on the cranial verti-
cal axis (Spearman ranked correlation of 0.9 [P = 0.037]when
averaging the regions of each developmental area, and Spear-
man ranked correlation of 0.5 [P = 0.034] when considering
each region separately; Figure 5, and Additional data files 10
and 11). This finding reinforces the observations made in the
Median ER in each brain regionFigure 2
Median ER in each brain region. Presented in the top-left corner is a comparison of the (aggregated) medians of ER in cortical brain regions, subcortical
brain regions, and somatic, nonbrain tissues. ER, evolutionary rate.
Dorsal Root Ganglion
Medulla Oblongata
Pons
Spinal Cord
Olfactory Bulb
Trigeminal Ganglion
Ciliary Ganglion
Superior Cervical Ganglion
Cerebellum
CerebellumPeduncles
Hypothalamus
Thalamus
Subthalamic Nucleus
Caudate Nucleus
Globus Pallidus
Brain Amygdala
Cingulate Cortex
Occipital Lobe
Parietal Lobe
Temporal Lobe
Prefrontal Cortex
Mean ER
Cortical regions
Cortical
Subcortical
P* = 0.05
0.16
0.08
0.04
0.12
0
P* = 0.004
Non -
Brain
Genome Biology 2008, Volume 9, Issue 9, Article R142 Tuller et al. R142.6
Genome Biology 2008, 9:R142
previous sections, suggesting that the genes' ERs are under
tighter influence of their expression levels in cortical regions
(which are of pallial origin).
Discussion
Previous studies have shown that the rate of evolution among
brain-expressed genes is probably lower (or at most equal) in
humans compared with chimpanzee and old world monkeys
(for instance, most recently in [31]). Slower sequence evolu-
tion of tissue/region-specific genes is a probable indicator of
stronger selective constraints operating on the region in
hand. Hence, the overall sequence conservation of highly
expressed brain genes makes them an interesting subject for
the further study of the basic relation between gene expres-
sion and ER. To this end, we find that cortically expressed
genes are more conserved than subcortical ones, and that
gene expression levels exert stronger constraints on sequence
evolution in cortical versus subcortical regions. Taken
together, these findings support the view that cortically
expressed genes are under stronger selective pressure than
subcortically expressed genes.
One possible mechanism that can partially explain these find-
ings is the overall broader tissue distribution of cortically
Correlation between ER and the expression levels in each brain regionFigure 3
Correlation between ER and the expression levels in each brain region. Presented in the top-right corner is the mean correlation between ER and
expression in cortical brain regions, subcortical brain regions, and somatic, nonbrain tissues. ER, evolutionary rate.
Correlation between expression level and ER
Dorsal Root Ganglion
Medulla Oblongata
Pons
Spinal Cord
Olfactory Bulb
Trigeminal Ganglion
Ciliary Ganglion
Superior Cervical Ganglion
Cerebellum
Cerebellum Peduncles
Hypothalamus
Thalamus
Subthalamic Nucleus
Caudate Nucleus
Globus Pallidus
Brain Amygdala
Cingulate Cortex
Occipital Lobe
Parietal Lobe
Temporal Lobe
Prefrontal Cortex
Cortical regions
Cortical
P*=0.038
P* = 0.001
Non-
Brain
Subcortical
0.18
0.16
0.12
0.08
0.04
Expression in the cortical regions vs. expression in the subcortical regionsFigure 4
Expression in the cortical regions vs. expression in the subcortical regions.
Shown is the mean number of cortical brain regions in which a gene is
highly expressed (presented on the y-axis), given the number of
subcortical brain regions in which the same gene is highly expressed (x-
axis). Genes that are highly expressed in more subcortical regions tend to
be highly expressed in more cortical regions.
Number of Subcortical Tissues
Mean Number of Cortical Tissues
P*= 0.001
P* = 2.66*10
-6
P* = 7.55*10
-5
Genome Biology 2008, Volume 9, Issue 9, Article R142 Tuller et al. R142.7
Genome Biology 2008, 9:R142
expressed genes, but other nonexclusive mechanisms may
take part. For instance, it is possible that there are more fre-
quent genetic and protein interactions among highly
expressed genes in the cortical regions, which are known to be
correlated with reduced ER levels [7]. The cellular complexity
(types of cells and their distribution) of the regions studied is
different, which may further determine different and complex
evolutionary constraints in each region. Another factor
potentially influencing these regional differences is the sex
bias of genes, because it has been suggested that the expres-
sion of genes that are more pleiotropic (or, in terms of our
work, that have a greater tissue expression breadth) is less sex
biased [32], and that sex-dependent allelic effects cannot
maintain polygenic variation [33]. Thus, the exact mecha-
nisms underlying our findings are probably subject to quite
complex interplay that remains to be further explored.
The magnitudes of some of the ER/expression correlations
reported here are lower than in yeast (see Figure 1 for gene
expression in the prefrontal cortex versus their ERs), even
though these correlations are highly significant. In the case of
the yeast (for example [5]), the respective correlation found is
around 1.5 times higher. There are three main reasons that
may explain this difference. First and foremost, in contrast to
the yeast, humans are multicellular organisms with hundreds
of distinct cell types and diverse tissues; thus, gene ER in
humans is likely to be under a large variety of (sometimes per-
haps counteracting) selection forces, resulting in a lower cor-
relation with gene expression in any single specific cell/tissue
type [28]. Second, because this study focuses on human brain
regions, we have estimated ER values along shorter evolu-
tionary time periods (the past 6.5 to 10 million years of the
human lineage, after the human-chimp split [34,35], and the
50 to 100 million years corresponding to the human-mouse
split), which is in contrast to the much longer time spans
employed for estimating ER in the yeast studies. Indeed,
when using ER estimates using the human-mouse lineage, we
obtain ER/expression correlations that are two times higher
than those obtained when using ER estimates from the
shorter period, human-chimp lineage. Third, the sets of genes
studied differ markedly, with the number of genes included in
this study being two to three times higher than the number of
genes examined in previous yeast studies (larger datasets
usually increase the correlations but may decrease their
significance).
Cortical regions, at least in their extensive mammalian form,
are more recent than subcortical regions, which have a
broader phyletic distribution. The ER of cortically expressed
genes is yet slower than that of subcortically expressed genes.
This is in contrast to the findings at the gene level, at which
the ER of younger genes is higher than that of older ones [21].
This appears paradoxical at first, because one would perhaps
expect that genes that are highly expressed in the more
recently evolving cortical brain regions would be younger
than the genes that are highly expressed in subcortical
regions. However, this is not the case; highly expressed corti-
cal genes tend also to be highly expressed in many subcortical
regions, and thus both types of regions are composed of both
younger and older highly expressed genes (with cortical areas
being actually composed of older genes than subcortical
regions, on average). Furthermore, although we find that cor-
tically expressed genes are more conserved than subcortical
ones, this does not necessarily imply that cortical regions
offer more stringent 'environments' for gene evolution than
subcortical regions, because this excess conservation may
arise from their broader, somatic tissue distribution. How-
ever, the tighter correlation between ER and expression levels
that characterizes cortically expressed genes does point to the
fact that the cortex may form a more stringent environment
for gene evolution than other brain and somatic tissues, as
one may intuitively expect [19]. (Obviously, in turn, it is also
possible that the rates of gene evolution may play an impor-
tant role in shaping their expression profiles in the cortex.)
There are many definitions for the tissue/region specificity of
genes (for example, based on expressed sequence tags data,
serial analysis of gene expression data, literature [36,37], or
gene expression [as was adopted here]). Each of the definition
may give rather different sets of genes. Currently, there are no
available datasets based on expressed sequence tags, serial
analysis of gene expression, or literature that provide infor-
mation about brain regional specificity. Hence, we have
Correlation of expression levels in different embryonic developmental origins with ERFigure 5
Correlation of expression levels in different embryonic developmental
origins with ER. Shown is the mean correlation of expression levels with
ER (human-mouse), for regions belonging to five different embryonic
developmental origins. The latter are ordered on the x-axis in accordance
with their height on the cranial vertical axis during early embryonic stages
(spinal cord is the lowest, and Forebrain [pallium] is the highest). As
evident, these ER/expression correlations are ordered by their cranial
vertical location (Spearman rank correlation of 0.9; P = 0.037). A similar
result was observed when computing the ER using the human lineage
(human-chimpanzee; Additional data file 10). ER, evolutionary rate.
Correlation between expression level and ER
Spinal Cord Hind Brain
Forebrain
(pallium)
Forebrain
(subpallium)
Forebrain
(diencephalon)
-
Low High
-
-
-
-
-
-
-
-
-
Genome Biology 2008, Volume 9, Issue 9, Article R142 Tuller et al. R142.8
Genome Biology 2008, 9:R142
focused on the gene expression definition of region
specificity. A comparison of our results with those based on
other tissue specificity definitions will have to be deferred
until the corresponding biologic information becomes
available.
Finally, the results reported in Figure 5 are intriguing, gener-
alizing in a way the results reported in Figures 1 to 3. Whereas
Figures 1 to 3 report that cortical regions exhibit a correlation
between ERs and tissue gene expression levels in cortical ver-
sus subcortical regions, Figure 5 shows that this correlation
tends to be stronger for vertically higher regions in the devel-
opmental axis. each point in Figure 5 corresponds to the cor-
relation between ER and expression levels of 10,594 genes in
all of the regions in a developmental area, the reported corre-
lation values are highly robust. Thus, drawing an analogy
from the observation that cortical regions are evolutionary
more recent than subcortical ones [24], one may (perhaps
boldly) speculate that regions located higher on the vertical
axis at brain development are also more evolutionarily recent.
However, because even the basic claim that cortical regions
are more recent is not accepted by everyone, care should obvi-
ously be taken with formulating such hypotheses. Their
examination should await the accumulation of additional
gene expression samples from more brain tissues and from
more mammalian species.
Conclusion
Our findings support the view that cortically expressed genes
are under stronger selective pressure than subcortically
expressed genes. They may also suggest that regions that are
located higher on the vertical axis at brain development are
also more evolutionarily recent. These findings should be re-
examined when additional biological data (for example, gene
expression samples from more brain tissues and from more
mammalian species) will become available.
Materials and methods
Computation of ERs
We used two estimations of human ERs: long-term ERs along
the mammalian lineage (human-mouse dN/dS) that were
downloaded from European Bioinformatics Institute (EBI)
BioMart (BioMart July 2008), and short-term ERs along the
human lineage (human-chimpanzee dN/dS), whose compu-
tations are described in the following subsection.
Computing gene ERs along the human and chimp
lineages
We downloaded the orthologous groups of Homo sapiens
(humans), Pan troglodytes (chimp), and Macaca mulatta
(macaque) from EBI BioMart Homology (BioMart November
2007). We considered only sets that include orthologs in all
three species. Sets of homologs that did not include exactly
one representative in each organism were removed from our
dataset, in order to filter out paralogs and to avoid potential
errors in ER estimation caused by duplication events (today,
there are no reported cases of horizontal gene transfer)
between Primates; see, for instance, [38]). This procedure
resulted in a total of 15,176 orthologous gene sets.
In the next step, stop codons were removed from each gene
and the genes were translated to sequences of amino acids.
The corresponding amino acid sequences of each orthologous
gene set were aligned by CLUSTALW 1.83 [39], with default
parameters. By using amino acids as templates for the nucle-
otide sequences and by ignoring gaps, we generated gap-free
multiple alignments of the three orthologous proteins in each
orthologous set and their corresponding coding sequences.
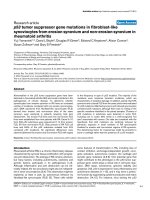
Given the alignments of each set of orthologs and given the
phylogenetic tree of the three primates (Figure 6a), we used
the codeml program in PAML for the joint reconstruction of
ancestral codons in the internal nodes of the phylogenetic tree
[40] (the ancestor of the human and chimp; Figure 6a). This
reconstruction induced the sequence of the ancestral proteins
and their corresponding ancestral DNA coding sequences.
We hence obtained sets of four sequences: three from the pre-
vious step (corresponding to the three leaves of the phyloge-
netic tree) plus one reconstructed sequences of the internal
node of the phylogenetic tree. We denote such a set of four
sequences a 'complete ortholgous set'. For each complete
ortholgous set, we computed the dN (the rate of nonsynony-
mous substitutions) and dS (the rate of synonymous substitu-
tions) along the linage to the human (the branch between the
internal node and the human node; see Figure 6a) by the y00
program in PAML [41,42]. The ER of a gene is the dN divided
by the dS of its corresponding complete ortholgous set along
the human lineage (the dN/dS along the human lineage).
Illustration of the procedures that were used for estimating ER and gene ageFigure 6
Illustration of the procedures that were used for estimating ER and gene
age. (a) Phylogeny of the three primates whose genes were used to
compute the ERs along the human lineage. (b) Illustration of the
procedure and the phylogenetic tree used to estimate gene age. ER,
evolutionary rate.
Homo
sapiens
Pan
troglodytes
Macaca mulatta
Internal Node
Human
Lineage
(a) (b)
Homo
sapiens
Mammals
Fish
Insects,
Worm,
Ciona
Plants,
Yeast
Homology
search
Chimp
Lineage
Genome Biology 2008, Volume 9, Issue 9, Article R142 Tuller et al. R142.9
Genome Biology 2008, 9:R142
Similarly, we computed that dN and dS and a corresponding
ER (dN/dS) along the chimp linage.
Computing ERs of tissues
The ER of a tissue/region is the median ER of all the genes
that are over-expressed in that tissue (genes that are 2 stand-
ard deviations higher than their mean expression across all of
the tissues). We used median instead of average because the
analyzed set of genes included genes with dS = 0 (ER equals
infinity).
It is important to note that all of the results reported here are
remarkably robust to changing the cutoff of 2 standard devi-
ations. For example if we choose a cutoff of 3 standard devia-
tions, then the average median ER of cortical brain regions is
0.1532 versus 0.2387 in subcortical brain regions, and 0.2914
in nonbrain tissues (P = 0.014 and P = 0.002 respectively).
Gene expression data
The gene expression of 78 tissues (including 21 brain regions)
was downloaded from the work of [23]. All of the analyzed
gene expression measurements were from the same
technology (Affymetrix GeneChip Human Genome U133
Array Set HG-U133A; Affymetrix Inc., Santa Clara, CA, USA)
and included two technical repeats (that we averaged). A list
of all of the tissue names and other properties appears in
Additional data file 12. The human tissue samples were
obtained from several sources: Clinomics Biosciences (Pitts-
field, MA, USA), Clontech (Palo Alto, CA, USA), AllCells (Ber-
keley, CA, USA), Clonetics/BioWhittaker (Walkersville, MD,
USA), AMS Biotechnology (Abingdon, Oxfordshire, UK), and
the University of California at San Diego. When samples from
four or more subjects were available, equal numbers of male
and female subjects were used to make two independent
pools; when fewer than four samples were available, RNA
samples were pooled, and duplicate amplifications were per-
formed for each pool. (More details appear in supporting
Table 1 in [23].) We averaged the signals of all of the probes of
each gene to obtain a final set of 10,594 genes with both ER
measurements and gene expression measurements across all
tissues.
Gene expression of M. musculus (mouse) was downloaded
from [43]. It includes gene expression from 61 tissues. Four-
teen of these tissues are brain tissues (2 cortical and 12 sub-
cortical). The mouse gene expression appears in Additional
data file 13. The gene expression of P. troglodytes (chimp)
was downloaded from the Gene Expression Omnibus data-
base [48] (GDS2678 record). It included 12 brain tissues; one
of them was subcortical and the others were all cortical.
Estimating gene age
An estimation of gene age was obtained following the proce-
dure described in [21,22] (Figure 6b). First, we used the
homology search engine of BioMart (November 2007) to find
all of the orthologs of each of the human genes in a set of 34
organisms (the list of organisms appear in Additional data file
14, and phyletic patterns of all the human genes appear in
Additional data file 15). Next, the organism set was divided
into four groups: group 1, mammals (youngest group); group
2, fish; group 3, insects, worm, ciona; and group 4, plants and
yeast (oldest group). The age of each of the human genes was
determined according to the oldest organism group with a
homolog of the gene (Figure 6b). Accordingly, a gene that has
homolog(s) only in group 1 is named a mammalian gene,
whereas a gene with homolog(s) in group 4 is very old. We
also performed an additional study of primate specific genes,
defined as human genes that have homolog(s) only in the pri-
mates (P. troglodytes or M. mulatta).
GO enrichments
Hypergeometric functional GO enrichment of an over-
expressed set of genes, including a correction for multiple
testing, was computed by the FuncAssociate [49].
Gene length and gene essentiality
Information about gene and protein lengths was downloaded
from EBI BioMart (BioMart August 2008). The information
about gene essentiality was based on the mouse phenotypic
data, and was downloaded from Mouse Genome Informatics
database [50]. Human genes whose mouse orthologs have
knockout phenotype of lethality or sterility were defined as
essential. That is, those entries possessing embryonic
lethality (MP: 0002080), prenatal lethality (MP: 0002081),
survival postnatal lethality (MP: 0002082), premature death
or induced morbidity (MP: 0002083), reproductive system
phenotype (MP: 0002161, MP:0005389), lethality postnatal
(MP:0005373), or lethality prenatal/perinatal
(MP:0005374).
Abbreviations
CV: coefficient of variance; dN: rate of nonsynonymous sub-
stitutions; dS: rate of synonymous substitutions; EBI: Euro-
pean Bioinformatics Institute; ER: evolutionary rate; GO:
Gene Ontology; SCS: specific characteristic set.
Authors' contributions
TT carried out all of the analysis. All authors participated in
the design of the study. All authors were involved in drafting
and writing the manuscript. All authors read and approved
the final manuscript.
Additional data files
The following additional data are available with the online
version of this paper. Additional data file 1 is a table listing
various parameters of the analyzed genes. Additional data file
2 is a table listing the GO enrichments for the genes that are
over-expressed in the cortical regions. Additional data file 3 is
a table listing the GO enrichments for the genes that are over-
Genome Biology 2008, Volume 9, Issue 9, Article R142 Tuller et al. R142.10
Genome Biology 2008, 9:R142
expressed in the subcortical regions. Additional data file 4 is
a table listing the GO enrichment categories for the genes that
are under expressed in the cortical and in the subcortical
brain regions. Additional data file 5 includes the Supplemen-
tary notes (Supplementary notes 1 to 6). Additional data file 6
is a table that includes the ER/expression correlation and ER
in each mouse tissue. Additional data file 7 is a table that
includes the ER/expression correlation in the chimp brain
tissues. Additional data file 8 is a figure that depicts the fol-
lowing: (A) median ER (human lineage) in brain tissues and
other tissues; (B) median ER in each brain region; (C) the cor-
relation between ER (human lineage) and expression level in
each tissue; and (D) the correlation between ER and the
expression levels in each brain region. Additional data file 9 is
a figure that depicts the following: (A) median ER (human-
mouse dN/dS) in brain tissues and other tissues; and (B) the
correlation between ER (human-mouse dN/dS) and expres-
sion level in each tissue. Additional data file 10 is a figure that
depicts the mean correlation of expression levels with ER
(human lineage), for regions belonging to five different
embryonic developmental origins. Additional data file 11 is a
figure that depicts the mean ER (mouse-human) for regions
belonging to five different embryonic developmental origins.
Additional data file 12 is a table listing various properties of
the analyzed tissues. Additional data file 13 is a table that
includes the mouse gene expression and ER. Additional data
file 14 is a table with the set of organisms that was used for
estimating gene ages. Additional data file 15 is a table that
includes the phyletic patterns of all the human genes.
Additional data file 1Various parameters of the analyzed genesPresented is a table listing various parameters of the analyzed genes.Click here for fileAdditional data file 2GO enrichments for genes over-expressed in cortical regionsPresented is a table listing the GO enrichments for the genes that are over-expressed in the cortical regions.Click here for fileAdditional data file 3GO enrichments for genes over-expressed in subcortical regionsPresented is a table listing the GO enrichments for the genes that are over-expressed in the subcortical regions.Click here for fileAdditional data file 4GO enrichment categories for genes under-expressed in cortical and subcortical brain regionsPresented is a table listing the GO enrichment categories for the genes that are under expressed in the cortical and in the subcortical brain regions.Click here for fileAdditional data file 5Supplementary notesPresented are the Supplementary notes (Supplementary notes 1 to 6).Click here for fileAdditional data file 6ER/expression correlation and ER in each mouse tissuePresented is a table that includes the ER/expression correlation and ER in each mouse tissue.Click here for fileAdditional data file 7ER/expression correlation in the chimp brain tissuesPresented is a table that includes the ER/expression correlation in the chimp brain tissues.Click here for fileAdditional data file 8ER (human lineage) and the correlation between ER and expres-sion in all the tissuesPresented is a figure that depicts the following: (A) median ER (human lineage) in brain tissues and other tissues; (B) median ER in each brain region; (C) the correlation between ER (human line-age) and expression level in each tissue; and (D) the correlation between ER and the expression levels in each brain region.Click here for fileAdditional data file 9ER (human-mouse dN/dS) and the correlation between ER and expression in all the tissuesPresented is a figure that depicts the following: (A) median ER (human-mouse dN/dS) in brain tissues and other tissues; and (B) the correlation between ER (human-mouse dN/dS) and expression level in each tissue.Click here for fileAdditional data file 10Mean correlation of expression levels with ER (human lineage)Presented is a figure that depicts the mean correlation of expres-sion levels with ER (human lineage), for regions belonging to five different embryonic developmental origins.Click here for fileAdditional data file 11Mean ER (mouse-human)Presented is a figure that depicts the mean ER (mouse-human) for regions belonging to five different embryonic developmental origins.Click here for fileAdditional data file 12Various properties of the analyzed tissuesPresented is a table listing various properties of the analyzed tissues.Click here for fileAdditional data file 13Mouse gene expression and ERPresented is a table that includes the mouse gene expression and ER.Click here for fileAdditional data file 14Set of organisms that was used for estimating gene agesPresented is a table with the set of organisms that was used for esti-mating gene ages.Click here for fileAdditional data file 15Phyletic patterns of all the human genesPresented is a table that includes the phyletic patterns of all the human genes.Click here for file
Acknowledgements
TT is supported by the Edmond J Safra Bioinformatics program at Tel Aviv
University. MK's research is supported by grants from the Israel Science
Foundation (ISF) and the Israeli Ministry of Science and Technology. ER's
research is supported by grants from the Israeli Science Foundation (ISF),
the Yishaya Horowitz center for complexity science, and the Tauber fund.
References
1. Hartl DL, Jones EW: Genetics: Analysis of Genes and Genomes.
In Molecular evolution Volume chapter 17. Mississauga, ON, Canada:
Jones and Bartlett; 2005:718-724.
2. Kimura M, Ota T: On some principles governing molecular
evolution. Proc Natl Acad Sci USA 1974, 71:2848-2852.
3. Pál C, Papp B, Lercher MJ: An integrated view of protein
evolution. Nat Rev Genet 2006, 7:337-348.
4. Wall DP, Hirsh AE, Fraser HB, Kumm J, Giaever G, Eisen MB, Feld-
man MW: Functional genomic analysis of the rate of protein
evolution. Proc Natl Acad Sci USA 2005, 102:5483-5488.
5. Drummond DA, Bloom JD, Adami C, Wilke CO, Arnold FH: Why
highly expressed proteins evolve slowly. Proc Natl Acad Sci USA
2005, 102:14338-14343.
6. Hirsh AE, Fraser HB: Protein dispensability and rate of
evolution. Nature 2001, 411:1046-1049.
7. Fraser HB, Hirsh AE, Steinmetz LM, Scharfe C, Feldman MW: Evolu-
tionary rate in the protein interaction network. Science 2002,
296:750-752.
8. Chena Y, Dokholyana NV: The coordinated evolution of yeast
proteins is constrained by functional modularity. Trends Genet
2006, 22:416-419.
9. Marino-Ramirez L, Bodenreider O, Kantz N, Jordan IK: Co-evolu-
tionary rates of functionally related yeast genes. Evol Bioinform
Online 2006, 2:295-300.
10. Pál C, Papp B, Hurst LD: Highly expressed genes in yeast evolve
slowly. Genetics 2001, 158:927-931.
11. Subramanian S, Kumar S: Gene expression intensity shapes evo-
lutionary rates of the proteins encoded by the vertebrate
genome. Genetics 2004, 168:373-381.
12. Kuma K, Iwabe N, Miyata T: Functional constraints against var-
iations on molecules from the tissue level: slowly evolving
brain-specific genes demonstrated by protein kinase and
immunoglobulin supergene families. Mol Biol Evol 1995,
12:123-130.
13. Miyata T, Kuma K, Iwabe N, Nikoh NA: Possible link between
molecular evolution and tissue evolution demonstrated by
tissue specific genes. Jpn J Genet 1994, 69:473-480.
14. Duret L, Mouchiroud D: Determinants of substitution rates in
mammalian genes: expression pattern affects selection
intensity but not mutation rate. Mol Biol Evol 2000, 17:68-74.
15. Khaitovich P, Hellmann I, Enard W, Nowick K, Leinweber M: Parallel
patterns of evolution in the genomes and transcriptomes of
humans and chimpanzees. Science 2005, 309:1850-1854.
16. Winter EE, Goodstadt L, Ponting CP: Elevated rates of protein
secretion, evolution, and disease among tissue-specific
genes. Genome Res 2004, 14:54-61.
17. Zhang L, Li WH: Mammalian housekeeping genes evolve more
slowly than tissue-specific genes. Mol Biol Evol 2004, 21:236-239.
18. Liao BY, Zhang J: Low rates of expression profile divergence in
highly expressed genes and tissue-specific genes during
mammalian evolution. Mol Biol Evol 2006, 23:1119-1128.
19. Gu X, Su Z: Tissue-driven hypothesis of genomic evolution
and sequence-expression correlations. Proc Natl Acad Sci USA
2007, 104:2779-2784.
20. Khaitovich P: Regional patterns of gene expression in human
and chimpanzee brains. Genome Res 2004, 14:1462-1473.
21. Albá MM, Castresana J: Inverse relationship between evolution-
ary rate and age of mammalian genes. Mol Biol Evol 2005,
22:598-606.
22. Albá MM, Castresana J: On homology searches by protein Blast
and the characterization of the age of genes. BMC Evol Biol
2007, 7:53.
23. Su AI, Wiltshire T, Batalov S, Lapp H, Ching KA: A gene atlas of the
mouse and human protein-encoding transcriptomes.
Proc
Natl Acad Sci USA 2004, 101:6062-6067.
24. Jarvis ED, Güntürkün O, Bruce L, Csillag A, Karten H, Kuenzel W,
Medina L, Paxinos G, Perkel DJ, Shimizu T, Striedter G, Wild JM, Ball
GF, Dugas-Ford J, Durand SE, Hough GE, Husband S, Kubikova L, Lee
DW, Mello CV, Powers A, Siang C, Smulders TV, Wada K, White SA,
Yamamoto K, Yu J, Reiner A, Butler AB, Avian Brain Nomenclature
Consortium: Avian brains and a new understanding of verte-
brate brain evolution. Nat Rev Neurosci 2005, 6:151-159.
25. Kaas JH, Preuss TM: Human brain evolution. In Fudamental Neu-
roscience Edited by: Squire LR, Bloom FE, McConnel SK, Roberts JL,
Spitzer NC, Zigmond MJ. Amsterdam, The Netherlands: Academic
Press; 2003:1147-1166.
26. Cochard LR: Netter;s Atlas of Human Embryology Chicago, IL: The Fein-
berg School of Medicine, Northwestern University; 2002.
27. Preuss TM, Cáceres M, Oldham MC, Geschwind DH: Human brain
evolution: insights from microarrays. Nat Rev Genet 2004,
5:850-860.
28. Liao BY, Scott NM, Zhang J: Impacts of gene essentiality, expres-
sion pattern, and gene compactness on the evolutionary rate
of mammalian proteins. Mol Biol Evol 2006, 23:2072-2080.
29. Albert R, Barabási A: Statistical mechanics of complex
networks. Rev Mod Phys 2002, 74:47-97.
30. Drews U: Color Atlas of Embryology New York, NY: Thieme; 1995.
31. Wang HY, Chien HC, Osada N, Hashimoto K, Sugano S, Gojobori T,
Chou CK, Tsai SF, Wu CI, Shen CK: Rate of evolution in brain-
expressed genes in humans and other primates. PLoS Biol
2007, 5:e13.
32. Mank JE, Hultin-Rosenberg L, Zwahlen M, Ellegren H: Pleiotropic
constraint hampers the resolution of sexual antagonism in
vertebrate gene expression. Am Nat 2008, 171:35-43.
33. Turelli M, Barton NH: Polygenic variation maintained by bal-
ancing selection: pleiotropy, sex-dependent allelic effects
and GxE interactions. Genetics 2004, 166:1053-1079.
34. Benton MJ, Ayala FJ: Dating the tree of life. Science 2003,
300:1698-1700.
35. Benton MJ, Donoghue PC: Paleontological evidence to date the
tree of life. Mol Biol Evol 2007, 24:26-53.
36. Sémon M, Lobry JR, Duret L: No evidence for tissue-specific
Genome Biology 2008, Volume 9, Issue 9, Article R142 Tuller et al. R142.11
Genome Biology 2008, 9:R142
adaptation of synonymous codon usage in humans. Mol Biol
Evol 2006, 23:523-529.
37. Dorus S, Vallender EJ, Evans PD, Anderson JR, Gilbert SL, Mahowald
M, Wyckoff GJ, Malcom CM, Lahn BT: Accelerated evolution of
nervous system genes in the origin of Homo sapiens. Cell
2004, 119:1027-1040.
38. Bapteste E, Susko E, Leigh J, MacLeod D, Charlebois RL, Doolittle
WF: Do orthologous gene phylogenies really support tree-
thinking? BMC Evol Biol 2005, 5:33.
39. Chenna R, Sugawara H, Koike T, Lopez R, Gibson TJ, Higgins DG,
Thompson JD: Multiple sequence alignment with the Clustal
series of programs. Nucleic Acids Res 2003, 31:3497-3500.
40. Pupko T, Pe'er I, Shamir R, Graur D: A fast algorithm for joint
reconstruction of ancestral amino acid sequences. Mol Biol
Evol 2000, 17:890-896.
41. Yang Z: PAML: a program package for phylogenetic analysis
by maximum likelihood. Comput Appl Biosci 1997, 13:555.
42. Yang Z, Nielsen R: Estimating synonymous and nonsynony-
mous substitution rates under realistic evolutionary models.
Mol Biol Evol 2000, 17:32-43.
43. Su AI, Cooke MP, Ching KA, Hakak Y, Walker JR, Wiltshire T, Orth
AP, Vega RG, Sapinoso LM, Moqrich A, Patapoutian A, Hampton GM,
Schultz PG, Hogenesch JB: Large-scale analysis of the human
and mouse transcriptomes. Proc Natl Acad Sci USA 2002,
99:4465-4470.
44. Tanomtong A, Khunsook S, Chaveerach A, Kaensa W, Banjongrat R:
Comparative phylogenetic studies of Rhesus monkey
(Macaca mulatta) and human (Homo sapiens) using G-band-
ing pattern. Cytologia 2006, 71:87-92.
45. Janeka JE, Miller W, Pringle TH, Wiens F, Zitzmann A, Helgen KM,
Springer MS, Murphy WJ:
Molecular and genomic data identify
the closest living relative of primates. Science 2007,
318:792-794.
46. Peterso KJ, Lyons JB, Nowak KS, Takacs CM, Wargo MJ, McPeek MA:
Evolution Estimating metazoan divergence times with a
molecular clock. Proc Natl Acad Sci USA 2004, 101:6536-6541.
47. Wray GA: Dating branches on the tree of life using DNA.
Genome Biol 2001, 3:REVIEWS0001.
48. Gene Expression Omnibus database [http://
www.ncbi.nlm.nih.gov/geo/]
49. The Gene Set Functionator [ />func/funcassociate]
50. Mouse Genome Informatics database [ormat
ics.jax.org/]