Báo cáo Y học: Prediction of temporal gene expression Metabolic optimization by re-distribution of enzyme activities ppt
Bạn đang xem bản rút gọn của tài liệu. Xem và tải ngay bản đầy đủ của tài liệu tại đây (474.16 KB, 8 trang )
Prediction of temporal gene expression
Metabolic optimization by re-distribution of enzyme activities
Edda Klipp
1
, Reinhart Heinrich
2
and Hermann-Georg Holzhu¨ tter
3
1
Max-Planck-Institute of Molecular Genetics, Berlin, Germany;
2
Humboldt University Berlin, Institute of Biology, Theoretical
Biophysics, Berlin, Germany;
3
Humboldt University Berlin, Medical Faculty (Charite
´
), Institute of Biochemistry, Berlin, Germany
A computational approach is used to analyse temporal gene
expression in the context of metabolic regulation. It is based
on the assumption that cells developed optimal adaptation
strategies to changing environmental conditions. Time-
dependent enzyme profiles are calculated which optimize the
function of a metabolic pathway under the constraint of
limited total enzyme amount. For linear model pathways it is
shown that wave-like enzyme profiles are optimal for a rapid
substrate turnover. For the central metabolism of yeast cells
enzyme profiles are calculated which ensure long-term
homeostasis of key metabolites under conditions of a diauxic
shift. These enzyme profiles are in close correlation with
observed gene expression data. Our results demonstrate that
optimality principles help to rationalize observed gene
expression profiles.
Keywords: evolutionary optimization; mathematical mod-
elling; metabolic regulation; gene expression.
Microarray technologies provide the means to measure
simultaneously the expression patterns of thousands of
genes [1,2]. These expression data and the availability of
more than 80 fully sequenced genomes represent an
enormous quantity of experimental data. The conversion
of this genomic information into knowledge on phenotype
characteristics such as metabolic pathways or signal trans-
duction networks is a challenging task that cannot be
effectively tackled without broad application of theoretical
and computational methods.
Time resolved tracing of expression levels for large sets of
genes has provided evidence that mRNA levels of metabolic
enzymes often change within the same time scale as
variations of external conditions [1–4]. Quantitative simu-
lation of these time dependent gene expression patterns
meets with difficulties due to incomplete knowledge of the
underlying regulatory mechanisms. However, statistical
methods have been successfully applied, such as cluster
analysis of time-dependent gene expression patterns for
identifying functionally related proteins [5–10].
It has been stressed that even without detailed knowledge
of gene regulatory mechanisms phenotype properties can be
rationalized by evolutionary optimization principles [11].
The basis of this approach is the hypothesis that a
permanent change of phenotype properties due to mutation
and selection leads to an optimal adaptation of an organism
to given environmental conditions. Most optimization
studies in the field of metabolic regulation are aimed at
prediction of time independent characteristics of enzymes
ensuring optimal performance of metabolic pathways [11–
15]. The microarray data suggests applying optimization
concepts to also explain time courses of enzyme concentra-
tions.
The basic idea of our paper is that time dependent gene
expression enables cells to adapt their metabolic capabilities
in an optimal way to varying external conditions. Our
approach consists in (a) establishing a mathematical model
of the metabolic pathways under consideration, (b) defining
a performance function to evaluate in a quantitative manner
the functioning of the cell under given external conditions,
(c) calculating time-dependent enzyme concentration pro-
files (henceforth called enzyme profiles) which optimize the
performance function, and (d) comparing the predicted
optimal enzyme profiles with experimental expression data.
Optimization of the network is performed under the
constraint that the total available enzyme concentration is
limited by the protein synthesizing capacity of a cell [16].
The optimization problem thus consists in distributing in a
time-dependent manner a finite amount of protein to the
participating enzymes. As a consequence, an increase in the
concentration of one enzyme must be compensated to a
certain extent by the decrease in the concentrations of other
enzymes.
As a first instructive example we deal with a linear chain
of monomolecular enzymatic reactions. We address the
question how the concentrations of the enzymes have to
vary in time to accomplish a fast conversion of the initial
substrate into the final product. Next, we analyse gene
regulation of a complex metabolic system, the central
metabolism of Saccharomyces cerevisiae under conditions of
the diauxic shift. For this case time dependent gene
expression data are available [1]. We measure the metabolic
performance in terms of the survival time at glucose
Correspondence to H G. Holzhu
¨
tter, Humboldt University Berlin,
Medical Faculty (Charite
´
), Institute of Biochemistry, Monbijoustr. 2a,
10117 Berlin, Germany. Tel.: + 49 30 450528166,
E-mail:
Enzymes: 6-phosphofructokinase (EC 2.7.1.11); hexokinase
(EC 2.7.1.1); glyceraldehyde 3-phosphate dehydrogenase
(EC 1.2.1.12); enolase (EC 4.2.1.11); alcohol dehydrogenase
(EC 1.1.1.1); pyruvate decarboxylase isozyme 1, 2, and 3 (EC 4.1.1.1);
aldehyde dehydrogenase (NAD(P) +) (EC 1.2.1.5); acetyl-CoA syn-
thetase (EC 6.2.1.1); isocitrate dehydrogenase (NAD +) subunit 1
and 2 (EC 1.1.1.41); fumarate dehydrogenase (EC 4.2.1.2).
(Received 22 May 2002, revised 22 August 2002,
accepted 30 August 2002)
Eur. J. Biochem. 269, 5406–5413 (2002) Ó FEBS 2002 doi:10.1046/j.1432-1033.2002.03223.x
starvation and predict optimal enzyme profiles of various
metabolic pathways.
RESULTS
Temporal waves in enzyme profiles for unbranched
pathways
Scheme 1 in the Appendix shows an idealized unbranched
model pathway consisting of n consecutive enzyme-cata-
lyzed monomolecular enzymatic reactions and a series of
n ) 1 intermediates, X
i
. We assume that the product P
represents a biochemical compound whose availability is
rate-limiting for the reproduction of an individual: the faster
the substrate S can be converted into this product, the more
efficient the individual may reproduce and out-compete
other individuals. As a measure of the average time to
produce P from S we use the transition time s as defined in
[17] (see also legend to Fig. 1). The optimization problem to
be solved reads s ¼ min at the constraint that the total
available enzyme concentration may not exceed an upper
bound E
tot
, i.e. SE
i
£ E
tot
. The metabolic process is
initiated by addition of substrate to an ÔemptyÕ pathway,
i.e. except S all metabolites have zero concentrations at the
beginning.
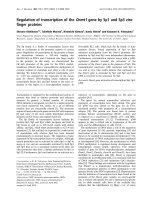
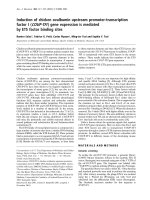
For the simplest case n ¼ 2, an explicit solution can be
found for the optimization problem (see legend to Fig. 1;
derivation of the analytical solution for the two-component
linear reaction chain is available from the authors on
request). The optimal enzyme profiles and related metabolite
concentrations shown in Fig. 1 comprise two phases separ-
ated by a single switch at time t ¼ T
1
. During the initial
phase, t < T
1
, the whole amount of protein is allocated to
the first reaction (E
1
¼ E
tot
, E ¼ 0). At the beginning of the
second phase the concentration E
2
undergoes an abrupt
switch from zero to a finite value whereas the concentration
E
1
is decreased by the same extent.
An intriguing finding is that the final product is produced
only in the second phase, i.e. paradoxically the fastest
possible conversion of the substrate into the final product is
achieved with a delayed onset in the formation of P. The
optimal enzyme profile depends on the choice of the initial
concentrations of the metabolites. If, for example, the initial
ratio r ¼ X
1
/S exceeds the threshold value r
crit
given by the
ratio E
2
/E
1
in the second phase of the solution shown in
Fig. 1, the optimal enzyme profiles are still given by a single
abrupt switch at time T1 but now in the first phase of
the process the whole amount of enzyme is allocated to the
second enzyme instead to the first one. r affects only
the value the switching time T
1
but not the ratio E
2
/E
1
in
the second phase of the process [18]. The initial refrain
from spending protein to the second reaction and thus from
synthesizing P at the beginning pays off in the later stage of
the process.
For longer pathways, n > 2, the optimization problem
was solved numerically. The unknown enzyme profiles,
E
i
(t), were approximated by a stepwise constant function,
i.e. the whole time axis was subdivided into a fixed number
of time intervals and the enzyme concentration was put to
constant values within these time intervals. The quantities to
be optimized are the switching times T
1
, T
2
, etc. defining the
time intervals and the constant enzyme concentrations
between the switching times; for details of the nonlinear
minimization procedure, see legend to Fig. 2. In these
calculations the number m of allowed switches was succes-
sively increased, starting with m ¼ 0. At an arbitrary but
fixed number of switches, the switching times and the
constant enzyme levels within the time intervals were
Fig. 1. Optimal enzyme profiles and metabolite time courses for the
linear metabolic pathway (n ¼ 2). The mathematical description was
based on linear kinetic equations presented in the Appendix. Optimi-
zation was performed under the constraint SE
i
£ E
tot
where E
tot
represents a fixed total concentration of enzymes. The performance
function to be minimized is the transition time s needed to convert the
substrate into the product [17]. C denotes the initial concentration of
the substrate and equals at any time point the total metabolite con-
centration in the system, i.e. C ¼ S þ P þ
P
n1
i¼1
X
i
¼ const: Calcula-
tions were performed for equal catalytic efficiencies of the enzymes
(k
i
¼ k). The analytical solution of the optimization problem reads
[18]: SE
i
£ E
tot
, i.e. the maximum available amount of protein is
actually used; switching time T
1
¼ ln(2/(3–Ö5)). First time interval
(t ‡ T
1
): E
1
¼ 1, E
2
¼ 0; second time interval (t > T
1
): E
1
¼ (3–Ö5)/2,
E
2
¼ ln(Ö5–1)/2.Optimal transition time, s
min
¼ 1+T
1
+(1)e
)T
1
)
)1
¼
3.58. Enzyme concentrations are given in units of E
tot
; times are given
in units of (kÆE
tot
)
)1
.
Ó FEBS 2002 Metabolic optimization (Eur. J. Biochem. 269) 5407
determined such that the transition time became a mini-
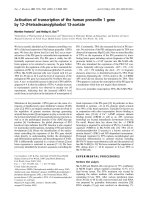
mum. Figure 3A depicts how the minimal transition time
decreases with increasing number of switches for a linear
reaction chain of length n ¼ 5. Interestingly, a major
reduction of the transition time is already brought about if a
single switch in the enzyme concentrations occurs at an
appropriate time. The corresponding enzyme profiles are
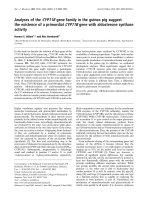
shown in the second column of Fig. 2.
The optimization procedure was stopped when a further
increase in the number of allowed switches did not lead to a
further decrease of the transition time s . For the linear
reaction chain of length n ¼ 5 the absolute minimum of the
transition time was obtained by allowing for m ¼ 4
switches. The corresponding optimal enzyme profiles are
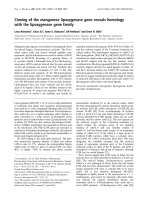
shown in the first column to Fig. 2. These optimal enzyme
profiles have the following characteristics: Within any time
interval, except of the last one, only a single enzyme is fully
active whereas all others are shut off. At the beginning of the
process, the whole amount of available protein is spent
exclusively to the first enzyme of the chain. Each of the
following switches turns off the active enzyme and allocates
the total available protein to the enzyme catalysing the
following reaction. The last switch allocates a finite fraction
of protein to all enzymes whereby the first enzyme of the
chain (which has already done most of its ÔworkÕ in
converting S into X
1
) takes the smallest share and the last
reaction (which yet has to do most of its ÔworkÕ in converting
X
4
into P) takes the largest share. The optimal allocation of
protein to the various enzymes resembles a Ôsoliton-likeÕ
wave which propagates through the reaction chain in such a
manner that the highest expression of an enzyme takes place
Fig. 2. Optimal enzyme profiles and metabolite courses for the linear
metabolic pathway (n ¼ 5). Column 1: optimal enzyme profiles yield-
ing the absolute minimum of the transition time (four switches,
m ¼ 4): T
1
¼ 3.08, T
2
¼ 5.28, T
3
¼ 6.77, T
4
¼ 7.58. Column 2:
optimal enzyme profiles yielding minimum of the transition time if
only a single switch is allowed (m ¼ 1): T
1
¼ 7.45. Calculation pro-
cedure: the time axis was divided into m+1 intervals: T
j)1
£ t < T
j
(whereby T
0
¼ 0andT
m+1
޴). Within each time interval j the
enzyme concentrations E
i
(j), i ¼ 1,…,n, are constant. The enzyme
concentrations may switch to new values between two intervals.
Optimization involves the following steps: (1) explicit solution of the
system equations for P(t) as a function of the m unknown switching
times T
j
and the (m+1) · n unknown enzyme concentrations E
i
( j)(2)
explicit calculation of the transition time s and (3) minimization of s by
a steepest descent method leading to optimal values of T
j
and E
i
( j).
Initial conditions at t ¼ 0: S ¼ CX
i
¼ P ¼ 0.
Fig. 3. Minimal transition times. (A) Minimal transition time for the
linear metabolic pathway (n ¼ 5) as function of the number m of
allowed switches of the enzyme concentrations. The minimal transition
time obtainable with time-dependent enzyme profiles was calculated as
outlined in Fig. 2. The largest drop in the transition time (from 25 to 19
time units) is already achieved by allowing for a single switch (m ¼ 1).
The absolute minimum of the transition time is achieved by four
switches, i.e. a higher number of switches does not lead to a further
decline of the transition time. (B) Minimal transition times at varying
length of the linear metabolic pathway. The minimal transition time
s
min
obtainable with time-dependent enzyme profiles was calculated as
outlined in Fig. 2. In order to demonstrate the advantage of metabolic
regulation of time-dependent enzyme expression the reference value
s
ref
is also shown representing the minimal transition time obtainable
at time-independent enzyme concentrations.
5408 E. Klipp et al. (Eur. J. Biochem. 269) Ó FEBS 2002
just at the right time to ensure efficient conversion of its
accumulated substrate.
Similar calculations performed for longer and shorter
pathways have shown that the transition time always attains
the absolute minimum when the number of switches is one
less than the number of reactions, i.e. m ¼ n ) 1; allowing
for more switches yielded no further decrease in the
transition time. The optimal enzyme profiles had always
the above outlined wave-like characteristics with the pecu-
liarity that within the last time interval the available protein
is spread over all reactions to ensure complete conversion of
the initial substrate into the end product.
The gain in Ôfunctional efficiencyÕ accomplished by opti-
mal time dependent variations of enzyme concentrations
was assessed by comparing the minimal transition time s
min
with the reference value s
ref
representing the smallest
possible transition time achievable without time dependent
enzyme variations (Fig. 3B). As shown in [19] the transition
time at constant enzyme concentrations is minimized when
equal amounts of protein are allocated to all enzymes, i.e.
E
i
¼ E
tot
/n (giving rise to the functional dependency
s
ref
µ n
2
). It is seen that the difference between s
min
and
s
ref
due to time dependent optimization of enzyme profiles
steadily rises with increasing length of the pathway (e.g.
10.5% for n ¼ 2 and 50.2% for n ¼ 10).
Predicting temporal enzyme profiles for central
metabolic pathways of yeast cells under conditions
of a diauxic shift
Using microarray techniques it was discovered that the
switch from fermentation to respiration after depletion of
glucose is accompanied by concerted changes in the mRNA
levels for most enzymes of the central metabolism of yeast
resulting in down-regulation of glycolysis and up-regulation
of the TCA-cycle and gluconeogenesis [1,3]. In this para-
graph we report on the application of our optimization
approach to rationally explain these observed time depend-
ent changes as a strategy of yeast cells to maintain the
concentration level of important metabolites. The starting
point is the simplified metabolic governed by the kinetic
equations given in the Appendix.
The diauxic shift is a peculiarity of yeast cells to utilize
ethanol under conditions of glucose depletion to maintain
their cellular redox potential NADH/NAD and ATP level.
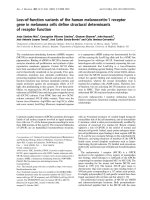
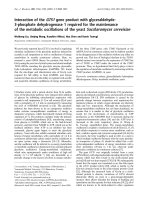
Fig. 4. Optimal of enzyme profiles ensuring maximal survival time of
yeast cells under conditions of a diauxic shift. Optimal enzyme profiles
(dotted curves) were calculated for Scheme 2 and governed by the
kinetic equations given in the Appendix. Related observed gene
expression profiles are plotted as solid curves. Rate constants:
k
1
¼ 3.7, k
2
¼ 6Æ10
3
, k
3
¼ k
4
¼ 10
4
, k
5
¼ k
6
¼ 4Æ10
3
, k
7
¼ 1.28,
k
8
¼ k
9
¼ 12. In the feeding period (t £ 0) the system was assumed
to be in steady state characterized by the glucose influx v
0
¼ 9.96, the
metabolite concentrations X
1
¼ 5.8, X
2
¼ 0.9, X
3
¼ 0.2, X
4
¼ 8.7,
NADH ¼ 0.1, ATP ¼ 2.4, and the enzyme concentrations
E
1
¼ 0.1934, E
2
¼ 0.0909, E
3
¼ 3.0621, E
4
¼ 0.0078, E
5
¼ 0.9208,
E
6
¼ 1.7250. Time given in h, concentrations given in m
M
.Calcula-
tions were performed for the threshold values ATP
min
¼ 1.55 and
NADH
min
¼ 0.05. At t ¼ 0 the stationary feeding period was stopped
by preventing the further supply of glucose (v
0
¼ 0fort >0).The
concentrations of metabolites and enzymes of the feeding period were
taken as initial values for the starvation period. The time-dependent
enzyme profiles were approximated by interval-wise constant values,
i.e. E
i
(t) ¼ E
i
(j)forT
j
£ T
j+1
between equidistantly distributed time
points, T
j
¼ j,withj ¼ 0,…,m (m: number of switches). Maximization
of the survival time by means of a genetic algorithm: A population was
introduced as a set of species S
p
each characterized by the survival time
J(p) associated with a given set of E
p
i
jðÞvalues in the time intervals j
with
P
6
i¼1
E
p
i
jðÞE
tot
. The optimization procedure started with a
randomly chosen population. This population was subjected to a
certain number of mutations and recombination’s. A ÔmutationÕ is
defined as exchange of a small amount (dE)ofproteinbetweenran-
domly chosen enzymes E
i
and E
i*
taking place in a randomly chosen
time-interval j, i.e. E
i
( j) fi E
i
( j)–dE
i
, E
i*
(j) fi E
i*
(j)–dE
i*
(i „ i*).
dE
i
and dE
i*
have to be consistent with the constraint of an upper limit
for the sum of all enzyme concentrations. To prevent irregular enzyme
profiles the maximum possible change in the concentration of a given
enzyme between two succeeding time intervals was restricted to 10%.
Recombination is defined as exchange of all values of E
i
(j)betweentwo
randomly chosen species for all time-intervals j ‡ j
0
with a randomly
chosen j
0
. A new population of species was selected after a sufficiently
large number of mutations and recombination’s whereby the prob-
ability of a species to enter the new population was proportional to the
value of the survival time J(p). Comparison with measured gene
expression profiles: for comparison to experimental data expression
data of those genes which belong to the group represented by overall
reactions 1–6 are displayed as solid lines represent the red-over-green
fluorescence ratios (Ôfold induction/repressionÕ)pickedupfromthe
Stanford Microarray database ( />explore/array.txt). For E
1
(upper glycolysis): HXK2 and PFK1, for E
2
(lower glycolysis): TDH1 and ENO2, for E
3
(ethanol formation):
PDC1,5,6 and ADH1, for E
4
(ethanol degradation): ALD2 and ACS1,
and for E
5
(TCA cycle): IDH1,2 and FUM1. Time scales of experi-
mental data (shown above the panels) and model predictions (shown
below the panels) differ by a factor of about 2.
Ó FEBS 2002 Metabolic optimization (Eur. J. Biochem. 269) 5409
This enables them to survive over longer periods of
starvation. Accordingly, we have chosen as performance
function the Ôsurvival timeÕ, J, defined as the time span
during which the redox potential and energetic status of the
cell represented by the concentrations of the key substances
NADH and ATP, remain above critical thresholds.
Optimal enzyme profiles were calculated by maximizing J
under the constraint that the sum of individual enzyme
concentrations during the time course must not exceed the
total initial enzyme concentration. For t < 0 (feeding
period) we assumed time-independent concentrations of
enzymes such that the steady state solutions of the model
equations yield metabolites concentrations and fluxes which
are consistent with reported values [20]. The starvation
period was initialized at time t ¼ 0 by interrupting the supply
of glucose (v
0
¼ 0fort ‡ 0). Calculation of optimal enzyme
profiles was performed by using a similar discretization
technique as applied to the search of optimal solutions for the
unbranched pathways. The time axis was subdivided into a
large number of time-intervals off equal lengths Dt ¼ 1. The
search for optimal values of the unknown enzyme concen-
trations within each time-interval was carried out by means
of a genetic algorithm [21] detailed in the legend to Fig. 4.
The obtained optimal enzyme profiles are shown in Fig. 4
(dotted curves). The related time-dependent concentration
courses for the metabolites NADH, ATP and ethanol are
depicted in Fig. 5 (curves a). For comparison, Fig. 5 also
shows the optimal concentration courses for cases where
only a single switch of the enzyme activities was allowed
(case b) or no switch was allowed at all (case c).
Inspection of the enzyme profiles in Fig. 4 reveals that
initiation of the starvation period gives rise to a notable
initial increase in the activity of the lower part of glycolysis
(E
2
). This effect is paralleled by an increase in the activity of
ethanol formation (E
3
). Hence, as long as glucose is not
exhausted it is advantageous for the cell to direct glycolysis
to the replenishment of the ethanol reservoir to make use of
it in a later phase of starvation. Increasing activity in the
lower part of glycolysis (E
2
) enhances the consumption of
triose-phosphates and thus causes a rapid switch-off of the
synthetic pathway (reaction 9). The model predicts non-
monotonic profiles for the enzymes of the TCA cycle (E
5
)
and of aerobic ATP production (E
6
). An initial decrease is
followed by a plateau before a final increase. In the later
phase of the starvation period, when the glycolytic meta-
bolites are exhausted, the lower part of glycolysis (E
2
)and
the ethanol forming reactions (E
3
) are switched off. This
allows to allocate the available amount of protein to the
ethanol utilizing enzymes (E
4
) making the ethanol pool avail-
able for the formation of NADH. Accordingly, there is a
strong increase in the activity of the tricarbonic acid cycle (E
5
)
and the respiratory chain (E
6
) to compensate for the decline
in the glycolytic supply of NADH and ATP.
For a comparison to experimental results we display in
Fig. 4 the time dependent expression profiles of several
genes ([1], />txt) which are related to the groups of the enzymes entering
Scheme 2 in the Appendix. There is a remarkable concor-
dance of the predicted enzyme profiles and observed gene
expression profiles. In all cases the tendencies (increase or
decrease) are correctly predicted by the model. In particular,
the Ôfold increase/decreaseÕ, i.e. the ratio between the final
and the initial expression level, match very well.
The time courses of the metabolite concentrations in
Fig. 5 indicate that reprogramming of gene expression
under stress conditions allows for homeostasis of metabo-
lites as NADH and ATP which are essential for cell
viability. The calculated survival time amounts to
J
max
¼ 47.55 (see curves a) which is about twice as large
as the survival time J
ref
¼ 22.32 obtained for time-inde-
pendent enzyme concentrations (see curves c). At the
respective J values the concentration of either NADH or
ATP fall below their thresholds. It is intriguing that even a
single switch in the enzyme carried out at an optimal time
point leads to a pronounced prolongation of the survival
time (J
1switch
¼ 32.94, curves b in Fig. 5).
DISCUSSION
In this paper, we have applied optimality principles to
rationalize time-dependent gene expression profiles in the
Fig. 5. Calculated time-courses of some important metabolites of yeast
at enzyme profiles ensuring a maximal survival time of yeast cells. The
concentrations of NADH, ATP, and ethanol are represented as rel-
ative values with respect to their initial values. (a) Time courses cor-
respond to the optimal enzyme profiles depicted in Fig. 4. (b) Time
courses correspond to a optimal single switch of enzyme activities. (c)
Time courses at time-independent enzyme profiles.The vertical arrows
above the upper panel indicate the maximal survival times achieved in
cases (a–c). Thin horizontal lines in the upper two panels indicate the
threshold values for NADH and ATP, respectively.
5410 E. Klipp et al. (Eur. J. Biochem. 269) Ó FEBS 2002
context of cellular metabolism. In its mathematical foun-
dation our approach shares a lot of similarities with
methods applied in the theory of optimal control [22].
From the biological view point, our approach is backed up
by many observations pointing to the existence of time-
dependent gene expression patterns which have evolved
during natural evolution to assure survival of the population
in typical and recurrent stress situations such as shortage of
substrates or changes of pH or temperature. We think that
such evolutionary trained gene expression patterns represent
asortofÔpopulation memoryÕ that enables cells to cope with
environmental changes in an anticipatory way. It has to be
noted that the optimization of long-term responses consid-
ered in our approach differs from other theoretical appro-
aches in that field considering the maximization of the flux
rate through a metabolic pathway at any time as a (short-
term) goal of genetic regulation [23,24].
Dealing with the evolutionary optimization of gene
expression in mathematical terms requires substantial
simplifications in view of the complexity of cellular meta-
bolism. Therefore, the presented work is primarily intended
to gather deeper insight into general strategies underlying
commonly erratic temporary gene expression patterns
rather than to provide a computer tool to exactly predict
the expression profile for a specific enzyme. A major
simplification of our approach is the restriction to the
analysis of relatively small metabolic schemes governed by
simple first or second order rate equations. Moreover, only
a single performance function (transition time for the
conversion of a substrate into a final product, homeostasis
of cardinal metabolites) was introduced to measure the
fidelity of a metabolic system. Optimal enzyme profiles were
calculated under the premise that the optimum of the
chosen performance function has been already attained.
Finally, the calculated optimal enzyme profiles do not take
into account that the redistribution of enzyme within the
pathway requires a finite time span due to protein synthesis
and degradation. Regarding the latter aspect, we have also
analysed extended versions of the unbranched pathway
model by including in some detail transcription of genes,
translation of mRNAs, and proteolysis. In these models the
genes may exist in ÔOnÕ or ÔOffÕ-states and it was assumed
that mRNAs and enzymes compete for their building blocks
(nucleotides and amino acids during transcription and
translation, respectively) which occur in finite amounts.
Using again the transition time as performance function the
optimal solution is characterized by abrupt switches in gene
activities which result, however, in smoother variations of
the enzyme concentrations. For the limiting case of very fast
enzyme turnover the optimal time-dependent enzyme con-
centrations tend towards the profiles obtained without
explicit consideration of enzyme synthesis and degradation.
Our results derived for some model systems underline the
common view that temporal gene expression is a powerful
means of cells to adjust their metabolism to changing
environmental conditions. Turning on or off enzyme
activities at appropriate time points may lead to a significant
improvement of metabolic efficiency. For the linear reaction
pathway of length n ¼ 10 the transition time achieved by
optimal time-dependent enzyme profiles dropped down to
about 50% of the value obtainable at optimal but time-
independent allocation of protein to the various enzymes. In
case of yeast metabolism, the survival time approximately
doubled due to time-dependent regulation of enzyme
activities. Considering the huge number of different enzy-
matic reactions in a cell and the possibility to switch on or
off complete pathways the gain in functional efficiency
associated with temporal gene expression will possibly be
even higher than estimated for the relatively simple meta-
bolic systems studied in this paper. Interestingly, a pro-
nounced impact on the functional efficiency of the
metabolic systems studied was already achieved by a single
switch in the enzyme concentrations provided that this
switch takes place with the right intensity and at the right
time. Our theoretical findings suggest that an even better
metabolic adaptation to environmental changes should be
possible by multiple switching giving rise to nonmonotonic
enzyme profiles.
The general inference of our theoretical study is that the
limited resources force the cell to concentrate protein
synthesizing capacities to those enzymes which are currently
needed. This becomes most apparent in the wave-like
enzyme profiles for the linear pathway but is also reflected
by optimal enzyme profiles in the yeast model. Our results
well agree with experimental data. Studies of gene expres-
sion during the cell cycle of Caulobacter crescentus lead to
the conclusion that Ôgenes involved in a given cell function
are activated at the time of execution of that functionÕ [25].
Clustered expression profiles show wave-like temporal
changes of mRNA levels [25]. Their findings are supported
by proteomic analyses [26].
Our results suggest that an optimal strategy to reach a
long-term goal by temporal gene expression is not optimal
from the view point of short-time behaviour. In the case of a
linear chain this becomes apparent by a lag phase before
starting to synthesize the final product. For yeast metabo-
lism global optimization of the survival time is achieved by
intermediary storage of ethanol which on a shorter time
scale would appear as a waste of glucose. Obviously, such
strategies could only be established as a result of an
evolutionary process.
As demonstrated for the metabolism of yeast cells our
method even allows to predict groups of enzymes which
should be coexpressed or differentially expressed under
given external conditions. It turns out that the enzymes of
one and the same pathway may differ in their individual
time profiles (see deviating regulation of upper and lower
glycolysis in the initial phase of the diauxic shift, Fig. 4).
Similarly, enzymes with synchronized expression profiles
may belong to different metabolic pathways. The predic-
tions could be refined by considering more detailed
metabolic reaction schemes taken, for example, from the
KEGG database of metabolic pathways (-
nome.ad.jp/kegg/metabolism.html). In this way our ap-
proach may contribute to assign gene expression profiles
to enzymes involved in defined parts of metabolism. Our
future work will aim at studying whether the proposed
methodology can be generalized to more complex,
branched metabolic processes, especially in view of
predicting expression of the genes most critical to a given
process.
ACKNOWLEDGEMENTS
We are grateful to Dirk Holste for advise in the use of the Stanford
Microarray database.
Ó FEBS 2002 Metabolic optimization (Eur. J. Biochem. 269) 5411
REFERENCES
1. DeRisi, J.L., Iyer, V.R. & Brown, P.O. (1997) Exploring the
metabolic and genetic control of gene expression on a genomic
scale. Science 278, 680–686.
2. Kuhn, K.M., DeRisi, J.L., Brown, P.O. & Sarnow, P. (2001) Glo-
bal and specific translational regulation in the genomic response
of Saccharomyces cerevisiae to a rapid transfer from a fermentable
to a nonfermentable carbon source. Mol. Cell. Biol. 21, 916–927.
3. Ferea, T.L., Botstein, D., Brown, P.O. & Rosenzweig, R.F. (1999)
Systematic changes in gene expression patterns following adaptive
evolution in yeast. Proc. Natl Acad. Sci. USA 96, 9721–9726.
4. Rep, M., Krantz, M., Thevelein, J.M. & Hohmann, S. (2000) The
transcriptional response of Saccharomyces cerevisiae to osmotic
shock. Hot1p and Msn2p/Msn4p are required for the induction of
subsets of high osmolarity glycerol pathway-dependent genes.
J. Biol. Chem. 275, 8290–8300.
5. Cho, R.J., Fromont-Racine, M., Wodicka, L., Feierbach, B.,
Stearns, T., Legrain, P., Lockhart, D.J. & Davis, R.W. (1998)
Parallel analysis of genetic selections using whole genome oligo-
nucleotide arrays. Proc. Natl Acad. Sci. USA 95, 3752–3757.
6. Cho, R.J., Campbell, M.J., Winzeler, E.A., Steinmetz, L., Conway,
A., Wodicka, L., Wolfsberg, T.G., Gabrielian, A.E., Landsman,
D., Lockhart, D.J. & Davis, R.W. (1998) A genome-wide tran-
scriptional analysis of the mitotic cell cycle. Mol. Cell. 2, 65–73.
7. Holter, N.S., Mitra, M., Maritan, A., Cieplak, M., Banavar, J.R.
& Fedoroff, N.V. (2000) Fundamental patterns underlying gene
expression profiles: simplicity from complexity. Proc. Natl Acad.
Sci. USA 97, 8409–8414.
8. Velculescu, V.E., Zhang, L., Zhou, W., Vogelstein, J., Basrai, M.A.,
Bassett, D.E. Jr, Hieter, P., Vogelstein, B. & Kinzler, K.W. (1997)
Characterization of the yeast transcriptome. Cell 88, 243–251.
9. Spellman, P.T., Sherlock, G., Zhang, M.Q., Iyer, V.R., Anders,
K., Eisen, M.B., Brown, P.O., Botstein, D. & Futcher, B. (1998)
Comprehensive identification of cell cycle-regulated genes of the
yeast Saccharomyces cerevisiae by microarray hybridization. Mol.
Biol. Cell. 9, 3273–3297.
10. Lashkari, D.A., DeRisi, J.L., McCusker, J.H., Namath, A.F.,
Gentile, C., Hwang, S.Y., Brown, P.O. & Davis, R.W. (1997)
Yeast microarrays for genome wide parallel genetic and gene
expression analysis. Proc. Natl Acad. Sci. USA 94, 13057–13062.
11. Heinrich, R., Schuster, S. & Holzhutter, H.G. (1991) Mathe-
matical analysis of enzymic reaction systems using optimization
principles. Eur. J. Biochem. 201, 1–21.
12. Pettersson, G. (1993) Optimal kinetic design of enzymes in a linear
metabolic pathway. Biochim. Biophys. Acta. 1164, 1–7.
13. Melendez-Hevia, E., Waddell, T.G., Heinrich, R. & Montero, F.
(1997) Theoretical approaches to the evolutionary optimization of
glycolysis – chemical analysis. Eur. J. Biochem. 244, 527–543.
14. Stephani, A. & Heinrich, R. (1998) Kinetic and thermodynamic
principles determining the structural design of ATP-producing
systems. Bull. Math. Biol. 60, 505–543.
15. Klipp, E. & Heinrich, R. (1999) Competition for enzymes in
metabolic pathways: implications for optimal distributions of en-
zyme concentrations and for the distribution of flux control.
Biosystems 54, 1–14.
16. Brown, G.C. (1991) Total cell protein concentration as an evolu-
tionary constraint on the metabolic control distribution in cells.
J. Theor. Biol. 153, 195–203.
17. Llorens, M., Nuno, J.C., Rodriguez, Y., Melendez-Hevia, E. &
Montero, F. (1999) Generalization of the theory of transition
times in metabolic pathways: a geometrical approach. Biophys. J.
77, 23–36.
18. Reference with drawn.
19. Heinrich, R. & Schuster, S. (1996) The Regulation of Cellular
Systems. Chapman & Hall, New York.
20. Wolf, J. & Heinrich, R. (2000) Effect of cellular interaction on
glycolytic oscillations in yeast: a theoretical investigation. Bio-
chem. J. 345, 321–334.
21. Michalewicz, Z. (1992) Genetic Algorithms + Data Structure ¼
Evolution Programs. Springer Verlag, Berlin.
22. Pontrjagin, L.S., Boltyanski, V.G., Gamkrelidse, R.V. &
Mischenko, E.F. (1962) The Mathematical Theory of Optimal
Processes.JohnWiley,NewYork.
23. Varner, J. & Ramkrishna, D. (1999) Metabolic engineering from a
cybernetic perspective. 1. Theoretical preliminaries. Biotechnol.
Prog. 15, 407–425.
24. Varner, J. & Ramkrishna, D. (1998) Application of cybernetic
models to metabolic engineering: investigation of storage path-
ways. Biotechnol. Bioeng. 58, 282–291.
25. Laub, M.T., McAdams, H.H., Feldblyum, T., Fraser, C.M. &
Shapiro, L. (2000) Global analysis of the genetic network con-
trolling a bacterial cell cycle. Science 290, 2144–2148.
26. Grunenfelder,B.,Rummel,G.,Vohradsky,J.,Roder,D.,Langen,
H. & Jenal, U. (2001) Proteomic analysis of the bacterial cell cycle.
Proc. Natl Acad. Sci. USA 98, 4681–4686.
APPENDIX
Reaction scheme 1
Systems equations
dS
dt
¼k
1
E
1
S
dX
i
dt
¼ k
i
E
i
X
i1
k
iþ1
E
iþ1
X
i
dP
dt
¼ k
n
E
n
X
n1
Constraint
X
n
i¼1
E
i
tðÞ¼E
tot
Performance
s ¼
1
C
Z
1
0
C PtðÞðÞdt
C ¼ S
t¼0
j
s ! MINIMUM
Scheme 1. A linear (unbranched) reaction chain of (n) reactions steps
converting substrate S into product P.
5412 E. Klipp et al. (Eur. J. Biochem. 269) Ó FEBS 2002
Reaction scheme 2
Systems equations
dX
1
=
dt ¼ v
0
v
1
dX
2
=
dt ¼ 2v
1
v
2
v
9
dX
3
=dt ¼ v
2
v
3
þ v
4
v
5
dX
4
=
dt ¼ v
3
v
4
dNADH
=
dt ¼ v
2
v
3
þ v
4
þ 4v
5
v
6
v
8
v
9
dATP
=
dt ¼2v
1
þ 2v
2
þ 3v
6
v
7
v
1
¼ E
1
k
1
X
1
ATP
v
2
¼ E
2
k
2
X
2
NAD
þ
ADP
v
3
¼ E
3
k
3
X
3
NADH
v
4
¼ E
4
k
4
X
4
NAD
þ
v
5
¼ E
5
k
5
X
3
NAD
þ
v
6
¼ E
6
k
6
NADH ADP
v
7
¼ k
7
ATP
v
8
¼ k
8
NADH
v
9
¼ k
9
X
2
NADH
Constraint
NADH þ NAD
þ
¼ const:
ATP þ ADP ¼ const:
X
6
i¼1
E
i
ðtÞE
tot
Performance
# ¼ t H ATP ATP
c
ðÞH NADH NADH
c
ðÞ
HðxÞ¼1ifx 0; H(x) ¼ 0ifx< 0
# ! MAXIMUM
Scheme 2. Skeleton model of the central metabolism of yeast. Groups of enzymes constituting pathways or functional parts of pathways are
represented as single overall reactions.
Ó FEBS 2002 Metabolic optimization (Eur. J. Biochem. 269) 5413