Báo cáo y học: "Comparative phosphoproteomics reveals evolutionary and functional conservation of phosphorylation across eukaryotes" doc
Bạn đang xem bản rút gọn của tài liệu. Xem và tải ngay bản đầy đủ của tài liệu tại đây (371.17 KB, 9 trang )
Genome Biology 2008, 9:R144
Open Access
2008Boekhorstet al.Volume 9, Issue 10, Article R144
Research
Comparative phosphoproteomics reveals evolutionary and
functional conservation of phosphorylation across eukaryotes
Jos Boekhorst
*
, Bas van Breukelen
†
, Albert JR Heck
†
and Berend Snel
*‡
Addresses:
*
Bioinformatics, Department of Biology, Faculty of Science, Utrecht University, Padualaan, 3584 CH, The Netherlands.
†
Biomolecular Mass Spectrometry and Proteomics Group, Bijvoet Center for Biomolecular Research and Utrecht Institute for Pharmaceutical
Sciences, Utrecht University, Sorbonnelaan, 3584 CA Utrecht, The Netherlands.
‡
Academic Biomedical Centre, Utrecht University, Yalelaan,
3584 CL Utrecht, The Netherlands.
Correspondence: Jos Boekhorst. Email:
© 2008 Boekhorst et al.; licensee BioMed Central Ltd.
This is an open access article distributed under the terms of the Creative Commons Attribution License ( which
permits unrestricted use, distribution, and reproduction in any medium, provided the original work is properly cited.
Phosphorylation in eukaryote evolution<p>A comparison of phosphoproteomics datasets of six eukaryotes shows significant overlap between phosphoproteomes.</p>
Abstract
Background: Reversible phosphorylation of proteins is involved in a wide range of processes,
ranging from signaling cascades to regulation of protein complex assembly. Little is known about
the structure and evolution of phosphorylation networks. Recent high-throughput
phosphoproteomics studies have resulted in the rapid accumulation of phosphopeptide datasets for
many model organisms. Here, we exploit these novel data for the comparative analysis of
phosphorylation events between different species of eukaryotes.
Results: Comparison of phosphoproteomics datasets of six eukaryotes yields an overlap ranging
from approximately 700 sites for human and mouse (two large datasets of closely related species)
to a single site for fish and yeast (distantly related as well as two of the smallest datasets). Some
conserved events appear surprisingly old; those shared by plant and animals suggest conservation
over the time scale of a billion years. In spite of the hypothesized incomprehensive nature of
phosphoproteomics datasets and differences in experimental procedures, we show that the
overlap between phosphoproteomes is greater than expected by chance and indicates increased
functional relevance. Despite the dynamic nature of the evolution of phosphorylation, the relative
overlap between the different datasets is identical to the phylogeny of the species studied.
Conclusion: This analysis provides a framework for the generation of biological insights by
comparative analysis of high-throughput phosphoproteomics datasets. We expect the rapidly
growing body of data from high-throughput mass spectrometry analysis to make comparative
phosphoproteomics a powerful tool for elucidating the evolutionary and functional dynamics of
reversible phosphorylation.
Background
Post-translational modifications play important roles in a
wide range of cellar functions. Reversible phosphorylation
has been studied extensively and is known to influence pro-
tein function by changing protein-protein binding properties,
activity, stability, and spatial organization [1]. Phosphoryla-
tion plays a key role in signal transduction cascades [2] and
allows the fine tuning of protein complex assembly [3]. It is
Published: 1 October 2008
Genome Biology 2008, 9:R144 (doi:10.1186/gb-2008-9-10-r144)
Received: 8 July 2008
Revised: 3 September 2008
Accepted: 1 October 2008
The electronic version of this article is the complete one and can be
found online at /> Genome Biology 2008, Volume 9, Issue 10, Article R144 Boekhorst et al. R144.2
Genome Biology 2008, 9:R144
estimated that about one-third of all proteins in eukaryotic
cells are phosphorylated at any given time [1].
Recent developments in high-throughput phosphoproteom-
ics studies have resulted in the availability of phosphopeptide
datasets for many model organisms. As a result, tools for the
comparison of phosphoproteomes are emerging [4].
Although these high-throughput datasets do not capture all
phosphorylated peptides of a species under a given condition,
large advances in enrichment strategies and mass spectrome-
try techniques have been made in the past few years, and
studies comparing partial phosphoproteomes are emerging
[5]. Even though both the incomprehensive nature of the data
as well as differences in experimental procedures complicate
comparative analysis, we can now start to exploit these data.
Comparative analysis of phosphoproteomics data could
increase our understanding of phosphorylation and the evo-
lution of the phosphorylation network as a systems level
property.
Not only do comparative analyses aid in elucidating the evo-
lution of phosphorylation, but they also are a powerful tool
with which to improve function prediction from sometimes
noisy high-throughput datasets. For example, the use of con-
served gene order has been shown to be a much stronger sig-
nal for protein function prediction than the order of genes in
a single genome [6-8]. Similarly, the conservation of co-
expression has been shown to aid function prediction from
microarray data [9,10].
In this study we perform comparative analysis of phosphor-
ylation events in eukaryotes. Our aim is to determine whether
the quality of the data is sufficient to detect functionally sig-
nificant overlap between high-throughput phosphoproteom-
ics datasets, and to identify an evolutionarily significant
pattern in this overlap. To address these questions, we com-
pare recent high-throughput phosphoproteomics datasets of
human, mouse, zebra fish, fruit fly, yeast, and plant. We
determine the overlap between these datasets and show that
this overlap is statistically, functionally, and evolutionarily
relevant.
Results
Measuring the overlap in phosphoproteomes
We analyzed the overlap between high-throughput phospho-
proteomics datasets from six species of eukaryotes. These
datasets were created by different laboratories, using differ-
ent experimental procedures (Table 1). In order to amend
these datasets for comparative analysis, we imposed a rela-
tively strict set of cutoffs on phosphopeptide calls in order to
improve the uniformity and reduce noise caused by differ-
ences in scoring methods and thresholds (more details are
provided in the Materials and methods section, below). The
sizes of these individual datasets range from 724 to 3,296
(Table 1).
We identified homologous sequences by an all-against-all
Smith-Waterman search of all full-length proteins for which
one or more phosphopeptides were present in the datasets.
Phosphosites are considered homologous when a phos-
phosite in the query is aligned with the same type of phos-
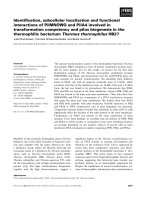
phosite in the target sequence (workflow illustrated in Figure
1). For each dataset (the query) we counted the number of
phosphorylation sites in the query datasets with at least one
homolog in each of the target datasets (Table 2). The overlap
between the datasets ranges from approximately 700 sites for
human and mouse (two large datasets from closely related
species) to a single site for fish and yeast (both distantly relate
as well as two of the smallest datasets). Despite the virtually
nonexistent overlap between fish and yeast, larger datasets of
distantly related species exhibit considerable conservation;
for example, mouse and plant share 27 phosphosites. We
detect an overlap that is substantially larger than the overlap
reported in specific phosphoproteomics experiments; the
analysis conducted by Lemeer and coworkers [11] resulted in
50 phosphosites in zebrafish that had already been reported
in human or mouse, whereas we find an overlap of more than
150.
The overlap between phosphoproteomics sets is
significant
In both a scenario in which the rate of evolution of reversible
phosphorylation is so high that the species are too diverged to
detect real homologous phosphosites, and when species com-
pletely re-wire their phosphoproteome after speciation,
chance alone would result in a certain amount of overlap. We
thus randomized for every protein in the datasets the posi-
tions of the phosphorylated residues across 1,000 trials and
computed the average overlap. Note that this is a conservative
null model, because it assumes that different species phos-
phorylate the same protein, whereas cases have been
described in which different species use phosphorylation of
different proteins for the regulation of the assembly of homol-
ogous protein complexes [3]. The observed overlap is larger
than the average random overlap for almost all species com-
parisons (Table 2), strongly suggesting that the observed
overlap is the result of significant evolutionary conservation.
Table 1
Phosphoproteomics datasets
Species Reference Proteins (n)
a
Sites (n)
a
Human [34] 1,419 3,296
Mouse [23] 1,605 3,142
Fly [14] 991 2,080
Yeast [35] 481 850
Plant [22] 470 724
Zebrafish [11] 668 759
a
Can be less than the number mentioned in the original papers,
because we imposed a relatively strict set of cutoffs on
phosphopeptide calls to improve the uniformity and reduce noise.
Genome Biology 2008, Volume 9, Issue 10, Article R144 Boekhorst et al. R144.3
Genome Biology 2008, 9:R144
Given the difficulty of formulating a null model for the signif-
icance of conservation between two species, we next consid-
ered the conservation of phosphorylation events over three or
more species; if evolution plays no role in the overlap between
datasets, then the chance of a specific site being conserved in
one species will be independent of the presence or absence of
that same site in other species. We thus compare the number
of sites with homologs in two or more species with the
number of sites that we would expect if we assume the
chances of being conserved in different species to be inde-
pendent (Table 3). For all datasets we observe that the
number of sites observed in three, four, or five different spe-
cies exceeds the number of sites expected assuming inde-
pendence. Although we do not observe any phosphosites with
homologs in all six species, we do observe a number of phos-
phorylation sites in Arabidopsis thaliana with homologs in
one or more of the other datasets. These sites predate the evo-
lutionary split between plants and ophistokonts, making
them more than a billion years old [12].
Relative overlap between phosphoproteomics data
sets contains a strong evolutionary signal
Two independent tests suggest that the phosphorylation
overlap is quantitatively significant. As a next step we tested
for qualitative relevance by searching for a possible evolution-
ary pattern in the conservation of phosphoproteomics data-
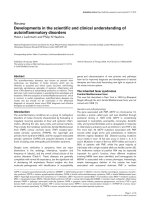
Workflow for determining conservation between two phosphoproteomics datasetsFigure 1
Workflow for determining conservation between two phosphoproteomics datasets. Black letters are amino acid residues, and a white p in a red circle
indicates a phosphogroup. A more detailed description of this procedure can be found in the Materials and methods section.
S
P
S
P
T
P
T
P
S
P
T
P
S
P
SY
P P
S
P
S
S
P
S
P
T
P
Y
P
T
P
S
P
T
T
P
S
P
S
P
S
P
S
P
S
P
S
P
S
P
S
S
P
P
P
T
P
S
P
S
P
S
P
S
P
retrieve full-length protein sequences
similarity search
count for every dataset the number of phosphosites aligned
with one or more phosphosites in the other datasets
phosphopeptides
full-length protein sequences
high-scoring segment pairs (conserved phosphosites are indicated in
red)
overlap between datasets
Genome Biology 2008, Volume 9, Issue 10, Article R144 Boekhorst et al. R144.4
Genome Biology 2008, 9:R144
sets. Specifically, we wondered whether a purported dynamic
system level property such as the phosphorylation repertoire
reflects the species phylogeny. However, interpreting the rel-
ative differences in overlap is far from trivial, because a myr-
iad of both biological and technical factors, ranging from the
sensitivity of the mass spectrometry analysis to experimental
conditions under which phosphoproteomes were sampled,
convolute a potential signal.
In order to extract this potential signal, we determined the
relative number of conserved phosphorylation sites by com-
paring the overlap with the number of sites that can poten-
tially be conserved, given the proteins in the specific datasets:
the relative overlap. This relative overlap can be obtained in a
relatively straightforward manner by dividing the number of
conserved phosphorylation events of the query and target
datasets by the number of sites in the query dataset with one
or more homologous positions in full-length proteins of the
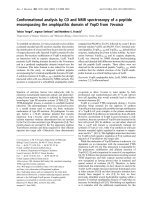
target dataset. We subsequently clustered the six species on
the basis of their relative by the neighbor joining algorithm
using 1 - (relative overlap) as the distance measure (Figure 2
and Additional data file 1). The topology of the unrooted tree
that is the result of the neighbor-joining is identical to the
topology of the tree of life for this small sample of six species.
Variations in experimental conditions and protocols poten-
tially obscure the evolutionary signal in the overlap between
datasets. If this evolutionary signal is relatively strong, then
the relative overlap between datasets from a single species
should be greater than the relative overlap between datasets
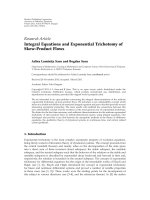
from different species. We determined the relative overlap
between an additional dataset from fly [13] and the other six
datasets (Figure 3a). This additional dataset contains many
more phosphosites than the fly dataset that is already part of
our analysis (the additional dataset contains 10,293 sites, as
compared with the 2,080 of the original dataset), and the two
datasets were constructed by different laboratories using dif-
ferent techniques [13,14]. Nevertheless, the relative overlap
between both fly datasets is more than twice that with any of
the other datasets (Figure 3a), and an extended neighbor-
joining tree groups these two datasets together (Figure 3b).
The relative overlap between the datasets is thus not only
higher than expected by random chance; the relative overlap
also follows phylogeny and thus contains a qualitatively
strong and relevant evolutionary signal.
Low-throughput experiments as a golden standard and
conserved phosphosites and protein function
Conservation in sequence and gene order generally has func-
Table 2
Number of query phosphorylation sites with at least one conserved site in the target species
Query\target Plant Fly Human Mouse Yeast Fish
Plant × 9 (3.4) 13 (6.1) 27 (9.6) 3 (3.1) 4 (1.8)
Fly 9 (3.1) × 85 (32.0) 72 (28.0) 4 (3.2) 35 (6.5)
Human 13 (5.6) 88 (33.7) × 700 (155.5) 8 (6.3) 157 (27.6)
Mouse 27 (9.3) 79 (28.8) 706 (151.5) × 13 (6.7) 151 (19.7)
Yeast 2 (2.8) 4 (3.1) 6 (5.9) 11 (6.4) × 1 (1.6)
Fish 3 (1.5) 38 (6.5) 149 (26.0) 132 (18.9) 1 (1.6) ×
The number in parenthesis is average number of conserved sites of 1,000 randomization trials in which the position of phosphorylation sites were
shuffled. Please note that the overlap is not symmetric, because a site in a query dataset can have multiple homologs in a target dataset.
Table 3
Number of sites found in three or more different species
Three different species
a
Four different species Five different species
Observed Expected
b
Observed Expected Observed Expected
Plant 9 1.55 2 0.02 2 0.00
Fly 33 7.55 13 0.18 2 0.00
Human 103 59.45 17 1.31 3 0.01
Mouse 106 63.59 23 1.80 4 0.02
Yeast 2 0.27 0 0.00 1 0.00
Fish 72 40.15 12 1.86 2 0.01
a
Total number of species in which a phosphosite was present, including the query organism. We did not identify any sites with homologs in all six
datasets.
b
The number of expected sites assuming independent chances of conservation (the chance of a specific site being conserved in one species
is independent of the presence or absence of that same site in other species).
Genome Biology 2008, Volume 9, Issue 10, Article R144 Boekhorst et al. R144.5
Genome Biology 2008, 9:R144
tional meaning [8]. Low-throughput experiments are in gen-
eral considered to be more reliable than high-throughput
experiments, because they tend to be more suited to controls
and validation. Several databases collect experimental data
on reversible phosphorylation, for example Phospho.ELM
[15] and Phosida [16]. Of all of the phosphosites in the human
dataset, 2.5% have also been observed by a low-throughput
experiment in the Phospho.ELM database; for the mouse
dataset this is 2.0%. In contrast, 4.8% of the conserved sites
in human and 4.2% of the conserved sites in mouse have been
measured using low-throughput techniques, a significant
increase (
2
test P < 0.0001). This observation shows that
putative phosphorylation events with homologs in other
high-throughput experiments are less likely to be false posi-
tives. This increase in reliability suggests that the overlap
between phosphoproteomics datasets could be used as a tool
with which to assess the reliability of putative phosphosites
identified in high-throughput experiments, similar to the use
of comparative methods for improving reliability of interac-
tomes [17].
Because some functional classes of proteins have been shown
to be more conserved than others, we wondered whether this
also holds for phosphorylation events. We utilized the func-
tional classification provided by the Clusters of Orthologous
Groups database [18] to study over-representation of biolog-
ical processes among proteins with well conserved phos-
phosites (Figure 4a,b). These data reveal a clear functional
trend in conserved phosphorylation sites; compared with
sites that are found in only a single species, a relatively high
percentage of phosphosites with homologs in two or more
species are found in proteins with functions related to infor-
mation storage and processing. Most striking is the over-rep-
resentation of proteins that are involved in replication,
chromatin structure, and cell cycle related processes, classes
that contain functions that could be considered to be most
fundamental for the survival of the cell. The presence of
highly conserved phosphorylation events in these functional
categories suggests that the fine-tuning mechanisms pro-
vided by phosphorylation arose early in evolution. Although
based on these data we cannot exclude the possibility that this
over-representation is influenced by other factors (for exam-
ple, proteins with functions related to information storage
and processing being more likely to have homologs in all six
species studied), a link between conservation of phosphoryla-
tion events and protein function is in accordance with other
observation (for example, protein function and duplication
rate [19]).
Phosphorylation events identified in a single high-thoughput
experiments are known to cluster outside globular domains,
as meausured by PFAM [20]. Of the events we analyzed, 15%
are found inside a domain predicted using domain predic-
tions from the PFAM database [21]. When we only consider
conserved phosphorylation events, this shows a slight
increase to 17%. The similar percentage shows that the low
occurrence of phosphoryalation in known globular domains
holds true for evolutionarily conserved events, and hence is
not the result of the presence of spurious phosphorylations in
unconfirmed high-throughput data.
Discussion
Both the incomprehensive nature of high-throughput phos-
phoproteomics experiments as well as idiosyncrasies of the
experimental pipelines used by different laboratories compli-
Phosphorylation follows phylogenyFigure 2
Phosphorylation follows phylogeny. The distance measure used in the
construction of this neighbor-joining tree is (1 - relative overlap; described
in detail in the main text). If the tree is rooted at the branch marked with
the x, the topology of this tree is identical to the topology of the tree of
life of these six species. The tree was generated with Quicktree [32] and
visualized using Treeview [33].
fly
arabidopsis
yeast
zebrafish
m ouse
hum an
An additional dataset from flyFigure 3
An additional dataset from fly. (a) Overlap between the additional fly
dataset [13] and the original six datasets. (b) Neighbor-joining tree of the
relative overlap between these seven datasets.
arabidopsis
yeast
zebrafish
mouse
human
fly (Bodenmiller)
fly (Pinkse)
query \ target arabidopsis
fly
(Pinkse)
human mouse yeast zebrafish
9fly (Pinkse) X
fly
(Bodenmiller)
889 84 70 4 35
30fly (Bodenmiller) 971 X 344 375 26 141
(a)
(b)
Genome Biology 2008, Volume 9, Issue 10, Article R144 Boekhorst et al. R144.6
Genome Biology 2008, 9:R144
cate the comparison of high-throughput phosphoproteomics
datasets. In addition, the data we are comparing result from
experiments designed with different biological questions in
mind; the plant experiment, for example, focuses on the
phosphorylation of membrane associated proteins from cells
grown in culture [22], whereas the mouse experiment uses
protein extract from homogenized liver tissue [23]. All of
these differences will undoubtedly introduce dissimilarities
in the observed phosphoproteomes that do not reflect the
evolutionary changes in phosphorylation networks between
the different species, making the overlap that we found a min-
imal estimate. Randomization trials, functional bias in highly
conserved phosphorylation events, and the relative differ-
ences in overlap between the six high-throughput phospho-
proteomics datasets all suggest the overlap between these
datasets to be biologically relevant, and we successfully iden-
Functional classification of conserved phosphositesFigure 4
Functional classification of conserved phosphosites. (a) Main classes. The height of the bars represents the percentage of phosphosites with homologs in a
specific number of different species (indicated by the color of the bar) belonging to the different classes. The black arrows indicate groups with homologs
in a specific number of species that are significantly over-represented (arrows pointing up) or under-represented (arrows pointing down) compared with
all phosphorylation events in that functional category. Significance was determined using a Fisher's exact test; scores with a P value below 0.05 after
Bonferroni correction were considered significant. (b) Subclasses. The numbers in the cells are the fold increase of the fraction of phosphosites in that
subclass relative to the fraction in that subclass of phosphosites without homologs in other species (
2
log [sites in n species] -
2
log [sites in 1 species]).
Over-representation is presented in red, and under-representation in blue. Only classes with a total of 80 or more sites and with at least one site found in
a total of four species are shown. The black boxes indicate significant under-representation or over-representation (Fisher's exact test, P < 0.05 after
Bonferroni correction).
30
35
40
45
50
0
5
10
15
20
25
poorly
characterized
% of group
information storage
and processing
metabolism
1 species
2 species
3 species
4 species
cellular processes
and signalling
(a)
(b)
1234
RNA processing and modification
-0.32 0.51 0.96 1.27
Nuclear structure
-0.17 -0.62 1.15 2.07
Chromatin structure and dynamics
-0.23 0.55 1.19 -0.45
Cell cycle control, cell division, chromosome partitioning
-0.08 -0.08 0.37 1.05
Replication, recombination and repair
0.00 -0.45 0.69 0.57
Translation, ribosomal structure and biogenesis
0.00 -0.24 -0.01 0.36
Energy production and conversion
0.08 -0.56 -0.44 0.78
Cytoskeleton
0.02 -0.29 0.46 0.09
General function prediction only
0.05 -0.21 -0.53 0.15
Transcription
0.00 0.15 -0.95 0.64
Intracellular trafficking, secretion, and vesicular transport
0.04 0.09 -0.32 -0.87
Signal transduction mechanisms
0.06 -0.35 0.15 -0.97
Function unknown
0.02 0.19 -0.21 -1.28
Posttranslational modification, protein turnover, chaperones
-0.05 0.63 -1.00 -2.41
Inorganic ion transport and metabolism
0.23 -1.08 -1.87 -2.06
Genome Biology 2008, Volume 9, Issue 10, Article R144 Boekhorst et al. R144.7
Genome Biology 2008, 9:R144
tified the evolutionary signal in this overlap. We find a
number of phosphorylation events that are likely to predate
the evolutionary split between plants and animals. These sites
thus appear to be ancient in origin, which is perhaps surpris-
ing, given that phosphorylation is thought to be a subtle reg-
ulatory mechanism.
Our work suggests that our understanding of reversible phos-
phorylation can be increased by comparing the results of
high-throughput phosphoproteomics analysis with those
from large-scale in vitro phosphorylation assays (for example
[24,25]) or computationally predicted phosphoproteomes. In
the current setup (comparing different mass spectrometry
based high-throughput phosphoproteomics datasets), exper-
imental idiosyncrasies already loom large over any compari-
son; hence, we did not include such datasets in this study.
However, because we have now shown that the overlap is bio-
logically significant, this restraint can be relaxed; compara-
tive analysis in fact enables the use of the ever-increasing
amount of data on phosphorylation obtained by high-
throughput mass spectrometry experiments that were not
designed specifically for this particular purpose.
Previous studies have described the conservation across mul-
tiple species of amino acid residues that are known to be
phosphorylated in a specific organism [26] and have studied
the conservation of the phosphorylation events themselves on
a small scale (for example [27]). PhosphoBlast [4] provides a
powerful tool with which to compare (phosphorylated) pep-
tides, illustrated by the authors by comparing human and
mouse phosphopeptide datasets. These studies revealed a rel-
atively high conservation of amino acid residues that are
known to be phosphorylated in one or more phosphopro-
teomics experiments, and identified a substantial overlap
between the phosphoproteomes of different species. We
extend this observation to larger evolutionary distances and
show that the overlap is statistically, functionally, and evolu-
tionarily relevant. These insights can applied, for example, to
discriminating between noise and real phosphorylation
events in high-throughput mass spectrometry experiments
(analogous to the use of conserved gene order in the evalua-
tion of BLAST significance scores [28]).
Conclusion
The presence of functionally and evolutionarily significant
overlap between high-throughput phosphoproteomics exper-
iments allows the use of comparative phosphoproteomics in
the prediction and evaluation of phosphorylation networks,
similar to the established use of comparative genomics and
transcriptomics in the elucidation of protein functions and
biological networks. We expect the rapidly growing amount of
data from high-throughput mass spectrometry analysis to
make comparative phosphoproteomics a powerful tool in pre-
dicting, evaluating, and understanding reversible
phosphorylation.
Materials and methods
Datasets
Table 1 lists the datasets compared in this study. Because our
comparison of high-throughput datasets is already compli-
cated by many factors, ranging from the incomprehensive
nature of the data to differences in experimental procedures,
we made an effort to keep putative false-positive phosphor-
ylation sites from further confounding the analysis. We used
criteria for filtering the input data that in many cases are
more stringent than the criteria used in the original publica-
tions. Each dataset was preprocessed by removing all phos-
phopeptides with ambiguous sites (phosphogroups that could
not be attributed to a specific amino acid residue), by remov-
ing peptides that could not be retraced unambiguously to one
specific protein, and by applying a strict threshold on the pep-
tide identification scores. For the human, fly, Arabidopsis,
and zebrafish datasets we used a Mascot peptide score thresh-
old of 35; for the mouse dataset we used an Ascore threshold
of 19; and from the yeast dataset we took only phosphoryla-
tion sites with e-values of 1 × e
-04
or lower. For the additional
fly dataset we used an dCn threshold of 0.1 and a
PeptideProphet threshold of 0.9. Data handling was done
with ad hoc Python scripts.
Overlap
Homologous phosphosites were identified by doing an all-
against-all similarity search using the Paralign implementa-
tion of the Smith-Waterman algorithm [29] of all of the full-
length proteins for which one or more phosphopeptides were
present in the datasets, followed by the identification of high-
scoring segment pairs with an e-value of 1 × e
-10
or lower in
which both the query and the target had the same type of
phosphosites at exactly the same position in the alignment (a
phosphorylated serine residue should be aligned with a phos-
phorylated serine residue). Because this procedure does not
include any (reciprocal) best hit criteria, all we conclude is
that similar sites are homologous; the exact nature of this
relationship (orthologous, paralogous) remains unclear. We
used a strict e-value threshold of 1 × e
-10
for the identification
of homologous sequences. The use of a more liberal threshold
would increase the overlap (we are now probably missing
some homologous phosphorylation events because we did not
consider the surrounding sequence to be sufficiently con-
served) but would also introduce more noise into an already
noisy dataset. In addition, a strict cutoff means that we do not
erroneously assume convergently evolved small linear motifs
to be homologous (motifs involved in recognition of phos-
phosites by their kinases tend to be extremely short [30]).
Expected overlap between datasets assuming
independence
The probability that a phosphorylation event in a query data-
set is conserved in a target dataset is given by Equation 1.
P(q O
Q, T
) = N
Q, T
/N
Q
(1)
Genome Biology 2008, Volume 9, Issue 10, Article R144 Boekhorst et al. R144.8
Genome Biology 2008, 9:R144
Where Q is the query dataset, q is a phosphorylation event in
Q, T is the target dataset, means 'element of', means 'not
an element of', O
Q, T
is the overlap of Q and T (events from Q
with a homologous event in T), N
Q, T
is the number of events
in O
Q, T
, and N
Q
is the total number of events in Q.
The probability that q has homologs in x of the target datasets
is the sum of all possible combinations of presence and
absence in all of the target datasets, given x. As an example,
we consider target datasets A, B, and C. The probability P that
q has homologs in two out of these three datasets is given by
Equation 2.
P(q|x = 2) = P(q O
Q, A
ʝ q O
Q, B
ʝ q O
Q, C
)+ P(q O
Q, A
ʝ q O
Q, B
ʝ q O
Q, C
) + P(q O
Q, A
ʝ q O
Q, B
ʝ q O
Q, C
)
(2)
Where P(q|x = 2) is the probability that q has homologs in two
target datasets, and ʝ is the 'and' operator.
The expected number of phosphorylation events from a query
dataset with homologs in x target datasets is now given by
Equation 3.
E (x = i) = P(q|x = i).N
Q
(3)
In which E is the expected value, and i is a number lower than
the total number of datasets.
Relative overlap
Relative overlap was calculated by dividing the number of
conserved phosphorylation events of the query and target
datasets by the number of sites in the query dataset with one
or more homologous positions in the target dataset. We iden-
tified homologous positions using the results of the all-
against-all similarity search described above; a site has a
homologous position in a target dataset when the site is part
of one or more high-scoring segment pairs in that dataset,
irrespective of the specific residue type the site is aligned
with.
Domains
We identified known domains in the full-length sequence of
all proteins with one or more phosphorylation events.
Domains were identified with HMMER [31], using models
provided by version 23 of the PFAM database [21]. The loca-
tion of phosphorylation events relative to these domains was
determined using python scripts.
Authors' contributions
BS, AH, and JB conceived the study. BS, AH, and BvB partic-
ipated in its design and coordination, and contributed to
manuscript preparation. JB performed the analysis and
drafted the manuscript. All authors read and approved the
final manuscript.
Additional data files
The following additional data are available with the online
version of this paper. Additional data file 1 provides the
number of conserved phosphosites per query phosphosite
with one more homologous sites in the target dataset.
Additional data file 1Number of conserved phosphosites per query phosphositeProvided is the number of conserved phosphosites per query phos-phosite with one more homologous sites in the target dataset.Click here for file
Acknowledgements
This work was supported by BioRange project SP 2.3.1 of the Netherlands
Bioinformatics Centre (NBIC) and by the Netherlands Proteomics Centre.
We thank S Mohammed, M Pinkse, and S Lemeer for their phosphorylation
data and valuable comments.
References
1. Cohen P: The regulation of protein function by multisite
phosphorylation a 25 year update. Trends Biochem Sci 2000,
25:596-601.
2. Pawson T, Nash P: Protein-protein interactions define specifi-
city in signal transduction. Genes Dev 2000, 14:1027-1047.
3. de Lichtenberg U, Jensen LJ, Brunak S, Bork P: Dynamic complex
formation during the yeast cell cycle. Science 2005,
307:724-727.
4. Wang Y, Klemke RL: PhosphoBlast, a computational tool for
comparing phosphoprotein signatures among large
datasets. Mol Cell Proteomics 2008, 7:145-162.
5. Wilson-Grady JT, Villen J, Gygi SP: Phosphoproteome analysis of
fission yeast. J Proteome Res 2008, 7:1088-1097.
6. Dandekar T, Snel B, Huynen M, Bork P: Conservation of gene
order: a fingerprint of proteins that physically interact.
Trends Biochem Sci 1998, 23:324-328.
7. Huynen M, Snel B, Lathe W III, Bork P: Predicting protein func-
tion by genomic context: quantitative evaluation and quali-
tative inferences. Genome Res 2000, 10:1204-1210.
8. Overbeek R, Fonstein M, D'Souza M, Pusch GD, Maltsev N: The use
of gene clusters to infer functional coupling. Proc Natl Acad Sci
USA 1999, 96:2896-2901.
9. van Noort V, Snel B, Huynen MA: Predicting gene function by
conserved co-expression. Trends Genet 2003, 19:238-242.
10. Stuart JM, Segal E, Koller D, Kim SK: A gene-coexpression
network for global discovery of conserved genetic modules.
Science 2003, 302:249-255.
11. Lemeer S, Pinkse MW, Mohammed S, van Breukelen B, den Hertog J,
Slijper M, Heck AJ: Online automated in vivo zebrafish phos-
phoproteomics: from large-scale analysis down to a single
embryo. J Proteome Res 2008, 7:
1555-1564.
12. Butterfield NJ: Bangiomorpha pubescens n. gen., n. sp.: impli-
cations for the evolution of sex, multicellularity, and the
Mesoproterozoic/Neoproterozoic radiation of eukaryotes.
Paleobiology 2000, 26:386-404.
13. Bodenmiller B, Malmstrom J, Gerrits B, Campbell D, Lam H, Schmidt
A, Rinner O, Mueller LN, Shannon PT, Pedrioli PG, Panse C, Lee HK,
Schlapbach R, Aebersold R: PhosphoPep: a phosphoproteome
resource for systems biology research in Drosophila Kc167
cells. Mol Syst Biol 2007, 3:139.
14. Pinkse MW, Mohammed S, Gouw JW, van Breukelen B, Vos HR, Heck
AJ: Highly robust, automated, and sensitive online TiO2-
based phosphoproteomics applied to study endogenous
phosphorylation in Drosophila melanogaster. J Proteome Res
2008, 7:687-697.
15. Diella F, Cameron S, Gemund C, Linding R, Via A, Kuster B, Sicheritz-
Ponten T, Blom N, Gibson TJ: Phospho.ELM: a database of
experimentally verified phosphorylation sites in eukaryotic
proteins. BMC Bioinformatics 2004, 5:79.
16. Gnad F, Ren S, Cox J, Olsen JV, Macek B, Oroshi M, Mann M: PHOS-
IDA (phosphorylation site database): management, struc-
tural and evolutionary investigation, and prediction of
phosphosites. Genome Biol 2007, 8:R250.
17. Sharan R, Suthram S, Kelley RM, Kuhn T, McCuine S, Uetz P, Sittler
T, Karp RM, Ideker T: Conserved patterns of protein interac-
tion in multiple species. Proc Natl Acad Sci USA 2005,
102:1974-1979.
18. Tatusov RL, Fedorova ND, Jackson JD, Jacobs AR, Kiryutin B, Koonin
Genome Biology 2008, Volume 9, Issue 10, Article R144 Boekhorst et al. R144.9
Genome Biology 2008, 9:R144
EV, Krylov DM, Mazumder R, Mekhedov SL, Nikolskaya AN, Rao BS,
Smirnov S, Sverdlov AV, Vasudevan S, Wolf YI, Yin JJ, Natale DA: The
COG database: an updated version includes eukaryotes.
BMC Bioinformatics 2003, 4:41.
19. Wapinski I, Pfeffer A, Friedman N, Regev A: Natural history and
evolutionary principles of gene duplication in fungi. Nature
2007, 449:54-61.
20. Nuhse TS, Stensballe A, Jensen ON, Peck SC: Phosphoproteomics
of the Arabidopsis plasma membrane and a new phosphor-
ylation site database. Plant Cell 2004, 16:2394-2405.
21. Finn RD, Tate J, Mistry J, Coggill PC, Sammut SJ, Hotz HR, Ceric G,
Forslund K, Eddy SR, Sonnhammer EL, Bateman A: The Pfam pro-
tein families database. Nucleic Acids Res 2008, 36:D281-D288.
22. Benschop JJ, Mohammed S, O'Flaherty M, Heck AJ, Slijper M, Menke
FL: Quantitative phosphoproteomics of early elicitor signal-
ing in Arabidopsis. Mol Cell Proteomics 2007, 6:1198-1214.
23. Villen J, Beausoleil SA, Gerber SA, Gygi SP: Large-scale phosphor-
ylation analysis of mouse liver. Proc Natl Acad Sci USA 2007,
104:1488-1493.
24. Diks SH, Parikh K, Sijde M van der, Joore J, Ritsema T, Peppelenbosch
MP: Evidence for a minimal eukaryotic phosphoproteome?
PLoS ONE 2007, 2:e777.
25. Ptacek J, Devgan G, Michaud G, Zhu H, Zhu X, Fasolo J, Guo H, Jona
G, Breitkreutz A, Sopko R, McCartney RR, Schmidt MC, Rachidi N,
Lee SJ, Mah AS, Meng L, Stark MJ, Stern DF, De Virgilio C, Tyers M,
Andrews B, Gerstein M, Schweitzer B, Predki PF, Snyder M: Global
analysis of protein phosphorylation in yeast. Nature 2005,
438:679-684.
26. Malik R, Nigg EA, Korner R: Comparative conservation analysis
of the human mitotic phosphoproteome. Bioinformatics 2008,
24:1426-1432.
27. Macek B, Gnad F, Soufi B, Kumar C, Olsen JV, Mijakovic I, Mann M:
Phosphoproteome analysis of E. coli reveals evolutionary
conservation of bacterial Ser/Thr/Tyr phosphorylation.
Mol
Cell Proteomics 2008, 7:299-307.
28. Boekhorst J, Snel B: Identification of homologs in insignificant
blast hits by exploiting extrinsic gene properties. BMC
Bioinformatics 2007, 8:356.
29. Rognes T, Seeberg E: Six-fold speed-up of Smith-Waterman
sequence database searches using parallel processing on
common microprocessors. Bioinformatics 2000, 16:699-706.
30. Amanchy R, Periaswamy B, Mathivanan S, Reddy R, Tattikota SG, Pan-
dey A: A curated compendium of phosphorylation motifs. Nat
Biotechnol 2007, 25:285-286.
31. Eddy SR: Profile hidden Markov models. Bioinformatics 1998,
14:755-763.
32. Howe K, Bateman A, Durbin R: QuickTree: building huge neigh-
bour-joining trees of protein sequences. Bioinformatics 2002,
18:1546-1547.
33. Page RD: TreeView: an application to display phylogenetic
trees on personal computers. Comput Appl Biosci 1996,
12:357-358.
34. Olsen JV, Blagoev B, Gnad F, Macek B, Kumar C, Mortensen P, Mann
M: Global, in vivo, and site-specific phosphorylation dynamics
in signaling networks. Cell 2006, 127:635-648.
35. Chi A, Huttenhower C, Geer LY, Coon JJ, Syka JE, Bai DL, Shabanow-
itz J, Burke DJ, Troyanskaya OG, Hunt DF: Analysis of phosphor-
ylation sites on proteins from Saccharomyces cerevisiae by
electron transfer dissociation (ETD) mass spectrometry.
Proc Natl Acad Sci USA 2007, 104:2193-2198.