Báo cáo y học: "IA simple, fast, and accurate method of phylogenomic inference" docx
Bạn đang xem bản rút gọn của tài liệu. Xem và tải ngay bản đầy đủ của tài liệu tại đây (496.61 KB, 11 trang )
Genome Biology 2008, 9:R151
Open Access
2008Wu and EisenVolume 9, Issue 10, Article R151
Method
A simple, fast, and accurate method of phylogenomic inference
Martin Wu
*
and Jonathan A Eisen
*†‡
Addresses:
*
Genome Center, University of California, One Shields Avenue, Davis, CA 95616, USA.
†
Section of Evolution and Ecology, College of
Biological Sciences, University of California, One Shields Avenue, Davis, CA 95616, USA.
‡
Department of Medical Microbiology and
Immunology, School of Medicine, University of California, One Shields Avenue, Davis, CA 95616, USA.
Correspondence: Martin Wu. Email:
© 2008 Wu and Eisen; licensee BioMed Central Ltd.
This is an open access article distributed under the terms of the Creative Commons Attribution License ( which
permits unrestricted use, distribution, and reproduction in any medium, provided the original work is properly cited.
AMPHORA for phylogenomic analysis<p>An automated pipeline for phylogenomic analysis (AMPHORA) is presented that overcomes existing limits to large-scale protein phy-logenetic inference.</p>
Abstract
The explosive growth of genomic data provides an opportunity to make increased use of protein
markers for phylogenetic inference. We have developed an automated pipeline for phylogenomic
analysis (AMPHORA) that overcomes the existing bottlenecks limiting large-scale protein
phylogenetic inference. We demonstrated its high throughput capabilities and high quality results
by constructing a genome tree of 578 bacterial species and by assigning phylotypes to 18,607
protein markers identified in metagenomic data collected from the Sargasso Sea.
Background
Since the 1970s the use of small subunit (SSU) rRNA (SSU
rRNA) sequences has revolutionized microbial classification,
systematics, and ecology. The SSU rRNA gene has become the
most sequenced gene, with hundreds of thousands of its
sequences now deposited in public databases. It has become
the current 'gold standard' in microbial diversity studies, and
for good reasons. For one, it is present in all microbial organ-
isms. For another, the gene sequence is highly conserved at
both ends. This enables one to obtain nearly full-length SSU
rRNA gene sequences by polymerase chain reaction amplifi-
cation using 'universal' primers and without having to isolate
and culture the organism in question. Until very recently, the
vast majority of microbes were identified and classified only
by recovering and sequencing their SSU rRNA genes. This
single sequence of approximately 1.5 kilobases is often the
only information we have about the organism from which it
came - the only way we know that it exists in the natural
environment.
Although the SSU rRNA gene has been extremely valuable for
phylogenetic studies, it has its limitations. For example, it has
been well documented that evolutionarily distant SSU rRNA
genes that are similar in nucleotide composition have been
consistently - but nevertheless incorrectly - placed close
together in phylogenetic trees [1,2,1]. Furthermore, inferring
the phylogeny of organisms from any single gene carries some
risks and must be corroborated by the use of other phyloge-
netic markers. Many researchers turned to protein encoding
genes such as EF-Tu, rpoB, recA, and HSP70 [3]. Because
protein sequences are conserved at the amino acid level
instead of at the nucleotide level, phylogenetic analyses of
protein sequences are in general less prone to the nucleotide
compositional bias seen in SSU rRNA [2,4-6]. In addition, the
less constrained variation at the third codon position allows
these genes to be used in studies of more closely related
organisms. However, because of difficulties in cloning protein
encoding genes from diverse species, SSU rRNA remained the
gold standard.
The situation changed with the advent of genomic sequenc-
ing. Each complete genome sequence brings with it the
sequences for all protein encoding genes in that organism.
Now, not only can one build gene trees based on a favorite
Published: 13 October 2008
Genome Biology 2008, 9:R151 (doi:10.1186/gb-2008-9-10-r151)
Received: 12 August 2008
Revised: 26 September 2008
Accepted: 13 October 2008
The electronic version of this article is the complete one and can be
found online at /> Genome Biology 2008, Volume 9, Issue 10, Article R151 Wu and Eisen R151.2
Genome Biology 2008, 9:R151
protein encoding gene, but also one has the option to concate-
nate multiple gene sequences to construct trees on the
'genome level'. Possessing more phylogenetic signals, such
'genome trees' or 'super-matrix trees' are less susceptible to
the stochastic errors than those built from a single gene [7].
Recent studies attempting to reconstruct the tree of life have
demonstrated the power of this approach [8,9] (for review
[10]). Likewise, genome trees have also been used success-
fully to reassess the phylogenetic positions of individual spe-
cies [11,12]. It is worth pointing out, however, that the
genome trees are still susceptible to systematic errors caused
by compositional biases, unrealistic evolutionary models, and
inadequate taxonomic sampling [7,13,14].
Despite its demonstrated usefulness, phylogenetic inference
based on protein markers has been limited in application,
mainly because of the formidable technical difficulties inher-
ent in this approach. Typically, molecular phylogenetic infer-
ence involves three steps: retrieval of homologous sequences,
creation of multiple sequence alignments, and phylogenetic
tree construction. Because only characters of common ances-
try can be used to infer the evolutionary history, the most crit-
ical step is sequence alignment, in which sequences are
overlaid horizontally on each other in such a way that, ideally,
each column in the alignment would only contain homolo-
gous characters (amino acids or nucleotides). To ensure this
positional homology, the alignments must be curated - a
process that evaluates the probable homology of each column
or position in the alignments.
Positions for which the assignment of homology is uncertain
are then excluded from further analysis by masking [15].
Judicious masking increases the signal-to-noise ratio and
often improves the discriminatory power of the phylogenetic
methods [16]. Unfortunately, curation requires skilled man-
ual intervention, thus making it impractical to process suita-
bly the massive amount of genome sequence data now
available. Frequently, masking is simply ignored. Automated
masking to remove alignment positions that contain gaps or
that have a low degree of conservation has not been satisfac-
tory. For example, using these criteria and given a set of ad
hoc parameters such as the minimum block length,
GBLOCKS automatically selects conserved blocks from mul-
tiple sequence alignments for phylogenetic analysis. How-
ever, trees constructed using GBLOCKS-treated alignments
have been found to have dramatically weaker support, possi-
bly because of excessive removal of informative sites by the
program [17]. In addition, although many programs are avail-
able to automate the creation of multiple sequence align-
ments, their use for the de novo alignment of a large protein
family is still fairly time consuming.
To overcome these problems, we have developed an auto-
mated pipeline for building concatenated genome trees using
multiple protein markers, thus making this powerful method
applicable on a larger scale. Our pipeline can rapidly and
accurately generate highly reproducible multiple sequence
alignments for a set of selected phylogenetic markers. More
importantly, unlike previous automated methods [9] it can
mask the alignments with quality equivalent to that of cura-
tion by humans.
The same pipeline can also be applied to metagenomic data
analyses. In metagenomics or environmental genomics, nat-
ural populations of microbes are collected from the environ-
ment; their DNAs are cloned and directly sequenced. One
fundamental goal of metagenomics is to determine who is
present in the community and what they are doing. Phyloge-
netic analysis of markers present in these collected samples
can be very informative in revealing who is there. If the
marker happens to be part of a larger assembled sequence
fragment, then the entire fragment can be anchored by that
marker to a specific taxonomic clade. In this way, environ-
mental shotgun sequences can be sorted into taxon-specific
'bins' in silico, thereby allowing us to determine who is doing
what.
The most striking finding to date from this approach was the
discovery of a proteorhodopsin gene in bacteria, a homolog of
the bacteriorhodopsin gene previously found only in some
archaea. In this case, the gene could be anchored within the
bacteria because it was found to be associated with a bacterial
SSU rRNA gene [18]. However, because the SSU rRNA gene
constitutes only a tiny fraction of any genome, the probability
that any given sequence fragment can be anchored to a spe-
cific taxonomic clade by using this one gene is small. Thus,
phylotyping of metagenomic data can greatly benefit from the
use of alternative phylogenetic markers such as the multiple
protein markers described below.
In this paper, we introduce AMPHORA (a pipeline for Auto-
Mated PHylogenOmic infeRence) and demonstrate two sig-
nificant applications: building a genome tree from 578
complete bacterial genomes that are available at the time of
the study and identifying bacterial phylotypes from metagen-
omic data collected from the Sargasso Sea.
Results and discussion
The AMPHORA pipeline
Introduction
With the rapid increase in available genomic sequence data,
there is an ever-urgent need for automated phylogenetic anal-
yses using protein sequences. However, automation is fre-
quently accompanied by reduced quality. We introduce here
a fully automated method that is not only fast but also is of
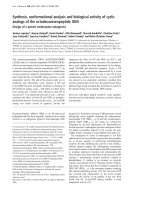
high quality. The main components of our approach are
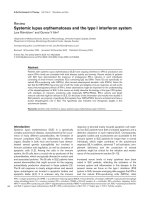
shown in Figure 1, and their implementation is described in
detail in the Material and methods section (below). Designed
to align and trim protein sequences rapidly, reliably, and
reproducibly, AMPHORA eliminates one of the tightest bot-
tlenecks in large-scale protein phylogenetic inference. It can
Genome Biology 2008, Volume 9, Issue 10, Article R151 Wu and Eisen R151.3
Genome Biology 2008, 9:R151
be used for phylogenetic analyses of single genes or whole
genomes.
Protein phylogenetic marker database
The core of AMPHORA is a protein phylogenetic marker
database that contains curated protein sequence alignments
with trimming masks and corresponding profile hidden
Markov models (HMMs). Thirty-one protein encoding
A flowchart illustrating the major components of AMPHORAFigure 1
A flowchart illustrating the major components of AMPHORA. The marker protein sequences from representative genomes are retrieved, aligned, and
masked. Profile hidden Markov models (HMMs) are then built from those 'seed' alignments. New sequences of interest are rapidly and accurately aligned
to the trusted seed alignments through HMMs. Predefined masks embedded within the 'seed' alignment are then applied to trim off regions of ambiguity
before phylogenetic inference. Alignment columns marked with '1' or '0' were included or excluded, respectively, during further phylogenetic analysis.
i
i
seed 1
seed 2
seed 3
seed 4
seed 5
mask
1111111111100000000000011111111111111
VKVNLDWIESE
VKVNLDWVESE
AKVSIRWVDAE
ARVKLAFIDST
CRVVLTYLDSE
IFEKED PAPFLEHVNGILVPGGFG
TFEGDEGAAAARLENAHAIMVPGGFG
NVHDEE AESLLGGVDGILVPGGFG
KLE-EG DLSDLDKVDAILVPGGFG
RIESEG IGSSFDDIDAILVPGGFG
i
i
Marker
multiple
sequence
alignment
HMM model
Query
sequences
Align and mask
query 2
query 3
query 4
TRVNIKWIDSELYDVDSLLIPGGFG
MKVDIEWIDSEFNEVSGILVAGGFG
TKVELKWVDSEFKDVSGILVAGGFG
TRVDIHWVDSELGDCDSVLVAGGFG
query 1
query 2
mask 1111111111100000000000000011111111111111
query 3
query 4
TRVNIKWIDSE ILVDN LALLYDVDSLLIPGGFG
MKVDIEWIDSEDLEKADDEK LDEIFNEVSGILVAGGFG
TKVELKWVDSE KLENME SSEVFKDVSGILVAGGFG
VKVNLDWIESE IFEKED PAPFLEHVNGILVPGGFG
VKVNLDWVESE TFEGDEGAAAARLENAHAIMVPGGFG
AKVSIRWVDAE NVHDEE AESLLGGVDGILVPGGFG
ARVKLAFIDST KLE-EG DLSDLDKVDAILVPGGFG
CRVVLTYLDSE RIESEG IGSSFDDIDAILVPGGFG
TRVDIHWVDSE KIEERG AEALLGDCDSVLVAGGFG
seed 1
seed 2
seed 3
seed 4
seed 5
query 1
Trim
Tree inference
Phylogenetic Marker Database
Steps in building a
Phylogenetic
Marker Database
S
St
eps
i
in
b
b
i
ui
ld
ld
i
in
ga
Select markers
Search against
representative
genomes
Multiple sequence
alignment
HMM
Build masks
Genome Biology 2008, Volume 9, Issue 10, Article R151 Wu and Eisen R151.4
Genome Biology 2008, 9:R151
phylogenetic marker genes (dnaG, frr, infC, nusA, pgk, pyrG,
rplA, rplB, rplC, rplD, rplE, rplF, rplK, rplL, rplM, rplN,
rplP, rplS, rplT, rpmA, rpoB, rpsB, rpsC, rpsE, rpsI, rpsJ,
rpsK, rpsM, rpsS, smpB, and tsf) from representatives of
complete bacterial genomes were individually aligned using
CLUSTALW. The alignments were curated and trimming
masks were added manually by visually inspecting the align-
ments. We selected these proteins because they are univer-
sally distributed in bacteria; the vast majority of them exist as
single copy genes within each genome; and they are house-
keeping genes that are involved in information processing
(replication, transcription, and translation) or central metab-
olism, and thus are thought to be relatively recalcitrant to lat-
eral gene transfer [19].
High quality and highly reproducible sequence alignments
Molecular phylogenetic inference assumes common ancestry,
or homology, for every single column of a multiple sequence
alignment. When this assumption is violated, phylogenetic
signal can be obscured by noise. It has been shown that align-
ment quality can have greater impact on the final tree than
does the tree building method employed [20]. Therefore, pre-
paring high quality sequence alignments is a most critical part
of any molecular phylogenetic analysis. This preparation typ-
ically involves careful but tedious manual editing and trim-
ming of the generated alignments, and thus remains the
greatest challenge to automation. When scaling up this proc-
ess, the trimming step is often simply ignored. Automated
trimming based on the number of gaps in each column or
each column's conservation score can be used to select con-
served blocks, but this still is not satisfactory when a high
quality tree is required [17].
We overcame this problem by taking advantage of a unique
feature of profile HMM-based multiple sequence alignments.
When using HMMs to align sequences, new sequences can be
mapped back, residue by residue, onto the 'seed' alignment
from which that HMM originated. When the seed alignment
includes an accurate human curated mask, the newly gener-
ated alignments can be automatically trimmed accordingly,
thus producing high quality alignments without requiring
further human intervention. In addition, the HMM model is
the only variable in this automated alignment and trimming.
When the same model is used, the alignments generated
thereby are completely additive and reproducible, thus ena-
bling meaningful comparison of the results from different
phylogenetic studies or different researchers.
Speed
Another big advantage of using an HMM-based approach is
speed. For example, AMPHORA needs only 0.5 minutes on
an average desktop computer (Intel Pentium CPU 3.2 GHz) to
align 340 sequences of the rpoB family. In comparison, the
same job takes de novo pair-wise alignment methods such as
CLUSTALW and MUSCLE 120 and 12 minutes, respectively.
This is because our HMM-based method aligns sequences by
comparing them only once each to the HMM model. As a
result, the computational cost increases linearly with the
number of sequences to be aligned. In contrast, the computa-
tional cost of a pair-wise alignment approach increases poly-
nomially and can soon become prohibitively expensive.
Application I: Bacterial genome trees
Constructing a 'genome' tree
We downloaded 578 complete bacterial genomes available at
the time of our study from the National Center for Biotechnol-
ogy Information (NCBI) RefSeq collections (Additional data
file 1). Protein marker sequences for 31 proteins were
retrieved, aligned, trimmed, and concatenated as described in
the Materials and methods section (see below). This resulted
in a mega-alignment of 5,591 good amino acid positions (col-
umns) by 578 species (rows). A maximum likelihood genome
tree was constructed from this mega-alignment (Additional
data file 2). A bootstrapped maximum likelihood genome tree
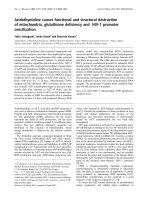
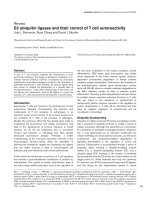
of 310 representatives is shown in Figure 2.
As with trees built from SSU rRNA data, all of the major bac-
terial phyla are well separated into their own monophyletic
groups, even though the relationships among some of them
remain unclear. Strikingly, unlike the SSU rRNA tree, the
bushy area (intermediate levels) of our tree is highly resolved.
In the γ-proteobacteria, for example, the nodes separating
taxa into different orders, families, and genera receive gener-
ally excellent bootstrapping support, whereas uncertainty is
high in the corresponding regions of the SSU rRNA tree
(Additional data file 3). Highly robust organismal phyloge-
nies of γ-proteobacteria and α-proteobacteria have been
inferred previously using hundreds of commonly shared
genes [21,22] and are congruent to our genome tree. This
reflects the much-reduced stochastic noise present in the con-
catenated protein sequences compared with that of a single,
slowly evolving SSU rRNA gene. This uncertainty in the SSU
rRNA tree - the backbone of modern microbial systematics -
often prevents microbial taxonomists from placing new spe-
cies or genera within higher taxa, particularly at these inter-
mediate levels [23]. When such assignments were
nevertheless made for these problematic taxa, inconsistency
was introduced into the taxonomic nomenclature. For exam-
ple, taxa assigned to the orders Alteromondales, Pseudomon-
adales, and Oceanospirillales in Bergey's Taxonomic Outline
of Prokaryotes [23] are intermingled and paraphyletic in our
genome tree. It is our view that the taxonomy needs to be
revisited and possibly revised in such cases.
Genome-based microbial taxonomy
Although use of SSU rRNA was a landmark advancement in
molecular microbial systematics, genome sequences provide
an important alternative and complement [11,12]. Phyloge-
netic trees built from multiple genes are more robust in
resolving taxonomic relationships below the phylum level
and hence provide an excellent alternative phylogenetic
framework for microbial systematics. Until many more
Genome Biology 2008, Volume 9, Issue 10, Article R151 Wu and Eisen R151.5
Genome Biology 2008, 9:R151
genomes have been sequenced, however, a hybrid approach
may be most fruitful. A genome tree built from sequenced
genomes can be used as a scaffold; species for which we lack
full genome sequences can be placed by comparing their SSU
rRNA sequences with those of sequenced species.
An unrooted maximum likelihood bacterial genome treeFigure 2
An unrooted maximum likelihood bacterial genome tree. The tree was constructed from concatenated protein sequence alignments derived from 31
housekeeping genes. All major phyla are separated into their monophyletic groups and are highlighted by color. The branches with bootstrap support of
over 80 (out of 100 replicates) are indicated with black dots. Although the relationships among the phyla are not strongly supported, those below the
phylum level show very respectable support. The radial tree was generated using iTOL [42].
Thermus thermophilus HB8
D
einococcus geotherm
alis D
SM
11300
Deinococcus radiodurans R1
Petrotoga mobilis SJ95
Thermotoga maritima MSB8
Thermotoga lettingae TMO
Thermosipho melanesiensis BI429
Fervidobacterium nodosum Rt17 B1
Aquifex aeolicus VF5
Rubrobacter xylanophilus DSM 9941
Tropheryma whipplei TW08 27
B
ifidobacterium
adolescentis A
TC
C 15703
N ocardioides sp JS
614
Propionibacterium acnes KPA171202
Kineococcus radiotolerans SRS30216
Renibacterium salmoninarum ATCC 33209
Arthrobacter aurescens TC1
Arthrobacter sp FB24
Clavibacter m
ichiganensis
Leifsonia xyli subsp xyli str C
TCB
07
Streptomyces avermitilis MA 4680
Acidothermus cellulolyticus 11B
Thermobifida fusca YX
Frankia sp EAN1pec
Frankia alni ACN14a
Frankia sp CcI3
Salinispora tropica CNB 440
Salinispora arenicola CNS 205
Saccharopolyspora erythraea NRRL 2338
Rhodococcus sp RHA1
Nocardia farcinica IFM 10152
Mycobacterium smegmatis str MC2 155
Mycobacterium avium subsp paratuberculosis K 10
C
orynebacterium
jeikeium
K411
Corynebacterium diphtheriae NCTC 13129
Corynebacterium
efficiens YS 314
Herpetosiphon aurantiacus ATCC 23779
Roseiflexus castenholzii DSM 13941
Chloroflexus aurantiacus J 10 fl
Dehalococcoides sp CBDB1
G
loeobacter violaceus P
CC 7421
Synechococcus sp JA 2 3B a 2 13
Thermosynechococcus elongatus BP 1
Acaryochloris marina MBIC11017
Anabaena variabilis ATCC 29413
Nostoc sp PCC 7120
Trichodesmium erythraeum IMS101
Microcystis aeruginosa NIES 843
Synechocystis sp PCC 6803
Synechococcus elongatus PCC 6301
Prochlorococcus marinus str MIT 9515
Prochlorococcus marinus subsp pastoris str CCMP1986
Prochlorococcus marinus str MIT 9211
Prochlorococcus marinus subsp m
arinus str CCM
P1375
Prochlorococcus marinus str NATL1A
Synechococcus sp WH 7803
Synechococcus sp CC9311
Synechococcus sp CC9605
Synechococcus sp WH 8102
Synechococcus sp CC9902
Prochlorococcus marinus str MIT 9303
Prochlorococcus marinus str MIT 9313
Synechococcus sp RCC307
Carboxydothermus hydrogenoformans Z 2901
Pelotomaculum thermopropionicum SI
Desulfotomaculum reducens MI 1
Moorella thermoacetica ATCC 39073
Desulfitobacterium hafniense Y51
S
ym
biobacteriu
m
therm
ophilum
IA
M
14863
Syntrophomonas wolfei subsp wolfei str Goettingen
Thermoanaerobacter sp X514
Thermoanaerobacter tengcongensis MB4
Caldicellulosiruptor saccharolyticus DSM 8903
Clostridium thermocellum ATCC 27405
Clostridium perfringens SM101
C lostridium
beijerinckii N
C
IM
B
8052
Clostridium
novyi NT
Clostridium acetobutylicum ATCC 824
Clostridium tetani E88
Clostridium botulinum A str ATCC 19397
Clostridium kluyveri DSM 555
Clostridium difficile 630
Alkaliphilus oremlandii OhILAs
Alkaliphilus metalliredigens QYMF
Clostridium
phytofermentans ISDg
Fusobacterium nucleatum subsp nucleatum ATCC 25586
Geobacillus kaustophilus HTA426
Bacillus subtilis subsp subtilis str 168
Bacillus weihenstephanensis KBAB4
Bacillus halodurans C 125
Bacillus clausii KSM K16
O ceanobacillus iheyensis H
TE
831
Staphylococcus aureus subsp aureus USA300
Liste
ria inn
ocua
Clip112
62
Enterococcus faecalis V583
Streptococcus gordonii str Challis substr CH1
Lactococcus lactis subsp lactis Il1403
Lactobacillus sakei subsp sakei 23K
Lactobacillus casei ATCC 334
Lactobacillus delbrueckii ATCC BAA 365
Lactobacillus helveticus DPC 4571
Lactobacillus johnsonii NCC 533
Lactobacillus salivarius subsp salivarius UCC118
Lactobacillus plantarum WCFS1
Lactobacillus brevis ATCC 367
Pediococcus pentosaceus ATCC 25745
Lactobacillus reuteri F275
Leuconostoc mesenteroides ATCC 8293
O
enococcus oeni P
SU 1
Acholeplasma laidlawii PG 8A
Aster yellows witches broom phytoplasma AYWB
Mesoplasma florum L1
M
ycoplasm
a capricolum
subsp capricolu
m
A
TC
C 27343
Mycoplasma hyopneumoniae 7448
Mycoplasma mobile 163K
Mycoplasma pulmonis UAB CTIP
M ycoplasm
a synoviae 53
M ycoplasm
a agalactiae PG
2
Mycoplasma penetrans HF 2
Ureaplasma parvum serovar 3 str ATCC 700970
Mycoplasma gallisepticum R
Mycoplasma pneumoniae M129
Mycoplasma genitalium G37
Rhodopirellula baltica SH 1
Candidatus Protochlamydia amoebophila UWE25
Chlamydia trachomatis A HAR 13
Chlamydophila abortus S26 3
Chlamydophila pneumoniae J138
Leptospira borgpetersenii JB197
Borrelia garinii PBi
Treponema denticola ATCC 35405
Treponema pallidum subsp pallidum str Nichols
Chlorobium tepidum TLS
Chlorobium phaeobacteroides DSM 266
Pelodictyon luteolum DSM 273
Prosthecochloris vibrioformis DSM 265
Chlorobium chlorochromatii CaD3
Salinibacter ruber DSM 13855
Cytophaga hutchinsonii ATCC 33406
Bacteroides fragilis NCTC 9343
Parabacteroides distasonis ATCC 8503
Porphyromonas gingivalis W83
Gramella forsetii KT0803
Flavobacterium johnsoniae UW101
Flavobacterium psychrophilum JIP02 86
C
andidatus S
ulcia m
uelleri G
W
S
S
Acidobacteria bacterium Ellin345
Solibacter usitatus Ellin6076
Anaeromyxobacter dehalogenans 2CP C
Anaeromyxobacter sp Fw109 5
Myxococcus xanthus DK 1622
Sorangium cellulosum So ce 56
Bdellovibrio bacteriovorus HD100
P
elob
acte
r carbinolicu
s D
SM
2
380
Geobacter uraniireducens Rf4
Geobacter metallireducens GS 15
G eobacter sulfurreducens PCA
Pelobacter propionicus DSM 2379
Syntrophus aciditrophicus SB
Syntrophobacter fumaroxidans MPOB
Desulfococcus oleovorans Hxd3
Desulfotalea psychrophila LSv54
Lawsonia intracellularis PHE MN1 00
Desulfovibrio vulgaris subsp vulgaris str Hildenborough
Desulfovibrio vulgaris subsp vulgaris DP4
Desulfovibrio desulfuricans G20
N
itratiruptor sp SB
155 2
Campylobacter hominis ATCC BAA 381
Campylobacter jejuni RM1221
Campylobacter jejuni subsp jejuni 81116
Campylobacter fetus subsp fetus 82 40
Campylobacter curvus 525 92
Campylobacter concisus 13826
Sulfurovum sp NBC37 1
Arcobacter butzleri RM4018
S
ulfurim
onas denitrificans D
SM
1251
W
olinella succinogenes D
S
M 1740
Helicobacter acinonychis str Sheeba
Magnetococcus sp MC 1
Magnetospirillum magneticum AMB 1
Rhodospirillum rubrum ATCC 11170
Acidiphilium cryptum JF 5
Granulibacter bethesdensis CGDNIH1
Gluconacetobacter diazotrophicus PAl 5
G
luconobacter oxydans 621H
Sphingomonas wittichii RW1
Zymomonas mobilis subsp mobilis ZM4
Sphingopyxis alaskensis RB2256
Novosphingobium arom
aticivorans DSM 12444
Erythrobacter litoralis HTCC2594
Parvibaculum lavamentivorans DS 1
Azorhizobium caulinodans ORS 571
Xanthobacter autotrophicus Py2
Methylobacterium extorquens PA1
Rhodopseudomonas palustris CGA009
Bradyrhizobium sp BTAi1
Bradyrhizobium sp ORS278
Nitrobacter hamburgensis X14
S
inorhizobium
m
edicae W
SM419
Rhizobium leguminosarum bv viciae 3841
Agrobacterium tumefaciens str C58
Mesorhizobium sp BNC1
Mesorhizobium loti MAFF303099
Ochrobactrum anthropi ATCC 49188
Brucella melitensis biovar Abortus 2308
Bartonella bacilliformis KC583
Bartonella tribocorum CIP 105476
Bartonella henselae str Houston 1
Bartonella quintana str Toulouse
Maricaulis maris MCS10
Caulobacter crescentus CB15
Hyphomonas neptunium ATCC 15444
Paracoccus denitrificans PD1222
Rhodobacter sphaeroides 2 4 1
Dinoroseobacter shibae DFL 12
Jannaschia sp CCS1
Roseobacter denitrificans OCh 114
Silicibacter sp TM1040
Silicibacter pomeroyi DSS 3
Candidatus Pelagibacter ubique HTCC1062
R
ickettsia bellii O
SU
85 389
Rickettsia prowazekii str Madrid E
Orientia tsutsugamushi Boryong
W
olb
ach
ia end
osym
bio
nt of D
rosophila m
elan
ogaste
r
Wolbachia endosymbiont strain TRS of Brugia malayi
Ehrlichia ruminantium str Welgevonden
Ehrlichia canis str Jake
Ehrlichia chaffeensis str Arkansas
Anaplasm
a m
arginale str St M
aries
Anaplasma phagocytophilum HZ
Neorickettsia sennetsu str Miyayama
C
hrom
obacte
rium
violace
um A
TC
C 1247
2
Neisseria gonorrhoeae FA 1090
Thiobacillus denitrificans ATCC 25259
Methylobacillus flagellatus KT
Nitrosospira m
ultiformis ATCC 25196
Nitrosomonas europaea ATCC 19718
Nitrosomonas eutropha C91
Dechloromonas aromatica RCB
Azoarcus sp BH72
Azoarcus sp EbN1
Bordetella petrii
Janthinobacterium sp Marseille
Herminiimonas arsenicoxydans
B
urkholderia xenovorans LB
400
R alstonia solanacearum
G
MI1000
Polynucleobacter sp QLW P1DMWA 1
Methylibium petroleiphilum PM1
R
hodoferax ferrireducens T
118
P olarom
onas sp JS
666
Polaromonas naphthalenivorans CJ2
Verminephrobacter eiseniae EF01 2
Acidovorax avenae subsp citrulli AAC00 1
Acidovorax sp JS42
Delftia acidovorans SPH 1
Methylococcus capsulatus str Bath
Dichelobacter nodosus VCS1703A
Nitrosococcus oceani ATCC 19707
Alkalilim
nicola ehrlichei M
LHE 1
H alorhodospira halophila S
L1
Xanthomonas campestris pv vesicatoria str 85 10
Xylella fastidiosa Temecula1
L egion
ella pn
eum
ophila str C
orby
Coxiella burnetii RSA 493
Francisella tularensis subsp novicida U112
Thiomicrospira crunogena XCL 2
Candidatus Ruthia magnifica
Candidatus Vesicomyosocius okutanii HA
P
seudom
onas stutzeri A1501
Saccharophagus degradans 2 40
Marinobacter aquaeolei VT8
Hahella chejuensis KCTC 2396
Chromohalobacter salexigens DSM 3043
M
arinomonas sp
MW
YL1
Alcanivorax borkumensis SK2
Acinetobacter sp ADP1
Acinetobacter baumannii ATCC 17978
Psychrobacter sp PRwf 1
Psychrobacter arcticus 273 4
Pseudoalteromonas atlantica T6c
Idiomarina loihiensis L2TR
Pseudoalteromonas haloplanktis TAC125
Colwellia psychrerythraea 34H
Shewanella pealeana ATCC 700345
Psychrom
onas ingraham
ii 37
Aeromonas hydrophila ATCC 7966
Aeromonas salmonicida subsp A449
Photobacterium
profundum SS9
Vibrio fischeri ES114
Actinobacillus pleuropneumoniae L20
Haemophilus ducreyi 35000HP
Pasteurella multocida str Pm70
Haemophilus somnus 129PT
Haem
ophilus influenzae PittEE
Mannheimia succiniciproducens MBEL55E
Actinobacillus succinogenes 130Z
Photorhabdus luminescens TTO1
Yersinia enterocolitica 8081
Serratia proteamaculans 568
Erwinia carotovora SCRI1043
Escherichia coli O157 H7 str Sakai
Sodalis glossinidius str morsitans
Baumannia cicadellinicola
Candidatus Blochmannia pennsylvanicus
Candidatus Blochmannia floridanus
Wigglesworthia glossinidia endosymbiont
Buchnera aphidicola str Sg Schizaphis graminum
Buchnera aphidicola str APS Acyrthosiphon pisum
Buchnera aphidicola str Bp Baizongia pistaciae
B
uchnera aphidicola
str C
c C
in
ara cedri
Gammaproteobacteria
Betaproteobacteria
Alphaproteobacteria
Epsilonproteobacteria
Deltaproteobacteria
Acidobacteria
Bacteroidetes/Chlorobi
Chlamydiae/Planctomycetes
Spirochaetes
Firmicutes
Cyanobacteria
Chloroflexi
Actinobacteria
Aquificae
Thermotogae
Deinococcus/Thermus
Genome Biology 2008, Volume 9, Issue 10, Article R151 Wu and Eisen R151.6
Genome Biology 2008, 9:R151
Average rate of protein evolution in bacterial genomes
The average rates of protein evolution are proportional to the
branch lengths of our genome tree. The branch length varies
widely among different lineages. For example, as has been
previously reported, bacteria that have adopted an intracellu-
lar lifestyle have, in general, evolved more rapidly [24], with
Wigglesworthia glossinidia (the endosymbiont of Glossina
brevipalpis) and Neorickettsia sennetsu str. Miyayama
evolving at the fastest pace. The slowest rates are found in a
group of spore forming bacteria such as Carboxydothermus
hydrogenoformans, Moorella thermoacetica, Clostridium
spp., and Bacillus spp. These slow rates are of particular
interest because it has been suggested that they might be
related to the longer generation times for organisms that
spend a significant fraction of their time as dormant spores.
Our data for spore forming bacteria are consistent with that
hypothesis and differ strikingly from the findings of a recent
study [25], which identified no generation time effect in these
organisms.
Application II: metagenomic phylotyping
Reanalysis of the phylotypes reported in the Sargasso Sea
We used our automated pipeline to reanalyze the environ-
mental shotgun sequencing data collected from the Sargasso
Sea and phylotyped in a previous study [26]. The approxi-
mately 1.1 million predicted genes yielded a total of 18,607
genes that corresponded to our 31 protein markers and that
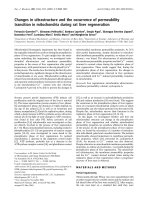
were long enough for phylogenetic analysis. Figure 3 illus-
trates the distribution of each of the 31 protein markers
among the major phylotypes. Our analysis identifies the α-
proteobacteria as the most abundant group, because more
than half of the marker sequences were assigned to this
group. Notably, the various individual protein markers
present remarkably consistent microbial diversity profiles,
thus suggesting that results for different markers may be
additive.
It was noted that SSU rRNA gives significantly different esti-
mates of microbial composition than those by protein mark-
ers [26]. This is believed to be caused by large variations in
rRNA gene copy numbers among different species. The pro-
tein markers used in our study are nearly all single-copy
genes and thus should, theoretically, give a more accurate
estimation of the microbial composition. One factor affecting
our analysis is that the peptides are based on assemblies
rather than sequence reads. Therefore, our method will
underestimate those organisms that have deep coverage in
assemblies. This is one major reason why depth of coverage
should be provided with metagenomics assemblies and
annotation.
Members of the α-proteobacterial SAR11 clade are the most
dominant micro-organisms in the Sargasso Sea [27]. At the
time of the Sargasso Sea metagenomics study, there were no
complete genome sequences available for members of the
SAR11 clade, and thus many of the SAR11 sequences could not
be anchored. The genome of one SAR11 member, namely
Candidatus Pelagibacter ubique, was subsequently
sequenced, which allows for much finer phylotyping now. In
our phylotyping analyses, 8,656 marker sequences (46.5% of
the total) form outgroups to only P. ubique. We have assigned
them to the SAR11 clade because their closest neighbor in the
tree is P. ubique and their dominance in the population is
consistent with previous quantitative estimations by fluores-
ence in situ hybridization that, on average, members of the
SAR11 clade account for one-third of the ocean surface bacte-
rioplankton communities [27].
Strategically located reference genomes
The use of metagenomics to phylotype communities has been
limited by the lack of sequenced genomes from many taxo-
nomic groups. To help fill some of these gaps, we sequenced
representatives of several phyla for which genome sequences
were not previously available. For example, we recently
sequenced the genomes of Dictyoglomus thermophilum and
Thermomicrobium roseum as part of a US National Science
Foundation (NSF) funded 'Tree of life' project (Eisen JA and
coworkers, unpublished data). To demonstrate the usefulness
of these additional genomes for improved phylotyping, we
analyzed metagenomic data from a Yellowstone hot spring
community. From the 8,341 Sanger sequence reads obtained,
we identified 59 reads that match the marker sequences
present in our database. For 20 of these reads, their closest
neighbors by phylogenetic analysis are D. thermophilum or T.
roseum (ten reads each), thus demonstrating the usefulness
of these genomes for phylotyping their close relatives in the
Yellowstone community (see Additional data file 4 for one
such example). This highlights the need to increase taxo-
nomic sampling by selecting bacteria for sequencing based on
their phylogenetic positions.
Selecting reference sequences
For best phylotyping results, the more reference sequences
the better. Therefore, theoretically, the greater number of
marker sequences identifiable from a more comprehensive
database such as the NCBI nonredundant protein sequence
(nr) database would be preferable to the lesser number
obtainable from complete genomes. However, taxonomic
sampling bias of the reference sequences has a great impact
on the resulting phylotype assignments (see below). To be
able to make meaningful comparisons among the results
obtained using different markers, the taxonomic sampling
must be controlled. In this regard, a complete genome data-
base, in which every marker was sampled equally, would be
preferable to the NCBI nr database, in which each marker was
sampled to a different extent.
With very few exceptions such as gyrB [28], the protein
marker sequences with species information in the nr database
were mostly derived from genome sequencing projects. This
is because it is very difficult to obtain protein encoding genes
by polymerase chain reaction amplification because their
Genome Biology 2008, Volume 9, Issue 10, Article R151 Wu and Eisen R151.7
Genome Biology 2008, 9:R151
sequences are not conserved at the nucleotide level [29]. As a
result, the nr database does not actually contain many more
protein marker sequences that can be used as references than
those available from complete genome sequences.
Comparison of phylogeny-based and similarity-based phylotyping
Although our phylogeny-based phylotyping is fully auto-
mated, it still requires many more steps than, and is slower
than, similarity based phylotyping methods such as a
MEGAN [30]. Is it worth the trouble? Similarity based phylo-
typing works by searching a query sequence against a refer-
ence database such as NCBI nr and deriving taxonomic
information from the best matches or 'hits'. When species
that are closely related to the query sequence exist in the ref-
erence database, similarity-based phylotyping can work well.
However, if the reference database is a biased sample or if it
contains no closely related species to the query, then the top
hits returned could be misleading [31]. Furthermore, similar-
ity-based methods require an arbitrary similarity cut-off
value to define the top hits. Because individual bacterial
genomes and proteins can evolve at very different rates, a uni-
versal cut-off that works under all conditions does not exist.
As a result, the final results can be very subjective.
In contrast, our tree-based bracketing algorithm places the
query sequence within the context of a phylogenetic tree and
only assigns it to a taxonomic level if that level has adequate
sampling (see Materials and methods [below] for details of
the algorithm). With the well sampled species Prochlorococ-
cus marinus, for example, our method can distinguish closely
related organisms and make taxonomic identifications at the
species level. Our reanalysis of the Sargasso Sea data placed
672 sequences (3.6% of the total) within a P. marinus clade.
On the other hand, for sparsely sampled clades such as
Aquifex, assignments will be made only at the phylum level.
Thus, our phylogeny-based analysis is less susceptible to data
sampling bias than a similarity based approach, and it makes
Major phylotypes identified in Sargasso Sea metagenomic dataFigure 3
Major phylotypes identified in Sargasso Sea metagenomic data. The metagenomic data previously obtained from the Sargasso Sea was reanalyzed using
AMPHORA and the 31 protein phylogenetic markers. The microbial diversity profiles obtained from individual markers are remarkably consistent. The
breakdown of the phylotyping assignments by markers and major taxonomic groups is listed in Additional data file 5.
0
0.1
0.2
0.3
0.4
0.5
0.6
0.7
0.8
Alphaproteobacteria
Betaproteobacteria
Gammaproteobacteria
Deltaproteobacteria
Epsilonproteobacteria
Unclassified proteobacteria
Bacteroidetes
Chlamydiae
Cyanobacteria
Acidobacteria
Thermotogae
Fusobacteria
Actinobacteria
Aquificae
Planctomycetes
Spirochaetes
Firmicutes
Chloroflexi
Chlorobi
Unclassified bacteria
dnaG
frr
infC
nusA
pgk
pyrG
rplA
rplB
rplC
rplD
rplE
rplF
rplK
rplL
rplM
rplN
rplP
rplS
rplT
rpmA
rpoB
rpsB
rpsC
rpsE
rpsI
rpsJ
rpsK
rpsM
rpsS
smpB
tsf
Relative abundance
Genome Biology 2008, Volume 9, Issue 10, Article R151 Wu and Eisen R151.8
Genome Biology 2008, 9:R151
sequence assignments only at the taxonomic levels that are
supported by the available data.
To compare quantitatively the performance of the phylogeny
based and the similarity based phylotyping, we carried out a
simulation study. We determined the sensitivity and specifi-
city of the taxonomic assignments made by AMPHORA and
MEGAN using 3,088 simulated shotgun sequences of 31 phy-
logenetic marker genes identified from 100 known bacterial
genomes as benchmarks. The 100 genomes were chosen in
such a way that maximizes their representation of the phylo-
genetic diversity and thus decreases the impact of the data
sampling bias of current genome sequencing efforts on our
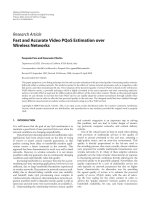
results. Figure 4 compares the sensitivity and specificity of
the phylotyping assignments at the phylum, class, order, fam-
ily, and genus level using AMPHORA and MEGAN. The gen-
eral trend toward decreasing sensitivity seen in the figure
from the phylum to the species level simply reflects the fact
that the amount of reference data available for taxonomic
assignment is decreasing. However, AMPHORA significantly
outperformed MEGAN in sensitivity at all taxonomic ranks.
Both methods performed extremely well in specificity at all
levels (>0.97) except at the species level, where AMPHORA
(0.63) outperformed MEGAN (0.43) by a large margin.
Future issues
Additional markers
We are in the process of adding more proteins to our initial
database of 31 markers, including the commonly used protein
markers RecA, HSP70, and EF-Tu. Ideally, a probability
based method that evaluates the positional homology of the
multiple sequence alignment could be developed to automate
fully the process of masking. Major expansion will also
require systematic assessment of many other protein families
for their suitability as phylogenetic markers. For metagen-
omic phylotyping, the marker genes do not have to be single-
copy or universal, but they must have been reasonably well
sampled, have sufficient phylogenetic signal, and not be fre-
quently exchanged between distantly related lineages. Until
we learn more about the extent of lateral gene transfer in nat-
ural microbial communities, we caution against using every
protein sequence collected in metagenomics studies for
microbial diversity study.
More reference genomes
We have shown that adding representatives of novel phyla
can facilitate metagenomic phylotyping. More reference
genomes are needed for optimal performance. Although the
sequencing of thousands of microbial genomes is underway,
the organisms chosen are a biased sample and thus are not
truly representative of the total microbial diversity. We see a
need to select microbes systematically for sequencing based
mainly on their phylogenetic positions, thus maximizing their
value for comparative genomics and phylogenomic studies.
Conclusion
Currently, SSU rRNA is still the most powerful phylogenetic
marker because of the number of sequences available and the
scope of taxonomic coverage. However, the imminent arrival
of thousands of microbial genome sequences will vastly
expand the amount of data available for alternative protein
phylogenetic markers, thus presenting us with both a chal-
lenge and an opportunity. We have developed AMPHORA, a
fully automated method for phylogenetic inference using
multiple protein markers. AMPHORA offers speed, reliabil-
ity, and high quality analyses. By eliminating the need for
time consuming manual curation of sequence alignments, it
removes one of the tightest bottlenecks in large-scale protein
phylogenetic inference. We demonstrated its usefulness for
Comparison of the phylotyping performance by AMPHORA and MEGANFigure 4
Comparison of the phylotyping performance by AMPHORA and MEGAN. The sensitivity and specificity of the phylotyping methods were measured across
taxonomic ranks using simulated Sanger shotgun sequences of 31 genes from 100 representative bacterial genomes. The figure shows that AMPHORA
significantly outperforms MEGAN in sensitivity without sacrificing specificity.
0
0.1
0.2
0.3
0.4
0.5
0.6
0.7
0.8
0.9
1
phylum class order family genus species
0
0.1
0.2
0.3
0.4
0.5
0.6
0.7
0.8
0.9
1
phylum class order family genus species
AMPHORA
MEGAN
Sensitivity
Specificity
Genome Biology 2008, Volume 9, Issue 10, Article R151 Wu and Eisen R151.9
Genome Biology 2008, 9:R151
automating both the construction of genome trees and the
assignment of phylotypes to environmental metagenomic
data. We believe such a phylogenomic approach will be
valuable in helping us to make sense of rapidly accumulating
microbial genomic data.
Materials and methods
Protein phylogenetic marker database
For each marker, we first identified their protein sequences
from representative bacterial genomes. The amino acid
sequences were aligned using CLUSTALW [32] and then
manually edited and masked using the GDE package [33].
The mask is a text string of '1' and '0', where reliably aligned
columns were labeled '1' and ambiguous columns were
labeled '0'. Next, we used HMMer [34] to make local profile
HMMs from these 'seed' alignments (Figure 1).
Automated sequence alignment and trimming
Subsequent steps are carried out by a Perl script joining mul-
tiple automated processes (Figure 1). First, HMMer effi-
ciently aligns the query amino acid sequences onto the
trusted and fixed seed alignments. The Perl script then reads
the masks embedded in the seed alignments and automati-
cally trims the query alignments accordingly.
Bacterial genome tree construction
Homologs of each of the 31 phylogenetic marker genes were
identified from the 578 complete bacterial genomes by
BLASTP searches (using marker sequences of Escherichia
coli as query sequences and a cut-off E-value of 0.1) followed
by HMMer searches (cut-off E-value 1 × e
-10
). The corre-
sponding protein sequences were retrieved, aligned, and
trimmed as described above, and then concatenated by spe-
cies into a mega-alignment. A maximum likelihood tree was
then constructed from the mega-alignment using PHYML
[35]. The model selected based on the likelihood ratio test was
the WAG model of amino acid substitution with γ-distributed
rate variation (five categories) and a proportion of invariable
sites. The shape of the γ-distribution and the proportion of the
invariable sites were estimated by the program.
To speed up bootstrapping analyses, very closely related taxa
were removed from the original mega-alignment, which left
us with 310 taxa. Maximum likelihood trees were made from
100 bootstrapped replicates of this reduced dataset using
PHYML with the same parameters described above.
With very few exceptions, the marker genes are single-copy
genes in all of the bacterial genomes analyzed. In those rare
cases in which two or more homologs were identified within a
single species, a tree-guided approach was used to resolve the
redundancy. If the redundancy resulted from a species-spe-
cific duplication event, then one homolog was randomly cho-
sen as the representative. In all other cases, to avoid potential
complications such as lateral gene transfer, we excluded that
marker and treated it as 'missing' in that particular genome.
It has been shown that as long as there is sufficient data, a few
'holes' in the dataset will not compromise the resulting tree
[36].
Phylotyping by phylogenetic analyses (AMPHORA)
The protein markers used to construct the bacterial genome
tree (see above) and the resultant genome tree were used as
the reference sequences and the reference tree for phylotyp-
ing metagenomic data from the Sargasso Sea or the simulated
sequences described below. Each marker sequence identified
from the metagenomic data or simulated sequences was indi-
vidually aligned to its corresponding reference sequences and
trimmed using the method described above. Then it was
inserted into the reference tree using a maximum parsimony
method of RAXML [37], constraining the topology of the tree
to that of the genome tree. This tree construction procedure
was extremely fast, and 100 bootstrap replicates were run for
each query sequence to assess the confidence of the branching
orders. The trees were rooted arbitrarily using Deinococcus
radiodurans as the outgroup. Tree branch lengths were cal-
culated using the neighbor joining algorithm with a fixed tree
topology.
A tree-based bracketing algorithm was then employed to
assign a phylotype to the query sequence (Figure 5), as fol-
lows. Starting from the immediate ancestor n
0
of the query
sequence and moving toward the root of the tree, the first
internal node n
1
whose bootstrap support exceeded a cut-off
(for example, 70%) was identified. The common NCBI taxon-
omy t
1
that was shared by all descendants of the node n
1
rep-
resented the most conservative taxonomic prediction for the
query sequence. Using the branch length information, finer
scale phylotyping was carried out by comparing the normal-
ized branch length from n
0
to n
1
with these between taxo-
nomic ranks that had been tallied from the bacterial genome
tree. Based on this comparison, a taxonomic rank below or
equal to t
1
was assigned to the node n
0
. The taxonomy of the
sister node of the query at this rank was then assigned to the
query. All tree branch lengths were normalized by dividing
them by the lengths of the root-to-tip branches of their partic-
ular lineages. This was done to make the tree more clock-like,
and therefore the branch lengths would be much more
informative in inferring the time of evolution. In the simula-
tion study, the query sequence itself was removed from the
reference dataset before the analyses.
Phylotyping by similarity-based analyses (MEGAN)
A total of 3,088 simulated phylogenetic marker gene
sequences described below were searched against a database
of complete bacterial genomes using BLASTX. The query
sequence itself was discarded from the BLAST hits before
feeding the BLAST results into the software MEGAN [30] for
similarity-based phylotyping. A top per cent cut-off of 20%
was used to retain only those hits whose matching scores are
at least 80% of the best matching score. This cut-off was
Genome Biology 2008, Volume 9, Issue 10, Article R151 Wu and Eisen R151.10
Genome Biology 2008, 9:R151
chosen to match the one used in a similar phylotyping simu-
lation study described in the original MEGAN report [30]. All
other parameters of MEGAN were set as default values except
that the min-support (the minimum number of sequence
reads that must be assigned to a taxon) is set to 1, because in
our simulation study each query sequence was assigned a
phylotype independently.
Phylotyping simulation study
To assess the performance of the phylotyping methods, a sim-
ulation study was carried out. One hundred representative
genomes maximizing the phylogenetic diversity of the 578
complete bacterial genomes were selected using the genome
tree and an algorithm described in the report by Steel [38].
From each of the 31 phylogenetic marker genes identified
from the 100 bacterial genomes, a DNA sequence fragment of
300 to 900 base pairs in length was randomly chosen, which
resulted in a total of 3,088 simulated shotgun sequences that
were used as benchmark query sequences in phylotyping
(some markers are missing in some of the genomes). By com-
paring the predicted taxa with the known taxa, the sensitivity
and specificity of phylotyping methods were calculated as
described in the report by Krause and coworkers [39]. Briefly,
for a taxon i, let P
i
be the number of query sequences from i,
TP
i
be the number of sequences that are correctly assigned to
i, and FP
i
be the number of sequences that are incorrectly
assigned to i. The sensitivity TP
i
/P
i
measures the proportion
of query sequences that are correctly classified. The specifi-
city TP
i
/(TP
i
+ FP
i
) measures the reliability of the phylotyping
assignments.
SSU rRNA tree construction
SSU rDNA sequences were extracted from complete
genomes, aligned, and trimmed using an online tool MyRDP
[40]. When multiple copies of SSU rRNA genes were present
within a single genome, one representative was randomly
chosen. Maximum likelihood tree was constructed using
PHYML [35], applying the GTR model of substitution, with a
γ-distribution (α estimated by the program) of rates of five
categories of variable sites and a proportion of invariable sites
(proportion estimated by the program).
Availability
The AMPHORA package and the simulation study data can be
downloaded from [41].
Abbreviations
AMPHORA: AutoMated PHylogenOmic infeRence; HMM:
hidden Markov model; NCBI: National Center for Biotech-
nology Information; nr: nonredundant protein sequence;
SSU: small subunit NSF: US National Science Foundation.
Authors' contributions
MW designed the study, developed the method, and per-
formed the analyses. JAE advised on method design and test-
ing. MW and JAE wrote the paper.
Additional data files
The following additional data are available with the online
version of this paper. Additional data file 1 is a table listing the
578 complete bacterial genomes downloaded from the NCBI
RefSeq database for this study. Additional data file 2 is a fig-
ure of a maximum likelihood genome tree of 578 bacterial
species; major taxonomic groups are highlighted by color.
Additional data file 3 provides a figure that compares γ-pro-
teobacterial phylogenetic trees made from a super-matrix of
31 protein phylogenetic markers and from the SSU rDNA;
bootstrap support values are shown along their correspond-
ing branches. Additional data file 4 is a figure of a maximum
likelihood tree of rpoB; adding a novel genome (Thermomi-
crobium roseum) to the reference tree helped anchor a
sequence read (ZAVAM73TF) from a Yellowstone hotspring
metagenomic study. Additional data file 5 is a table listing
phylotypes breakdown of the Sargasso Sea metagenomic
sequence data by phylogenetic markers and major taxonomic
groups.
Additional data file 1578 complete bacterial genomes downloaded from the NCBI Ref-Seq databasePresented is a table listing the 578 complete bacterial genomes downloaded from the NCBI RefSeq database for this study.Click here for fileAdditional data file 2Maximum likelihood genome tree of 578 bacterial speciesPresented is a figure of a maximum likelihood genome tree of 578 bacterial species. Major taxonomic groups are highlighted by color.Click here for fileAdditional data file 3Comparison of γ-proteobacterial phylogenetic treesPresented is a figure that compares γ-proteobacterial phylogenetic trees made from a super-matrix of 31 protein phylogenetic markers (A) and from the SSU rDNA (B). Bootstrap support values are shown along their corresponding branches.Click here for fileAdditional data file 4Maximum likelihood tree of rpoBPresented is a figure of a maximum likelihood tree of rpoB. Adding a novel genome (Thermomicrobium roseum) to the reference tree helped anchor a sequence read (ZAVAM73TF) from a Yellowstone hotspring metagenomic study.Click here for fileAdditional data file 5Phylotypes breakdown of the Sargasso Sea metagenomic sequence dataPresented is a table listing phylotypes breakdown of the Sargasso Sea metagenomic sequence data by phylogenetic markers and major taxonomic groups.Click here for file
Acknowledgements
The initial development of this work was supported in part by NSF grant
DEB-0228651 to JAE. The final development and testing was funded by the
Gordon and Betty Moore Foundation (grant #1660 to JAE).
A tree based bracketing algorithm for phylotyping a query sequenceFigure 5
A tree based bracketing algorithm for phylotyping a query sequence. To
assign a phylotype to the query sequence, its immediate ancestor n
0
and
the first internal node n
1
with ≥70% bootstrapping support were identified.
The known descendant leaf nodes of n
1
, namely A through D, are used to
infer the taxonomy of the query, in conjunction with the normalized
branch length information. The dashed timelines delimiting various
taxonomic ranks were inferred from a clock that had been calibrated from
the bacterial genome tree.
query
D
E
F
G
H
I
C
B
A
*
n
0
n
1
Order Family Genus
Genome Biology 2008, Volume 9, Issue 10, Article R151 Wu and Eisen R151.11
Genome Biology 2008, 9:R151
References
1. Woese CR, Achenbach L, Rouviere P, Mandelco L: Archaeal phyl-
ogeny: reexamination of the phylogenetic position of Archae-
oglobus fulgidus in light of certain composition-induced
artifacts. Syst Appl Microbiol 1991, 14:364-371.
2. Hasegawa M, Hashimoto T: Ribosomal RNA trees misleading?
Nature 1993, 361:23.
3. Ludwig W, Klenk H-P: Overview: A phylogenetic backbone and
taxonomic framework for procaryotic systematics. In Bergey's
Manual of Systematic Bacteriology Volume 1. 2nd edition. Edited by:
Boone DR, Castenholz RW, Garrity GM. New York, NY: Springer-
Verlag; 2000:49-65.
4. Loomis WF, Smith DW: Molecular phylogeny of Dictyostelium
discoideum by protein sequence comparison. Proc Natl Acad Sci
USA 1990, 87:9093-9097.
5. Lockhart PJ, Howe CJ, Bryant DA, Beanland TJ, Larkum AW: Substi-
tutional bias confounds inference of cyanelle origins from
sequence data. J Mol Evol 1992, 34:153-162.
6. Baldauf SL, Roger AJ, Wenk-Siefert I, Doolittle WF: A kingdom-
level phylogeny of eukaryotes based on combined protein
data. Science 2000, 290:972-977.
7. Jeffroy O, Brinkmann H, Delsuc F, Philippe H: Phylogenomics: the
beginning of incongruence? Trends Genet 2006, 22:225-231.
8. Brown JR, Douady CJ, Italia MJ, Marshall WE, Stanhope MJ: Univer-
sal trees based on large combined protein sequence data
sets. Nat Genet 2001, 28:281-285.
9. Ciccarelli FD, Doerks T, von Mering C, Creevey CJ, Snel B, Bork P:
Toward automatic reconstruction of a highly resolved tree
of life. Science 2006, 311:1283-1287.
10. Delsuc F, Brinkmann H, Philippe H: Phylogenomics and the
reconstruction of the tree of life. Nat Rev Genet 2005, 6:361-375.
11. Wu M, Ren Q, Durkin AS, Daugherty SC, Brinkac LM, Dodson RJ,
Madupu R, Sullivan SA, Kolonay JF, Haft DH, Nelson WC, Tallon LJ,
Jones KM, Ulrich LE, Gonzalez JM, Zhulin IB, Robb FT, Eisen JA: Life
in hot carbon monoxide: the complete genome sequence of
Carboxydothermus hydrogenoformans Z-2901. PLoS Genet 2005,
1:e65.
12. Badger JH, Eisen JA, Ward NL: Genomic analysis of Hyphomonas
neptunium contradicts 16S rRNA gene-based phylogenetic
analysis: implications for the taxonomy of the orders 'Rhodo-
bacterales' and Caulobacterales. Int J Syst Evol Microbiol 2005,
55:1021-1026.
13. Brocchieri L: Phylogenetic inferences from molecular
sequences: review and critique. Theor Popul Biol 2001, 59:27-40.
14. Foster PG, Hickey DA: Compositional bias may affect both
DNA-based and protein-based phylogenetic
reconstructions. J Mol Evol 1999, 48:284-290.
15. Gatesy J, DeSalle R, Wheeler W: Alignment-ambiguous nucle-
otide sites and the exclusion of systematic data. Mol Phylogenet
Evol 1993, 2:152-157.
16. Eisen JA: Phylogenomics: improving functional predictions for
uncharacterized genes by evolutionary analysis. Genome Res
1998, 8:163-167.
17. Castresana J: Selection of conserved blocks from multiple
alignments for their use in phylogenetic analysis. Mol Biol Evol
2000, 17:540-552.
18. Béjà O, Aravind L, Koonin EV, Suzuki MT, Hadd A, Nguyen LP,
Jovanovich SB, Gates CM, Feldman RA, Spudich JL, Spudich EN,
DeLong EF: Bacterial rhodopsin: evidence for a new type of
phototrophy in the sea. Science 2000, 289:1902-1906.
19. Jain R, Rivera MC, Lake JA: Horizontal gene transfer among
genomes: the complexity hypothesis. Proc Natl Acad Sci USA
1999, 96:3801-3806.
20. Morrison DA, Ellis JT: Effects of nucleotide sequence alignment
on phylogeny estimation: a case study of 18S rDNAs of
apicomplexa. Mol Biol Evol 1997, 14:428-441.
21. Williams KP, Sobral BW, Dickerman AW:
A robust species tree
for the alphaproteobacteria. J Bacteriol 2007, 189:4578-4586.
22. Lerat E, Daubin V, Moran NA: From gene trees to organismal
phylogeny in prokaryotes: the case of the gamma-proteo-
bacteria. PLoS Biol 2003, 1:E19.
23. Taxonomic outline of the prokaryotes. [http://141.150.157.80/
bergeysoutline/main.htm]
24. Moran NA: Accelerated evolution and Muller's rachet in
endosymbiotic bacteria. Proc Natl Acad Sci USA 1996,
93:2873-2878.
25. Maughan H: Rates of molecular evolution in bacteria are rela-
tively constant despite spore dormancy. Evolution 2007,
61:280-288.
26. Venter JC, Remington K, Heidelberg JF, Halpern AL, Rusch D, Eisen
JA, Wu D, Paulsen I, Nelson KE, Nelson W, Fouts DE, Levy S, Knap
AH, Lomas MW, Nealson K, White O, Peterson J, Hoffman J, Parsons
R, Baden-Tillson H, Pfannkoch C, Rogers YH, Smith HO: Environ-
mental genome shotgun sequencing of the Sargasso Sea. Sci-
ence 2004, 304:66-74.
27. Morris RM, Rappe MS, Connon SA, Vergin KL, Siebold WA, Carlson
CA, Giovannoni SJ: SAR11 clade dominates ocean surface bac-
terioplankton communities. Nature 2002, 420:806-810.
28. Kasai H, Watanabe K, Gasteiger E, Bairoch A, Isono K, Yamamoto S,
Harayama S: Construction of the gyrB database for the identi-
fication and classification of bacteria. Genome Inform Ser Work-
shop Genome Inform 1998, 9:13-21.
29. Santos SR, Ochman H: Identification and phylogenetic sorting
of bacterial lineages with universally conserved genes and
proteins. Environ Microbiol 2004, 6:754-759.
30. Huson DH, Auch AF, Qi J, Schuster SC: MEGAN analysis of
metagenomic data. Genome Res 2007, 17:377-386.
31. Koski LB, Golding GB: The closest BLAST hit is often not the
nearest neighbor. J Mol Evol 2001, 52:540-542.
32. Thompson JD, Higgins DG, Gibson TJ: CLUSTAL W: improving
the sensitivity of progressive multiple sequence alignment
through sequence weighting, position-specific gap penalties
and weight matrix choice. Nucleic Acids Res 1994, 22:4673-4680.
33. Smith SW, Overbeek R, Woese CR, Gilbert W, Gillevet PM: The
genetic data environment: an expandable GUI for multiple
sequence analysis. Comput Appl Biosci 1994, 10:671-675.
34. Eddy SR: Profile hidden Markov models. Bioinformatics 1998,
14:755-763.
35. Guindon S, Gascuel O: A simple, fast, and accurate algorithm
to estimate large phylogenies by maximum likelihood. Syst
Biol 2003, 52:696-704.
36. Wiens JJ: Missing data, incomplete taxa, and phylogenetic
accuracy. Syst Biol 2003, 52:528-538.
37. Stamatakis A: RAxML-VI-HPC: maximum likelihood-based
phylogenetic analyses with thousands of taxa and mixed
models. Bioinformatics 2006, 22:2688-2690.
38. Steel M: Phylogenetic diversity and the greedy algorithm. Syst
Biol 2005, 54:527-529.
39. Krause L, Diaz NN, Goesmann A, Kelley S, Nattkemper TW, Rohwer
F, Edwards RA, Stoye J: Phylogenetic classification of short envi-
ronmental DNA fragments. Nucleic Acids Res 2008,
36:2230-2239.
40. Cole JR, Chai B, Farris RJ, Wang Q, Kulam SA, McGarrell DM, Garrity
GM, Tiedje JM: The Ribosomal Database Project (RDP-II):
sequences and tools for high-throughput rRNA analysis.
Nucleic Acids Res 2005, 33:D294-D296.
41. AMPHORA [ />AMPHORA]
42. Letunic I, Bork P: Interactive Tree Of Life (iTOL): an online
tool for phylogenetic tree display and annotation. Bioinformat-
ics 2007, 23:127-128.