Báo cáo y học: "Functional architecture of Escherichia coli: new insights provided by a natural decomposition approach" ppt
Bạn đang xem bản rút gọn của tài liệu. Xem và tải ngay bản đầy đủ của tài liệu tại đây (545.66 KB, 12 trang )
Genome Biology 2008, 9:R154
Open Access
2008Freyre-Gonzálezet al.Volume 9, Issue 10, Article R154
Research
Functional architecture of Escherichia coli: new insights provided by
a natural decomposition approach
Julio A Freyre-González, José A Alonso-Pavón, Luis G Treviño-Quintanilla
and Julio Collado-Vides
Address: Programa de Genómica Computacional, Centro de Ciencias Genómicas, Universidad Nacional Autónoma de México. Av. Universidad
s/n, Col. Chamilpa 62210, Cuernavaca, Morelos, México.
Correspondence: Julio A Freyre-González. Email: Julio Collado-Vides. Email:
© 2008 Freyre-González et al.; licensee BioMed Central Ltd.
This is an open access article distributed under the terms of the Creative Commons Attribution License ( which
permits unrestricted use, distribution, and reproduction in any medium, provided the original work is properly cited.
E. coli network structure<p>The <it>E. coli</it> transcriptional regulatory network is shown to have a nonpyramidal architecture of independent modules gov-erned by transcription factors, whose responses are integrated by intermodular genes.</p>
Abstract
Background: Previous studies have used different methods in an effort to extract the modular
organization of transcriptional regulatory networks. However, these approaches are not natural,
as they try to cluster strongly connected genes into a module or locate known pleiotropic
transcription factors in lower hierarchical layers. Here, we unravel the transcriptional regulatory
network of Escherichia coli by separating it into its key elements, thus revealing its natural
organization. We also present a mathematical criterion, based on the topological features of the
transcriptional regulatory network, to classify the network elements into one of two possible
classes: hierarchical or modular genes.
Results: We found that modular genes are clustered into physiologically correlated groups
validated by a statistical analysis of the enrichment of the functional classes. Hierarchical genes
encode transcription factors responsible for coordinating module responses based on general
interest signals. Hierarchical elements correlate highly with the previously studied global regulators,
suggesting that this could be the first mathematical method to identify global regulators. We
identified a new element in transcriptional regulatory networks never described before:
intermodular genes. These are structural genes that integrate, at the promoter level, signals coming
from different modules, and therefore from different physiological responses. Using the concept of
pleiotropy, we have reconstructed the hierarchy of the network and discuss the role of
feedforward motifs in shaping the hierarchical backbone of the transcriptional regulatory network.
Conclusions: This study sheds new light on the design principles underpinning the organization of
transcriptional regulatory networks, showing a novel nonpyramidal architecture composed of
independent modules globally governed by hierarchical transcription factors, whose responses are
integrated by intermodular genes.
Published: 27 October 2008
Genome Biology 2008, 9:R154 (doi:10.1186/gb-2008-9-10-r154)
Received: 28 September 2008
Accepted: 27 October 2008
The electronic version of this article is the complete one and can be
found online at /> Genome Biology 2008, Volume 9, Issue 10, Article R154 Freyre-González et al. R154.2
Genome Biology 2008, 9:R154
Background
Our understanding of transcriptional control has progressed
a long way since Jacob and Monod unraveled the mechanisms
that control protein synthesis [1]. These mechanisms allow
bacteria to be robust and able to respond to a changing envi-
ronment. In fact, these regulatory interactions give rise to
complex networks [2], which obey organizational principles
defining their dynamic behavior [3]. The understanding of
these principles is currently a challenge. It has been suggested
that decision-making networks require specific topologies
[4]. Indeed, there are strong arguments supporting the notion
of a modular organization in the cell [5]. A module is defined
as a group of cooperating elements with one specific cellular
function [2,5]. In genetic networks, these modules must com-
prise genes that respond in a coordinated way under the influ-
ence of specific stimuli [5-7].
Topological analyses have suggested the existence of hierar-
chical modularity in the transcriptional regulatory network
(TRN) of Escherichia coli K-12 [7-10]. Previous works have
proposed methodologies from which this organization could
be inferred [9-11]. These works suggested the existence of a
pyramidal top-down hierarchy. Unfortunately, these
approaches have proven inadequate for networks involving
feedback loops (FBLs) or feedforward motifs (FFs) [10,11],
two topological structures relevant to the organization and
dynamics of TRNs [2,12-16]. In addition, module identifica-
tion approaches frequently have been based on clustering
methods, in which each gene must belong to a certain module
[6,7,17]. Although analyses using these methods have
reported good results, they have revealed two inconven-
iences: they rely on certain parameters or measurement crite-
ria that, when modified, can generate different modules; and
a network with scale-free properties foresees the existence of
a small group of strongly connected nodes (hubs), but to what
modules do these hubs belong? Maybe they do not belong to
a particular module, but do they serve as coordinators of
module responses?
Alternatively, we developed a novel algorithm to enumerate
all the FBLs comprising two or more nodes existing in the
TRN, thus providing the first systems-level enumeration and
analysis of the global presence and participation of FBLs in
the functional organization of a TRN. Our results show, con-
trary to what has been previously reported [9,10], the pres-
ence of positive and negative FBLs bridging different
organizational levels of the TRN of E. coli. This new evidence
highlights the necessity to develop a new strategy for inferring
the hierarchical modular organization of TRNs.
To address these concerns, in this work we propose an alter-
native approach founded on inherent topological features of
hierarchical modular networks. This approach recognizes
hubs and classifies them as independent elements that do not
possess a membership to any module, and reveals, in a natu-
ral way, the modules comprising the TRN by removing the
hubs. This methodology enabled us to reveal the natural
organization of the TRN of E. coli, where hierarchical tran-
scription factors (hierarchical TFs) govern independent mod-
ules whose responses are integrated at the promoter level by
intermodular genes.
Results
The TRN of E. coli K-12 is the best characterized of all
prokaryote organisms. In this work, the TRN was recon-
structed using mainly data obtained from RegulonDB [18],
complemented with new sigma factor interactions gathered
from a literature review on transcriptional regulation medi-
ated by sigma factors (see Materials and methods). In our
graphical representation, each node represents a gene and
each edge a regulatory interaction. The TRN used in this work
was represented as a directed graph comprising 1,692 nodes
(approximately 40% of the total genes in the genome) with
4,301 arcs (directed regulatory interactions) between them.
Neglecting autoregulation and the directions of interactions
between genes, the average shortest path of the network was
2.68, supporting the notion that the network has small-world
properties [2]. The connectivity distribution of the TRN tends
to follow a power law, P(k) ~ k
-2.06
, which implies that it has
scale-free properties (Figure S1a in Additional data file 1). In
addition, the distribution of the clustering coefficient shows a
power law behavior, with C(k) ~ k
-0.998
(Figure S1b in Addi-
tional data file 1). In the latter, the exponent value is virtually
equal to -1, strongly suggesting that the network possesses a
hierarchical modular architecture [2,19].
The TRN has FBLs that involve mainly global and local
TFs
The pioneering theoretical work of René Thomas
[15,16,20,21] and experimental work [14,22] have shown the
topological and dynamic relevance of feedback circuits
(FBLs). In regulatory networks, FBLs are associated with bio-
logical phenomena, such as homeostasis, phenotypic variabil-
ity, and differentiation [14,16,20,22]. Previous studies have
established the importance of FBLs for both the modularity of
regulatory networks [21] and their dynamics [14-16,20,22].
Ma et al. [9,10] suggested that FBLs that exist in the TRN of
E. coli are not relevant for the topological organization of the
TRN. Using an E. coli TRN reconstruction that included
sigma factor interactions, they claimed to have identified only
seven two-node FBLs (that is, FBLs with the structure A B
A) and no FBLs comprising more than two nodes [10].
However, given that their approach requires, a priori, an acy-
clic network [23], genes involved in an FBL are placed in the
same hierarchical layer, under the argument that they are in
the same operon [10].
To get a global image of FBLs, an original algorithm was
developed and implemented (see Materials and methods).
This algorithm allowed us to enumerate all FBLs, comprising
two or more nodes, existing in the TRN (Table 1). A total of 20
Genome Biology 2008, Volume 9, Issue 10, Article R154 Freyre-González et al. R154.3
Genome Biology 2008, 9:R154
FBLs were found: 9 (45%) with two nodes and 11 (55%) with
more than two nodes. It was found that FBLs in the TRN tend
mainly to connect global TFs with local TFs (at this point we
used the definitions of global and local TFs given by Martinez-
Antonio and Collado-Vides [24]). It was also found that only
2 FBLs (10%) are located in the same operon, 4 (20%) involve
only local TFs, 10 (50%) involve both global and local TFs,
and 6 (30%) involve only global TFs. We observed a couple of
dual FBLs, the first comprising arcA and fnr and the second
comprising crp, rpoH, and rpoD. These dual FBLs comprise
dual regulatory interactions, thus giving rise to two overlap-
ping FBLs, one positive and the other negative. However,
each of these overlapping FBLs was enumerated as a different
FBL, given that the dynamic behaviors of positive and nega-
tive FBLs are quite different.
Nodes of hierarchical modular networks can be
classified into one of two possible classes: hierarchical
or modular nodes
The characteristic signature of hierarchical modularity in a
network is the clustering coefficient distribution, which must
follow a power law, C(k) ~ k
-1
[2,19]. This coefficient measures
how much the nearest neighbors of a TF affect each other,
thus providing a measure of the modularity for the TF. In the
extreme limits of the clustering coefficient distribution, nodes
follow two apparently contradictory behaviors [2] (Figure 1a).
At low connectivity, nodes show high clustering coefficients.
On the contrary, at high connectivity, nodes show low cluster-
ing coefficients. Previous work with the E. coli metabolic net-
work [17] suggested that the first behavior is due to network
modularity but the latter is due to the presence of hubs. In
addition, a previous analysis of the TRN of Saccharomyces
cerevisiae found that direct connections between hubs tend
to be suppressed while connections between hubs and poorly
connected nodes are favored [25], suggesting that modules
tend to be organized around hubs. This evidence suggested
two possible roles for nodes: nodes that shape modules (they
have low connectivity and a high clustering coefficient, which
will be called modular nodes); and nodes that bridge modules
(they have high connectivity and a low clustering coefficient,
which will be called hierarchical nodes), establishing in this
way a hierarchy that dynamically governs module responses.
It can be observed in C(k) distributions following a power law
that initially slight increments in the connectivity value (k)
will make the clustering coefficient decrease quickly. How-
ever, eventually a point is reached where the situation is
inverted. Then, a larger increment in connectivity is needed
to make the clustering coefficient decrease. From this behav-
ior the existence of an equilibrium point in the C(k) distribu-
tion is inferred, where the variation of the clustering
Table 1
FBLs identified in the TRN of Escherichia coli
Type of FBL Number of genes Genes Interactions Are genes in the same operon?
+2arcA fnr - - No
-2arcA fnr - + No
-2gadX hns + - No
+2gadX rpoS + + No
-2gutM srlR + - Yes
-2lexA rpoD - + No
-2marA marR + - Yes
-2marA rob - + No
+2rpoD rpoH + + No
+3crp rpoH rpoD + + + No
-3crp rpoH rpoD - + + No
-3cytR rpoH rpoD - + + No
+3gadE gadX rpoS + + + No
+3marA rob marR - + - No
+3rpoD rpoN rpoH + + + No
-4cpxR rpoE rpoH rpoD - + + + No
-4crp cytR rpoH rpoD + - + + No
-5IHF fis hns gadX rpoS + + - + + No
-5argP dnaA rpoH rpoD phoB + - + + + No
-5cpxR rpoE rpoN rpoH rpoD - + + + + No
Eighty percent of the total FBLs involve, at least, one global TF. The longest FBL comprises five TFs. Only two FBLs have genes encoded in the same
operon, contrary to what was previously reported by Ma et al. [10], thus suggesting that these FBLs work as uncoupled systems. In addition, seven
positive FBLs were identified, which potentially could give rise to multistability.
Genome Biology 2008, Volume 9, Issue 10, Article R154 Freyre-González et al. R154.4
Genome Biology 2008, 9:R154
coefficient is equal to the variation of connectivity but with
the opposite sign:
dC(k)/dk = -1
Solving this equation gives the connectivity value () where
such an equilibrium is reached (see Material and methods).
Herein, is proposed as a cutoff value that disaggregates the
set of nodes into two classes (Figure 1a). Hierarchical nodes
are those with connectivity greater than . On the other hand,
modular nodes are those with connectivity less than .
The value can be calculated with the formula (see Materials
and methods):
This formula relates the equilibrium point () of the C(k) dis-
tribution with its exponent (-) and its proportionality con-
stant (). It has been shown that in 'ideal' hierarchical
modular networks the exponent - is equal to -1 [2,19]. Thus,
substituting this value into the previous formula gives:
Therefore, in 'ideal' networks the equilibrium point depends
exclusively on the proportionality constant of C(k). To the
best of our knowledge, this is the first time that a relevant top-
ological interpretation has been given to the proportionality
constant.
Hierarchical nodes correlate highly with known global
TFs
After computing the value for the TRN, the following 15 TFs
were identified as hierarchical nodes (nodes with connectivity
greater than 50; Figure 1): RpoD (
70
), CRP, FNR, IHF, Fis,
ArcA, RpoS (
38
), RpoH (
32
), RpoN (
54
), NarL, RpoE (
24
),
H-NS, Lrp, FlhDC, and Fur. All these TFs, except FlhDC and
Fur, have been reported several times as global TFs
[13,24,26,27]. In addition, Madan Babu and Teichmann [27]
have previously reported Fur as a global TF. FlhDC and Fur
regulate genes with several physiological functions, which
makes them potential candidates to be global TFs [28]. Fur
regulates amino acid biosynthesis genes [29], Fe
+
transport
[30-32], flagellum biosynthesis [29], the Krebs cycle [33],
and Fe-S cluster assembly [34]. On the other hand, FlhDC
mainly regulates membrane genes. Nevertheless, these genes
take part in several physiological functions, such as motility
[35], glutamate [36] and galactose [37] transport, anaerobio-
sis [37], and 3-P-glycerate degradation [37]. When connectiv-
ity was less than , genes encoding local TFs (herein called
modular TFs) and structural genes were found. FliA (
28
) and
FecI (
19
) sigma factors are in the group of modular nodes.
This is understandable, because both respond to very specific
cell conditions (flagellum biosynthesis and citrate-dependent
Fe
+
transport, respectively), and they affect the transcription
of few genes (43 and 6 genes, respectively). These results sug-
gest that the value may be a good predictor for global TFs.
Hierarchical nodes act as bridges keeping modules
connected
The characteristic path length is defined as the average of the
shortest paths between all pairs of nodes in a network. It is a
measure of the global connectivity of the network [38]. Using
an in silico strategy, the effect on the characteristic path
length when attacking hierarchical nodes was analyzed. In
order to do this, all hierarchical nodes and some modular
ones were removed one by one in decreasing order of connec-
tivity (Figure 1b). The removal of hierarchical nodes
increased, following a linear tendency, the characteristic path
length from 2.7 to 6.9. However, when the last two hierarchi-
cal nodes (flhDC and fur) were removed, a sudden change was
observed in the tendency, followed by a stabilization when
some modular nodes were removed, therefore supporting the
idea that removal of hierarchical nodes disintegrates the TRN
by breaking the bridges that keep modules together.
Identification of modules in the TRN
The removal of hierarchical nodes revealed 62 subnetworks
or modules (see Materials and methods; Additional data file
2) and left 691 isolated genes. An analysis of the biological
function of the isolated genes showed that many of them are
elements of the basal machinery of the cell (tRNAs and its
charging enzymes, DNA and RNA polymerases, ribosomal
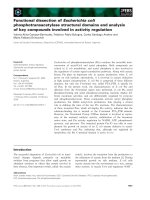
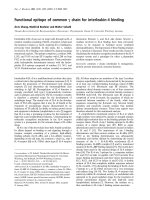
Identification of hierarchical and modular nodesFigure 1
Identification of hierarchical and modular nodes. (a) Distribution of the
clustering coefficient, C(k), and calculated value. The blue line represents
the C(k) power law. The dashed red line indicates the value obtained for
this C(k) distribution. Red triangles represent hierarchical nodes, while
green circles indicate modular nodes. (b) The characteristic path length
after cumulative removal of all hierarchical nodes and some modular ones.
The red dashed line indicates the sudden change in the original increasing
tendency when the last hierarchical TFs (FlhDC and Fur) were removed.
This suggests that the removal of hierarchical nodes broke the
connections bridging modules, thus disintegrating the TRN.
0
0.1
0.2
0.3
0.4
0.5
0.6
0.7
0.8
0.9
1
0 0.1 0.2 0.3 0.4 0.5 0.6 0.7 0.8 0.9 1
k/k
Clustering coefficient
κ = 50
0
1
2
3
4
5
6
7
8
None
rpoD
crp
fnr
IHF
fis
arcA
rpoS
rpoH
rpoN
narL
rpoE
hns
lrp
flhDC
fur
fliA
glnG
modE
cpxR
Cumulatively removed nodes
Characteristic path length
(a) (b)
max
κ αγ
α
=⋅
+1
k
max
κ γ=⋅k
max
Genome Biology 2008, Volume 9, Issue 10, Article R154 Freyre-González et al. R154.5
Genome Biology 2008, 9:R154
proteins and RNAs, enzymes of the tricarboxylic acid cycle
and respiratory chain, DNA methylation enzymes, and so on).
The regulation of these genes, whose products must be con-
stantly present in the cell, is mediated only by hierarchical
TFs. One of the identified modules (module 5) comprises 606
genes (35% of the analyzed TRN). This megamodule sug-
gested the existence of other elements, in addition to hierar-
chical nodes, that connect modules. We know that a TRN that
has been reconstructed while neglecting structural genes does
not show the existence of a megamodule (JAF-G, unpub-
lished data). Therefore, an intermodular gene was defined as
a structural gene whose expression is modulated by TFs
belonging to two or more submodules. To identify these inter-
modular genes, the megamodule was isolated and structural
genes removed. This revealed the submodule cores (islands of
modular TFs) shaping the megamodule (see Materials and
methods). The megamodule comprises 39 submodules con-
nected by the regulation of 136 intermodular genes, which are
organized into approximately 55 transcriptional units (Addi-
tional data file 3).
To determine the biological relevance of the theoretically
identified modules, two independent analyses were per-
formed. On the one hand, one of us (LGT-Q) used biological
knowledge to perform a manual annotation of identified
modules. On the other hand, two of us (JAF-G and JAA-P)
made a blind-automated annotation based on functional
class, according to the MultiFun system [39], that showed a
statistically significant enrichment (p-value <0.05; see Mate-
rials and methods). Both analyses showed similar conclu-
sions. The blind-automated method found that 97% of
modules show enrichment in terms of functional classes.
However, it was observed that the manual analysis added
subtle details that were not evident in the automated analysis
due to incompleteness in the MultiFun system (Additional
data file 2). At the module level, it was found that E. coli
mainly has systems for carbon source catabolism, cellular
stress response, and ion homeostasis. In addition, it was
found that the 39 submodules comprising the megamodule
could be grouped according to their biological functions into
seven regions interconnected by intermodular genes (Figure
2). The most interconnected regions involve nitrogen and sul-
fur assimilation, carbon source catabolism, cellular stress
response, respiration forms, and oxidative stress.
Inference of the hierarchy governing the TRN
For more than 20 years it has been recognized that regulatory
networks comprise complex circuits with different control
levels. This makes them able to control different subroutines
of the genetic program simultaneously [28,40]. Recently, glo-
bal topological analyses have suggested the existence of hier-
archical modularity in TRNs [2,7,8]. Previous works
proposed methodologies to infer this hierarchical modular
organization [9-11]. Unfortunately, the previous methodolog-
ical approaches have been shown to be inadequate to deal
with FFs and FBLs [10,11], two relevant topological struc-
tures. On the other hand, biological conclusions obtained
with these approaches were counterintuitive, as they placed,
in the highest hierarchical layers, TFs that respond to very
specific conditions of the cell and which, therefore, lack plei-
otropic effects.
Gottesman [28] defined a global TF as one that: regulates
many genes; entails regulated genes that participate in more
than one metabolic pathway; and coordinates the expression
of a group of genes when responding to a common need (for
detailed definitions of global and local TFs please refer to the
work of Martinez-Antonio and Collado-Vides [24]). Based on
Gottesman's ideas, it could be asked if a modular organization
requires a hierarchy to coordinate module responses. To
address this concern, based on the definition proposed by
Gottesman and using the concept of pleiotropy, a methodol-
ogy to infer the hierarchy governing the TRN was developed.
For this methodology, nodes belonging to the same module
were shrunk into a single node, and a bottom-up approach
was used (see Materials and methods). This approach places
each hierarchical TF in a specific layer, depending on two fac-
tors: theoretical pleiotropy (the number of regulated modules
and hierarchical TFs); and the presence of direct regulation
over hierarchical TFs placed in the immediate lower hierar-
chical layer. This second factor was taken into account
because a hierarchical TF may indirectly propagate its control
to other modules, by changing the expression pattern of a sec-
ond hierarchical TF that directly controls them. Given that a
hierarchical layer does not depend on the number of genes
regulated by a hierarchical TF, but on the number of modules,
it is worth mentioning that this approach is not based on
connectivity. Therefore, given that each module is in charge of
a different physiological response, it can be argued that this
approach is founded on pleiotropy.
Five global chains of command were found, showing the reg-
ulatory interactions between hierarchical TFs (Figure 3).
Each of the chains of command is in charge of global func-
tions in the cell. In addition, in the highest hierarchical layers,
the presence of six hierarchical TFs was observed, three of
them (RpoD, CRP, and FNR) governing more than one of
these global chains of command. The expression of IHF, in
spite of the fact that it only governs one global chain of com-
mand, can be affected by a different chain from a lower hier-
archy (RpoS) [41]. Each of these TFs sends signals of general
interest to a large number of genes in the cell. RpoD (
70
) is
the housekeeping sigma factor, and it can indicate to the cel-
lular machinery the growth phase of the cell or the lack of any
stress [42]. CRP-cAMP alerts the cell to low levels of energy
uptake, allowing a metabolic response [43]. IHF (besides Fis
and H-NS) senses DNA supercoiling, thus indirectly sensing
many environmental conditions (growth phase, energy level,
osmolarity, temperature, pH, and so on) that affect this DNA
property [44]. This supports the idea that DNA supercoiling
itself might act as a principal coordinator of global gene
expression [45,46]. Finally, FNR senses extracellular oxygen
Genome Biology 2008, Volume 9, Issue 10, Article R154 Freyre-González et al. R154.6
Genome Biology 2008, 9:R154
levels, permitting, through coregulation with ArcA and NarL,
a proper respiratory response [47,48]. RpoN, with
54
-
dependent activators, controls gene expression to coordinate
nitrogen assimilation [49]. RpoE (
24
) reacts to stress signals
outside the cytoplasmic membrane by transcriptional activa-
tion of genes encoding products involved in membrane pro-
tection or repair [50].
FFs mainly bridge modules shaping the TRN
hierarchical backbone
A remarkable feature of complex networks is the existence of
topological motifs [12,13]. It has been previously suggested
that they constitute the building blocks of complex networks
[8,12]. Nevertheless, recent studies have provided evidence
that overabundance of motifs does not have a functional or
evolutionary counterpart [51-54]. Indeed, some studies have
suggested that motifs could be by-products of biological net-
work organization and evolution [52,53,55]. In particular,
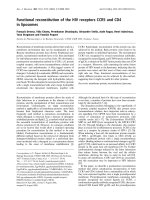
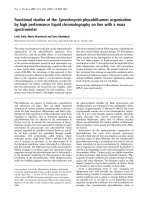
Empirical grouping, into seven regions, of submodules comprising the megamoduleFigure 2
Empirical grouping, into seven regions, of submodules comprising the megamodule. Each color represents a submodule, while intermodular genes are
shown in orange. Intermodular genes are placed inside the region that best associates with its most important physiological function. For example, the
intermodular gene amtB, positively regulated by NtrC (region A) and GadX (region D), encodes an ammonium transporter under acidic growing
conditions. Therefore, this gene was placed in the nitrogen and sulfur assimilation region (region A).
Region Physiological function
Involved submodules
5.4, 5.5, 5.6, 5.r7, 5.r9, 5.r10, 5.r19
B
5.8, 5.r5, r.r14, 5.r15, 5.r24, 5.r25
C
Carbon sources catabolism
5.7, 5.9, 5.11, 5.13, 5.r12, 5.r17
D
Cellular stress response
5.2, 5.3, 5.r1, 5.r2, 5.r3, 5.r6, 5.10, 5.r21, 5.r26
E
Phosphorus assimilation and cell division
5.1
F
Respiration forms and oxidative stress
5.12, 5.r4, 5.r8, 5.r11, 5.r16, 5.r18, 5.r20, 5.r22, 5.r23
G 5.r13
C
A
B
E
F
G
D
A
Nitrogen and sulfur assimilation
Amino acid, nucleotide, and cofactor biosynthesis
Motility
Genome Biology 2008, Volume 9, Issue 10, Article R154 Freyre-González et al. R154.7
Genome Biology 2008, 9:R154
work by Ingram et al. [54] has shown that the bi-fan motif can
exhibit a wide range of dynamic behaviors. Given that, we
concentrated our analysis on three-node motifs.
We identified the entire repertoire of three-node network
motifs present in the E. coli TRN by using the mfinder pro-
gram [12]. Thus, we identified two three-node network
motifs: the FF; and an alternative version of an FF merging an
FBL between the regulatory nodes. It suggests that the FF is
the fundamental three-node motif in the E. coli TRN. In order
to analyze FF participation in the hierarchy inferred by our
methodology, the effect of the removal of hierarchical nodes
on the total number of FFs in the TRN was analyzed (Figure
4a). The fraction of remaining FFs after cumulative removal
of hierarchical nodes, in decreasing connectivity order, was
computed. It was found that the sole removal of rpoD (
70
)
and crp, the two most-connected hierarchical nodes in the
TRN, decreased to 22% the total FFs. However, the removal
of all hierarchical nodes decreased the total FFs to 3.5%, in
agreement with previous work suggesting that FFs tend to
cluster around hubs [56]. Our results showed that 96.5% of
the total FFs are in the TRN bridge modules, while the
remaining 3.5% are within modules. This evidence suggests
that the FF role is to bridge modules, shaping a hierarchical
structure governed by hierarchical TFs.
The correlation between FF number and maximum connec-
tivity (number of links of the most-connected node, k
max
) for
each attacked network was analyzed (Figure 4b). It was found
that the FF number linearly correlated with the maximum
connectivity. As hierarchical nodes were removed, the FF
number decreased proportionally with the maximum connec-
tivity of the corresponding attacked network. All this shows
that hierarchical TFs are intrinsically related to FFs, suggest-
ing that, in addition to bridging modules, FFs are the back-
bone of the hierarchical organization of the TRN.
Discussion
Contrary to what has been previously reported [9,10], we
found FBLs involving different hierarchical layers, which
implies that the expression of some hierarchical TFs also may
depend on modular TFs, thus allowing the reconfiguration of
the regulatory machinery in response to the fine environmen-
tal sensing performed, through allosterism, by modular TFs.
On the other hand, a network with FBLs poses a paradox
when inferring its hierarchy. Given the circular nature of
interactions, what nodes should be placed in a higher hierar-
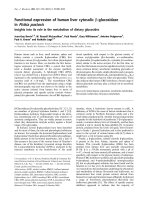
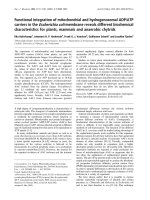
Hierarchical modular organization map of subroutines comprising the genetic program in E. coliFigure 3
Hierarchical modular organization map of subroutines comprising the
genetic program in E. coli. Each color represents a module, while
hierarchical TFs are shown in red. Black arrows indicate the regulatory
interactions between hierarchical TFs. For the sake of clarity, RpoD
interactions are not shown, and the megamodule is shown as a single
yellow node at the bottom. However, according to our data, RpoD affects
the transcription of all hierarchical TFs, except RpoE, while RpoD, RpoH,
and LexA (a modular TF) could affect RpoD expression. Red rounded-
corner rectangles bound hierarchical layers. The presence of five global
chains of command is noted: host/free-life sensor and type 1 fimbriae
(Lrp); replication, recombination, pili, and extracytoplasmic elements (Fis,
Fur, H-NS, FlhDC); respiration forms (NarL); starvation stress (ArcA,
RpoS); and heat shock (RpoH). Lrp appears disconnected from other
hierarchical TFs because, to date, it is only known that RpoD, Lrp, and
GadE (a modular TF) modulate its expression.
RpoD
IHF CRP
ArcA
Fis
Lrp
Fur
FlhDC
H-NS
RpoS
FNR
NarL
RpoN
RpoE
RpoH
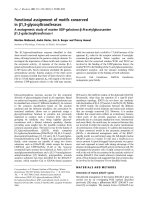
FFs bridge modules and shape the backbone of the hierarchy governing the TRNFigure 4
FFs bridge modules and shape the backbone of the hierarchy governing the
TRN. (a) Remaining TFs after cumulative removal of hierarchical nodes.
The removal of all hierarchical nodes decreased to 3.5% the total FFs. (b)
Correlation between FF number and maximum connectivity for each
attacked network. The FF number is proportional to the number of links
of the most-connected hierarchical node, thus suggesting that FFs are the
backbone of the hierarchy in the TRN.
0%
10%
20%
30%
40%
50%
60%
70%
80%
90%
100%
None
rpoD
crp
fnr
IHF
fis
arcA
rpoS
rpoH
rpoN
narL
rpoE
hns
lrp
flhDC
fur
Cumulatively removed nodes
Remaining FFs
R
2
= 0.997
0
400
800
1,200
1,600
2,000
2,400
2,800
0 200 400 600 800 1,000 1,200
k
max
Number of FFs
(a) (b)
Genome Biology 2008, Volume 9, Issue 10, Article R154 Freyre-González et al. R154.8
Genome Biology 2008, 9:R154
chical layer? This paradox was solved using the value to
identify hierarchical and modular elements and then using
the theoretical pleiotropy to infer the hierarchy governing the
TRN.
Global TFs have been proposed using diverse relative meas-
ures [9,10,13,24,27,28]; unfortunately, currently there is not
a consensus on the best criteria to identify them. Gottesman's
seminal paper [28] was the first to define the properties for
which a TF should be considered a global TF. Martinez-Anto-
nio and Collado-Vides [24] conducted a review and analyzed
several properties, searching for diagnostic criteria to identify
global TFs. Nevertheless, while these authors did shed light
on relevant properties that could contribute to identification
of global TFs, they did not reach any explicit diagnostic crite-
ria. The value showed high predictive power, as all known
global TFs were identified, and even more, the existence of
two new global TFs is proposed: FlhDC and Fur. Recently, an
analysis of the TRN of Bacillus subtilis supported the predic-
tive ability of this method (JAF-G, unpublished data), offer-
ing the possible first mathematical criterion to identify global
TFs in a cell. This criterion allowed us to show that, in spite of
its apparent complexity, the TRN of E. coli possesses a singu-
lar elegance in the organization of its genetic program. Only
15 hierarchical TFs (0.89% of the total nodes) coordinate the
response of the 100 identified modules (50.23% of the total
nodes). All the modules identified by Resendis-Antonio et al.
[7] were recovered by our methodology. However, given that
in this study the TRN includes structural genes, we could
identify 87 new modules. Therefore, our approach allows
fine-grain identification of modules, for example, modules
responsible for catabolism of specific carbon sources. There
are 691 genes (40.84% of the total nodes) that mainly encode
cellular basal elements. The existence of one megamodule led
us to define intermodular genes and to identify 136 of them
(8.04% of the total nodes). It was found that submodules with
similar functions tend to agglomerate into seven regions, thus
shaping the megamodule. Therefore, at a TRN level, data
processing follows independent casual chains for each mod-
ule, which are globally governed by hierarchical TFs. Thus,
hierarchical TFs coordinate the cellular system responses as a
whole by letting modules get ready to react in response to
external stimuli of common interest, while modules retain
their independence, responding to stimuli of local interest.
On the other hand, intermodular genes integrate, at the pro-
moter level, the incoming signals from different modules.
These promoters act as molecular multiplexers, integrating
different physiological signals in order to make complex deci-
sions. Examples of this are the aceBAK and carAB operons.
The aceBAK operon encodes glyoxylate shunt enzymes. The
expression of this operon is modulated by FruR [57] (module
5.11, gluconeogenesis) and IclR [58] (module 5.13, aerobic
fatty acid oxidation pathway). This operon could integrate the
responses of these two modules in order to keep the balance
between energy production from fatty acid oxidation and glu-
coneogenesis activation for biosynthesis of building blocks.
On the other hand, the carAB operon encodes a carbamoyl
phosphate synthetase. The expression of this operon is con-
trolled by PurR [59] (module 5.r25, purine and pyrimidine
biosynthesis), ArgR [60] (module 5.r5,
L-ornithine and L-
arginine biosynthesis), and PepA [59] (5.r24, carbamoyl
phosphate biosynthesis and aminopeptidase A/I regulation).
This is an example where different modules could work as
coordinators of a shared resource. The promoter of this
operon could integrate the responses of the modules to coor-
dinate the expression of an enzyme whose product, car-
bamoyl phosphate, is a common intermediary for the de novo
biosynthesis of pyrimidines and arginine. This evidence
shows a novel nonpyramidal architecture in which independ-
ent modules are globally governed by hierarchical transcrip-
tion factors while module responses are integrated at the
promoter level by intermodular genes.
The clustering coefficient is a strong indicator of modularity
in a network. It also quantifies the presence of triangular sub-
structures. The TRN shows a high average clustering coeffi-
cient, implying a high amount of triangular substructures.
Indeed, the probability of a node being a common vertex of n
triangles decreases as the number of involved triangles
increases, following the power law T(n) ~ n
-1.95
(Figure S1c in
Additional data file 1). In other words, if a node is arbitrarily
chosen, the probability of it being the vertex of a few triangles
is high. This also implies that many triangles have as a com-
mon vertex a small group of nodes. On the other hand, in a
directed graph there are only two basic triangular substruc-
tures: FFs and three-node FBLs. By merging two-node FBLs
with these two triangular substructures, it is possible to create
variations of them. It was found that the number of two-node
and three-node FBLs (eight and five FBLs, respectively) was
much lower than the total number of FFs (2,674 FFs). These
results imply that triangular substructures are mainly FFs or
variations of them. Besides, FFs mainly comprise, at least,
one hierarchical node [56] (Figure 4). This is in agreement
with the observation that many triangles possess as a com-
mon vertex a small group of nodes. Here it was shown that
hierarchical nodes and their interactions shape the backbone
of the TRN hierarchy. Therefore, FFs are strongly involved in
the hierarchical modular organization of the TRN of E. coli,
where they act as bridges connecting genes with diverse phys-
iological functions. Resendis-Antonio et al. [7] showed that
FFs are mainly located within modules. Nevertheless, given
that in this study it was determined that hubs do not belong
to modules, it was found that FFs shape the hierarchy of the
TRN bridging modules in a hierarchical fashion. This sup-
ports the findings of Mazurie et al. [52], showing that FFs are
a consequence of the network organization and they are not
involved in specific physiological functions.
Conclusions
The study of the topological organization of biological net-
works is still an interesting research topic. Methodologies for
Genome Biology 2008, Volume 9, Issue 10, Article R154 Freyre-González et al. R154.9
Genome Biology 2008, 9:R154
node classification and natural decomposition, such as the
one proposed herein, allow identification of key components
of a biological network. This approach also enables the analy-
sis of complex networks by using a zoomable map approach,
helping us understand how their components are organized
in a meaningful way. In addition, component classification
could shed light on how different networks (transcriptional,
metabolic, protein-protein, and so on) interface with each
other, thus providing an integral understanding of cellular
processes. The herein-proposed approach has promising
applications for unraveling the functional architecture of the
TRNs of other organisms, allowing us to gain a better under-
standing of their key elements and their interrelationships. In
addition, it provides a large set of experimentally testable
hypotheses, from novel FBLs to intermodular genes, which
could be a useful guide for experimentalists in the systems
biology field. Finally, network decomposition into modules
with well-defined inputs and outputs, and the suggestion that
they process information in independent casual chains gov-
erned by hierarchical TFs, would eventually help in the
isolation, and subsequent modeling, of different cellular
processes.
Materials and methods
Data extraction and TRN reconstruction
To reconstruct the TRN, structural genes, sigma factor-
encoding genes, and regulatory protein-encoding genes were
included (the full data set is available as Additional data file
4). Two flat files with data (NetWorkSet.txt and SigmaNet-
WorkSet.txt) were downloaded from RegulonDB version 5.0
[18,61]. From the NetWorkSet.txt file, 3,001 interactions
between regulatory proteins and regulated genes were
obtained. From the SigmaNetWorkSet.txt file, 1,488 interac-
tions between sigma factors and their transcribed genes were
obtained. Next, this information was complemented with 81
new interactions found in a literature review of transcribed
promoters by the seven known sigma factors of E. coli (these
interactions account for 5.4% of the total sigma factor inter-
actions in the reconstructed TRN and currently are integrated
and available in RegulonDB version 6.1). The criteria used to
gather the additional sigma factor interactions from the liter-
ature were the same as those used by the RegulonDB team of
curators. In our graphic model, sigma factors were included
as activator TFs because their presence is a necessary condi-
tion for transcription to occur. Indeed, some works [62-64]
have shown that there are TFs that are able to interact with
free polymerase before binding to a promoter, in a way remi-
niscent of the mechanism used by sigma factors. To avoid
duplicated interactions, heteromeric TFs (for example, IHF
encoded by ihfA and ihfB genes, HU encoded by hupA and
hupB, FlhDC encoded by flhC and flhD, and GatR encoded by
gatR_1 and gatR_2) were represented as only one node,
given that there is no evidence indicating that any of the sub-
units have regulatory activity per se.
Software
For the analysis and graphic display of the TRN, Cytoscape
[65] was used. To identify FFs, the mfinder program [12] was
used. To calculate values, computational annotations, and
other numeric and informatics tasks, Microsoft Excel and
Microsoft Access were used.
Algorithm for FBL enumeration
First, The TRN was represented, neglecting autoregulation,
as a matrix of signs (S). Thus, each S
i,j
element could take a
value in the set {+,-,D,0}, where '+' means that i activates j
transcription, '-' means than i represses j transcription, D
means that i has a dual effect (both activator and repressor)
over j, and 0 means that there is no interaction between i and
j. Second, All nodes with incoming connectivity or outgoing
connectivity equal to zero were removed. Third, the transitive
closure matrix of the TRN (M) was computed using a modi-
fied version of the Floyd-Warshall algorithm [23]. Each
M
i,j
element could take a value in the set {0,1}, where 0
means that there is no path between i and j and 1 means that,
at least, there is one path between i and j. Fourth, for each
M
i,i
element equal to 1, a depth-first search beginning at node
i was done, marking each visited node. The depth-first search
stopping criterion relies on two conditions: first, when node i
is visited again, that is, an FBL (i i) is identified; sec-
ond, when a previously visited node, different from i, is vis-
ited again. Fifth, isomorphic subgraphs were discarded from
identified FBLs.
value calculation
For each node in the TRN, connectivity (as a fraction of max-
imum connectivity, k
max
) and the clustering coefficient were
calculated. Next, the C(k) distribution was obtained using
least-squares fitting. Given C(k) = k
-
, the equation:
dC(k)/dk = -1
has as its solution the formula:
Module identification
The algorithm to identify modules used a natural decomposi-
tion approach. First, the value was calculated for the TRN of
E. coli, yielding the value of 50. Then, all hierarchical nodes
(nodes with k > ) were removed from the network. There-
fore, the TRN breaks up into isolated islands, each compris-
ing interconnected nodes. Finally, each island was considered
a module.
Identification of submodules and intermodular genes
comprising the megamodule
The megamodule was isolated and all structural genes were
removed, breaking it up into isolated islands. Next, each
island was identified as a submodule. Finally, all the removed
structural genes and their interactions were added to the net-
κ αγ
α
=⋅
+1
k
max
.
Genome Biology 2008, Volume 9, Issue 10, Article R154 Freyre-González et al. R154.10
Genome Biology 2008, 9:R154
work according to the following rule: if a structural gene G is
regulated only by TFs belonging to submodule M, then gene
G was added to submodule M. On the contrary, if gene G is
regulated by TFs belonging to two or more submodules, then
gene G was classified as an intermodular gene.
Manual annotation of identified modules
Manual annotation of physiological functions of identified
modules was done using the biological information available
in RegulonDB [18,61] and EcoCyc [66,67].
Computational annotation of identified modules
Each gene was annotated with its corresponding functional
class according to Monica Riley's MultiFun system, available
via the GeneProtEC database [39,68]. Next, p-values, as a
measure of randomness in functional class distributions
through identified modules, were computed based on the fol-
lowing hypergeometric distribution: let N = 1,692 be the total
number of genes in the TRN and A the number of these genes
with a particular F annotation; the p-value is defined as the
probability of observing, at least, x genes with an F annotation
in a module with n genes. This p-value is determined with the
following formula:
Thus, for each module, the p-value of each functional assign-
ment present in the module was computed. The functional
assignment of the module was the one that showed the lowest
p-value, if and only if it was less than 0.05.
Inference of the hierarchy
To infer the hierarchy, a shrunken network was used, where
each node represents a module or a hierarchical element.
Hierarchical layers were created following a bottom-up
approach and considering the number of regulated elements
(theoretical pleiotropy) by hierarchical nodes, neglecting
autoregulation, as follows. First, all nodes belonging to the
same module were shrunk into a single node. Second, for each
hierarchical element, the theoretical pleiotropy was com-
puted. Third, the hierarchical element with lower theoretical
pleiotropy and its regulated modules were placed in the lower
hierarchical layer. Fourth, each hierarchical element and its
regulated modules were added one by one in order of increas-
ing theoretical pleiotropy. Fifth, if the added hierarchical ele-
ment regulated, at least, one hierarchical element in the
immediate lower layer, a new hierarchical layer was created;
otherwise, the hierarchical element was added to the same
hierarchical layer.
Abbreviations
FBL, feedback loop; FF, feedforward topological motif; TF,
transcription factor; TRN, transcriptional regulatory
network.
Authors' contributions
JAF-G and JC-V designed the research; JAF-G conceived the
approach and designed algorithms; JAA-P and LGT-Q con-
tributed to the algorithm to infer hierarchy; JC-V proposed
the computational annotation of modules; JAF-G, JAA-P,
and LGT-Q performed research; JAF-G, JAA-P, and LGT-Q
contributed analytic tools; JAF-G, JAA-P, and LGT-Q ana-
lyzed data; JAF-G, JAA-P, LGT-Q, and JC-V wrote the paper.
Additional data files
The following additional data are available. Additional data
file 1 contains the topological properties of the transcriptional
regulatory network of E. coli. Additional data file 2 is a table
listing all the modules identified in this study and their man-
ual and computational annotations. Additional data file 3
contains a listing of all the intermodular genes found in this
study, their biological descriptions and roles as integrative
elements. Additional data file 4 is a flat file with the full data
set for the E. coli transcriptional regulatory network recon-
structed for our analyses as described in the Materials and
methods section.
Additional data file 1Topological properties of the transcriptional regulatory network of E. coliTopological properties of the transcriptional regulatory network of E. coli.Click here for fileAdditional data file 2Modules identified in this study and their manual and computa-tional annotationsModules identified in this study and their manual and computa-tional annotations.Click here for fileAdditional data file 3Intermodular genes found in this study, their biological descrip-tions and roles as integrative elementsIntermodular genes found in this study, their biological descrip-tions and roles as integrative elements.Click here for fileAdditional data file 4Full data set for the E. coli transcriptional regulatory network reconstructed for our analysesFull data set for the E. coli transcriptional regulatory network reconstructed for our analyses.Click here for file
Acknowledgements
We thank Veronika E Rohen for critical reading of the statistical method-
ology used for the computational annotation of modules. We thank Mario
Sandoval for help in codifying the algorithm for FBL enumeration. We also
thank Patricia Romero for technical support. JAF-G was supported by PhD
fellowship 176341 from CONACyT-México and was a recipient of a grad-
uate complementary fellowship from DGEP-UNAM. This work was par-
tially supported by grants 47609-A from CONACyT, IN214905 from
PAPIIT-UNAM, and NIH RO1 GM071962-04 to JC-V.
References
1. Jacob F, Monod J: Genetic regulatory mechanisms in the syn-
thesis of proteins. J Mol Biol 1961, 3:318-356.
2. Barabási AL, Oltvai ZN: Network biology: understanding the
cell's functional organization. Nat Rev Genet 2004, 5:101-113.
3. Variano EA, McCoy JH, Lipson H: Networks, dynamics, and
modularity. Phys Rev Lett 2004, 92:188701.
4. Oosawa C, Savageau MA: Effects of alternative connectivity on
behavior of randomly constructed Boolean networks. Physica
D 2002, 170:143-161.
5. Hartwell LH, Hopfield JJ, Leibler S, Murray AW: From molecular
to modular cell biology. Nature 1999, 402:C47-C52.
6. Gutierrez-Ríos RM, Freyre-González JA, Resendis O, Collado-Vides J,
Saier M, Gosset G: Identification of regulatory network topo-
logical units coordinating the genome-wide transcriptional
response to glucose in Escherichia coli. BMC Microbiol 2007,
7:53.
7. Resendis-Antonio O, Freyre-González JA, Menchaca-Méndez R,
Gutiérrez-Ríos RM, Martínez-Antonio A, Avila-Sánchez C, Collado-
Vides J: Modular analysis of the transcriptional regulatory net-
work of E. coli. Trends Genet 2005, 21:16-20.
8. Dobrin R, Beg QK, Barabási AL, Oltvai ZN: Aggregation of topo-
logical motifs in the Escherichia coli transcriptional regula-
tory network. BMC Bioinformatics 2004, 5:10.
p
A
i
NA
ni
N
n
ix
n
-value =
⎛
⎝
⎜
⎞
⎠
⎟
−
−
⎛
⎝
⎜
⎞
⎠
⎟
⎛
⎝
⎜
⎞
⎠
⎟
=
∑
.
Genome Biology 2008, Volume 9, Issue 10, Article R154 Freyre-González et al. R154.11
Genome Biology 2008, 9:R154
9. Ma HW, Buer J, Zeng AP: Hierarchical structure and modules in
the Escherichia coli transcriptional regulatory network
revealed by a new top-down approach. BMC Bioinformatics 2004,
5:199.
10. Ma HW, Kumar B, Ditges U, Gunzer F, Buer J, Zeng AP: An
extended transcriptional regulatory network of Escherichia
coli and analysis of its hierarchical structure and network
motifs. Nucleic Acids Res 2004, 32:6643-6649.
11. Yu H, Gerstein M: Genomic analysis of the hierarchical struc-
ture of regulatory networks. Proc Natl Acad Sci USA 2006,
103:14724-14731.
12. Milo R, Shen-Orr S, Itzkovitz S, Kashtan N, Chklovskii D, Alon U:
Network motifs: simple building blocks of complex
networks. Science 2002, 298:824-827.
13. Shen-Orr SS, Milo R, Mangan S, Alon U: Network motifs in the
transcriptional regulation network of Escherichia coli. Nat
Genet 2002, 31:64-68.
14. Smits WK, Kuipers OP, Veening JW: Phenotypic variation in bac-
teria: the role of feedback regulation. Nat Rev Microbiol 2006,
4:259-271.
15. Thieffry D, Huerta AM, Pérez-Rueda E, Collado-Vides J: From spe-
cific gene regulation to genomic networks: a global analysis
of transcriptional regulation in Escherichia coli. Bioessays 1998,
20:433-440.
16. Thomas R, Kaufman M: Multistationarity, the basis of cell differ-
entiation and memory. I. Structural conditions of multista-
tionarity and other nontrivial behavior. Chaos 2001,
11:170-179.
17. Ravasz E, Somera AL, Mongru DA, Oltvai ZN, Barabási AL: Hierar-
chical organization of modularity in metabolic networks. Sci-
ence 2002, 297:1551-1555.
18. Salgado H, Gama-Castro S, Peralta-Gil M, Díaz-Peredo E, Sánchez-
Solano F, Santos-Zavaleta A, Martínez-Flores I, Jiménez-Jacinto V,
Bonavides-Martínez C, Segura-Salazar J, Martínez-Antonio A, Col-
lado-Vides J: RegulonDB (version 5.0): Escherichia coli K-12
transcriptional regulatory network, operon organization,
and growth conditions. Nucleic Acids Res 2006, 34(Database
issue):D394-D397.
19. Ravasz E, Barabási AL: Hierarchical organization in complex
networks. Phys Rev E Stat Nonlin Soft Matter Phys 2003, 67:026112.
20. Thomas R: Laws for the dynamics of regulatory networks. Int
J Dev Biol 1998, 42:479-485.
21. Thieffry D, Romero D: The modularity of biological regulatory
networks. Biosystems 1999, 50:49-59.
22. Kaern M, Elston TC, Blake WJ, Collins JJ: Stochasticity in gene
expression: from theories to phenotypes. Nat Rev Genet 2005,
6:451-464.
23. Lipschutz S: Schaum's Outline of Data Structures First edition. New
York: McGraw-Hill; 1986.
24. Martínez-Antonio A, Collado-Vides J: Identifying global regula-
tors in transcriptional regulatory networks in bacteria. Curr
Opin Microbiol 2003, 6:482-489.
25. Maslov S, Sneppen K: Specificity and stability in topology of pro-
tein networks. Science 2002, 296:910-913.
26. Browning DF, Busby SJ: The regulation of bacterial transcrip-
tion initiation. Nat Rev Microbiol 2004, 2:57-65.
27. Madan Babu M, Teichmann SA: Evolution of transcription factors
and the gene regulatory network in Escherichia coli. Nucleic
Acids Res 2003, 31:1234-1244.
28. Gottesman S:
Bacterial regulation: global regulatory
networks. Annu Rev Genet 1984, 18:415-441.
29. Stojiljkovic I, Bäumler AJ, Hantke K: Fur regulon in gram-negative
bacteria. Identification and characterization of new iron-reg-
ulated Escherichia coli genes by a fur titration assay. J Mol Biol
1994, 236:531-545.
30. Angerer A, Braun V: Iron regulates transcription of the
Escherichia coli ferric citrate transport genes directly and
through the transcription initiation proteins. Arch Microbiol
1998, 169:483-490.
31. Escolar L, Pérez-Martín J, de Lorenzo V: Coordinated repression
in vitro of the divergent fepA-fes promoters of Escherichia coli
by the iron uptake regulation (Fur) protein. J Bacteriol 1998,
180:2579-2582.
32. Lavrrar JL, Christoffersen CA, McIntosh MA: Fur-DNA interac-
tions at the bidirectional fepDGC-entS promoter region in
Escherichia coli. J Mol Biol 2002, 322:983-995.
33. Zhang Z, Gosset G, Barabote R, Gonzalez CS, Cuevas WA, Saier MH
Jr: Functional interactions between the carbon and iron utili-
zation regulators, Crp and Fur, in Escherichia coli. J Bacteriol
2005, 187:980-990.
34. Outten FW, Djaman O, Storz G: A suf operon requirement for
Fe-S cluster assembly during iron starvation in Escherichia
coli. Mol Microbiol 2004, 52:861-872.
35. Liu X, Matsumura P: The FlhD/FlhC complex, a transcriptional
activator of the Escherichia coli flagellar class II operons. J
Bacteriol 1994, 176:7345-7351.
36. Stafford GP, Ogi T, Hughes C: Binding and transcriptional acti-
vation of non-flagellar genes by the Escherichia coli flagellar
master regulator FlhD
2
C
2
. Microbiology 2005, 151:1779-1788.
37. Prüss BM, Liu X, Hendrickson W, Matsumura P: FlhD/FlhC-regu-
lated promoters analyzed by gene array and lacZ gene
fusions. FEMS Microbiol Lett 2001, 197:91-97.
38. Albert R, Jeong H, Barabasi AL: Error and attack tolerance of
complex networks. Nature 2000, 406:378-382.
39. Serres MH, Goswami S, Riley M: GenProtEC: an updated and
improved analysis of functions of Escherichia coli K-12
proteins. Nucleic Acids Res 2004, 32(Database issue):D300-D302.
40. Neidhardt FC, Savageau M: Regulation beyond the operon. In
Escherichia coli and Salmonella: Cellular and Molecular Biology Second
edition. Edited by: Neidhardt FC. Washington DC: American Society
for Microbiology; 1996:1310-1324.
41. Aviv M, Giladi H, Schreiber G, Oppenheim AB, Glaser G: Expression
of the genes coding for the Escherichia coli integration host
factor are controlled by growth phase, rpoS, ppGpp and by
autoregulation. Mol Microbiol 1994, 14:1021-1031.
42. Jishage M, Iwata A, Ueda S, Ishihama A: Regulation of RNA
polymerase sigma subunit synthesis in Escherichia coli: intra-
cellular levels of four species of sigma subunit under various
growth conditions. J Bacteriol 1996, 178:5447-5451.
43. Park YH, Lee BR, Seok YJ, Peterkofsky A: In vitro reconstitution of
catabolite repression in Escherichia coli. J Biol Chem 2006,
281:6448-6454.
44. Goosen N, van de Putte P: The regulation of transcription initi-
ation by integration host factor. Mol Microbiol 1995, 16:1-7.
45. Blot N, Mavathur R, Geertz M, Travers A, Muskhelishvili G: Home-
ostatic regulation of supercoiling sensitivity coordinates
transcription of the bacterial genome. EMBO Rep 2006,
7:710-715.
46. Travers A, Muskhelishvili G: DNA supercoiling - a global tran-
scriptional regulator for enterobacterial growth? Nat Rev
Microbiol 2005, 3:157-169.
47. Partridge JD, Sanguinetti G, Dibden DP, Roberts RE, Poole RK, Green
J: Transition of Escherichia coli from aerobic to micro-aerobic
conditions involves fast and slow reacting regulatory
components. J Biol Chem 2007, 282:11230-11237.
48. Ravcheev DA, Gerasimova AV, Mironov AA, Gelfand MS: Compar-
ative genomic analysis of regulation of anaerobic respiration
in ten genomes from three families of gamma-proteobacte-
ria (Enterobacteriaceae, Pasteurellaceae, Vibrionaceae).
BMC Genomics 2007, 8:54.
49. Reitzer L, Schneider BL: Metabolic context and possible physio-
logical themes of s
54
-dependent genes in Escherichia coli.
Microbiol Mol Biol Rev 2001, 65:422-444.
50. Hayden JD, Ades SE: The extracytoplasmic stress factor,
E
, is
required to maintain cell envelope integrity in Escherichia
coli. PLoS ONE 2008, 3:e1573.
51. Dwight Kuo P, Banzhaf W, Leier A: Network topology and the
evolution of dynamics in an artificial genetic regulatory net-
work model created by whole genome duplication and
divergence. Biosystems 2006, 85:177-200.
52. Mazurie A, Bottani S, Vergassola M: An evolutionary and func-
tional assessment of regulatory network motifs. Genome Biol
2005, 6:R35.
53. Solé RV, Valverde S: Are network motifs the spandrels of cellu-
lar complexity? Trends Ecol Evol 2006, 21:419-422.
54. Ingram PJ, Stumpf MP, Stark J: Network motifs: structure does
not determine function. BMC Genomics 2006, 7:108.
55. Cordero OX, Hogeweg P: Feed-forward loop circuits as a side
effect of genome evolution. Mol Biol Evol 2006, 23:1931-1936.
56. Vázquez A, Dobrin R, Sergi D, Eckmann JP, Oltvai ZN, Barabási AL:
The topological relationship between the large-scale
attributes and local interaction patterns of complex
networks. Proc Natl Acad Sci USA 2004, 101:17940-17945.
57. Ramseier TM, Nègre D, Cortay JC, Scarabel M, Cozzone AJ, Saier MH
Jr: In vitro binding of the pleiotropic transcriptional regula-
tory protein, FruR, to the fru, pps, ace, pts and icd operons of
Genome Biology 2008, Volume 9, Issue 10, Article R154 Freyre-González et al. R154.12
Genome Biology 2008, 9:R154
Escherichia coli and Salmonella typhimurium. J Mol Biol 1993,
234:28-44.
58. Yamamoto K, Ishihama A: Two different modes of transcription
repression of the Escherichia coli acetate operon by IclR. Mol
Microbiol 2003, 47:183-194.
59. Devroede N, Huysveld N, Charlier D: Mutational analysis of
intervening sequences connecting the binding sites for inte-
gration host factor, PepA, PurR, and RNA polymerase in the
control region of the Escherichia coli carAB operon, encoding
carbamoylphosphate synthase. J Bacteriol 2006, 188:3236-3245.
60. Caldara M, Charlier D, Cunin R: The arginine regulon of
Escherichia coli: whole-system transcriptome analysis discov-
ers new genes and provides an integrated view of arginine
regulation. Microbiology 2006, 152:3343-3354.
61. RegulonDB 6.1 [ />62. Griffith KL, Shah IM, Myers TE, O'Neill MC, Wolf RE Jr: Evidence
for "pre-recruitment" as a new mechanism of transcription
activation in Escherichia coli: the large excess of SoxS binding
sites per cell relative to the number of SoxS molecules per
cell. Biochem Biophys Res Commun 2002, 291:979-986.
63. Martin RG, Gillette WK, Martin NI, Rosner JL: Complex formation
between activator and RNA polymerase as the basis for
transcriptional activation by MarA and SoxS in Escherichia
coli. Mol Microbiol 2002, 43:355-370.
64. Griffith KL, Wolf RE Jr: Genetic evidence for pre-recruitment
as the mechanism of transcription activation by SoxS of
Escherichia coli: the dominance of DNA binding mutations of
SoxS. J Mol Biol 2004, 344:1-10.
65. Shannon P, Markiel A, Ozier O, Baliga NS, Wang JT, Ramage D, Amin
N, Schwikowski B, Ideker T: Cytoscape: a software environment
for integrated models of biomolecular interaction networks.
Genome Res 2003, 13:2498-2504.
66. Keseler IM, Collado-Vides J, Gama-Castro S, Ingraham J, Paley S,
Paulsen IT, Peralta-Gil M, Karp PD: EcoCyc: a comprehensive
database resource for Escherichia coli. Nucleic Acids Res 2005,
33(Database issue):D334-D337.
67. EcoCyc: Encyclopedia of Escherichia coli K-12 Genes and
Metabolism [ />68. GenProtEC: E. coli Genome and Proteome Database [http:/
/genprotec.mbl.edu/]
69. MultiFun [ />