Báo cáo y học: " A computational approach for genome-wide mapping of splicing factor binding site" pdf
Bạn đang xem bản rút gọn của tài liệu. Xem và tải ngay bản đầy đủ của tài liệu tại đây (2.56 MB, 14 trang )
Genome Biology 2009, 10:R30
Open Access
2009Akermanet al.Volume 10, Issue 3, Article R30
Method
A computational approach for genome-wide mapping of splicing
factor binding sites
Martin Akerman
*
, Hilda David-Eden
*
, Ron Y Pinter
†
and Yael Mandel-
Gutfreund
*
Addresses:
*
Department of Biology, the Technion - Israel Institute of Technology, Haifa 32000, Israel.
†
Department of Computer Science,
Technion - Israel Institute of Technology, Haifa 32000, Israel.
Correspondence: Yael Mandel-Gutfreund. Email:
© 2009 Akerman et al.; licensee BioMed Central Ltd.
This is an open access article distributed under the terms of the Creative Commons Attribution License ( which
permits unrestricted use, distribution, and reproduction in any medium, provided the original work is properly cited.
Mapping splicing factor binding sites<p>A computational method is presented for genome-wide mapping of splicing factor binding sites that considers both the genomic envi-ronment and evolutionary conservation.</p>
Abstract
Alternative splicing is regulated by splicing factors that serve as positive or negative effectors,
interacting with regulatory elements along exons and introns. Here we present a novel
computational method for genome-wide mapping of splicing factor binding sites that considers both
the genomic environment and the evolutionary conservation of the regulatory elements. The
method was applied to study the regulation of different alternative splicing events, uncovering an
interesting network of interactions among splicing factors.
Background
Alternative splicing (AS) is a post-transcriptional process
responsible for producing distinct protein isoforms as well as
down-regulation of translation. Many experimental and com-
putational studies revealed that AS can be regulated in a tis-
sue-specific manner [1-4] during embryonic development [5]
or in response to particular cellular stimuli [6]. AS regulation
is known to be mediated by many splicing factors (SFs), gen-
erally belonging to the serine-arginine-rich (SR) and hetero-
geneous nuclear ribonucleoprotein (hnRNP) families [7].
These SFs can instigate positive or negative effects on the
splicing reaction by differentially interacting with exonic or
intronic splicing enhancers and silencers.
SFs tend to assemble into a large complex known as the spli-
ceosome [8]. Despite their remarkable diversity, SFs share
common characteristics. Several SFs, such as the polypyrimi-
dine tract-binding protein (PTB) [9] and hnRNP A1 [10], bind
the pre-mRNA in multimeric units. In several cases the bind-
ing sites are found in relatively long RNA stretches, such as
the polypyrimidine tract that harbors binding sites for PTB
and CELF proteins [11], the poly U sequences (length 5-10
nucleotides) that bind the TIA1/TIAL1 proteins [12], and G-
rich sequences (between one to several G triplets) that have
been shown to bind the hnRNP H/F [13]. Another example is
the NOVA-1 splicing factor, which was reported to bind clus-
ters of YCAY sequences that are specifically located nearby
the splice sites of alternatively spliced exons [14]. The prefer-
ence of some of the SFs to bind consecutive elements can par-
tially be explained by the modularity of their structure,
usually possessing several RNA recognition motifs (RRMs),
which are involved in RNA binding [15].
As is true with many regulatory sequences, splicing regula-
tory elements tend to be conserved among species [16]. These
results are consistent with the overall high evolutionary con-
servation levels observed in AS-related introns [17,18] and in
the codon wobble position of alternative exons [19]. Further-
more, high evolutionary conservation has been associated
with constitutive splicing. In a recent study, Voelker and co-
Published: 18 March 2009
Genome Biology 2009, 10:R30 (doi:10.1186/gb-2009-10-3-r30)
Received: 18 December 2008
Revised: 26 February 2009
Accepted: 18 March 2009
The electronic version of this article is the complete one and can be
found online at /> Genome Biology 2009, Volume 10, Issue 3, Article R30 Akerman et al. R30.2
Genome Biology 2009, 10:R30
authors [20] identified sequence motifs that resemble cis-
regulatory binding sites and that were found to be conserved
in constitutive exons of six eutherian mammals. Unexpect-
edly high evolutionary conservation was also observed in
upstream distal splice sites in tandem acceptors that are con-
stitutively spliced [21]. Clustering of evolutionarily conserved
cis-regulatory elements has been previously demonstrated
for transcription factors binding sites. Recent transcription
factors binding site prediction tools have demonstrated that
consideration of neighboring effects dramatically improves
prediction performance compared to strategies that consider
only a single site [22-25].
In recent years, several methodologies for identifying splicing
factor binding sites (SFBSs) have been developed [19,26-29].
Generally, these methods employ two major approaches: sta-
tistical methods based on overabundance of motifs in regula-
tory regions (for example, [27]); and methods that are based
on identifying motifs from experimental binding data (for
example, [26]); for a review, see [30]. Several statistical
approaches for searching splicing regulatory motifs, such as
that of Goren et al. [19], have also considered evolution con-
servation. Overall, the available methods concentrate on the
core binding motif and do not consider genomic information
from flanking regions. Here we present a novel computa-
tional approach for predicting and mapping SFBSs of known
splicing factors that considers both the genomic environment
as well as the evolutionary conservation of the splicing factor
cis-regulatory elements. The method was trained and tested
on experimentally validated sequences, displaying high accu-
racy of 93% with a relatively low false positive rate of 1% on
the tested data. In addition, the method was applied to differ-
ent sets of exons and introns, and detected an enrichment of
SFBSs in different types of AS, such as cassette exons (CEs),
alternative donors (ADs), and alternative acceptors (AAs),
compared to constitutive exons. Furthermore, we used our
method to study splicing regulatory circuits connecting the
subset of splicing factors that were available in our dataset.
Careful analysis of the splicing network's structure revealed
distinct features, characteristic of other regulatory networks,
such as transcription networks. Specifically, we identified
clear differences between tissue-specific versus broadly
expressed SFs.
Results and discussion
A method for mapping splicing factor binding sites
During the splicing process, many SFs bind and detach from
the pre-mRNA at both the exonic and intronic sequences
flanking the splice sites. To accommodate for such dynamic
interactions, most SFs bind short (4-10 nucleotide) and
degenerate sequences (Table S1 in Additional data file 1)
[11,14,26,31-53]. As a result, SFBSs are difficult to predict
based on motif profiles alone. In order to improve SFBS pre-
diction, we sought to consider sequence information derived
from their genomic context as well as evolutionary informa-
tion. The rationale behind our method relies on two main
assumptions: sequence signals flanking a binding motif are
informative for binding site recognition; and binding sites
tend to be evolutionarily conserved. A diagram of the proce-
dure is illustrated in Figure 1.
Multiplicity score
As a first step to identify SFBSs, we search a target sequence
for a match to a known binding motif. For this purpose a
binding motif is represented as a consensus sequence, using
the IUPAC definition. The list of binding motifs used in this
study to test the algorithm is given in Table S1 in Additional
data file 1. The list was generated from the literature as
described in the Materials and methods section and it
includes only motifs that were experimentally verified (see
references in Table 1). Subsequently, each sequence was
scored for a match, as described in detail in the Materials and
methods section. Upon identifying a significant match to a
single motif (S
sig
; see Materials and methods), we extended
our search to a sequence window of size w flanking S
sig
,
searching for other short sequences that resemble the
sequence of the query motif. Our assumption was that weak
signals around the protein binding sites may aid in attracting
the SFs to their binding sites, which are generally of low
sequence specificity [54]. In addition, though it is not general
to all SFs, some splicing regulatory proteins such as NOVA-1
[14] tend to bind to clusters of short binding motifs. In order
to account for lower scored hits around a significant hit, we
defined a threshold for suboptimal (S
sub
) hits (see Materials
and methods). We then calculated a multiplicity score for the
whole window by combining all S
sig
and S
sub
within w (Figure
1a). The window size was chosen in the training procedure,
described below (Table S2 in Additional data file 1). The mul-
tiplicity score was computed using a weighted rank (WR) esti-
mation approach (Figure 1b), described in Equation 1. The
WR approach was applied here in an attempt to boost the
contribution of the high-scored hits within the window (pre-
sumably the real binding sites) while lowering the noise from
suboptimal (that is, lower affinity sites) and non-significant
hits:
- where S
1
S
2
S
|w|
.
WR
w,a
corresponds to the sum of S
sig
and S
sub
values decreas-
ingly ranked and divided by the r
th
power of a, where r is the
position of the value in the ranked list and a is chosen to be a
small integer (for example, 2).
Conservation of score
Calculating the conservation of short cis-regulatory elements
is not trivial, since in most cases the sequence specificity of a
given SF is not limited to a unique arrangement of nucleotides
but rather to a group of similar k-mers. In addition, positional
WR a S
wa
r
r
r
w
,
||
=
−
=
∑
1
(1)
Genome Biology 2009, Volume 10, Issue 3, Article R30 Akerman et al. R30.3
Genome Biology 2009, 10:R30
variations between homologous cis-regulatory elements can
exist, and still keep their functionality [19,55]. Therefore, in
order to calculate the evolutionary conservation between two
clusters of cis-regulatory elements and still relax the posi-
tional and compositional dependencies between homologous
sequences, we defined a scoring function called 'Conservation
Of Score' (COS; Equation 2), which weights the WR of the tar-
get sequence by the difference between itself and the WR of
the homologous sequence (WR
w,a
hom
; Figure 1c-e). Thus,
when both WR
w,a
and WR
w,a
hom
are similar (that is, the win-
dow is conserved) COS increases. In this study we used the
human and mouse as primary and homologous sequences,
respectively, as in Equation 2:
Lastly, in order to separate significant from borderline pre-
dictions, we determined a threshold for the COS(WR) values
(Figure 1e). This threshold corresponds to the median of the
non-zero scores obtained by screening every query against
the background model, derived for exons and introns sepa-
rately (for more details see Materials and methods).
Evaluating the COS function on known binding sites
In order to provide evidence that the choice of the COS(WR)
improves prediction sensitivity, we compared the perform-
ance of WR and other estimators - the median (M; Equation
3), the weighted average (WA; Equation 4), and the sum of
scores (SS; Equation 5) - to the prediction sensitivity, which
was calculated based on a Single Score S (Equation 7 in Mate-
rials and methods). All estimators were tested with and with-
out the COS function.
M
w
= median{S
i
|S
i
, i = 1, , w}(3)
COS(WR) =⋅−
−
WR
WR
wa
WR
wa
WR
wa
WR
wa
wa,
(
|
,,
hom
|
max(
,
,
,
hom
)
)1
(2)
WA
S
ii
w
S
i
i
w
w
=
=
∑
=
∑
2
1
1
||
||
(4)
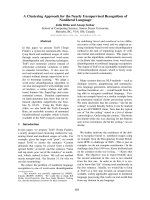
Schematic representation of the COS(WR) functionFigure 1
Schematic representation of the COS(WR) function. (a) A candidate human sequence is queried with a regulatory motif. (b) The weighted rank (WR) is
computed only for significant positions by combining all scores above the suboptimal threshold in a sequence window of size w. (c, d) We calculate WR
scores for the candidate's homologous region in mouse that aligns to the human sequence flanking the significant hits. (e) WR scores of the candidate
sequence and its homologue are combined by calculating the Conservation Of Score (COS).
S
Significant
Suboptimal
Suboptimal
Human
Mouse
S
(a)
(c)
W W
WR
WR
(b)
(d)
COS
(e)
Threshold
Table 1
Splicing network topological properties
DC L
Splicing network 3 0.31 1.57
ER graphs 6.31 ± 1.34 0.23 ± 0.07 2.68 ± 0.39
Z-score -2.470 1.097 -2.877
P-value (one tail) 0.0068 0.1363 0.002
Comparison between the splicing network properties and 1,000 Erdös-
Rényi (ER) random graphs. C, clustering coefficient; D, diameter; L,
average length of shortest paths.
Genome Biology 2009, Volume 10, Issue 3, Article R30 Akerman et al. R30.4
Genome Biology 2009, 10:R30
For this purpose we used a training set that included 56 posi-
tive and 502 control sequences (see Materials and methods).
The training was conducted as follows: first, scores of 'known
SF binding sites' were drawn from the positive set; second,
scores for 'non-binding sites' were drawn from a randomly
selected set of sequences of equal size from the control set;
third, positive and negative scores were ranked together in
descending order; and fourth, the true positive rate (TPR)
was calculated by splitting the list at the position where the
false positive rate reached 1%.
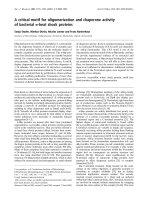
Figure 2 summarizes the average TPRs for ten training itera-
tions (each time selecting randomly an equal number of neg-
ative examples from the control set). As shown, the highest
scores were achieved when applying the COS(WR) function
(TPR = 0.93 ± 0.02), compared to considering a single match
S (TPR = 0.68 ± 0.04). Other estimators, such as the SS, M,
and WA, presented TPRs around 0.6-0.8. These results
clearly demonstrate that incorporating information of addi-
tional hits around a match outperforms a score based on a
single hit. Nevertheless, the best results were achieved when
the information from multiple hits within the window was
added in a weighted manner, namely the WR approach,
where the strong hits are weighted higher and the weak hits
are given lower weight. This is likely due to the fact that the
most substantial contribution to SF binding in regulatory
regions comes from highly significant hits (which could be a
single binding site or several consecutive binding sites). How-
ever, by themselves these hits may not be sufficient to distin-
guish true binding sites from background. To further verify
that the results are not biased by the relatively small number
of sequences in the positive and control set, we applied a sim-
ilar procedure using the full testing data set (56 positives
against 502 negatives). As illustrated in Figure S1 in Addi-
tional data file 2, there was no noticeable change in the testing
results when including the full dataset. It is important to note
that all the training experiments described above were carried
out using a predefined set of parameters that were empirically
selected using the COS(WR) function, under variable condi-
tions (Table S2 in Additional data file 1). The optimal set of
parameters was: cutoff
sig
at a P-value of < 0.01, cutoff
sub
at a
P-value of < 0.025, w = 50, and a = 2. Although these were
found as optimal parameters, we observe that using a window
size between 30-60 nucleotides produces very similar results
when the cutoff
sub
was changed to a P-value of < 0.05 instead
of a P-value of < 0.025 (results shown in Table S2 in Addi-
tional data file 1).
As observed in Figure 2, considering the evolutionary conser-
vation of the scores (using the COS function) improves the
prediction's sensitivity, though not dramatically. Further, we
wanted to ensure that the high performance of the COS func-
tions is not simply due to the overall higher conservation of
the intronic sequences flanking alternative exons relative to
the background model [17,18]. Since the high conservation of
these regions is related to the SFBSs that are embedded
within these sequences, it is practically impossible to tease
out the contribution of each feature independently. Neverthe-
less, to ensure that the overall high conservation does not pro-
duce artificial results, we tested whether the COS function
would detect other functional motifs, such as transcription
binding sites or untranslated region (UTR) motifs, which are
not expected to be found within these regions. For that we
selected the ten most significant human promoter motifs and
ten UTR motifs from Xie et al. [56] and tested whether these
motifs are detected within our training set by applying the
COS(WR) function. As shown in Table S2 in Additional data
file 1, the average TPR obtained for both the promoter and
UTR motifs was approximately 0.5, what would be expected
from a random search. These latter results reinforce the claim
that the COS(WR) function specifically improves the detec-
tion of true SFBSs within exonic and intronic regions flanking
alternative splice sites. It is important to emphasize, however,
that the experimental set of data on which the COS(WR) func-
tion was originally tested was limited to the available data in
the literature, which has been extensively studied and may be
biased towards dense and conserved SFBSs.
Specificity testing on experimentally verified binding
sites
In order to evaluate the specificity of our method, we meas-
ured its ability to predict experimentally verified binding sites
of a known SF amongst all other 19 possible SFs. For this pur-
pose we screened a set of core binding sites from experimen-
tally confirmed SFBSs (Additional data file 3) against 30
motifs corresponding to 20 SFs (Table S1 in Additional data
file 1). For every core binding site the resulting scores were
SS S
wi
i
w
=
=
∑
1
||
(5)
Sensitivity of multiplicity estimatorsFigure 2
Sensitivity of multiplicity estimators. The average true positive rate (TPR)
at a fixed false positive rate of 0.01 when training the data with four
different multiplicity estimators: weighted rank (WR), weighted average
(WA), median (M) and sum of scores (SS), compared to Single Scores (S).
For each estimator the TPR was calculated when considering (dark
columns) or not considering (light columns) the Conservation Of Score
(COS).
Genome Biology 2009, Volume 10, Issue 3, Article R30 Akerman et al. R30.5
Genome Biology 2009, 10:R30
ranked; ties were given the same ranking index. In cases
where the literature reports more than one possible motif for
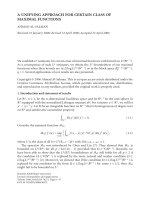
a given SF, we report the highest ranked result. Figure 3 dis-
plays the percent of correct predictions amongst the top
ranked scores. As shown, for more than 30% of the predic-
tions the highest scored hit (that is, the best prediction) was
the 'known binding site' reported in the literature; for almost
60% of the samples the experimentally verified SF was
amongst the three best predictions, and in more than 80% of
the cases it was amongst the five best predictions. It is impor-
tant to note that in many cases the core binding site is not
clearly defined; therefore, one would expect to find additional
SFs in a regulatory sequence that have not been reported in
the literature. Moreover, misprediction of some SFBSs could
arise from the lack of representation of other sites in the motif
set (that is, some motif sets contain only one known SFBS).
Nevertheless, when applying the thresholds to the COS(WR)
values (described in Materials and methods) we observed that
the vast majority of the predictions that were ranked 5 and
higher fell above the threshold, while predictions at position
6 or below fell under the threshold (Figure 3).
Since in large scale genomic analyses SFBS predictions are
expected to be performed on long sequences without previous
knowledge of the exact position of the SFBSs, we performed
an additional test including both the core and flanking
sequences (see Materials and methods). In order to be able to
compare our results to another SFBS predictor, we tested the
method on four SFs - SF2/ASF, SC35, SRp40, and SRp55 - for
which we could apply the well-established predictor ESE-
finder [26,57]. Overall, the data included 22 known binding
sites and their flanking sequences (total size 100 nucleotides).
As shown in Figure 4, our method predicted 50% of the real
SFBSs as the first ranked score, whereas ESEfinder predicted
only 9% as first ranked scores. It is important to note that the
results obtained by our method were applied after optimizing
the COS function parameters to our training data (for exam-
ple, window size, threshold, and so on). Since the optimiza-
tion applied to our method could not be applied to ESEfinder,
the comparison may not be complete.
Taken together, these results demonstrate that the COS(WR)
predictor is capable of identifying functional SFBSs with a rel-
atively high level of specificity. Additionally, in comparison to
other available tools, the scores derived by the COS(WR)
function for different SFBSs are comparable to each other
and, thus, they can be ranked in a meaningful way.
Validating the algorithm against an independent large
scale genome analysis
In the last few years, several high throughput genome analy-
ses have been applied to elucidate the targets of different SFs
[14,46]. To test the validly of the COS(WR) to detect SF bind-
ing signals at the genomic scale, we applied the COS(WR)
algorithm to two independent data sets of endogenous target
sequences of two different splicing factors, NOVA-1 and SF2/
ASF, which were experimentally obtained using cross-linking
immunoprecipitation (CLIP) [14,46]. In both cases we
applied the COS(WR) to the set of intergenic sequences that
were experimentally selected as putative targets of the SF and
a large set of exonic sequences randomly selected from
human genes. As shown in Figure S2A in Additional data file
2, in the SF2/ASF experiment we did not find a significant
enrichment of the SF2/ASF motif, obtained from SELEX data
[26,57], within the experimental data. Nevertheless, we found
that when testing the new SF2/ASF consensus motif,
UGRWGVH, suggested in [46], the COS(WR) function
detected a significant enrichment of the motif in experimen-
tally selected sequences relative to a large set of random
sequences from the genome. More so, the UGRWGVH motif
Specificity calculated by the COS(WR) methodFigure 3
Specificity calculated by the COS(WR) method. The percent of accurate
predictions derived from a screening of experimentally validated
sequences with 30 different SFBS queries. The x-axis shows the rank of
the true positive hits (that is, experimentally validated SFBSs) among the
list of predictions derived from the screening. The top curve displays the
percent of predictions higher than the COS(WR) threshold and the
bottom curve shows the percent of predictions below the threshold.
Percent of Predictions
Rank
1st 2nd 3rd 4th 5th >5th
0
10
20
30
40
50
60
70
80
90
100
Genome Biology 2009, Volume 10, Issue 3, Article R30 Akerman et al. R30.6
Genome Biology 2009, 10:R30
was significantly enriched compared to all other tested
motifs. Interestingly, when using the COS(WR) function we
also found weaker enrichment of other SF motifs in the exper-
imentally selected dataset. These results are consistent with
the working hypothesis in the field that splicing, and specifi-
cally AS, is carried out by many SFs that work in concert to
achieve fine-tuned splicing regulation [7]. To further test
whether the enrichment of the motif in the putative target
sequences - relative to the background - could be detected by
a simple search for the consensus pattern, we screened the
data searching for the same motif using the single hit
approach (the S score). As shown in Figure S2B in Additional
data file 2, when using the motif alone we did not detect a sig-
nificant enrichment of the SF2/ASF motif among the CLIP
target sequences. Notably, other SF motifs (such as PTB bind-
ing sites) were significantly enriched in the CLIP selected
sequences also when considering a single motif, though the
significance of the enrichment was reduced.
When applying the same test on NOVA-1 target sequences
compared to a random set of exonic and intronic sequences,
we could clearly notice a highly significant enrichment (P <
10
-100
) of the motif YCAY in the targets compared to the back-
ground. In the case of the NOVA-1 motif the high enrichment
of the motif could be identified with the COS(WR) function
but also when considering a single hit (P < 10
-60
). These
results suggest that the YCAY motif, by itself, is sufficient to
distinguish NOVA-1 targets from random sequences; this is
possibly related to the high specificity of NOVA-1 to its tissue
(brain) specific targets [14]. Overall, testing the COS(WR)
function on CLIP data strengthens the power of the method to
highlight the true SFBSs within a large set of genomic data.
Nevertheless, as the CLIP data do not provide the exact loca-
tion of the binding sites they could not be used to directly val-
idate the prediction of individual SFBSs.
Finding SFBS enrichment in alternatively spliced
sequences using the COS(WR) function
In recent years several studies have demonstrated the abun-
dance of highly conserved sequences in the immediate
regions flanking alternatively spliced exons [17,19-21,55,58].
In these studies it was suggested that both the upstream and
downstream intronic regions may play a role in regulating
CEs [14,16,17,19,20]. Nevertheless, in other AS modes, such
as AAs and ADs, it is anticipated that only one of the introns,
explicitly the one containing the AS sites, displays regulatory
characteristics [21,58,59]. We therefore compared the fre-
quency of our predicted SFBSs in CEs relative to constitutive
exons and their flanking intronic sequences (as described in
Materials and methods). As shown in Figure 5 (details in
Table S4 in Additional data file 1), most SFBS motifs were
enriched in the CEs and - to a lesser extent - in the flanking
intronic sequences. Interestingly, among the SFBSs for which
significant enrichment was observed in the intronic
sequences, some motifs were enriched in the 5' introns (for
example, UUGGGU of hnRNPH/F) and some in the 3' introns
(for example, UGCAUG of FOX-1). Similar observations were
recently reported in a motif search that was applied to
Specificity of the COS(WR) algorithm compared to ESEfinderFigure 4
Specificity of the COS(WR) algorithm compared to ESEfinder. A pie chart representing prediction results for four SFs - SF2/ASF, SRp40, SRp55, and SC35
- obtained from screening experimentally validated sequences using (a) ESEfinder and (b) COS(WR). The different slices represent the percent of true
SFBS predictions in the first, second, third, and fourth ranks (color scale is shown on the right). As shown, using the COS(WR) approach, 50% of
predictions were ranked at the top rank, while only 9% were top ranked using ESEfinder. nf, not found.
(a) (b)
Genome Biology 2009, Volume 10, Issue 3, Article R30 Akerman et al. R30.7
Genome Biology 2009, 10:R30
Enrichment of SFBSs in alternative exonsFigure 5
Enrichment of SFBSs in alternative exons. A heat map representing the -log
10
(P-value) of a series of Wilcoxon tests, comparing the normalized density of
SFBS predictions in cassette exons (CE), alternative acceptors (AA), and alternative donors (AD) to a background of constitutive exons. The tests were
carried out for the full exonic sequences (E), for 100-nucleotide intronic sequences (5' and 3') flanking the alternative exon and for extended regions
'exons and/or introns' (E/I). The P-values were corrected with the Westfall-Young procedure.
Genome Biology 2009, Volume 10, Issue 3, Article R30 Akerman et al. R30.8
Genome Biology 2009, 10:R30
intronic regions flanking tissue-specific CEs derived from an
expression compendium of human AS events [60]. As
expected, the AA exons were mainly enriched in SFBSs in the
5' introns, but not in the 3' introns. Correspondingly, the AD
exons were enriched with SFBSs in the 3' introns but not in
the 5' introns. As demonstrated in Figure 5, for both AAs and
ADs the enrichment was specifically found in the extended
region 'exon and/or intron' (E/I), which - depending on the
alternative event - could be either an exonic or an intronic
region. Overall, the genomic regions flanking AA and AD
splicing events were less enriched with SFBSs compared to
equivalent regions near constitutive events. It is important to
note that when applying a similar enrichment analysis using
the simple S function (as opposed to COS(WR)) no significant
enrichment of binding sites in the AS events relative to con-
stitutive splicing was detected (see Table S5 in Additional
data file 1 and Figure S3 in Additional data file 2).
The patterns of enrichment that we observe when mapping
SFBSs with the COS(WR) function on alternative exons rein-
forces the strength of our method in filtering true SFBSs. In
addition, further interesting observations can be derived
from this study. First, we observe that CEs display a larger
variety of enriched SFBSs, compared to AAs and ADs, espe-
cially on the exonic sequence itself. Second, in the CE group,
in several cases (such as hnRNPH/F and SRp20) binding
sites of the same factor (usually different motifs) were
enriched on both flanking introns. This is in accordance with
AS models suggesting cross-talk between the 5' and 3' splice
sites [10,61]. The enrichment of PTB binding sites in alterna-
tive versus constitutive splicing reinforces the prominent role
of PTB in AS in addition to its basal role in splicing regulation
of constitutive events [62]. Finally, we observed that several
SFBSs were specifically enriched in the AA group (for exam-
ple, SRp20) or in the AD group (for example, 9G8), while oth-
ers (for example, hnRNPG/Tra2) seem to be equally
enriched in both groups (Figure 5).
Inter-regulation among splicing factors
SFs' coding transcripts have been consistently observed to be
regulated by AS. In many cases negative and positive feed-
back via autoregulation have been observed [34,53,54,63,64].
Recent studies demonstrated that AS-related nonsense-
mediated decay in SR proteins involves inter-regulatory and
autoregulatory loops [65,66]. The concept of SF regulation
was further strengthened by a recent computational genomic
survey that demonstrated enrichment of specific SFBSs in
their own coding genes [67]. In order to analyze the cross-talk
(at the AS level) between the SFs within our set, we repre-
sented the relationships between the factors as a directed
graph (network; Figure 6). The nodes in the graph (light blue
ovals) are the SFs (both the proteins and the pre-mRNAs
encoding for the SFs) and the directed edges (black arrows)
denote putative regulations, predicted by the existence of a
SFBS as defined by the COS(WR) function. Though the
majority of SFs in our list are involved in constitutive splicing
as well as in AS, to account for regulation involved in differ-
ential expression of the splicing factors, we included in the
network only putative interactions with alternative spliced
exons of the SF genes. To account for interactions between
SFs in our list that may be involved in AS regulation but are
not documented to undergo AS by themselves, we extended
the core graph by adding five nodes (small grey circles) for
which we could only predict out-edges (gray arrows), denot-
ing putative interactions with other SFs via AS regulation.
Further, to study the unique properties of the SF network
(including only the core network of 15 nodes for which a
directed graph was constructed), we compared the network
topology of the core graph to 1,000 randomly generated
graphs preserving the number of nodes and edges using the
Erdös-Rényi model [68]. As apparent from Table 1, the SF
network demonstrated a significantly lower average path
length than calculated for random graphs; however, it was not
found to be highly clustered relative to random networks.
Overall, the SF graph shown in Figure 6 displays a three-tier
structure that is reminiscent of other regulatory networks
[69]. In such a network, each node is assigned a level number:
1, 2, or 3. Generally, ignoring self loops, the three types of
nodes have the following properties: level 1 nodes are
'sources', that is, nodes that have only out-going edges - these
are SFs that were shown to be only regulators but are not reg-
ulated by other SFs in the core network; level 2 are 'mixed
nodes', which have both in-edges and out-edges; and level 3
nodes are 'sinks', that is, nodes that have only in-going edges
- these are SFs that are only regulated by other SFs and do not
regulate other SFs within the network. Additionally, the net-
work displayed many previously reported regulatory patterns
such as self-splicing regulation by PTB1 [53], NOVA-1 [63]
and SC35 [64]. Notably, in our network we defined an edge
between SFs only for AS events in which the predicted SFBSs
are enriched relative to constitutive splicing; thus, we antici-
pate that several autoregulatory interactions will not be
reflected by the network. Obviously, our methodology will not
identify autoregulation of SFs, which could occur at other lev-
els of the gene expression pathway, such as export and trans-
lation levels (as, for example, described in [70]).
A deeper perusal of the members of the nodes in the different
levels in our splicing network revealed that the sources in the
network tend to be more broadly expressed SFs, such as the
splicing factor SF2/ASF [71], while the sinks of the network
correspond to tissue-specific splicing factors, such as the
muscle- and brain-specific factor FOX-1. A specifically inter-
esting node in the graph is PTB. As described above, PTB is
well known as a basal factor, binding to polypyrimidine tracts
upstream of the 3' splice sites, but it has also been shown to
play a critical role in regulating tissue-specific (mainly brain)
exons, including its own mRNA [53]. In the core network,
PTB is found in the first layer, but it has in-edges coming from
other factors (YB1, SRp20) that have not been documented as
Genome Biology 2009, Volume 10, Issue 3, Article R30 Akerman et al. R30.9
Genome Biology 2009, 10:R30
alternatively spliced. In addition, consistent with the experi-
mental data [53], we predict that PTB is self-regulated.
To further examine the relationship between the position of a
factor in the graph and tissue specificity, we calculated the tis-
sue specificity index (TSI) for the splicing factors in the net-
work, adapted from Yanai et al. [72]. As illustrated in Figure
7 (for more details see Table S6 in Additional data file 1), SFs
that are sinks tend to have a higher TSI compared to the
sources, which generally demonstrate a low TSI. These obser-
vations coincide with the conjecture that specific factors
affect a small number of targets, which are found generally in
tissue-specific alternative exons; however, broadly expressed
factors can regulate a wider array of targets, including alter-
native and constitutive exons. Additionally, these results can
be explained by the fact that the more specific SFs require
bulky regulatory machinery in order to maintain their specif-
icity; therefore, they are expected to be regulated by many
other factors. Interestingly, the lowest TSIs were calculated
for the extended nodes, which were not included in the core
network as they are not alternatively spliced. As shown in Fig-
ure 7, the brain-specific NOVA-1 splicing factor presented the
highest calculated TSI. In our graph NOVA-1 displayed a sin-
gle predicted self-regulatory loop, which was previously
observed in an experimental assay [63], as well as an in-edge
coming from SRp20 (not included in the core network). In the
latter case, tissue specificity of NOVA-1 can also be explained
by other levels of regulation, such as tight transcription regu-
lation.
Finally, we wanted to examine whether specific splicing regu-
lation events are prevalent among SF interactions. Towards
this end we studied the properties of the edges of the graph.
We observed that post-transcriptional regulation amongst
An induced subgraph of SF inter-regulationFigure 6
An induced subgraph of SF inter-regulation. The network represents AS regulation among SFs as predicted with the COS(WR) function. Arrows indicate
that at least one of the alternative exons (and/or flanking introns) was predicted to be regulated by another factor. Light blue nodes stand for SFs that
undergo AS and are thus part of the core network. SFs without AS support (the small gray nodes) are part of the extended network. The network is
drawn in three layers: the upper layer displays SFs that have only out-edges (sources), the middle layer shows SFs that have both out-edges and in-edges
(mixed), and the bottom layer includes SFs that have only in-edges (sinks). Graphs were drawn using Cytoscape [80].
Genome Biology 2009, Volume 10, Issue 3, Article R30 Akerman et al. R30.10
Genome Biology 2009, 10:R30
SFs is accomplished by diverse splicing events, including CEs,
ADs and AAs, and intron retention (Table S7 in Additional
data file 1). We further analyzed the predicted effect of the
splicing events on protein structure/function. Here again we
noticed that the AS events observed in our network are pre-
dicted to have diverse outcomes, including disruptions of the
RNA-binding motif, changes in the distance between adjacent
RNA-binding motifs, and changes at the UTR level as in the
case of several nonsense-mediated decay candidates. It is
important to note that in this study we did not attempt to
infer the mode of splicing regulation (that is, activation versus
repression) in the SF-SF interactions, since these are depend-
ent on the position of the SFBSs relative to the splice sites
[14,19] and currently are not predictable for the vast majority
of SFBSs.
Conclusions
In this study we introduce a novel computational approach to
map cis-regulatory elements of SFs for which a binding pat-
tern has been previously defined from experimental data. Our
newly proposed scoring function, COS(WR), which takes into
account the genomic environment of a binding site, was dem-
onstrated to achieve high specificity and sensitivity when ana-
lyzing experimentally verified SFBSs. The COS(WR) function,
which considers the contribution from additional sites to the
overall scoring of the binding site in a weighted manner, lev-
erages the tendency of SFs to bind cooperatively. Further-
more, evolutionary conservation of an SFBS, which is
characteristic of SFBSs in particular and regulatory motifs in
general, is considered. Overall, the approach presented here
is considerably different from SFBS predictors in the follow-
ing aspects: in addition to SFBS similarity, it accounts for
other information from the genomic environment; the
COS(WR) derived scores are standardized - thus, the differ-
ent SFBS prediction values are comparable between different
queries and, therefore, when running the program with sev-
eral SFs results can be sorted in a relative manner. The latter
property makes it possible to give more probable estimations
for the factors acting in the regulation of either a single AS
event or a group of events (for example, alternative 3' splice
sites).
By applying the COS(WR) function to map SFBSs, we were
able to construct a network representing AS regulation
amongst a subset of SFs. Though the details of the predicted
interactions presented in the network are expected to change
as more data become available, we believe that the major con-
clusions from this network are general and will be valid for a
larger set of SFs. Interestingly, the distribution of the SFs in
our network was in remarkable correlation with the tissue
specificity of the factors: generally, the SFs in the top layer
(the sources) showed low specificity while SFs in the bottom
layer (sinks) were highly specific factors. This unique
arrangement of the splicing factors suggests the existence of
coordination among the different elements of the splicing
regulatory machinery, not only by protein-protein interac-
tions in the spliceosome but also via protein-RNA interac-
tions at the post-transcription/translation levels.
Materials and methods
Data assembly
A total of 76 experimentally verified cis-regulatory sequences
from human and mouse related to 20 different SFs were
extracted from the AEdb regulatory motifs database [73],
derived from either in vivo experiments or in vitro selective
methods (Table S1 in Additional data file 1, and Additional
data file 3). From this pool 30 well defined query motifs, of
lengths ranging from 4 to 10 nucleotides (Table S1 in Addi-
tional data file 1), were selected. The remaining 46 sequences
were used for training the algorithm (Additional data file 3).
However, as some of the sequences have been shown to bind
more than one SF, the final training set of 'known binding
sites' included 56 samples (Additional data file 3). All
sequences in the final set were extended both upstream and
downstream to cover 100 bp overall; thus, each positive train-
ing sample was composed of two elements: a core 'known
binding site' and the additional 'flanking sequences'.
The control set for the training processes was composed of
sequences of 100 bp each, derived from the internal regions of
long exons (length 1,000 nucleotides) and introns (length
10,000) (Additional data file 3). These regions were chosen as
controls since they are expected to be devoid of regulatory
regions [19]. Overall, the control set was composed of 353
exonic regions and 149 intronic regions (502 total). While the
number of exonic regions was bounded by the length restric-
tion, the relatively small number of intronic sequences was
due to the limited availability of high-quality human/mouse
Tissue specificity of the SFsFigure 7
Tissue specificity of the SFs. The TSI of SFs grouped according to their
positions in the network: 'extended', 'source', 'mixed', 'sink', and 'self-
regulatory'. As shown, low tissue specificity is observed for the top layers
while higher tissue specificity is characteristic of the bottom layers.
TSI
Extended Source Mixed Sink Self reg.
Genome Biology 2009, Volume 10, Issue 3, Article R30 Akerman et al. R30.11
Genome Biology 2009, 10:R30
alignments from internal intronic regions, which would be
required for further evolutionary conservation estimates.
A background model was built to evaluate statistical signifi-
cance. The background set comprised 5,000 constitutive and
1,637 alternative exons with their intronic flanking regions of
length 100 bp (Table S8 in Additional data file 1), all derived
from a human/mouse conserved database of alternative and
constitutive exons [18].
Defining a match to a SFBS query
To search for single SFBSs in a given sequence, the examined
queries were represented as a consensus using the IUPAC
definition (Table S1 in Additional data file 1). To estimate the
match between the SF consensus sequence (query) and the k-
mers in each position of the sequences (targets), a mismatch
expectation (E
m
) between the query and the target was
defined as:
E
m
slightly differs from an ordinary Hamming distance
(namely the sum of all mismatches) as the mismatch at each
position is weighted by its variability in the consensus
sequence. M
i
is a Boolean variable (1 for a match and 0 for a
mismatch), indicating whether the target sequence matches
the query at position i of the k-mer or not. Since for most
splicing factors no informative position weight matrices are
currently available (except for the SR proteins for which
detailed position weight matrices from SELEX data were
derived [26,57]), we use a simple approach to weigh each
position in the query based on the available consensus pat-
tern. The penalty weight p
i
was defined according to the query
consensus pattern given in Table S1 in Additional data file 1:
it is 1 when the position in the consensus sequence is invaria-
ble and 0.25 when no restrictions are given in the consensus.
The penalty weight was applied to down penalize mismatches
to variable positions. Thus, for example, if the query is
A[CG]A[AGC] and the 4-mer on the target sequence is AUUU,
then E
m
= 0 + 0.50 + 1 + 0.33 = 1.83.
Further, a standardized score S was defined to evaluate the
match between the query and each k-mer in the target
sequence. Since the E
m
of a query at a certain position is
highly dependent on the length and the expected nucleotide
probabilities of the query, we standardized the match
between the query and the k-mer in the target sequence as fol-
lows:
- where E
m
max
is the maximal mismatch expectation that can
be obtained between any k-mer and the query. The values of
S range from 0 to 1, increasing as the distance between the
query and the k-mer in the target decreases. Thus, when the
k-mer in the target sequence completely matches the query,
E
m
will be 0 and S will equal 1. In the above example, the 4-
mer AUUU will be scored (2.83 - 1.83)/2.83 = 0.353.
For defining significance, Z-scores were calculated for each
query independently, relative to the background model (see
the 'Data assembly' section above; Table S8 in Additional data
file 1). Two different thresholds were defined: cutoff
sig
(P-
value < 0.01) and cutoff
sub
(P-value < 0.025) for significant
(S
sig
) and suboptimal (S
sub
) hits, respectively. Here, a mixed
background model (both exons and introns taken together)
was chosen since we do not observe substantial differences
when considering each group separately (Table S8 in Addi-
tional data file 1).
Testing on experimentally predicted SFBSs based on
CLIP data
In order to assess the specificity and sensitivity of our method
at a genome-wide scale, we employed the SF2/ASF CLIP
dataset from Sanford et al. [46] and the NOVA-1 CLIP data
from Ule et al. [14]. From the first set only intragenic
sequences, which were identified by the CLIP technique as
SF2/ASF targets, were selected (326 sequences in total) and
combined with 3,260 (10-fold) random exonic sequences
from the human genome. From the second set 48 validated
NOVA-1 targets and 480 random exonic and intronic
sequences were selected. The choice of either pure exonic or
mixed (intronic/exonic) backgrounds for SF2/ASF and
NOVA-1, respectively, is based on the CLIP results, where
SF2/ASF targets were purely exonic while the NOVA-1 targets
were mixed. The COS(WR) function was applied to predict
the binding motifs from our initial SF list (Table S1 in Addi-
tional data file 1). For each independent experiment, the pre-
diction results of SFBS scores for the experimentally chosen
sequences and the random sequences were ranked. Further,
the Fisher exact (hypergeometric distribution) test was
applied to search which of the predicted motifs (above the
COS(WR) thresholds) was significantly enriched in the CLIP
derived sequences compared to random sequences.
Enrichment analysis
To search for enrichment of SFBSs in sequences related to AS
events versus constitutive splicing events, three different sets
of human/mouse conserved alternative exons were tested: a
set of 983 CEs; 439 alternative acceptors; and 198 alternative
donors [18]. All the exon and intron (with masked splice sites)
sets were compared with a non-parametric Wilcoxon test to a
set of 5,000 randomly chosen constitutive exons, also con-
served between human and mouse [18]. All the obtained P-
values were corrected using the Westfall-Young procedure
[74].
Splicing networks
Interactions between splicing factors (via AS) were repre-
sented by a directed graph G = (V, E) where the SFs are the
EMp
mii
i
n
=−
=
∑
()1
1
(6)
S
E
m
E
m
E
m
=
−
max
max
(7)
Genome Biology 2009, Volume 10, Issue 3, Article R30 Akerman et al. R30.12
Genome Biology 2009, 10:R30
nodes in V and the edges in E reflect interactions, as follows:
a directed edge from SF s
1
(the candidate regulator) to SF
s
2
(the target transcript) exists if at least one alternative exon
of s
2
was significantly enriched in the SFBSs of s
1
. To establish
interactions, the alternative exons (and the flanking introns)
of the SFs were queried with 30 SFBS motifs. Alternative
exons were defined based on annotations from RefSeq [75],
H-DBAS [76], and dbCASE [77]. In the latter, we considered
AS events with 4 expressed sequence tags per isoform.
Under these conditions, we observe a large extent of overlap
between annotations in all the databases. Fisher's exact tests
were performed for each independent motif to define the
number of significant hits that minimizes the P-value (in
exons and introns separately) when comparing alternative to
constitutive splicing events. In other words, the threshold
corresponds to the minimal number of hits that is required to
establish a regulatory interaction in either exons or introns.
Motifs with a P-value > 0.05 (that is, not enriched) were not
queried in the analysis.
The properties of this graph (network) were compared to
1,000 randomly generated graphs with the same number of
nodes and edges using the Erdös-Rényi model [68]. Five SFs
for which alternative exons were not documented (Tra2,
SRp20, SRp30c, hnRNPF, YB1) were excluded from the net-
work analysis since they can only have out-edges (predicted
to regulate other factors via AS but not vice versa). The fol-
lowing topological properties were calculated for each graph
G. First, the diameter (D), defined as the length of the longest
shortest path between any two nodes in V. Second, the aver-
age path length (L), defined as the average of path lengths
taken over all pairs of nodes for which a directed path exists,
calculated as:
- where N
p
represents the number of connected pairs of nodes
in the graph, and dist(u,v) is the length of the shortest path
between nodes u and v if one exists. Third, the clustering coef-
ficient (C), which is the average value of the individual clus-
tering coefficients (c) of all the nodes in the graph; the latter
(c) is defined for a node v as the fraction of the number of
edges among v's neighbors out of all possible pairs of such
neighbors. Thus, C is defined as:
- where N is the number of nodes (vertices) in the graph, N
v
is
the number of neighbors of node v, and n
v
is the actual
number of edges between the neighbors of node v. The analy-
ses were performed with the R software environment for sta-
tistical computing release 2.5.1 [78] and the igraph
contributed (0.4.3) package using the functions:
erdos.reni.game, diameter, average.path.length and transi-
tivity.
Tissue specificity index
The TSI of the splicing factors was calculated using the
GPL96-GDS596-MAS5 microarrays dataset [79]. SF expres-
sion levels for a total of 28 normal tissues were used for cal-
culating each TSI; cancer and fetal tissues were removed.
Further, the expression levels were log transformed and
binned into ten groups ranging from 0 to 1 for every sample
independently.
The TSI was adapted from the TSIhvr value, defined by Yanai
et al. [72]. As in the TSIhvr, the expression profile for each SF
was first normalized by dividing each intensity by the highest
intensity of that profile, as follows:
- where N is the number of tissues (28) and x is the normal-
ized expression vector.
Availability
The method presented here is embodied in a software pack-
age called Splicing Factor Finder (SFF), which is available in
Additional data file 4 as a standalone download suitable for
running under the Linux OS.
Abbreviations
AA: alternative acceptor; AD: alternative donor; AS: alterna-
tive splicing; CE: cassette exon; CLIP: cross-linking immuno-
precipitation; COS: Conservation Of Score; hnRNP:
heterogeneous nuclear ribonucleoprotein; M: median; PTB:
polypyrimidine tract-binding protein; SF: splicing factor;
SFBS: splicing factor binding site; SR: serine-arginine-rich;
SS: sum of scores; TPR: true positive rate; TSI: tissue specifi-
city index; UTR: untranslated region; WA: weighted average;
WR: weighted rank.
Authors' contributions
MA participated in the design and development of the com-
putational methodology, carried out the predictions and sta-
tistical analyses, and drafted the manuscript. HDE carried
out the network analysis. RYP advised on the network design
and analysis. YMG conceived and coordinated the study and
wrote the manuscript. All authors read the manuscript and
participated in the revisions that produced its final form.
L
Np
dist u v
uv V
uv
=
∈
→
∑
1
(,)
,
(8)
C
N
n
v
N
v
N
v
vV
=
−
∈
∑
1
12()/
(9)
TSI
x
i
i
N
N
hvr
=
−
∑
−
1
1
(10)
Genome Biology 2009, Volume 10, Issue 3, Article R30 Akerman et al. R30.13
Genome Biology 2009, 10:R30
Additional data files
The following additional data are available with the online
version of this paper: a PDF including Tables S1-S8 (Addi-
tional data file 1); a PDF including Figures S1-S3 (Additional
data file 2); a detailed table of all experimentally defined
SFBSs used for training and testing (Additional data file 3); a
compressed file of the SFF standalone download, suitable for
running under the Linux OS (Additional data file 4).
Additional data file 1Tables S1-S8Table S1 includes a list of binding site motifs for known SFs used for training and testing the method. Table S2 summarizes the training results using different estimators and thresholds. Table S3 lists the thresholds used for the COS(WR) function for each binding site motif. Tables S4 and Table S5 display detailed results for the enrichment tests performed for AAs, CEs, and ADs, applying the COS(WR) and single score (S), respectively. Table S6 displays the values of the TSI calculated for the different SFs. Table S7 presents the details of the predicted SF-SF interactions. Table S8 displays the values for the background model calculated for the Single Scores (S).Click here for fileAdditional data file 2Figures S1-S3Figure S1 illustrates the TPR of different multiplicity estimators (WR, WA, M, SS and S) calculated at a fixed false positive rate of 0.01. TPRs were calculated with and without the COS. Figure S2 demonstrates the analysis of the SF2/ASF and NOVA-1 CLIP data-sets, when applying (a, c) COS(WR) and (b, d) Single Scores. Figure S3 is a heat map representing the calculated enrichment of SFBSs around different alternative events, when applying Single Scores (S) only.Click here for fileAdditional data file 3Experimentally defined SFBSs used for training and testingExperimentally defined SFBSs used for training and testing.Click here for fileAdditional data file 4SFF standalone downloadSFF standalone download, suitable for running under the Linux OS.Click here for file
Acknowledgements
We would like to thank Yael Berstein and Yonina Eldar for advice on sta-
tistical analysis and mathematical formulations. This work was supported by
the Mallat Family Fund granted to YMG. HDE was supported by the Israeli
Science Foundation 923/05.
References
1. Das D, Clark TA, Schweitzer A, Yamamoto M, Marr H, Arribere J,
Minovitsky S, Poliakov A, Dubchak I, Blume JE, Conboy JG: A corre-
lation with exon expression approach to identify cis-regula-
tory elements for tissue-specific alternative splicing. Nucleic
Acids Res 2007, 35:4845-4857.
2. Jensen KB, Dredge BK, Stefani G, Zhong R, Buckanovich RJ, Okano
HJ, Yang YY, Darnell RB: Nova-1 regulates neuron-specific
alternative splicing and is essential for neuronal viability.
Neuron 2000, 25:359-371.
3. Jin Y, Suzuki H, Maegawa S, Endo H, Sugano S, Hashimoto K, Yasuda
K, Inoue K: A vertebrate RNA-binding protein Fox-1 regu-
lates tissue-specific splicing via the pentanucleotide
GCAUG. EMBO J 2003, 22:905-912.
4. Qi J, Su S, McGuffin ME, Mattox W: Concentration dependent
selection of targets by an SR splicing regulator results in tis-
sue-specific RNA processing. Nucleic Acids Res 2006,
34:6256-6263.
5. Moroy T, Heyd F: The impact of alternative splicing in vivo:
mouse models show the way. Rna 2007, 13:1155-1171.
6. Tarn WY: Cellular signals modulate alternative splicing. J
Biomed Sci 2007, 14:517-522.
7. Smith CW, Valcarcel J: Alternative pre-mRNA splicing: the
logic of combinatorial control. Trends Biochem Sci 2000,
25:381-388.
8. Jurica MS, Moore MJ: Pre-mRNA splicing: awash in a sea of pro-
teins. Mol Cell 2003, 12:5-14.
9. Clerte C, Hall KB: Characterization of multimeric complexes
formed by the human PTB1 protein on RNA. Rna 2006,
12:457-475.
10. Eperon IC, Makarova OV, Mayeda A, Munroe SH, Caceres JF, Hay-
ward DG, Krainer AR: Selection of alternative 5' splice sites:
role of U1 snRNP and models for the antagonistic effects of
SF2/ASF and hnRNP A1. Mol Cell Biol 2000, 20:8303-8318.
11. Gromak N, Matlin AJ, Cooper TA, Smith CW:
Antagonistic regu-
lation of alpha-actinin alternative splicing by CELF proteins
and polypyrimidine tract binding protein. Rna 2003, 9:443-456.
12. Aznarez I, Barash Y, Shai O, He D, Zielenski J, Tsui LC, Parkinson J,
Frey BJ, Rommens JM, Blencowe BJ: A systematic analysis of
intronic sequences downstream of 5' splice sites reveals a
widespread role for U-rich motifs and TIA1/TIAL1 proteins
in alternative splicing regulation. Genome Res 2008,
18:1247-1258.
13. McCullough AJ, Berget SM: G triplets located throughout a class
of small vertebrate introns enforce intron borders and regu-
late splice site selection. Mol Cell Biol 1997, 17:4562-4571.
14. Ule J, Stefani G, Mele A, Ruggiu M, Wang X, Taneri B, Gaasterland T,
Blencowe BJ, Darnell RB: An RNA map predicting Nova-
dependent splicing regulation. Nature 2006, 444:580-586.
15. Clery A, Blatter M, Allain FH: RNA recognition motifs: boring?
Not quite. Curr Opin Struct Biol 2008, 18:290-298.
16. Stadler MB, Shomron N, Yeo GW, Schneider A, Xiao X, Burge CB:
Inference of splicing regulatory activities by sequence neigh-
borhood analysis. PLoS Genet 2006, 2:e191.
17. Sorek R, Ast G: Intronic sequences flanking alternatively
spliced exons are conserved between human and mouse.
Genome Res 2003, 13:1631-1637.
18. Sugnet CW, Kent WJ, Ares M Jr, Haussler D: Transcriptome and
genome conservation of alternative splicing events in
humans and mice. Pac Symp Biocomput 2004:66-77.
19. Goren A, Ram O, Amit M, Keren H, Lev-Maor G, Vig I, Pupko T, Ast
G: Comparative analysis identifies exonic splicing regulatory
sequences - the complex definition of enhancers and silenc-
ers. Mol Cell 2006, 22:769-781.
20. Voelker RB, Berglund JA: A comprehensive computational
characterization of conserved mammalian intronic
sequences reveals conserved motifs associated with consti-
tutive and alternative splicing. Genome Res 2007, 17:1023-1033.
21. Akerman M, Mandel-Gutfreund Y: Alternative splicing regulation
at tandem 3' splice sites.
Nucleic Acids Res 2006, 34:23-31.
22. Kankainen M, Loytynoja A: MATLIGN: a motif clustering, com-
parison and matching tool. BMC Bioinformatics 2007, 8:189.
23. Reddy TE, Shakhnovich BE, Roberts DS, Russek SJ, DeLisi C: Posi-
tional clustering improves computational binding site detec-
tion and identifies novel cis-regulatory sites in mammalian
GABAA receptor subunit genes. Nucleic Acids Res 2007, 35:e20.
24. Wong WS, Nielsen R: Finding cis-regulatory modules in Dro-
sophila using phylogenetic hidden Markov models. Bioinformat-
ics 2007, 23:2031-2037.
25. Yang E, Simcha D, Almon RR, Dubois DC, Jusko WJ, Androulakis IP:
Context specific transcription factor prediction. Ann Biomed
Eng 2007, 35:1053-1067.
26. Cartegni L, Wang J, Zhu Z, Zhang MQ, Krainer AR: ESEfinder: a
web resource to identify exonic splicing enhancers. Nucleic
Acids Res 2003, 31:3568-3571.
27. Fairbrother WG, Yeo GW, Yeh R, Goldstein P, Mawson M, Sharp PA,
Burge CB: RESCUE-ESE identifies candidate exonic splicing
enhancers in vertebrate exons. Nucleic Acids Res 2004,
32:W187-190.
28. Zhang XH, Kangsamaksin T, Chao MS, Banerjee JK, Chasin LA: Exon
inclusion is dependent on predictable exonic splicing enhanc-
ers. Mol Cell Biol 2005, 25:7323-7332.
29. Wang Z, Rolish ME, Yeo G, Tung V, Mawson M, Burge CB: System-
atic identification and analysis of exonic splicing silencers.
Cell 2004, 119:831-845.
30. Chasin LA: Searching for splicing motifs. Adv Exp Med Biol 2007,
623:85-106.
31. Burd CG, Dreyfuss G: RNA binding specificity of hnRNP A1:
significance of hnRNP A1 high-affinity binding sites in pre-
mRNA splicing. EMBO J 1994, 13:1197-1204.
32. Cartegni L, Chew SL, Krainer AR: Listening to silence and under-
standing nonsense: exonic mutations that affect splicing. Nat
Rev Genet 2002, 3:285-298.
33. Cavaloc Y, Bourgeois CF, Kister L, Stevenin J: The splicing factors
9G8 and SRp20 transactivate splicing through different and
specific enhancers. Rna 1999, 5:468-483.
34. Chabot B, Blanchette M, Lapierre I, La Branche H: An intron ele-
ment modulating 5' splice site selection in the hnRNP A1
pre-mRNA interacts with hnRNP A1. Mol Cell Biol 1997,
17:1776-1786.
35. Chan RC, Black DL: The polypyrimidine tract binding protein
binds upstream of neural cell-specific c-src exon N1 to
repress the splicing of the intron downstream. Mol Cell Biol
1997, 17:4667-4676.
36. Chen CD, Kobayashi R, Helfman DM: Binding of hnRNP H to an
exonic splicing silencer is involved in the regulation of alter-
native splicing of the rat beta-tropomyosin gene. Genes Dev
1999, 13:593-606.
37. Chou MY, Underwood JG, Nikolic J, Luu MH, Black DL: Multisite
RNA binding and release of polypyrimidine tract binding
protein during the regulation of c-src neural-specific splicing.
Mol Cell 2000, 5:949-957.
38. Hastings ML, Wilson CM, Munroe SH: A purine-rich intronic ele-
ment enhances alternative splicing of thyroid hormone
receptor mRNA. Rna 2001, 7:859-874.
39. Ho TH, Charlet BN, Poulos MG, Singh G, Swanson MS, Cooper TA:
Muscleblind proteins regulate alternative splicing. EMBO J
2004, 23:3103-3112.
40. Hou VC, Lersch R, Gee SL, Ponthier JL, Lo AJ, Wu M, Turck CW,
Koury M, Krainer AR, Mayeda A, Conboy JG: Decrease in hnRNP
A/B expression during erythropoiesis mediates a pre-mRNA
splicing switch. EMBO J 2002, 21:6195-6204.
41. Jacquenet S, Mereau A, Bilodeau PS, Damier L, Stoltzfus CM, Branlant
Genome Biology 2009, Volume 10, Issue 3, Article R30 Akerman et al. R30.14
Genome Biology 2009, 10:R30
C: A second exon splicing silencer within human immunode-
ficiency virus type 1 tat exon 2 represses splicing of Tat
mRNA and binds protein hnRNP H. J Biol Chem 2001,
276:40464-40475.
42. Kashima T, Manley JL: A negative element in SMN2 exon 7
inhibits splicing in spinal muscular atrophy. Nat Genet 2003,
34:460-463.
43. Minovitsky S, Gee SL, Schokrpur S, Dubchak I, Conboy JG: The splic-
ing regulatory element, UGCAUG, is phylogenetically and
spatially conserved in introns that flank tissue-specific alter-
native exons. Nucleic Acids Res 2005, 33:714-724.
44. Nasim MT, Chernova TK, Chowdhury HM, Yue BG, Eperon IC:
HnRNP G and Tra2beta: opposite effects on splicing
matched by antagonism in RNA binding. Hum Mol Genet 2003,
12:1337-1348.
45. Pagani F, Buratti E, Stuani C, Baralle FE: Missense, nonsense, and
neutral mutations define juxtaposed regulatory elements of
splicing in cystic fibrosis transmembrane regulator exon 9. J
Biol Chem 2003, 278:26580-26588.
46. Sanford JR, Coutinho P, Hackett JA, Wang X, Ranahan W, Caceres JF:
Identification of nuclear and cytoplasmic mRNA targets for
the shuttling protein SF2/ASF. PLoS ONE 2008, 3:e3369.
47. Schaal TD, Maniatis T: Multiple distinct splicing enhancers in
the protein-coding sequences of a constitutively spliced pre-
mRNA. Mol Cell Biol 1999, 19:261-273.
48. Seong JY, Han J, Park S, Wuttke W, Jarry H, Kim K: Exonic splicing
enhancer-dependent splicing of the gonadotropin-releasing
hormone premessenger ribonucleic acid is mediated by
tra2alpha, a 40-kilodalton serine/arginine-rich protein. Mol
Endocrinol 2002, 16:2426-2438.
49. Stickeler E, Fraser SD, Honig A, Chen AL, Berget SM, Cooper TA:
The RNA binding protein YB-1 binds A/C-rich exon enhanc-
ers and stimulates splicing of the CD44 alternative exon v4.
EMBO J 2001, 20:3821-3830.
50. Suzuki H, Jin Y, Otani H, Yasuda K, Inoue K: Regulation of alterna-
tive splicing of alpha-actinin transcript by Bruno-like pro-
teins. Genes Cells 2002, 7:133-141.
51. Tacke R, Tohyama M, Ogawa S, Manley JL: Human Tra2 proteins
are sequence-specific activators of pre-mRNA splicing. Cell
1998, 93:139-148.
52. Tran Q, Coleman TP, Roesser JR: Human transformer 2beta and
SRp55 interact with a calcitonin-specific splice enhancer. Bio-
chim Biophys Acta 2003, 1625:141-152.
53. Wollerton MC, Gooding C, Robinson F, Brown EC, Jackson RJ, Smith
CW: Differential alternative splicing activity of isoforms of
polypyrimidine tract binding protein (PTB). Rna 2001,
7:819-832.
54. Stoilov P, Daoud R, Nayler O, Stamm S: Human tra2-beta1
autoregulates its protein concentration by influencing alter-
native splicing of its pre-mRNA. Hum Mol Genet 2004,
13:509-524.
55. Wang Z, Xiao X, Van Nostrand E, Burge CB: General and specific
functions of exonic splicing silencers in splicing control. Mol
Cell 2006, 23:61-70.
56. Xie X, Lu J, Kulbokas EJ, Golub TR, Mootha V, Lindblad-Toh K,
Lander ES, Kellis M: Systematic discovery of regulatory motifs
in human promoters and 3' UTRs by comparison of several
mammals. Nature 2005, 434:338-345.
57. Smith PJ, Zhang C, Wang J, Chew SL, Zhang MQ, Krainer AR: An
increased specificity score matrix for the prediction of SF2/
ASF-specific exonic splicing enhancers. Hum Mol Genet 2006,
15:2490-2508.
58. Akerman M, Mandel-Gutfreund Y: Does distance matter? Varia-
tions in alternative 3' splicing regulation. Nucleic Acids Res 2007,
35:5487-5498.
59. Koren E, Lev-Maor G, Ast G: The emergence of alternative 3'
and 5' splice site exons from constitutive exons. PLoS Comput
Biol 2007, 3:e95.
60. Castle JC, Zhang C, Shah JK, Kulkarni AV, Kalsotra A, Cooper TA,
Johnson JM: Expression of 24,426 human alternative splicing
events and predicted cis regulation in 48 tissues and cell
lines. Nat Genet 2008, 40:1416-1425.
61. Spellman R, Smith CW: Novel modes of splicing repression by
PTB. Trends Biochem Sci 2006, 31:73-76.
62. Pozzoli U, Sironi M: Silencers regulate both constitutive and
alternative splicing events in mammals. Cell Mol Life Sci 2005,
62:1579-1604.
63. Buckanovich RJ, Darnell RB: The neuronal RNA binding protein
Nova-1 recognizes specific RNA targets in vitro and in vivo.
Mol Cell Biol 1997, 17:3194-3201.
64. Liu HX, Chew SL, Cartegni L, Zhang MQ, Krainer AR: Exonic splic-
ing enhancer motif recognized by human SC35 under splic-
ing conditions. Mol Cell Biol 2000, 20:1063-1071.
65. Lareau LF, Brooks AN, Soergel DA, Meng Q, Brenner SE: The cou-
pling of alternative splicing and nonsense-mediated mRNA
decay. Adv Exp Med Biol 2007, 623:190-211.
66. Ni JZ, Grate L, Donohue JP, Preston C, Nobida N, O'Brien G, Shiue
L, Clark TA, Blume JE, Ares M Jr: Ultraconserved elements are
associated with homeostatic control of splicing regulators by
alternative splicing and nonsense-mediated decay. Genes Dev
2007, 21:708-718.
67. Yeo GW, Van Nostrand EL, Liang TY: Discovery and analysis of
evolutionarily conserved intronic splicing regulatory ele-
ments. PLoS Genet 2007, 3:e85.
68. Erdrs P, Rényi A: On random graphs. I. Publ Math (Debrecen) 1959,
6:290.
69. Deplancke B, Mukhopadhyay A, Ao W, Elewa AM, Grove CA, Mar-
tinez NJ, Sequerra R, Doucette-Stamm L, Reece-Hoyes JS, Hope IA,
Tissenbaum HA, Mango SE, Walhout AJ: A gene-centered C. ele-
gans protein-DNA interaction network. Cell 2006,
125:1193-1205.
70. Michlewski G, Sanford JR, Caceres JF: The splicing factor SF2/ASF
regulates translation initiation by enhancing phosphoryla-
tion of 4E-BP1. Mol Cell 2008, 30:179-189.
71. Karni R, de Stanchina E, Lowe SW, Sinha R, Mu D, Krainer AR: The
gene encoding the splicing factor SF2/ASF is a proto-onco-
gene. Nat Struct Mol Biol 2007, 14:185-193.
72. Yanai I, Benjamin H, Shmoish M, Chalifa-Caspi V, Shklar M, Ophir R,
Bar-Even A, Horn-Saban S, Safran M, Domany E, Lancet D, Shmueli O:
Genome-wide midrange transcription profiles reveal
expression level relationships in human tissue specification.
Bioinformatics 2005, 21:650-659.
73. AEdb - Alternative Exon Database [ />aedb/]
74. Westfall PH, Young SS: On adjusting P -values for multiplicity.
Biometrics 1993, 49:941-944.
75. RefSeq [ />76. H-DBAS - Human-transcriptome DataBase for Alternative
Splicing [ />77. dbCASE [ />78. R Project []
79. GEO (Gene Expression Omnibus) platform GPL96
[http:www.ncbi.nlm.nih.gov/sites/ent
rez?db=gds&term=GPL96%5BGEO%20Accession%5D]
80. Cytoscape []