Báo cáo y học: " Co-evolutionary networks of genes and cellular processes across fungal species" potx
Bạn đang xem bản rút gọn của tài liệu. Xem và tải ngay bản đầy đủ của tài liệu tại đây (724.15 KB, 17 trang )
Genome Biology 2009, 10:R48
Open Access
2009Tulleret al.Volume 10, Issue 5, Article R48
Research
Co-evolutionary networks of genes and cellular processes across
fungal species
Tamir Tuller
*†‡
, Martin Kupiec
†
and Eytan Ruppin
*‡
Addresses:
*
School of Computer Sciences, Tel Aviv University, Ramat Aviv 69978, Israel.
†
Department of Molecular Microbiology and
Biotechnology, Tel Aviv University, Ramat Aviv 69978, Israel.
‡
School of Medicine, Tel Aviv University, Ramat Aviv 69978, Israel.
Correspondence: Tamir Tuller. Email: Martin Kupiec. Email:
© 2009 Tuller et al.; licensee BioMed Central Ltd.
This is an open access article distributed under the terms of the Creative Commons Attribution License ( which
permits unrestricted use, distribution, and reproduction in any medium, provided the original work is properly cited.
Co-evolution and co-functionality of fungal genes<p>Two new measures of evolution are used to study co-evolutionary networks of fungal genes and cellular processes; links between co-evolution and co-functionality are revealed.</p>
Abstract
Background: The introduction of measures such as evolutionary rate and propensity for gene loss
have significantly advanced our knowledge of the evolutionary history and selection forces acting
upon individual genes and cellular processes.
Results: We present two new measures, the 'relative evolutionary rate pattern' (rERP), which
records the relative evolutionary rates of conserved genes across the different branches of a
species' phylogenetic tree, and the 'copy number pattern' (CNP), which quantifies the rate of gene
loss of less conserved genes. Together, these measures yield a high-resolution study of the co-
evolution of genes in 9 fungal species, spanning 3,540 sets of orthologs. We find that the
evolutionary tempo of conserved genes varies in different evolutionary periods. The co-evolution
of genes' Gene Ontology categories exhibits a significant correlation with their functional distance
in the Gene Ontology hierarchy, but not with their location on chromosomes, showing that cellular
functions are a more important driving force in gene co-evolution than their chromosomal
proximity. Two fundamental patterns of co-evolution of conserved genes, cooperative and
reciprocal, are identified; only genes co-evolving cooperatively functionally back each other up. The
co-evolution of conserved and less conserved genes exhibits both commonalities and differences;
DNA metabolism is positively correlated with nuclear traffic, transcription processes and vacuolar
biology in both analyses.
Conclusions: Overall, this study charts the first global network view of gene co-evolution in fungi.
The future application of the approach presented here to other phylogenetic trees holds much
promise in characterizing the forces that shape cellular co-evolution.
Background
The molecular clock hypothesis states that throughout evolu-
tionary history mutations occur at an approximately uniform
rate [1,2]. In many cases this hypothesis provides a good
approximation of the actual mutation rate [2,3] while in other
cases it has proven unrealistic [2,4]. The evolutionary rate
(ER) of a gene, the ratio between the number of its non-syn-
onymous to synonymous mutations, dN/dS, is a basic meas-
ure of evolution at the molecular level. This measure is
affected by many systemic factors, including gene dispensa-
Published: 5 May 2009
Genome Biology 2009, 10:R48 (doi:10.1186/gb-2009-10-5-r48)
Received: 24 February 2009
Revised: 24 February 2009
Accepted: 5 May 2009
The electronic version of this article is the complete one and can be
found online at /> Genome Biology 2009, Volume 10, Issue 5, Article R48 Tuller et al. R48.2
Genome Biology 2009, 10:R48
bility, expression level, number of protein interactions, and
recombination rate [5-11]. Since the factors that influence
evolutionary rate are numerous and change in a dynamic
fashion, it is likely that the evolutionary rate of an individual
gene may vary between different evolutionary periods. Previ-
ous studies have investigated co-evolutionary relationships
between genes on a small scale, mainly with the aim of infer-
ring functional linkage [12-17]. These studies were mostly
based on the genes' phyletic patterns (the occurrence pattern
of a gene in a set of current organisms). Recently, Lopez-Bigas
et al. [18] performed a comprehensive analysis of the evolu-
tion of different functional categories in humans. They
showed that certain functional categories exhibit dynamic
patterns of sequence divergence across their evolutionary his-
tory. Other studies have examined the correlations between
genes' evolutionary rates to predict physical protein-protein
interactions [19-24]. A recent publication by Juan et al. [24]
focused on Escherichia coli and generated a co-evolutionary
network containing the raw tree similarities for all pairs of
proteins in order to improve the prediction accuracy of pro-
tein-protein interactions. Here our goal and methodology are
different; we concentrate on a set of nine fungal species span-
ning approximately 1,000 million years [25]. We develop
tools to investigate co-evolution in both conserved and less-
conserved genes. For the first group, whose members have an
identical phylogenetic tree, we employ high-resolution ER
measures to investigate gene co-evolution. In the case of less
conserved genes, we generalize the concept of propensity for
gene loss [17] to encompass the whole phylogenetic tree in
order to better understand the driving forces behind co-evo-
lution.
The first part of this paper describes the analysis of conserved
genes. We define a new measure of co-evolution for such
genes and study their evolutionary rates along different parts
of the evolutionary tree. Next, we reconstruct a co-evolution-
ary network of genes and a co-evolutionary network of cellu-
lar processes according to this measure. In such a network
two genes/processes are connected if their co-evolution is
correlated. We identify two patterns of co-evolution, corre-
lated (cooperative) and anti-correlated (reciprocal). We show
that co-evolution is significantly correlated with co-function-
ality but not with chromosomal co-organization of genes. We
conclude this part by identifying clusters of functions in the
co-evolutionary network. Subsequently, in the second part of
the paper, we study the evolution of less-conserved genes. We
describe a new measure of evolution for such genes and
reconstruct a co-evolutionary network of cellular processes
according to this measure. We study the resulting clusters in
this network and compare it to the co-evolutionary network of
the conserved genes.
Results and discussion
The co-evolution of conserved genes
Computing the relative evolutionary rate pattern
First, we focus on the large set of conserved genes (that is,
genes that are conserved in all fungal species analyzed), iden-
tifying sequence co-evolutionary relationships that are mani-
fested in the absence of major gene gain and loss events. As
these co-evolutionary relationships cannot be deciphered by
an analysis based on phyletic patterns, and a single evolution-
ary rate measure is too crude for capturing them, we set out to
measure the relative evolutionary rate of each gene at every
branch of the evolutionary tree. The resulting new 'relative
evolutionary rate pattern' (rERP) measure characterizes a
gene's pattern of evolution as a vector of all its relative evolu-
tionary rates in the different branches of a species' phyloge-
netic tree. A workflow describing the determination of genes'
ERPs is presented in Figure 1 (for a detailed description of the
workflow described in this figure and comparison to other
measures of co-evolution see Materials and methods). We
analyzed genes from nine fungal species, whose phylogenetic
relationship (based on the 18S rDNA [26] and on the compar-
ison of 531 informative proteins [27]) is presented in Figure 2.
We first created a set of orthologous genes (lacking paralogs)
that are conserved in all species, resulting in a dataset of 1,372
sets of orthologs spanning a total of 12,348 genes. Each such
set of orthologous genes (SOG) was then aligned, and its
ancestral sequences at the internal nodes of the phylogenetic
tree were inferred using maximum likelihood. The resulting
sets of orthologs and ancestral sequences were then used to
estimate the evolutionary rate, dN/dS [28], along each of the
tree branches. To consider the selection forces acting on syn-
onymous (S) sites we used an approach similar to that of [29]
and adjusted the evolutionary rates accordingly. These
adjusted evolutionary rates are denoted dN/dS', and compose
an ERP vector that specifies a dN/dS' value for each branch of
the evolutionary tree, for each SOG. We next carried out an
analysis of the resulting ERP matrix, whose rows are the
SOGs, its columns are the tree branches, and its entries
denote evolutionary rate values (dN/dS').
The evolutionary rate along different branches of the evolutionary
tree
Our first task was to characterize the global selection regimes
acting upon the genes studied. We conservatively limit this
investigation to the short branches of the tree (excluding
branches (7,15), (15,16), (8,16), (9,16); Figures 2 and 3) to
avoid potential saturation problems that may bias the ER
computation (Materials and methods). Most of the genes
exhibit purifying selection (dN/dS' < 0.9) in the majority of
the phylogenetic branches, as one would expect [30]. A much
smaller group of genes under positive (dN/dS' > 1.1) and neu-
tral (0.9 <dN/dS' < 1.1) selection are concentrated in three
branches (Figure 3), with the majority located on the branch
leading from internal node 12 to internal node 11, probably
following the whole genome duplication event known to have
occurred at this bifurcation [31]. This major duplication event
Genome Biology 2009, Volume 10, Issue 5, Article R48 Tuller et al. R48.3
Genome Biology 2009, 10:R48
probably served as a driving force underlying this surge of
positive selection, by relaxing the functional constraints act-
ing on each of the gene copies [32]. This branch also repre-
sents a switch from anaerobic (Saccharomyces cerevisiae,
Saccharomyces bayanus and Candida glabrata) to aerobic
(Aspergillus nidulans, Candida albicans, Debaryomyces
hansenii, Kluyveromyces lactis, Yarrowia lipolytica) metab-
olism [33], which has likely required a large burst of positive
evolution in many genes. Additional data file 1 includes a
table that depicts the SOGs with positive evolution along this
branch (using their S. cerevisiae representative), which is
indeed enriched with many metabolic genes. The other two
branches under positive selection are the branch between
nodes 13 and 14, leading to a subgroup (D. hansenii and C.
albicans) that evolved a modified version of the genetic code
[34], and the branch between nodes 13 and 15 that leads to Y.
lipolytica (which is a sole member in one of the three taxo-
nomical clusters of the Saccharomycotina [35]).
Co-evolution of cellular processes
The major goal of this work is to study the co-evolution of
gene pairs and of cellular processes. To this end we utilized
the ERP matrix to compute the rERP of each conserved SOG.
The rERP is a vector containing the relative, ranked dN/dS'
(rER) of each SOG in every branch of the evolutionary tree,
thus comparing the evolutionary rate of each individual SOG
to that of all other SOGs. The ranking procedure is employed
to attenuate the effects of noisy estimations of ER values,
especially in long branches of the phylogenetic tree (see Note
1 in Additional data file 2). Defining the rERP of a Gene
Ontology (GO) process to be the mean rERP of all the genes it
contains, we asked which GO processes have the rERP with
the highest mean and the highest variance across the different
branches of the evolutionary tree (Figure 4). Notably, proc-
esses related to energy production, such as the tricarboxylic
acid cycle (involved in cellular respiration), and ATP synthe-
sis-coupled proton transport (which includes genes encoding
the mitochondrial ATPase) have the highest mean rERP and
also exhibit the highest variance of their rERP. This reflects
the primary role that energy production has played in fungal
evolution, and the effects that changes from anaerobic to aer-
obic metabolism have had on the development of fungal spe-
cies. Additional high rERP energy-related GO terms include
aerobic respiration and heme biosynthesis. Interestingly, bio-
logical functions related to information flow within the cell
exhibit high mean rERP values (tRNA export from nucleus,
DNA recombination) or high rERP variance (transcription
initiation from polymerase II promoter, RNA processing,
transcription termination from RNA polymerase II pro-
moter). The trend, however, is not identical for all processes:
protein import to the nucleus, for example, has a high rERP
value but very little variance. Full lists of conserved genes and
GO groups sorted according to their mean rERP and rERP
variance appear in Additional data file 3.
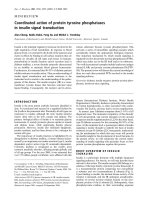
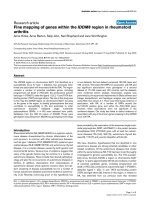
The different steps in computing rERP (for additional details see the Materials and methods section)Figure 1
The different steps in computing rERP (for additional details see the
Materials and methods section). AA, amino acids; tAI, tRNA adaptation
index.
B. Find sets of
orthologs
A. Identify the
phylogenetic
tree
D. Align each
set (nucleotides
and AAs)
E. Reconstruct
ancestral
sequences
G. Find tRNA
copy number
in each taxa
C. Remove
paralogs
I. Reconstruct
ancestral tRNA
copy number.
H. Reconstruct the
branch
lengths of the tree.
M. Analyze the sets of
orthologous genes by
their relative pattern
of dN/dS
K. Adjust dN/dS for
selection on synonymous
sites
L. Rank genes by
their adjusted dN/dS
F. Calculate
dN/dS in each
branch
J. Reconstruct
ancestral tAI
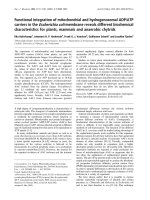
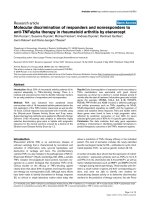
Phylogeny of the 9 fungal species based on the 18S rRNA [26] and 531 concatenated proteins [27]Figure 2
Phylogeny of the 9 fungal species based on the 18S rRNA [26] and 531
concatenated proteins [27]. Each of the leaves and the internal nodes is
labeled with numbers between 1 and 15. A branch in the phylogenetic tree
is designated by the two nodes it connects.
1. S. cerevisiae
2. S. bayanus
3. S. glabrata
4. K. lactis
5. D. hansenii
6. C. albicans
7. Y. lipolytica
8. A. nidulans
9. S. pombe
10
11
12
13
14
15 16
Genome Biology 2009, Volume 10, Issue 5, Article R48 Tuller et al. R48.4
Genome Biology 2009, 10:R48
We carried out a hierarchical clustering of GO-slim functions
according to their rERP values, which is depicted in Figure 5.
Many GO-slim groups exhibit correlated rERP values. For
example, processes related to metabolic activity (such as cel-
lular respiration, carbohydrate metabolism, and generation
of precursor metabolites and energy) exhibit high rERP val-
ues across the tree, whereas others (cell cycle and meiosis)
exhibit markedly lower values. Interestingly, processes
related to polarized growth and budding exhibit the lowest
overall rERPs. Importantly, the figure shows that rERP values
can provide additional information to that contained in the
global relative evolutionary rates (that is, those measured by
aggregating the whole tree). For example, the two GO-slim
process groups plasma membrane and microtubule organiza-
tion center (Figure 5, middle) have relatively similar (low) rel-
ative global evolutionary rates but markedly different rERPs
(as they appear in the two extreme parts of the hierarchical
clustering). While the standard ER measure checks if the
average ER of genes is similar (that is, |ER
1
- ER
2
|), rERP
compares the fluctuations in the ER of genes. Thus, two SOGs
may appear similar by one measure and very different when
applying the other. Figure 6 shows two examples in which the
two measures provide opposite results. Notably, the correla-
tion between these two measures is significant but rather low
(r = -0.055, P < 10
-16
). Overall, GO groups with functionally
related gene sets (that is, those that map closer on the GO
ontology network) tend to have similar rERP values (the cor-
relation between distance in the GO graph and average corre-
lation of rERP is -0.96, P-value < 4.5 × 10
-4
; see more details
in Figure 7, Additional data file 4, and Materials and meth-
ods; this comparison is made using the S. cerevisiae GO
ontology and mapping all the SOGs to this ontology).
Two fundamental types of co-evolution
Having a representative rERP vector for each SOG/process
enables us to examine the correlations between them and to
learn about their co-evolutionary history. A positive rERP
correlation arises when two SOGs/processes exhibit a similar
pattern of change in the different branches of the evolution-
ary tree and have evolved in a coordinated, cooperative C-
type fashion. A simple example of such a co-evolution is the
mitochondrial genome maintenance and mitochondrial elec-
tron transport categories. A marked negative rERP correla-
tion denotes reciprocal, R-type co-evolution where periods of
rapid evolution of one SOG/process are coupled with slow
evolution in the other; this may arise when the rapid evolu-
tion of one process creates a new niche or biochemical activity
that, in turn, enables, or selects for, the rapid evolution of the
other process. An illustrative R-type example involves the cat-
egory of methionine biosynthesis, which has a negative rERP
correlation with phosphatidylcholine (PC) biosynthesis. PC is
synthesized by three successive transfers of methyl groups
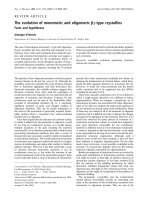
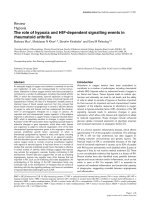
Number of genes (y-axis) with dN/dS' > 1.1 (positive selection), 1.1 > dN/dS' > 0.9 (neutral selection), and 0.9 > dN/dS' (purifying selection) in each branch (x-axis; see Figure 3)Figure 3
Number of genes (y-axis) with dN/dS' > 1.1 (positive selection), 1.1 > dN/dS' > 0.9 (neutral selection), and 0.9 > dN/dS' (purifying selection) in each branch
(x-axis; see Figure 3).
(1,10) (2,10) (10,11) (3,11) (11,12) (4,12) (12,13)(13,14)(5,14) (6,14) (13,15)(7,15) (15,16)(8,16) (9,16)
Branch
No of Genes
Purifying selection
Neutral selection
Positive selection
Long
Branches
Genome Biology 2009, Volume 10, Issue 5, Article R48 Tuller et al. R48.5
Genome Biology 2009, 10:R48
from S-adenosyl-methionine to phosphatidyl-ethanolamine
[36,37]. Thus, the evolution of the PC biosynthetic pathway
may be conditioned on the evolution of the methionine bio-
synthesis pathway, and thus follow it with some time lag (Fig-
ure 8). Interestingly, genes that co-evolve in a C-type manner
do provide functional backups to each other, having a statis-
tically significant enrichment in genetic interactions (hyper-
geometric P-value < 0.0039), while genes co-evolving in an
R-type manner do not (where the enrichment is studied using
the S. cerevisiae genes in each of the pertaining SOGs). We
also found that the fraction of sequence-similar SOGs is sig-
nificantly larger among pairs of C-type co-evolving genes than
GO categories (biological processes) with extreme mean and variance of their rERPs (for a unbiased comparison we included only GO groups with 5 to 20 genes)Figure 4
GO categories (biological processes) with extreme mean and variance of their rERPs (for a unbiased comparison we included only GO groups with 5 to 20
genes).
High Mean High Variance
GO description Mean
of
rERP
No. of
Genes
GO description Variance
of rERP
No. of
Genes
Tricarboxylic acid cycle 790 5 Tricarboxylic acid cycle 243 5
Ergosterol biosynthetic process 749 14 Branched chain family amino
acid biosynthetic process
207 5
Protein targeting to ER 744 10 ATP synthesis coupled proton
transport
205 5
Chromosome segregation 742 18 Transcription initiation from
RNA polymerase III promoter
200 7
ATP synthesis coupled proton
transport
739 5 RNA processing 200 5
GPI anchor biosynthetic
process
737 9 Cell ion homeostasis 182 5
DNA recombination 714 6 Chromatin modification 167 11
Heme biosynthetic process 714 6 Transcription termination from
RNA polymerase II promoter
164 5
Protein import into nucleus 709 13 Postreplication repair 162 6
tRNA export from nucleus 703 8 Peroxisome organization and
biogenesis
158 6
Low Mean Low Variance
Exocytosis 415 7 Pseudohyphal growth 68 12
Late endosome to vacuole
transport
401 9 Protein import into nucleus 68 13
Protein amino acid
dephosphorylation
386 7 Small GTPase mediated signal
transduction
67 7
Negative regulation of
transcription from RNA
polymerase II promoter, mitotic
381 7 Protein export from nucleus 62 8
Small GTPase mediated signal
transduction
377 7 Protein complex assembly 61 15
Regulation of transcription,
DNA-dependent
364 6 mRNA export from nucleus 61 17
Cytoskeleton organization and
biogenesis
363 7 Mitochondrion organization
and biogenesis
55 13
Cell ion homeostasis 355 5
tRNA modification
51 15
Nucleotide excision repair,
DNA duplex unwinding
307 5 Endocytosis 47 20
Genome Biology 2009, Volume 10, Issue 5, Article R48 Tuller et al. R48.6
Genome Biology 2009, 10:R48
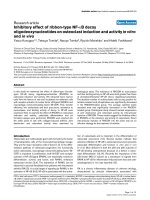
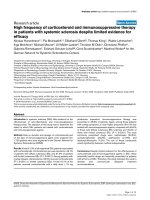
Hierarchical clustering of GO groups (for biological process (top), cellular component (middle), and molecular function (bottom)) according to their rERPsFigure 5
Hierarchical clustering of GO groups (for biological process (top), cellular component (middle), and molecular function (bottom)) according to their
rERPs.
Cell_cycle
Meiosis
Response_to_stress
DNA_Metabolism
Signal_transduction
Sporulation
Cell_homeostasis
Protein_modification
Nuclear_organization_and_biogenesis
Transcription
Lipid_metabolism
Morphogenesis
conjugation
Pseudohyphal_growth
Organelle_organization_and_biogenesis
Ribosome_biogenesis_and_assembly
RNA_Metabolism
Cytoskeleton_organization_and_biogenesis
Vitamin_metabolism
Transport
Vesicle_mediated_transport
cytokinesis
Membrane_organization_and_biogenesis
Cell_budding
cellular_respiration
Generation_of_precursor_metabolites_and_energy
Carbohydrate_metabolism
Electron_transport
Protein_catabolism
Cell_wall_organization_and_biogenesis
Amino_acid_and_derivative_metabolism
Protein_biosynthesis
Plasma_membrane
Chromosome
Cell_cortex
Cell_wall
Peroxisome
Cytoplasmic_membrane_bound_vesicle
Golgi_apparatus
Bud
Site_of_polarized_growth
Endomembrane_system
Membrane
Cytoplasm
Mitochondrial_envelope
Mitochondrion
Endoplasmic_reticulum
Membrane_fraction
Ribosome
Nucleolus
Nucleus
Cytoskeleton
Microtubule_organizing_center
Lyase_activity
Ligase_activity
Helicase_activity
Isomerase_activity
Translation_regulator_activity
Oxidoreductase_activity
DNA_binding
Protein_binding
RNA_binding
Enzyme_regulator_activity
Transporter_activity
Structural_molecule_activity
Nucleotidyltransferase_activity
Signal_transducer_activity
Transcription_regulator_activity
Phosphoprotein_phosphatase_activity
Protein_kinase_activity
Transferase_activity
Hydrolase_activity
Motor_activity
Peptidase_activity
887
792
698
603
509
860
747
633
519
405
( 1, 10)
( 2, 10)
(10,11)
( 3, 11)
(11,12)
( 4, 12)
(12,13)
(13,14)
( 5, 14)
( 6, 14)
(13,15)
( 7, 15)
(15,16)
( 8, 16)
( 9, 16)
( 1, 10)
( 2, 10)
(10,11)
( 3, 11)
(11,12)
( 4, 12)
(12,13)
(13,14)
( 5, 14)
( 6, 14)
(13,15)
( 7, 15)
(15,16)
( 8, 16)
( 9, 16)
844
765
686
608
529
( 1, 10)
( 2, 10)
(10,11)
( 3, 11)
(11,12)
( 4, 12)
(12,13)
(13,14)
( 5, 14)
( 6, 14)
(13,15)
( 7, 15)
(15,16)
( 8, 16)
( 9, 16)
Genome Biology 2009, Volume 10, Issue 5, Article R48 Tuller et al. R48.7
Genome Biology 2009, 10:R48
among pairs of R-type co-evolving genes (Note 2 in Addi-
tional data file 2).
Co-evolutionary network of SOGs and its properties
To track down the co-evolution of SOGs, we generated a co-
evolution network where two SOGs (termed, for convenience,
according to the S. cerevisiae genes they contain) are con-
nected by an edge only if there is a significant (either positive
or negative) Spearman rank correlation (with P < 0.05)
between their rERPs. The node degrees in the co-evolution
network follow a power-law distribution (Figure 9) and the
network has small world properties (the average distance
between two nodes is 5.03). Many biological networks (for
example, see [38,39]) exhibit similar properties. The degree
in the co-evolutionary network is significantly correlated with
the degree in the S. cerevisiae protein interaction network (r
= 0.0726, P = 0.0125) but is not significantly correlated with
the degree in the S. cerevisiae genetic interaction network, or
with the degree in its gene expression network.
Co-evolution is correlated with similar functionality
A co-evolution network of cellular functional categories was
built for each of the three GO ontologies (biological process,
cellular component, molecular function), using two signifi-
cance cutoff values (Spearman P-value < 0.01 and Spearman
P-value < 0.001) to determine significant correlations
between GO categories. A list of highly correlated pairs of GO
terms is provided in Additional data file 5. The correlation
between the distance of GO groups in the 0.001 cutoff co-evo-
lution network (that is, their evolutionary distance) and their
Two hypothetical examples that demonstrate the difference between measuring co-evolution using rERP and applying the average ER along the entire evolutionary treeFigure 6
Two hypothetical examples that demonstrate the difference between measuring co-evolution using rERP and applying the average ER along the entire
evolutionary tree. (a) An example in which ER is high but rERP is low: two SOGs (in red) have similar average ER (|E1 - E2| is small) but the correlation
between their ERP vectors is low. Note that the level of co-evolution is low in both cases, but the pattern along the phylogenetic tree is very different. (b)
A hypothetical evolutionary tree. (c) An example in which ER is low but rERP is high: two SOGs (in blue) have similar ERPs but their mean ERs are
different. In this case a similar pattern can be seen despite very different levels of ER.
a
bc
de
f
g
h
i
j
k
l
m
n
ER
SOG2
(n,i)
(n,j) (j,d) (j,c)
Edges
SOG1
(n,i)
(n,j) (j,d) (j,c)
Edges
SOG2
(n,i)
(n,j) (j,d) (j,c)
Edges
SOG1
(n,i)
(n,j) (j,d) (j,c)
Edges
ER
ER
ER
(a) (b) (c)
Average correlation between the evolutionary patterns of pairs of GO groups (y-axis) as a function of their distance (the shortest connecting pathway) in the GO network (x-axis)Figure 7
Average correlation between the evolutionary patterns of pairs of GO
groups (y-axis) as a function of their distance (the shortest connecting
pathway) in the GO network (x-axis). The distribution of correlations in
three out of six consecutive pairs of distance bins is significantly different
(t-test, P < 0.05). The correlation between distance (x-axis) and average
correlation (y-axis) is -0.96 (P < 4.5 × 10
-4
; a similar result was observed
when we used the ontology of S. pombe (Additional data file 4)). The
increase distance 9-10 though deviating from the overall trend is not
significant (P = 0.23).
1-2 3-4 5-6 7-8 9-10 11-12 13-14
p < 8*10
-14
p < 0.048
p < 6*10
-7
Distance in the GO graph
Correlation
0.07
0.03
0.04
0.05
0.06
0.02
-0.01
0
0.01
Genome Biology 2009, Volume 10, Issue 5, Article R48 Tuller et al. R48.8
Genome Biology 2009, 10:R48
distance in the corresponding GO ontology network (that is,
their functional distance) is highly significant: 0.38 for cellu-
lar component, 0.16 for biological process and 0.43 for molec-
ular function (all three with P-values <10
-16
; a similar trend is
observed using the 0.01 cutoff network). A similarly marked
correlation between evolutionary and functional relation-
ships of GO groups is also found when considering positive
and negative co-evolution networks separately (Note 3 in
Additional data file 2).
Similar results were observed when we considered classifica-
tion according to Enzyme Commission (EC) number [40],
An illustrative example involves the category of methionine biosynthesis, which has a negative rERP correlation with phosphatidylcholine (PC) biosynthesis, an important and abundant structural component of the membranes of eukaryotic cellsFigure 8
An illustrative example involves the category of methionine biosynthesis, which has a negative rERP correlation with phosphatidylcholine (PC) biosynthesis,
an important and abundant structural component of the membranes of eukaryotic cells. PC is synthesized by three successive transfers of methyl groups
from S-adenosyl-methionine to phosphatidyl-ethanolamine [36,37]; thus, the evolution of PC biosynthetic pathways may be conditioned by the evolution
of methionine biosynthesis pathways, and follow it by some time lag. This phenomenon is demonstrated in the subtree below internal node 11 (a). The
rERPs of these two GO functions are shown in (b).
1. S. cerevisiae
2. S. bayanus
3. S. glabrata
4. K. lactis
5. D. hansenii
6. C. albicans
7. Y. lipolytica
8. A. nidulans
9. S. pombe
10
11
12
13
14
15 16
(a)
1_10
2_10
10_11
3_11
11_12
4_12
12_13
13_14
5_14
6_14
13_15
7_15
15_16
8_16
9_16
(b)
Genome Biology 2009, Volume 10, Issue 5, Article R48 Tuller et al. R48.9
Genome Biology 2009, 10:R48
which is a numerical classification scheme for enzymes based
on the chemical reactions they catalyze. By this classification,
the code of each enzyme consists of the letters 'EC' followed
by four numbers separated by periods. Those numbers repre-
sent progressively finer classifications of the enzyme. Thus, it
induces a functional distance. Our analysis shows that pairs
of orthologs with smaller functional distance (genes whose
first two roughest classification levels are identical) exhibit
higher levels of correlation between their rERP than other
pairs of orthologs (mean rERP correlation of 0.31 versus 0.27,
P = 1.23 × 10
-7
).
Co-evolutionary score and other properties of cellular functions and
SOGs
We did not find a parallel significant correlation between the
genomic co-localization of GO groups and their co-evolution-
ary score (see Materials and methods for a description of how
we computed the co-localization score of pairs of GO groups).
The co-evolution of genes and their chromosomal location are
not correlated even when considering each chromosome sep-
arately. Thus, we conclude that cellular functionality is a
more important force driving gene co-evolution than their
genomic organization.
The rERP measure correlates well with other systemic quali-
ties such as genetic and physical interactions. The average
Spearman correlation between rERP levels of interacting pro-
teins in the S. cerevisiae protein interaction network is 0.063,
which is 155 times higher than the average correlation (4.05 ×
10
-4
) for non-interacting proteins (P < 10
-16
). Proteins that are
part of a complex show a correlation of 0.05 between their
rERPs, 100 times higher than the average correlation for pro-
teins that are not a part of the same complex (P < 10
-16
). The
Spearman correlation between rERP levels of genetically
interacting proteins is 0.02, which is 32 times higher than the
average correlation (6.08 × 10
-4
) for non-interacting proteins
(P = 2.71 × 10
-6
). Protein rERPs are also correlated with the
co-expression of their genes (Spearman correlation 0.063, P
< 10
-16
). The significant correlation between co-evolution and
physical/functional interactions suggests that physical inter-
actions between the products of conserved genes play a part
in their co-evolution. Namely, to maintain the functionality of
an interaction, a change in one protein is likely to facilitate the
evolution of the proteins interacting with it, as has already
been shown [5]. Yet, as the magnitude of this correlation is
rather low, it is likely that other co-evolutionary forces play a
part in determining co-evolution, such as the sharing of com-
mon and varying growth environments during evolutionary
history.
Clustering of co-evolutionary networks
We employed the PRISM algorithm [41] to partition each of
the three GO co-evolution networks (biological process, cellu-
lar component, molecular function) into clusters of nodes,
such that nodes from one cluster have similar sign connec-
tions (denoting positive or negative rERP correlations) with
nodes from other clusters. We focus here on biological proc-
esses at a significance cutoff value of P < 0.01 (Figure 10).
PRISM clusters the process terms into coherent groups in a
statistically significant manner (P < 0.001; see Materials and
methods), where most of the groups are enriched for particu-
lar types of processes: Cluster A7 contains many processes
related to DNA metabolism, chromatin formation and RNA
processing. This cluster shows strong negative correlations
with clusters A6 (amino acid biosynthesis, tricarboxylic acid
cycle, glucose oxidization and energy production) and cluster
A8 (protein processing and modification). It has also strong
positive correlations with cluster A4 (nuclear traffic and DNA
repair) and with cluster A5. We note that among the RNA-
related processes in cluster A7, some (such as mRNA export
from nucleus and poly-A dependent mRNA degradation)
show R-type correlations with functions such as protein deg-
radation via the multivesicular pathway. This relationship
points to a mode of evolution in which the two catabolic proc-
esses (protein and RNA) require coordination, so that
changes in one are dependent on preceding changes in the
other. Similarly, cluster A6 shows strong coordinated co-evo-
lution with cluster A3 (amino acid and purine biosynthesis,
glucose oxidization, energy production and ribosome biol-
ogy). Both clusters include GO functions related to the pro-
duction of energy and, thus, coordinated evolution is
expected. An overview of the results shows that genes that
affect regulatory or information-related processes (DNA
metabolism, chromatin formation and RNA processing (clus-
ter A7)) are 'master players'. These master genes/processes
exert reciprocal selection forces on many other metabolic
process (clusters A8, A3 and A6) and participate in the co-
The degree distribution in the co-evolution network is not far from a power-law (the plot of the log(number of genes) as a function of the log(degree) appears in the right-upper cornerFigure 9
The degree distribution in the co-evolution network is not far from a
power-law (the plot of the log(number of genes) as a function of the
log(degree) appears in the right-upper corner. The correlation between
these two measures is -0.77, P = 7.4 × 10
-11
.
Degree
Gene Count
Log Degree
Log Gene Count
Genome Biology 2009, Volume 10, Issue 5, Article R48 Tuller et al. R48.10
Genome Biology 2009, 10:R48
evolution of other processes such as nuclear traffic (cluster
A4).
Co-evolution of less conserved genes
The copy number pattern measure
The results presented above were focused on the analysis of a
conserved set of genes whose orthologs appear in all nine fun-
gal species studied, comprising 1,372 SOGs and spanning a
total of 12,348 genes. The fungal dataset additionally includes
2,168 orthologous sets spanning more than 74,851 genes that
exhibit at least one change in their copy number along the
phylogenetic tree (and hence have undergone gene loss and/
or gene duplication events). The 'propensity for gene loss'
(PGL) [17] was shown to correlate with gene essentiality, the
number of protein-protein interactions and the expression
levels of genes. PGL has been used in methods for predicting
functional gene linkage [42,43], extending upon previous
methods that used the occurrence pattern of a gene in differ-
ent organisms for the same aim [12-14]. Recently, a probabil-
istic approach related to the PGL was developed [42]. A
related measure, which is also based on a gene's phyletic pat-
tern (the occurrence pattern of a gene in different current
organisms), is phylogenetic profiling (PP) [15,16,43]. This
measure has been employed in previous small scale studies to
identify sets of genes with a shared evolutionary history [12-
15,43]. We describe a new measure of co-evolution that is a
generalization/unification of both PGL and PP, termed the
copy number pattern (CNP). Like PP, it characterizes each
gene by examining its phyletic pattern (but additionally takes
into account the number of paralogous copies of each gene in
the genome). Like PGL, it exploits the information embedded
in a species' phylogenetic tree to more accurately characterize
the evolutionary history of each gene (in comparison, PP car-
ries out a similar computation based on just the phyletic pat-
tern). We used the new CNP measure to analyze orthologous
sets that exhibit at least one change in copy number along the
analyzed phylogentic tree. This set of genes is, by definition,
not completely conserved, and complements the conserved
set of genes analyzed by the rERP measure.
Figure 11 provides a stepwise overview of CNP computation.
Steps A to F are essentially similar to those used to generate
Clustering of biological process GO terms according to their rERP correlations using the PRISM algorithm (with the less stringent significance criterion of P < 0.01)Figure 10
Clustering of biological process GO terms according to their rERP correlations using the PRISM algorithm (with the less stringent significance criterion of
P < 0.01).
Energy production
DNA and RNA
metabolism
Nuclear traffic
and DNA repair
Ribosome biology,
vesicular biology,
small molecule
biosynthesis
Cell cycle
progression, protein
processing and
modification
A7
A6
A5
A8
A1
A2
A3
A4
Genome Biology 2009, Volume 10, Issue 5, Article R48 Tuller et al. R48.11
Genome Biology 2009, 10:R48
the rERP (see Materials and methods): we first generate a set
of 2,168 orthologous sets that exhibit at least one change in
copy number along the analyzed phylogentic tree. We then
translate the resulting set of orthologs to copy numbers in
each organism (the number of paralogs in an organism), and
reconstruct the ancestral gene copy number using CAFE' [44]
(step F in Figure 11). Finally, using the copy number in each
internal node, we compute the change (the difference) in copy
number for orthologous sets along each edge (step G in Figure
11). The orthologous sets used for the rERP analysis and the
orthologous sets used for the CNP analysis include two differ-
ent, exclusive groups of conserved versus less-conserved
genes, respectively. Analysis of these sets reveals that the first
group is enriched with metabolic processes while the second
is enriched with functional processes such as reproduction
and cell differentiation (Additional data file 6).
Co-evolution of less conserved genes with the copy number pattern
measure
Since changes in the copy number of genes are infrequent
events, the Spearman correlations between pairs of CNP vec-
tors are usually very high (the average Spearman correlation
is 0.63). To overcome this, we generated CNP vectors of GO
processes (according to the biological processes ontology)
where the CNP of a GO category is the mean CNP of all the
genes it contains. These GO process vectors exhibit a wider
range of CNP values. Next, we constructed a GO process co-
evolution network. In this network two biological processes
are connected by an edge only if they manifest an extreme co-
evolution pattern - that is, if they have a Spearman rank cor-
relation that is higher (green colored edges, denoting coordi-
nated relationships) or lower (red, denoting reciprocal
relationships) than the correlation values of X% of the total
GO pairs. We examined the networks formed under two edge-
selection regimes, a more stringent one where X% = 99.9%
and a less stringent one where X% = 98%. The correlation
between the distance of GO groups in the network with X% =
99.9% and the distance of GO groups in the different GO
ontology networks is highly significant (r = 0.4209, P < 10
-16
)
for green, cooperative edges, and negatively correlated (r = -
0.12, P < 0.04) for red, reciprocal edges. This suggests that
the two types of edges are informative: the green edges repre-
sent functional relationships while the red ones represent
pairs of GOs with distant functions.
Clustering of the copy number pattern evolutionary network
To learn more about the structure of the CNP co-evolution
network, we used the PRISM algorithm [41] (as in the case of
the rERP analysis) to partition each of the GO terms in the
less stringent network (X% = 98%; thus obtaining a larger
amount of edges and a more robust clustering) into clusters of
nodes, such that nodes from one cluster have similar color
edge connections with nodes from other clusters. PRISM is
able to separate the process terms into coherent groups
according to their mutual correlations, in a statistically signif-
icant manner (P < 0.001; see Materials and methods). Figure
12 displays the results of the PRISM analysis, clustering of the
GO biological processes into seven large groups. The seven
interconnected groups are enriched with specific processes,
and present clear interactions of the red and green edges. As
clearly seen in Figure 12, some clusters show mainly recipro-
cal co-evolution with most of the others (for example, clusters
B1 (fatty acid metabolism) and B6 (sugar metabolism). In
contrast, clusters B2, B3 and B7 (nuclear traffic, transcription
and DNA metabolism) show coordinated (C-type) co-evolu-
tion. Cluster B4 (protein modification, chromatin silencing)
shows C-type co-evolution with transcription (cluster B3) and
nuclear import (cluster B2) as well as DNA metabolism (clus-
ter B7) but R-type relations with cluster B1, which includes
fatty acid metabolism and protein glycosylation.
Comparison of the co-evolution of conserved versus less-conserved
genes
A comparison between the results obtained by the rERP and
CNP methodologies at a global level should be done with
some caution, for three main reasons. First, these two meas-
ures are applicable for the analysis of completely disjoint,
complementary sets of orthologs. Second, the two methodol-
ogies measure different types of co-evolution. The rERP
measures evolution via amino acid substitutions while the
CNP measures co-evolution via changes in gene copy number,
which are mainly driven by gene gain and loss events. Thus,
third, these co-evolutionary relationships are possibly the
result of the action of different evolutionary forces. However,
it may be noted that some biological processes present the
same type of evolutionary relationship with both methods.
The different steps in computing CNP (a detailed description is provided in the 'Co-evolution of less conserved genes' section)Figure 11
The different steps in computing CNP (a detailed description is provided
in the 'Co-evolution of less conserved genes' section).
B. Find sets of
orthologs
A. Identify the
phylogenetic
tree
D. Align each
set and concatenate
the alignments
C. Remove
paralogs
F. Reconstruct
ancestral copy
numbers
E. Reconstruct the
branch
lengths of the tree
G. Analyze the vectors of
changes in orthologous
copy numbers along the
tree branches
Genome Biology 2009, Volume 10, Issue 5, Article R48 Tuller et al. R48.12
Genome Biology 2009, 10:R48
For example, DNA metabolism is always positively correlated
with nuclear traffic, transcription and vacuolar biology (ER-
Golgi traffic). Yet, some of the clusters exhibit different rela-
tionships when analyzed by the two measures. For example, a
cluster containing mainly genes labeled ribosome biology and
vacuolar biology exhibits reciprocal evolution with DNA
metabolism by rERP (clusters A3 to A7) but coordinated evo-
lution by CNP (clusters B5 to B7). Thus, within a certain bio-
logical process, the evolutionary pressures exerted on highly
conserved genes may differ from those that apply to less con-
served ones, and may thus provide different opportunities for
co-evolution.
Conclusions
Our analysis charts the first global network view of the co-
evolution of conserved and less conserved genes in nine fun-
gal species. We find that cellular functions play a more impor-
tant driving force in gene co-evolution than the genes'
chromosomal location. Two fundamental patterns of co-evo-
lution, cooperative and reciprocal, are defined, and, remark-
ably, we find that only genes co-evolving cooperatively
functionally back each other up. At the single gene level, the
observation that genes have evolved at accelerated rates in a
localized manner on only three branches of the fungal tree is
in line with previous findings suggesting that a large fraction
of DNA mutations can be attributed to punctuated evolution
[4]. The fungal tree analyzed here is a natural starting point.
The future application of the approach presented here to
other phylogenetic trees, including the mammalian one,
holds much promise in characterizing the forces that shape
cellular co-evolution.
Materials and methods
Data sources
The GO functional classification used in this work is the most
comprehensive, qualitative, and widely used annotation data-
base [45].
The GO and GO slim annotations and protein composition
data for complexes were downloaded from the Saccharomy-
ces Genome Database [46]. We checked and report results
both for the GO slim classification (Figure 5), the roughest
level of classification, and the general GO ontology (Figures 4,
7, 8, 10, and 12), where we filtered GO groups that were too
small (with less than five SOGs in our dataset). That is, the
main bulk of the analysis was performed across the whole GO
Clustering of biological process GO terms according to their CNP using the PRISM algorithm (P < 0.04)Figure 12
Clustering of biological process GO terms according to their CNP using the PRISM algorithm (P < 0.04).
B1. Fatty acid metabolism,
polyamine transport, protein
glycosylation
B2. Nuclear
traffic,
endo/exocytosis,
cell polarity
B3. Transcription
regulation, Stress
response
B5. Ribosome
biology, vesicular
biology
B6. Sugar
metabolism,
cell wall
biosynthesis
B7. Meiosis, DNA
metabolism,
chromosome
segregation
B4. Protein
modification,
chromatin silencing
Genome Biology 2009, Volume 10, Issue 5, Article R48 Tuller et al. R48.13
Genome Biology 2009, 10:R48
ontology, without focusing on any arbitrary level. Note 4 in
Additional data file 2 and Additional data file 7 includes sta-
tistics and error rates of the annotations used in this work.
The genetic interaction network data were downloaded from
the BioGrid database [47]; similar results were obtained
when the genetic interaction network of Tong et al. [38] was
used (data not shown). Recent work showed that only 5% of
the genetic interactions are conserved in S. cerevisiae and
Caenorhabditis elegans [48]. Note that the evolutionary dis-
tances between these species (1,542 million years, according
to [17]) are much larger than those between the organisms in
our dataset (20 to 837 million years). Further, C. elegans is
multi-cellular while all the analyzed fungi are unicellular.
Thus, it is not clear how the conclusions of Tischler et al. [48]
are related to our dataset.
More importantly, in this work we study the relationship
between the genetic interaction network and its co-evolution-
ary network for one organism (S. cerevisiae) for which we
know the genetic interactions network. As there is no reason
to believe that this organism is 'special' in any way, we believe
that these findings are representative of the expected findings
for other organisms if or when their genetic interaction net-
works become known.
The protein interaction network of the budding yeast S. cere-
visiae was downloaded from the BioGrid database [47].
Gene expression data were taken from the Stanford MicroAr-
ray Database [49]. The GO ontology network of yeast was
downloaded from the Open Biomedical Ontologies Foundry
ontologies [50]. EC numbers of the analyzed genes were
downloaded from the Kyoto Encyclopedia of Genes and
Genomes (KEGG) [51].
Computing relative evolutionary rate patterns for
orthologous gene sets
The selection of species used here is not arbitrary; obviously,
different selections are perhaps equally plausible but several
considerations led us to the current selection, which we out-
line below. For this study, we used fungi whose genomes have
been completely assembled (at the time this study was per-
formed: July 2007) according to the National Center for Bio-
technology Information (NCBI) and for which we could infer
the tRNA gene repertoire reliably and, thus, compute the
tRNA adaptation index (tAI). These include S. cerevisiae, C.
glabrata, K. lactis, D. hansenii, Y. lipolytica and Schizosac-
charomyces pombe. This selection was then augmented by
three additional species: C. albicans, an important fungal
pathogen for which a high-quality gene collection (including
tRNA genes) has recently become available [52]; S. bayanus,
a Saccharomyces sensu stricto species that diverged from S.
cerevisiae approximately 20 million years ago and for which
an overwhelming majority of the open reading frames are
available [53]; and A. nidulans, a filamentous fungus with a
high-quality sequence. Furthermore, these species were ana-
lyzed recently by Man and Pilpel [33], serving as an appropri-
ate reference set for studying evolutionary events in fungi.
Finally, due to the large evolutionary distance between S.
pombe and the hemiascomycotic species (350 to 1,000 mil-
lion years ago [25]), this set of species present a nice distribu-
tion of evolutionary time. We believe that small changes in
the set of fungi species would likely yield quite similar results
(see details in Note 5 in Additional data file 2).
The final dataset included genomes of nine fungal species: A.
nidulans, C. albicans, C. glabrata, D. hansenii, K. lactis, S.
bayanus, S. cerevisiae, S. pombe, Y. lipolytica.
Computation of the rERPs is a multi-step process (Figure 1
provides an overview), described in detail as follows. The phy-
logenetic tree used to analyze the data (Figure 2) was formed
according to the analysis of 18S rRNA data in [26], the analy-
sis of 531 concatenated proteins [27], and the analysis of addi-
tional gene sets listed in [54] (step A in Figure 1). The
orthologous sets for the nine fungi were downloaded from
[33] (step B in Figure 1). This dataset was generated by the
MultiParanoid program [55]. We considered only sets that
include orthologs in all nine species. Sets of homologs that did
not include exactly one representative in each organism were
removed from our dataset to filter out paralogs and avoid
potential errors in evolutionary rate estimation due to dupli-
cation events (step C in Figure 1). Horizontal gene transfer
events (see, for example, [56]) are rare in fungi [35] and thus
were not considered in our analysis. The final dataset
included 1,372 orthologous sets. Stop codons were removed
and each gene was translated to a sequence of amino acids.
Each orthologous set was then aligned by CLUSTALW 1.83
[57] with default parameters. By using amino acids as tem-
plates for the nucleotide sequences and by ignoring gaps we
generated gap-free multiple alignments of the nine ortholo-
gous proteins in each orthologous set and their corresponding
coding sequences (step D in Figure 1).
Given the alignments of each set of orthologs and given the
phylogenetic tree, we used the codeml program in PAML for
the joint reconstruction of ancestral codons [58] in each of the
internal nodes of the phylogenetic tree (step E in Figure 1).
This reconstruction induced the sequence of ancestral pro-
teins and their corresponding ancestral DNA coding
sequences. We hence obtained sets of 16 sequences; 9 from
the previous step (corresponding to the 9 leaves of the phylo-
genetic tree; Figure 2) plus 7 reconstructed sequences of the
internal nodes of the phylogenetic tree (ancestral nodes 10-16
in Figure 2). We denote such a set of 16 sequences a 'complete
ortholgous set'. For each complete ortholgous set, we com-
puted the dN and dS in each branch of the evolutionary tree
using the y00 program in PAML [28,59] (step F in Figure 1).
The outputs of this stage are two vectors of 15 positive real
numbers for each complete ortholgous set (1,372 pairs of vec-
Genome Biology 2009, Volume 10, Issue 5, Article R48 Tuller et al. R48.14
Genome Biology 2009, 10:R48
tors in our case). These vectors denote the dN and dS values
at the 15 different branches of the evolutionary tree.
To adjust for selection on synonymous sites [60], we used a
procedure similar to that described in [29], utilizing the tAI
[61] instead of the codon adaptation index [33,62]. Following
Hirsh et al. [29], we assume the following model of evolution
on synonymous sites:
where r
0
is the neutral evolutionary rate, k is a constant, and
t is time. Our goal is to estimate dS' = r
0
× t, which is done
using regression. This requires the computation of the tAIs of
each of the gene sequences (the leaves of the phylogenetic
tree), and the estimation of the tAIs of the sequences at the
internal nodes of the phylogenetic tree. To this end (step G in
Figure 1) we used the tRNA copy number of each species as
reported in [33], and the ancestral tRNA copy numbers were
reconstructed following [44] (step I in Figure 1) using the
CAFÉ program.
The edge lengths (step H in Figure 1) for CAFÉ were com-
puted by the following steps. Step one: we inferred edge
lengths under the molecular clock assumption for the tree
topology of Figure 2 and the concatenation of all the sets of
ortholog proteins (561,072 sites) using the codeml program in
PAML [59]. Step two: we normalized the log of branch lengths
to obtain branch lengths that are integers between 0 and
1,000 that reflect putative time units (this is the requirement
of the method of [44]. Step three: we used an expectation-
maximization (EM) algorithm to find the optimal value of λ
(0.001756) for the model (see [44]).
It is important to note that by optimizing λ we actually opti-
mize the likelihood of the model, and the result is invariant
for the choice of the normalization factor of the branch
lengths. The relatively similar tRNA copy number distribu-
tion of the nine species [33] also induces a quite similar tRNA
copy number distribution at the ancestral nodes of the phylo-
genetic tree. To compute the tAI of each complete ortholo-
gous set (step J in Figure 1), we used the Matlab, R, and Pearl
scripts from [61] (see [61] for the exact description of how to
compute the tAI).
Thus, by using tAI and dS we were able to adjust the dS values
for selection on synonymous sites, resulting in a new value,
dS'. This was done for each ortholgous set in each of the tree
branches (step K in Figure 1). These dS' values were used for
computing the corresponding values of adjusted evolutionary
rates, dN/dS'. As mentioned, the idea underlying this step
[29] is to assume a linear relationship between dS and tAI,
and its computation proceeds as follows.
Let i (0 <i < 1,373) denote an index of a complete ortholgous
set, and let j (0 <j < 16) denote a branch in the phylogenetic
tree. We perform the following steps. Step one: for each i and
j compute the average tAI for the sequences at the two ends of
the branch j; let tAIi, j denote this average. Step two: for each
branch j use all the tAI
i, j
and all the dS
i, j
(where 0 <i < 1,373)
and, by regression, estimate a
j
and b
j
that minimize the least
squares error of the model:
Step three: for each i and j and an estimation of the substitu-
tion rate on synonymous sites dS
i, j
, the adjusted selection on
the synonymous sites is:
The final output of this procedure is a total of 1,373 vectors,
each with 15 dN/dS' values denoting the ERP values of each
complete orthologous set.
Usually, for very high levels of substitution rate (long
branches in the evolutionary tree), the error in the estimated
dS values increases [63]. This well known phenomenon is
named saturation. Thus, we perform an additional normali-
zation of the dN values by computing the ranked evolutionary
rate, rER. The ranked evolutionary rate, rER (step L in Figure
1), is computed separately for each branch of the evolutionary
tree. For a given branch, the rank of the dN/dS' of a complete
ortholgous set among the dN/dS' values of all the complete
ortholgous sets is the number of sets that have lower dN/dS'
values in this branch (a number between 1 and the total
number of complete ortholgous sets, 1,373). The rERP of a
complete ortholgous set is the vector of its ranked evolution-
ary rate along the 15 branches of the evolutionary tree. Note 6
in Additional data file 2 and Additional data file 8 include a
comparison of the dN/dS' values to previous evolutionary
rate results in a previous study by Wall et al. [8].
The rERP developed and used in this work is different from
the measure used in [23] in many important ways. We ranked
the ER and adjusted the computed dN/dS for selection on
synonymous sites by using the tAI measure (an approach that
has not been used before). Additionally, we used the non-par-
ametric Spearman correlation instead of the Pearson correla-
tion. A comparison of the results obtained using our measure
with those obtained using Fraser et al.'s ER measure for stud-
ying co-evolution shows that the ratio between the average
correlation of physically interacting genes versus non inter-
acting genes is very low when using Fraser et al.'s measure
(0.06/0.022 = 2.72), showing a very low discriminative
power. In comparison, the ratio obtained using our measure
is markedly higher (0.063/4.05 × 10
-4
= 155), in correspond-
ence with the expectation that interacting proteins would
tend to co-evolve much more than non-interacting ones (for
example, see [24]).
dS r k tAI t=+×()
0
dS b a tAI
jj
=+×
dS dS a tAI
ij ij j ij,
’
,,
=−×
Genome Biology 2009, Volume 10, Issue 5, Article R48 Tuller et al. R48.15
Genome Biology 2009, 10:R48
Measures that were based only on dN instead of dN/dS per-
formed worse than the rERP mentioned above. Using dN
without ranking is problematic as longer branches have, in
general, higher dN and, thus, the correlations obtained were
very high and quite similar when comparing genes that phys-
ically interact and those that do not (r = 0.77 versus r = 0.73).
When we used ranked dN instead of ranked dN/dS, we
achieved better results, which were almost as good as the
results we got using rERP, in terms of separating pairs of
physically interacting from non-interacting proteins via their
co-evolution. For example, the ratio between the correlation
of protein-interacting to non-interacting proteins was 20
using ranked dN, weaker than the ratio of 155 observed using
rERP values.
Constructing and analyzing the co-evolution networks
of GO terms
The co-evolution network of GO terms was constructed as fol-
lows. First, consider only GO groups that include at least
three genes. Second, compute the rERP of each GO group.
Third, compute the Spearman correlation between the rERP
of all pairs of GO groups. Fourth, connect a pair of GO groups,
G
i
and G
j
, if the following two conditions are satisfied: condi-
tion one, they have significant correlation (P < 0.01 in the
case of the network in Figure 10), where significance is com-
puted empirically versus a corresponding random shuffled
network; condition two, the two sets do not strongly overlap
in their gene content, having a Jaccard coefficient < 0.5 [64].
The distance between GO terms on the GO network was com-
puted by replacing each directed edge in the original graph
with an undirected one, and computing the length of the min-
imal path between the two GO groups.
The co-evolution network was clustered and visualized using
the Matlab implementation of the PRISM algorithm [41]. The
PRISM algorithm was instrumental to our analysis as it par-
titions the graph according to the two types of edges (positive
(cooperative) or negative (reciprocal) rERP correlations) to
get clusters of nodes, such that nodes from one cluster have
edges of a similar type with nodes from other clusters. This is
of particular interest when studying co-evolution, since it
identifies 'monochromatic' relationships between groups of
genes/GO functions - that is, groups of genes that relate to
each other in either a completely cooperative or a completely
reciprocal manner. To the best of our knowledge, no other
method/algorithm is available to achieve this goal. Other
clustering algorithms do not preserve the 'monochromatic'
property and, hence, are not suitable for addressing the ques-
tion at hand.
The significance of the monochromaticity of the resulting
clustering was computed by comparing the number of con-
flicts (the number of edges between nodes that are in different
clusters and have a color different from that of the majority of
edges between the two clusters) in the original clustering to
its distribution in 1,000 randomly shuffled networks with
similar topological properties.
Analyzing the genomic co-localization of GO terms
We define the distance between two GO groups as the median
of all shortest distances between each gene in one GO group
to each gene in the other GO group. We did not consider genes
that are common to the two GO groups. For estimating to
what extent two GO groups tend to be located close to each
other in the genome, we computed a P-value based on com-
paring their median distance to that of a background model
obtained by randomly locating all the genes of both groups in
the genome, and recomposing their median distance for each
such assignment (repeating this process 100 times to obtain a
distribution of background model medians). The P-value is
the fraction of times that a random shift yields a lower dis-
tance between the two GO groups.
Abbreviations
CNP: copy number pattern; EC: Enzyme Commission; ER:
evolutionary rate; ERP: evolutionary rate pattern; GO: Gene
Ontology; PC: phosphatidylcholine; PGL: propensity for gene
loss; PP: phylogenetic profiling; rERP: relative evolutionary
rate pattern; SOG: set of orthologous genes; tAI: tRNA adap-
tation index.
Authors' contributions
TT carried out all of the analysis. All authors participated in
the design of the study. All authors were involved in drafting
and writing the manuscript. All authors read and approved
the final manuscript.
Additional data files
The following additional data are available with the online
version of this paper: a table that includes the orthologous
sets that exhibit positive evolution for each of the tree
branches (Additional data file 1); supplementary notes 1 to 6
(Additional data file 2); a table with GO processes with less
than 20 genes (biological process ontology) sorted by their
mean rERP and variance of rERP (Additional data file 3); a
figure that includes the mean correlation between the evolu-
tionary patterns of pairs of GO groups (y-axis) as a function of
their distance (the shortest connecting pathway) in the GO
network (x-axis) when using the ontology of S. pombe (Addi-
tional data file 4); a table with pairs of GO groups exhibiting
a significant correlation between their rERPs (Additional
data file 5); a table with GO enrichments (biological process)
for the conserved and non-conserved genes (Additional data
file 6); a figure that depicts the distribution of the number of
annotations per gene for the conserved and non-conserved
genes (Additional data file 7); a figure that depicts the ER val-
Genome Biology 2009, Volume 10, Issue 5, Article R48 Tuller et al. R48.16
Genome Biology 2009, 10:R48
ues computed in our study versus the ER values computed in
Wall et al. [8] (Additional data file 8).
Additional file 1Orthologous sets that exhibit positive evolution for each of the tree branchesOrthologous sets that exhibit positive evolution for each of the tree branches.Click here for fileAdditional file 2Supplementary notes 1 to 6Supplementary notes 1 to 6.Click here for fileAdditional file 3GO processes with less than 20 genes (biological process ontology) sorted by their mean rERP and variance of rERPGO processes with less than 20 genes (biological process ontology) sorted by their mean rERP and variance of rERP.Click here for fileAdditional file 4Mean correlation between the evolutionary patterns of pairs of GO groups (y-axis) as a function of their distance (the shortest connect-ing pathway) in the GO network (x-axis) when using the ontology of S. pombeMean correlation between the evolutionary patterns of pairs of GO groups (y-axis) as a function of their distance (the shortest connect-ing pathway) in the GO network (x-axis) when using the ontology of S. pombe.Click here for fileAdditional file 5Pairs of GO groups exhibiting a significant correlation between their rERPsPairs of GO groups exhibiting a significant correlation between their rERPs.Click here for fileAdditional file 6GO enrichments (biological process) for the conserved and non-conserved genesGO enrichments (biological process) for the conserved and non-conserved genes.Click here for fileAdditional file 7Distribution of the number of annotations per gene for the con-served and non-conserved genesDistribution of the number of annotations per gene for the con-served and non-conserved genes.Click here for fileAdditional file 8ER values computed in our study versus the ER values computed in Wall et al. [8]ER values computed in our study versus the ER values computed in Wall et al. [8].Click here for file
Acknowledgements
TT is supported by the Edmond J Safra Bioinformatics program at Tel Aviv
University and the Yeshay Horowitz Association through the Center for
Complexity Science. MK is supported by grants from the Israel Science
Foundation, the Israel Cancer Research Fund, the Israel Cancer Association
and the US-Israel Bi-National Fund (BSF). ER's research is supported by
grants from the Israel Science Foundation, including the Converging Tech-
nologies grant with MK, and the Tauber Fund.
References
1. Zuckerkandl E, Pauling LB: Molecular disease, evolution, and
genetic heterogeneity. In Horizons in Biochemistry Edited by: Kasha
M, Pullman B. New York: Academic Press; 1962:189-225.
2. Kumar S: Molecular clocks: four decades of evolution. Nat Rev
Genet 2005, 6:654-662.
3. Douzery EJ, Delsuc F, Stanhope MJ, Huchon D: Local molecular
clocks in three nuclear genes: divergence times for rodents
and other mammals and incompatibility among fossil cali-
brations. J Mol Evol 2003, 57:S201-213.
4. Pagel M, Venditti C, Meade A: Large punctuational contribution
of speciation to evolutionary divergence at the molecular
level. Science 2006, 314:119-121.
5. Fraser HB, Hirsh AE, Steinmetz LM, Scharfe C, Feldman MW: Evolu-
tionary rate in the protein interaction network. Science 2002,
296:750-752.
6. Hirsh AE, Fraser HB: Protein dispensability and rate of evolu-
tion. Nature 2001, 411:1046-1049.
7. Drummond DA, Bloom JD, Adami C, Wilke CO, Arnold FH: Why
highly expressed proteins evolve slowly. Proc Natl Acad Sci USA
2005, 102:14338-14343.
8. Wall DP, Hirsh AE, Fraser HB, Kumm J, Giaever G, Eisen MB, Feld-
man MW: Functional genomic analysis of the rate of protein
evolution. Proc Natl Acad Sci USA 2005, 102:5483-5488.
9. Pál C, Papp B, Lercher MJ: An integrated view of protein evolu-
tion. Nat Rev Genet 2006, 7:337-348.
10. Chena Y, Dokholyana NV: The coordinated evolution of yeast
proteins is constrained by functional modularity. Trends Genet
2006, 22:416-419.
11. Marino-Ramirez L, Bodenreider O, Kantz N, Jordan IK: Co-evolu-
tionary rates of functionally related yeast genes. Evol Bioinform
Online 2006, 2:295-300.
12. Wu J, Kasif S, DeLisi C: Identification of functional links
between genes using phylogenetic profiles. Bioinformatics 2003,
19:1524-1530.
13. Snel B, Huynen MA: Quantifying modularity in the evolution of
biomolecular systems. Genome Res 2004, 14:391-397.
14. Bowers PM, Pellegrini M, Thompson MJ, Fierro J, Yeates TO, Eisen-
berg D: Prolinks: a database of protein functional linkages
derived from coevolution. Genome Biol 2004, 5:R35.
15. Jothi R, Przytycka TM, Aravind L: Discovering functional linkages
and uncharacterized cellular pathways using phylogenetic
profile comparisons: a comprehensive assessment. BMC Bio-
informatics 2007, 8:173.
16. Sun J, Xu J, Liu Z, Liu Q, Zhao A, Shi T, Li Y: Refined phylogenetic
profiles method for predicting protein-protein interactions.
Bioinformatics 2005, 21:3409-3415.
17. Krylov DM, Wolf YI, Rogozin IB, Koonin EV: Gene loss, protein
sequence divergence, gene dispensability, expression level,
and interactivity are correlated in eukaryotic evolution.
Genome Res 2003, 13:2229-2235.
18. Lopez-Bigas N, De S, Teichmann SA: Functional protein diver-
gence in the evolution of Homo sapiens. Genome Biol 2008,
9:R33.
19. Pazos F, Helmer-Citterich M, Ausiello G, Valencia A: Correlated
mutations containinformation about protein-protein inter-
action. J Mol Biol 1997, 271:511-523.
20. Goh C, Cohen FE: Co-evolutionary analysis reveals insights
into protein-protein interactions. J Mol Biol 2002, 324:177-192.
21. Pazos F, Valencia A: In silico two-hybrid system for the selection
of physically interacting protein pairs. Proteins 2002,
47:219-227.
22. Ramani AK, Marcotte EM: Exploiting the co-evolution of inter-
acting proteins to discover interaction specificity. J Mol Biol
2003,
327:273-284.
23. Fraser HB, Hirsh AE, Wall DP, Eisen MB: Coevolution of gene
expression among interacting proteins. Proc Natl Acad Sci USA
2004, 101:9033-9038.
24. Juan D, Pazos F, Valencia A: High-confidence prediction of global
interactomes based on genome-wide coevolutionary net-
works. Proc Natl Acad Sci USA 2008, 105:934-939.
25. Berbee M, Taylor J: Systematics and evolution. In The Mycota Vol-
ume VIIB. Edited by: McLaughlin D, McLaughlin E, Lemke P. Berlin:
Springer; 2001:229-245.
26. Prillinger H, Lopandic K, Schweigkofler W, Deak R, Aarts HJ, Bauer
R, Sterflinger K, Kraus GF, Maraz A: Phylogeny and systematics
of the fungi with special reference to the Ascomycota and
Basidiomycota. Chem Immunol 2002, 81:207-295.
27. Kuramae EE, Robert V, Snel B, Weiss M, Boekhout T: Phylogenom-
ics reveal a robust fungal tree of life. FEMS Yeast Res 2006,
6:1213-1220.
28. Yang Z, Nielsen R: Estimating synonymous and nonsynony-
mous substitution rates under realistic evolutionary models.
Mol Biol Evol 2000, 17:32-43.
29. Hirsh AE, Fraser HB, Wall DP: Adjusting for selection on synon-
ymous sites in estimates of evolutionary distance. Mol Biol Evol
2005, 22:174-177.
30. Koonin EV, Rogozin IB: Getting positive about selection.
Genome Biol 2003, 4:331.
31. Wolfe KH, Shields DC: Molecular evidence for an ancient dupli-
cation of the entire yeast genome. Nature 1997, 387:708-713.
32. Ohno S: Evolution by Gene Duplication Berlin: Springer; 1970.
33. Man O, Pilpel Y: Differential translation efficiency of ortholo-
gous genes is involved in phenotypic divergence of yeast spe-
cies. Nat Genet 2007, 39:415-421.
34. Dujon B, Sherman D, Fischer G, Durrens P, Casaregola S, Lafontaine
I, De Montigny J, Marck C, Neuve'glise C, Talla E, Goffard N, Frangeul
L, Aigle M, Anthouard V, Babour A, Barbe V, Barnay S, Blanchin S,
Beckerich JM, Beyne E, Bleykasten C, Boisrame' A, Boyer J, Cattolico
L, Confanioleri F, De Daruvar A, Despons L, Fabre E, Fairhead C,
Ferry-Dumazet H:
Genome evolution in yeasts. Nature 2004,
430:35-44.
35. Scannell DR, Butler G, Wolfe KH: Yeast genome evolution-the
origin of the species. Yeast 2007, 24:929-942.
36. Bremer J, Greenberg DM: Methyl transferring enzyme system
of microsomes in the biosynthesis of lecithin (phosphatidyl-
choline). Biochim Biophys Acta 1961, 46:205-216.
37. Chin J, Bloch K: Phosphatidylcholine synthesis in yeast. J Lipid
Res 1988, 29:9-14.
38. Tong AH, Lesage G, Bader GD, Ding H, Xu H, Xin X, Young J, Berriz
GF, Brost RL, Chang M, Chen Y, Cheng X, Chua G, Friesen H, Gold-
berg DS, Haynes J, Humphries C, He G, Hussein S, Ke L, Krogan N,
Li Z, Levinson JN, Lu H, Me'nard P, Munyana C, Parsons AB, Ryan O,
Tonikian R, Roberts T, et al.: Global mapping of the yeast genetic
interaction network. Science 2004, 303:808-813.
39. van Noort V, Snel B, Huynen MA: The yeast coexpression net-
work has a small-world, scale-free architecture and can be
explained by a simple model. EMBO Rep 2004, 5:280-284.
40. Enzyme EC Numbers [ />get_htext?ECtable]
41. Segre D, Deluna A, Church GM, Kishony R: Modular epistasis in
yeast metabolism. Nat Genet 2005, 37:77-83.
42. Borenstein E, Shlomi T, Ruppin E, Sharan R: Gene loss rate: a prob-
abilistic measure for the conservation of eukaryotic genes.
Nucleic Acids Res 2007, 35:e7.
43. Wu J, Hu Z, DeLisi C: Gene annotation and network inference
by phylogenetic profiling. BMC Bioinformatics 2006, 7:80.
44. De Bie T, Cristianini N, Demuth JP, Hahn MW: CAFE: a computa-
tional tool for the study of gene family evolution. Bioinformatics
2006, 22:1269-1271.
45. Gene Ontology [ />46. Saccharomyces
Genome Database [stge
nome.org/]
47. BioGRID Database [ />48. Tischler J, Lehner B, Fraser AG: Evolutionary plasticity of genetic
interaction networks. Nat Genet 2008, 40:390-391.
49. Marinelli RJ, Montgomery K, Liu CL, Shah NH, Prapong W, Nitzberg
M, Zachariah ZK, Sherlock GJ, Natkunam Y, West RB, Rijn M van de,
Brown PO, Ball CA: The Stanford Microarray Database. Nucleic
Genome Biology 2009, Volume 10, Issue 5, Article R48 Tuller et al. R48.17
Genome Biology 2009, 10:R48
Acids Res 2001, 29:152-155.
50. The Open Biomedical Ontologies [ />51. KEGG LIGAND Database [ />52. Braun BR, van Het Hoog M, d'Enfert C, Martchenko M, Dungan J, Kuo
A, Inglis DO, Uhl MA, Hogues H, Berriman M, Lorenz M, Levitin A,
Oberholzer U, Bachewich C, Harcus D, Marcil A, Dignard D, Iouk T,
Zito R, Frangeul L, Tekaia F, Rutherford K, Wang E, Munro CA, Bates
S, Gow NA, Hoyer LL, Köhler G, Morschhäuser J, Newport G: A
human-curated annotation of the Candida albicans genome.
PLoS Genet 2005, 1:36-57.
53. Kellis M, Birren BW, Lander ES: Proof and evolutionary analysis
of ancient genome duplication in the yeast Saccharomyces
cerevisiae Nature. Nature 2004, 428:617-624.
54. Kurtzman CP, Robnett CJ: Phylogenetic relationships among
yeasts of the 'Saccharomyces complex' determined from
multigene sequence analyses. FEMS Yeast Res 2003, 3:417-432.
55. Alexeyenko A, Tamas I, Liu G, Sonnhammer EL: Automatic clus-
tering of orthologs and in paralogs shared by multiple pro-
teomes. Bioinformatics 2006, 22:e9-e15.
56. Bapeste E, Susko E, Leigh J, MacLeod D, Charlebois RL, Doolittle WF:
Do orthologous gene phylogenies really support tree-think-
ing? BMC Evol Biol 2005, 5:33.
57. Ahenna RC, Sugawara H, Koike T, Lopez R, Gibson TJ, Higgins DG,
Thompson JD: Multiple sequence alignment with the Clustal
series of programs. Nucleic Acids Res 2003, 31:3497-3500.
58. Pupko T, Pe'er I, Shamir R, Graur D: A fast algorithm for joint
reconstruction of ancestral amino acid sequences. Mol Biol
Evol 2000, 17:890-896.
59. Yang Z: PAML: a program package for phylogenetic analysis
by maximum likelihood. Comput Appl Biosci 1997, 13:
555.
60. Akashi H: Gene expression and molecular evolution. Curr Opin
Genet Dev 2001, 11:660-666.
61. dos Reis M, Savva R, Wernisch L: Solving the riddle of codon
usage preferences: a test for translational selection. Nucleic
Acids Res 2004, 32:5036-5044.
62. Sharp PM, Li WH: The codon adaptation index: a measure of
directional synonymous codon usage bias and its potential
applications. Nucleic Acids Res 1987, 15:1281-1295.
63. Gojobori T: Codon substitution in evolution and the "satura-
tion" of synonymous changes. Genetics 1983, 105:1011-1027.
64. Jaccard P: The distribution of flora in the alpine zone. New Phy-
tologist 1912, 11:37-50.
65. Kiryutin B, Koonin EV, Krylov DM, Mazumder R, Mekhedov SL,
Nikolskaya AN, Rao BS, Smirnov S, Sverdlov AV, Vasudevan S, Wolf
YI, Yin JJ, Natale DA: The COG database: an updated version
includes eukaryotes. BMC Bioinformatics 2003, 4:41.
66. Jones CE, Brown AL, Baumann U: Estimating the annotation
error rate of curated GO database sequence annotations.
BMC Bioinformatics 2007, 8:170.
67. Buza TJ, McCarthy FM, Wang N, Bridges SM, Burgess SC: Gene
Ontology annotation quality analysis in model eukaryotes.
Nucleic Acids Res 2008, 36:e12.