Báo cáo y học: "Insights into the regulation of intrinsically disordered proteins in the human proteome by analyzing sequence and gene expression data" potx
Bạn đang xem bản rút gọn của tài liệu. Xem và tải ngay bản đầy đủ của tài liệu tại đây (1.34 MB, 18 trang )
Genome Biology 2009, 10:R50
Open Access
2009Edwardset al.Volume 10, Issue 5, Article R50
Research
Insights into the regulation of intrinsically disordered proteins in the
human proteome by analyzing sequence and gene expression data
Yvonne JK Edwards
¤
, Anna E Lobley
¤
, Melissa M Pentony and
David T Jones
Address: Bioinformatics Group, Department of Computer Science, University College London, Gower Street, London, WC1E 6BT, UK.
¤ These authors contributed equally to this work.
Correspondence: David T Jones. Email:
© 2009 Edwards et al.; licensee BioMed Central Ltd.
This is an open access article distributed under the terms of the Creative Commons Attribution License ( which
permits unrestricted use, distribution, and reproduction in any medium, provided the original work is properly cited.
Intrinsically disordered proteins<p>Signals for microRNA targeting and ubiquitination are enriched in intrinsically disordered proteins, but some highly disordered pro-teins can escape rapid degradation.</p>
Abstract
Background: Disordered proteins need to be expressed to carry out specified functions;
however, their accumulation in the cell can potentially cause major problems through protein
misfolding and aggregation. Gene expression levels, mRNA decay rates, microRNA (miRNA)
targeting and ubiquitination have critical roles in the degradation and disposal of human proteins
and transcripts. Here, we describe a study examining these features to gain insights into the
regulation of disordered proteins.
Results: In comparison with ordered proteins, disordered proteins have a greater proportion of
predicted ubiquitination sites. The transcripts encoding disordered proteins also have higher
proportions of predicted miRNA target sites and higher mRNA decay rates, both of which are
indicative of the observed lower gene expression levels. The results suggest that the disordered
proteins and their transcripts are present in the cell at low levels and/or for a short time before
being targeted for disposal. Surprisingly, we find that for a significant proportion of highly
disordered proteins, all four of these trends are reversed. Predicted estimates for miRNA targets,
ubiquitination and mRNA decay rate are low in the highly disordered proteins that are
constitutively and/or highly expressed.
Conclusions: Mechanisms are in place to protect the cell from these potentially dangerous
proteins. The evidence suggests that the enrichment of signals for miRNA targeting and
ubiquitination may help prevent the accumulation of disordered proteins in the cell. Our data also
provide evidence for a mechanism by which a significant proportion of highly disordered proteins
(with high expression levels) can escape rapid degradation to allow them to successfully carry out
their function.
Published: 11 May 2009
Genome Biology 2009, 10:R50 (doi:10.1186/gb-2009-10-5-r50)
Received: 16 December 2008
Revised: 23 March 2009
Accepted: 11 May 2009
The electronic version of this article is the complete one and can be
found online at /> Genome Biology 2009, Volume 10, Issue 5, Article R50 Edwards et al. R50.2
Genome Biology 2009, 10:R50
Background
Natively unfolded or disordered proteins are proteins that do
not form a stable three-dimensional structure in their native
state. A disordered protein can be either completely unfolded
or comprise both folded and unfolded segments [1-4]. Previ-
ous analyses have shown that the presence of large regions of
disorder within proteins correlates strongly with function [1-
20]. These functions typically relate to gene regulation and
signaling classes that are of particular importance to higher
organisms [6,21]. Previous work has also shown that over
30% of proteins in eukaryotic genomes are likely to be disor-
dered, a percentage that is much higher than found within
prokaryotic genomes [6,12,22,23]. Whilst there are func-
tional benefits that accrue from disordered proteins, the use
of disorder carries with it significant risks [24]. The preva-
lence of human diseases that correspond to highly disordered
proteins is striking [24-31]; these include diabetes, neurode-
generative disorders [25-28], cardiovascular disease [29] and
cancer [30]. In fact, many neurodegenerative disorders arise
from the aggregation of disordered proteins [25-28]. If disor-
dered proteins are indeed potential hazards to the healthy
maintenance of human cells, then both their production and
disposal should be very carefully regulated. Such is the danger
of protein aggregation in living cells that a number of efficient
degradation mechanisms are in place to quickly dispose of
misfolded proteins [32]. The problem for disordered proteins
may well be to survive long enough to carry out their function
in such a hostile environment.
The equilibrium level of a protein depends on its rate of pro-
duction relative to its rate of degradation. The quantity of a
protein produced in the cell is affected by the expression level
of its mRNA transcript. The levels of gene expression are con-
trolled in the cell in a number of different ways - for example,
by varying the rates of transcription and translation and alter-
ing the rate at which mRNA is degraded. In combination with
transcription, mRNA degradation plays a critical role in reg-
ulating gene expression [33,34]. If proteins need to remain in
the disordered state for any length of time, they need to either
bypass the endogenous degradation pathways (such as the
ATP-dependent proteolytic 26S proteasome [32]) that specif-
ically target unfolded proteins or be produced in sufficient
quantity to temporarily overload the protein degradation
pathways. The second option is, of course, extremely risky as
high production levels of disordered proteins may result in
aggregation. This suggests that the first option is the most
likely, but in this case, how can disordered proteins escape
rapid degradation to allow them to successfully carry out their
function.
Recent work suggested that disordered residues make a pro-
tein more susceptible to intracellular degradation [35]. The in
vivo half-lives of yeast proteins were shown to correlate with
disorder as opposed to the actual degradation signals and
motifs. In our study we analyze biological properties known
to regulate and affect the degradation rates of proteins and
transcripts to investigate how these correlate with protein
disorder. Gene expression is a continuous process spanning
transcription factor activation, nuclear localization of tran-
scription factors, chromatin decompaction, coupled initiation
and 5' capping of transcripts, coupled transcription and
mRNA processing, splicing, cleavage and 3' polyadenylation,
mRNA packaging, mRNA export into the cytoplasm, transla-
tion and protein folding [36]. Biological processes that lower
the mRNA copy numbers include proteolytic degradation by
proteases, microRNA (miRNA):mRNA targeting and destruc-
tion of mRNA by nucleases. Here, we characterize absolute
mRNA levels, mRNA decay rates, protein stability, predicted
miRNA targeting and ubiquitination to assess whether disor-
dered proteins (and their encoding transcripts) display any
unusual characteristics.
miRNAs are a class of small non-coding RNA molecules
(comprising about 22 nucleotides) that regulate gene expres-
sion and mediate diverse cellular processes such as develop-
ment, differentiation, proliferation and apoptosis [37-41].
miRNAs target the 3' untranslated regions of mRNA mole-
cules, which typically results in the down-regulation of gene
expression by translational repression and/or a reduction of
mRNA transcript levels [42]. Several algorithms are available
to predict the mRNA targets [43-51].
Ubiquitination is a reversible post-translational modification
of cellular proteins where ubiquitin (a 76 residue protein) is
covalently attached to the amino group of lysines of target
proteins. Diverse forms of ubiquitin modifications exist and
influence the functional outcome of target proteins in distinct
ways [52,53]. Mono-ubiquitination or multi-ubiquitination
are implicated in various nonproteolytic cellular functions,
including endocytosis, endosomal sorting and DNA repair
[52]. Polyubiquitination is mainly associated with proteaso-
mal degradation [54,55]. Whilst ubiquitination can deter-
mine the fate of a given protein for proteolytic degradation by
the 26S proteosome, ubiquitination of transcription factors
with a VP-16 activation domain is also shown to be required
for transcriptional activation [56-58]. Like miRNA targeting
[59-69], ubiquitination is crucial in regulating a variety of cel-
lular processes in eukaryotes [59-61] and has significant
implications in the etiology of a number of serious diseases
such as cancer [62-64], neurodegeneration [65,66] and cardi-
ovascular dysfunction [67-69].
To gain new insights into the regulation of disordered pro-
teins, we carried out a series of studies to examine how a
number of features known to affect protein and transcript
degradation correlate with protein disorder. We investigated
whether the mRNA transcripts encoding disordered proteins
decay more rapidly. To establish mRNA expression patterns
for transcripts encoding disordered proteins and to reveal
novel insights into the molecular mechanisms of transcrip-
tional regulation [70-74], mRNA expression levels were char-
acterized in normal tissues and cell lines using public domain
Genome Biology 2009, Volume 10, Issue 5, Article R50 Edwards et al. R50.3
Genome Biology 2009, 10:R50
microarray expression datasets. Transcripts co-expressed
with the transcripts encoding disordered proteins were iden-
tified to suggest the key biological pathways that are affected
or under regulatory control of disordered proteins and their
transcripts. We investigated whether disordered proteins
have lower expression levels and/or the transcripts encoding
them are more likely to be targeted by miRNA. One of the
aims of this analysis was to use miRNA prediction to establish
the trends that exist between possible miRNA targeting and
the transcripts encoding disordered proteins. We examined if
disordered proteins contain sites that are more susceptible to
degradation using a novel ubiquitination site prediction tool.
Protein turnover rates for disordered sequences were also
investigated by considering stability determined from an in
vivo study measuring protein turnover [75].
In this study, we examine the available human gene expres-
sion data and properties of the human proteome and tran-
scriptome to investigate whether disordered proteins have
any unusual characteristics in terms of their production and
disposal in human cells. Specifically, we were interested in
gaining insights into the means by which disordered proteins
avoid early degradation without resorting to the severe risks
of over-expression.
Results
Five properties of the human proteins and transcripts were
investigated in relation to disorder in the proteome. First,
three expression profile studies on transcripts encoding dis-
ordered proteins were carried out: the general features of
their expression levels were characterized; their expression
profiles across the samples were clustered by abundance and
functionally annotated to provide a classification of the bio-
logical roles of their encoded proteins; and transcripts co-
expressed with them were identified. Second, we searched for
correlation between the extent of mRNA decay rates and var-
ying amounts of protein disorder encoded by transcripts.
Third, the occurrence of disorder was compared with protein
stability indices determined by a global stability profiling
assay. Fourth, miRNA prediction tools were used to establish
trends that exist between transcripts encoding disordered
proteins and miRNA targeting. Finally, correlations between
ubiquitination sites and protein disorder levels were
investigated.
Protein disorder and gene expression
Protein disorder and absolute gene expression levels
On average, transcripts that encode highly disordered pro-
teins are expressed in lower copy numbers than those that
encode highly ordered proteins (Figure 1a). Figure 1a shows
the average absolute gene expression values calculated across
207 normal tissue and cell line samples (Table 1). Whilst the
scale for the absolute values is displayed in log
2
units, in the
decimal scale the absolute gene expression levels of the genes
for transcripts that encode highly disordered proteins are
roughly half those of the genes for transcripts that encode
highly ordered proteins. A similar trend was obtained for
transcripts that encode disordered and ordered proteins (Fig-
ure S1a in Additional data file 1).
To investigate whether these low expression levels were cor-
related with occurrence of disorder in the protein products,
transcripts were grouped according to the frequency of disor-
der in the encoded protein (Figure 2a). As the percentage of
disordered residues increases to between > 60% and 80%
(or from now on (60,80]% in standard interval notation), the
average gene expression level steadily decreases. However,
for the (80,100]% disorder category the average sample
expression levels were greater than expected using a Wil-
coxon paired rank test (P < 0.0001). This (80,100]% category
comprises <1% of the data (Table 2). To verify that these
trends were independent of function, we filtered the data to
impose equality of representation of biological process (BP)
and molecular function (MF) Gene Ontology (GO) terms.
Specifically, a maximum of ten randomly chosen examples
were selected for each annotation term at specificity level 4 or
Table 1
Bioinformatics analysis of expression of human genes across 207 samples from 75 different types of normal tissues and cell lines
Dataset Description Samples Cel file sample replicates References
[GEO:GSE1133] Normal tissues and cell lines 144 72 × 2 [71]
[GEO:GSE2361] Normal human tissues 36 36 × 1 [72]
[GEO:GSE2004] Normal spleen 22 3 × 3 (spleen) -
liver and kidney 2 × 3 (liver)
1 × 3 (liver)
1 × 4 (kidney)
[GEO:GSE781] Normal kidney samples 5 1 × 5 [70]
Total 207 75
Genome Biology 2009, Volume 10, Issue 5, Article R50 Edwards et al. R50.4
Genome Biology 2009, 10:R50
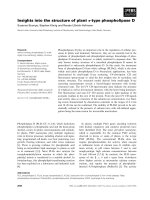
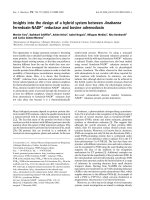
Properties of highly ordered and highly disordered proteinsFigure 1
Properties of highly ordered and highly disordered proteins. (a) Box-plot distributions of the average expression levels for the transcripts encoding the
highly ordered and the highly disordered proteins. (b) Box-plot of mRNA decay rates for the highly ordered and highly disordered proteins. (c) Box-plot
of protein stability values. (d) The percentage of transcripts likely to be regulated by miRNA (y-axis) for the transcripts encoding the highly ordered and
the highly disordered proteins. (e) The percentage of the proteins with one or more predicted ubiquitination sites (principal y-axis, burgundy bar chart) in
the highly ordered and the highly disordered datasets; and the percentage of residues predicted as ubiquitination sites (secondary y-axis, navy line plot)
versus different amounts of disorder.
Genome Biology 2009, Volume 10, Issue 5, Article R50 Edwards et al. R50.5
Genome Biology 2009, 10:R50
below. The results (Figure 2a) indicate that the correlation
between transcript expression levels and the amount of disor-
der are not dictated by function class bias and represent gen-
uine and robust features of the data.
Absolute gene expression profiles for highly disordered proteins
To differentiate modes of gene expression behavior among
the highly disordered proteins, hierarchical clustering analy-
sis of the absolute expression levels was carried out. The
resulting heat map (Figure 3a) shows that the situation is not
as simple as suggested in Figure 1. Five broad classes of
expression patterns for the genes encoding highly disordered
proteins could be defined (Figure 3; Tables S1 and S2 in Addi-
tional data file 2). These groups were functionally character-
ized by performing over-representation tests within each of
the five classes. The first set of transcripts (light blue) encode
proteins that are almost entirely disordered and contained
within the (80,100]% disorder category. In this constitutively
expressed group, all transcripts represent large ribosomal
subunits that are essential parts of the transcription machin-
ery and expressed in every cell. The second group (dark blue)
represents transcripts that exhibit high expression levels in
the majority of tissues and display little or no tissue specifi-
city. The third group (green) contains transcripts expressed at
medium levels. General DNA binding and transcription factor
functions were over-represented in the proteins encoded by
the medium expressor group. The fourth group (gold) con-
tains transcripts expressed in a tissue-specific manner. The
remaining transcripts form a group not detected to be abun-
dant in any of the tissues studied and is referred to as the low
or transient expressor group (gray). This low or transient
expressor group comprises over 50% of transcripts analyzed
(Table 3) and is primarily responsible for the low expression
trend reported above. This suggests that over half of the
transcripts encoding proteins with large regions of disorder
are expressed either at transient or low levels.
Co-regulated transcripts and the highly disordered proteins
A similar functional analysis was carried out for all tran-
scripts detected to be significantly co-regulated with tran-
scripts encoding disordered proteins. Co-regulation was
established using significance of the correlation coefficient
between transcripts and was calculated for transcript pairs in
the (60,80]% and (80,100]% disorder groups. Using empiri-
cally derived P-values from the distribution of correlations, a
significance threshold at either tail of P < 0.01 was used to
describe transcripts as co-regulated. Several of the categories
identified as enriched in the co-regulated transcript datasets
overlapped and are summarized. In general, the activities of
the ubiquitin degradation pathway and the proteolytic cata-
bolic processes were observed to be anti-correlated (down-
regulated) with the expression profiles of transcripts encod-
ing highly disordered proteins. Functions enriched in the sig-
nificantly correlated transcript set included protein complex
formation, protein dimerization, protein homo-dimerization,
protein hetero-oligomerization and enzyme inhibitors that
reduce the activity of proteases (that is, enzymes catalyzing
the hydrolysis of peptide bonds) (Table 4).
Protein disorder, mRNA decay rates and protein
stability indices
The mRNA decay rates of the transcripts of 74 highly disor-
dered proteins and 536 highly ordered proteins were com-
pared. The mRNA decay rates for the transcripts encoding
highly disordered proteins (0.190871 h
-1
) are more than twice
Table 2
Percentage of transcripts encoding disordered proteins predicted
to be targeted by miRNA
Total* Unique
†
Match
‡
Percentage
§
Category of disorder
Highly disordered 877 827 257 31.08
Highly ordered 5,693 5,351 782 14.61
Disordered 15,095 14,282 5,056 35.40
Ordered 18,774 17,766 3,433 19.32
All proteins 33,869 32,010 8,468 26.45
Percentage of disorder
Disordered
[0,20] 4,271 4,055 1,402 34.57
(20,40] 6,957 6,603 2,300 34.83
(40,60] 3,036 2,866 1,119 39.04
(60,80] 679 644 233 36.18
(80,100] 152 143 20 13.99
Total 15,095 14,311 5,074 35.45
Ordered
[0,20] 16,341 15,503 3,037 19.59
(20,40] 2,173 2,024 362 17.89
(40,60] 214 207 35 16.91
(60,80] 33 31 4 12.9
(80,100] 13 9 0 0
Total 18,774 17,774 3,438 19.34
Proteome
[0,20] 20,612 19,536 4,429 22.67
(20,40] 9,130 8,618 2,658 30.84
(40,60] 3,250 3,073 1,154 37.55
(60,80] 712 675 237 35.11
(80,100] 165 152 20 13.16
Total 33,869 32,010 8,468 26.45
For each data set, the *total number of transcripts encoding proteins
and the
†
number of unique protein sequences encoded by transcripts
are given.
‡
A match occurs when a transcript of a protein sequence
matches an mRNA targeted by a miRNA.
§
The percentage calculations
are described in the Materials and methods. Values according to the
category of disorder (Figures 1c, 2c) and the percentages of disordered
residues (Figure 3c) are given.
Genome Biology 2009, Volume 10, Issue 5, Article R50 Edwards et al. R50.6
Genome Biology 2009, 10:R50
Figure 2 (see legend on next page)
(d) miRNA targetting
1
0
(e) Ubiquitin targetting
(c) Protein stability index
(b) mRNA decay rates
(a) Gene expression intensities
[0,20] (20,40] (40,60] (60,80] (80,100]
0.80
0.60
0.40
0.20
0.00
0
10
20
30
40
50
[0,20]
(20,40]
(40,60]
(60,80]
(80,100]
[0,20] (20,40] (40,60] (60,80] (80,100]
[0,20] (20,40] (40,60] (60,80] (80,100]
0
10
20
30
40
50
60
70
80
90
0
0.2
0.4
0.6
0.8
1
1.2
1.4
2
3
4
5
6
7
8
[0,20]
(20,40]
(40,60]
(60,80]
(80,100]
2
3
4
5
6
log 2 intensity
Decay rate hr -1
Protein Stability Index
Proportion of sequences
Proportion of sequences
Proportion of residues
Genome Biology 2009, Volume 10, Issue 5, Article R50 Edwards et al. R50.7
Genome Biology 2009, 10:R50
that observed for the transcripts encoding highly ordered
proteins (0.084944 h
-1
) (Figure 1b). A statistically significant
difference (P < 0.02) between mRNA decay rates for tran-
scripts encoding highly ordered and highly disordered pro-
teins was found, with the highly disordered datasets having
higher mRNA decay rates. The mRNA decay rates for the
transcripts encoding 1,980 disordered proteins (0.177596 h
-1
)
and 1,858 ordered proteins (0.096878 h
-1
) were also com-
pared and a similar trend was obtained (Figure S1b in Addi-
tional data file 1).
We divided the 33,869 proteins into bins by percentage of dis-
ordered residues. When we compared the mRNA decay rates
for each of the bins (Figure 2b), there was no significant dif-
ference between them. Although this result does not suggest
that all disordered proteins show a significant association
with higher mRNA decay rates, it does concur with our previ-
ous analysis of the (highly) ordered and (highly) disordered
protein datasets, in showing a distinct difference between
mRNA decay rates for both groups.
The protein stability measures of the highly disordered (179)
and highly ordered groups (1,396) were also compared. We
found a significant difference (P < 0.0005) between the half-
lives of highly ordered and highly disordered proteins, with
highly disordered proteins having longer half-lives (Figure
1c).
Consistent with our analysis of decay rates, we divided the
8,666 disordered proteins into bins by percentage of disor-
dered residues. Protein stability indices showed no significant
affiliation to a particular binned group, although the
(80,100]% disorder bin showed much higher half-lives than
the other binned groups (Figure 2c).
Since trends were observed between both mRNA decay rate
and disorder, and protein half-life and disorder, the half-lives
and decay rates were also compared to see if a relationship
existed between mRNA decay rate and protein half-life. The
Pearson correlation value between 1,446 overlapping
sequences (-0.06) was not significant and suggested that
these two characteristics are independent.
Protein disorder and miRNA targets
Approximately one-quarter of protein coding transcripts are
predicted miRNA targets (Table 2). The proportion of tran-
scripts encoding highly disordered proteins that are likely to
be miRNA targets is approximately twice that of transcripts
encoding highly ordered proteins (Figure 1d; Table 2). The
frequency of transcripts with at least one predicted miRNA
target site is over-represented in the transcripts encoding
highly disordered proteins (P < 0.003) and under-repre-
sented in the transcripts encoding highly ordered proteins (P
< 0.00001) compared to all transcripts together (Figure S2a
in Additional data file 1). A similar trend is observed when
comparing the datasets of transcripts encoding ordered and
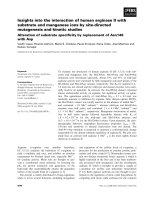
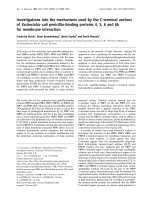
Correlation of features with percentage of disorder in the proteomeFigure 2 (see previous page)
Correlation of features with percentage of disorder in the proteome. (a) Variation in absolute transcript expression as the percentage of disorder
increases in the proteome (yellow bars). The bar charts represent the average sample expression for the groups of transcripts separated according to the
percentage range (x-axis) of the total disordered residues in the encoded proteins. The y-axis scale represents log2 absolute expression. Expression levels
for the transcripts with MF and BP GO terms at level 4 are shown as light green and dark green bars, respectively. (b) Variation of mRNA decay rate as
disorder increases in the proteome. mRNA decay rates versus the percentage bins of disordered residues are shown. (c) Variation of protein stability as
disorder increases in the proteome. The stability index versus the percentage bins of disordered residues are shown. (d) The proportion of protein
coding transcripts targeted by miRNA (y-axis) as the percentage of disorder increases in the proteome. The datasets for the transcripts encoding the
disordered proteins (burgundy) and ordered proteins (mauve) and the proteome (yellow) are shown. (e) The percentage of the proteins with one or
more predicted ubiquitination sites against the percentage of disorder (principal y-axis, bar charts); and the percentage of residues predicted as
ubiquitination sites against the percentage of disorder (secondary y-axis, line plots). The transcripts encoding the disordered proteins, the ordered
proteins and the proteome are shown in burgundy, mauve and yellow (respectively).
Table 3
miRNA targeting of disordered proteins with different gene expression profiles (Figure 4)
Expressor type Total transcripts
(frequency value)
Percentage of transcripts
with different expression
profiles
Transcripts with
miRNA (frequency
value)
Transcripts with no
miRNA (frequency
value)
Transcripts with
miRNA (%)
Tissue specific 50 (47) 19.31 32 15 68.09
High 43 (41) 16.60 27 14 65.85
Medium 31 (31) 11.97 15 16 48.39
Constitutive 4 (1) 1.54 0 1 0
Transient or low 131 (129) 50.58 62 67 48.06
Total 259
Genome Biology 2009, Volume 10, Issue 5, Article R50 Edwards et al. R50.8
Genome Biology 2009, 10:R50
disordered proteins (Table 2); the proportion of the tran-
scripts encoding disordered proteins that are predicted as
miRNA targets is approximately twice that of the transcripts
encoding ordered proteins (Figure S1c in Additional data file
1; Table 2). miRNA targets are over-represented in the tran-
scripts encoding disordered proteins (P < 0.00001) and
under-represented in the transcripts encoding ordered pro-
teins (P < 0.00001) compared to all transcripts together (Fig-
ure S2b in Additional data file 1).
For the transcripts encoding the proteome, the percent likely
to be targeted by miRNA ranges between 13.2% and 37.6%
(Figure 2d; Table 2). The percentage of transcripts regulated
by miRNA increases (approximately 8%) with increasing per-
centage of protein disorder for the first three binned catego-
ries (Figure 2c; Table 2). The percent of predicted miRNA
targets for transcripts remains high (35.1%) for the (60,80]%
disorder category and low (13.2%) for the [80,100]% disorder
category. Consistently, the likely miRNA targets are under-
represented in the [0,20]% and (80,100]% disorder catego-
ries at P < 0.00004 (Figure S2c in Additional data file 1) and
over-represented in the remaining three classes (P < 5.8 × 10
-
7
; Figure S2c in Additional data file 1).
Similar trends are obtained using the PicTar (4-Way and 5-
Way) software [43,46] (Figures 1d and 2d; Figure S1c in Addi-
tional data file 1). The trends were not observed using mir-
Base [51] and this could be because this prediction algorithm
is reported to have a higher false positive rate than the other
two programs (PicTar and TargetScanS) [47,49,50]. Redun-
dancy in the datasets makes very little difference to the out-
come (Table S3 in Additional data file 2). For example, the
proteome and the protein sets filtered for redundancy have
very similar percentages of transcripts predicted as targets of
miRNA (Table 2; Table S3 in Additional data file 2).
We investigated the patterns of the predicted miRNA targets
in the transcripts for disordered proteins in relation to the dif-
ferent expression profiles (Figures 3 and 4 and Table 3). The
probes on the microarray chip have a higher representation of
predicted miRNA targets (38%) in comparison with the tran-
scriptome encoding the human proteome (26.45%) (Table 2).
We compared the protein coding transcripts for the five data-
sets (Figure 3) using the probes on the microarray chip as a
universal protein baseline. The data from the constitutive
group had too few data points from which to make inferences
(Table 3 and Figures 3 and 4). The tissue-specific expressors
(gold) and the high expressors (dark blue) have high expres-
sion levels. The main difference between the two classes is
that the tissue-specific expressors (gold) have high expres-
sion in one or few tissues (Figure 3) and the high expressors
(dark blue) have high expression in almost all tissues (Figure
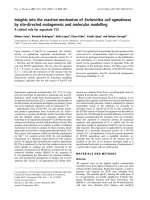
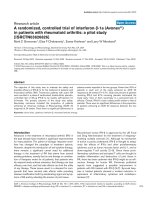
A summary of expression profiles for the highly disordered proteinsFigure 3
A summary of expression profiles for the highly disordered proteins. (a) The heat map displays four distinct transcript groups; constitutively expressed
ribosomal subunits (light blue), high expressors (dark blue), medium expressors (green) and tissue specific expressors (gold). The clustering method was
Ward's hierarchical clustering using Euclidean distances calculated over the absolute expression data matrix. Red colors indicate significantly high
expression values (P < 0.001) within a sample tissue or cell line. (b). Summary of expression-function trends for highly disordered transcripts. Log
10
of the
number of tissues in which the transcript is expressed (x-axis); log
10
expression of the average magnitude of expression within each tissue (y-axis). The
points have been jittered for overlap using a normally distributed noise value of 0.05 on the log
10
scale.
Genome Biology 2009, Volume 10, Issue 5, Article R50 Edwards et al. R50.9
Genome Biology 2009, 10:R50
Table 4
Subsets of GO terms (biological process, molecular function and cellular component) over-represented for co-regulated transcripts
encoding highly disordered proteins
Term Description Disorder (60,80]% Disorder (80,100]%
[GO:0005769] Early endosome Down Down
[GO:0005770] Late endosome Down Down
[GO:0005838] Proteasome regulatory particle Down Down
[GO:0016272] Prefoldin complex Down
[GO:0031371] Ubiquitin conjugating enzyme complex Down
[GO:0000145] Exocyst Down
[GO:0000502] Proteasome complex Down
[GO:0032991] Macromolecular complex Up
[GO:0043234] Protein complex Up
[GO:0019872] Small conjugating protein ligase activity Up
[GO:0042803] Protein homodimerization activity Up
[GO:0051131] Chaperone-mediated protein complex assembly Up
[GO:0008639] Small protein conjugating enzyme activity Up
[GO:0004842] Ubiquitin-protein ligase activity Up
[GO:0016874] Ligase activity Up
[GO:0006512] Ubiquitin cycle Up
[GO:0004869] Cysteine protease inhibitor activity Up Up
[GO:0004866] Endopeptidase inhibitor activity Up Up
[GO:0030414] Protease inhibitor activity Up Up
[GO:0051082] Unfolded protein binding Up Up
[GO:0046983] Protein dimerization activity Up Up
[GO:0051291] Protein hetero-oligomerization Up
[GO:0007032] Endosome organization and biogenesis Up
[GO:0006983] ER overload response Up
[GO:0051087] Chaperone binding Up
[GO:0031579] Lipid raft organization and biogenesis Up
[GO:0016235] Aggresome Up
[GO:0016234] Inclusion body Up
[GO:0016926] Protein desumoylation Up
[GO:0008581] Ubiquitin specific protease 5 activity Up
[GO:0006622] Protein targeting to lysosome Up
[GO:0019783] Small conjugating protein-specific protease activity Down
[GO:0008219] Cell death Down
[GO:0007049] Cell death Down
[GO:0051603] Proteolysis involved in cellular protein catabolic process Down Down
[GO:0004221] Ubiquitin thiolesterase activity Down Down
[GO:0016197] Endosome transport Down Down
[GO:0016874] Ligase activity Down Down
[GO:0004843] Ubiquitin-specific protease activity Down Down
[GO:0051082] Unfolded protein binding Down Down
[GO:0000209] Protein polyubiquitination Down Down
[GO:0006511] Ubiquitin-dependent protein catabolic process Down
[GO:0006512] Ubiquitin cycle Down
[GO:0051087] Chaperone binding Down
[GO:0030968] Unfolded protein response Down
[GO:0030100] Regulation of endocytosis Down
[GO:0043488] Regulation of mRNA stability Down
[GO:0031396] Regulation of protein ubiquitination Down
Up, up-regulation; down, down-regulation.
Genome Biology 2009, Volume 10, Issue 5, Article R50 Edwards et al. R50.10
Genome Biology 2009, 10:R50
3). These two groups characterized by high levels of gene
expression have high percentages of transcripts predicted as
miRNA targets (68.09% and 65.85%, respectively; Table 3
and Figure 4). The medium expressors (green) and the low or
transient expressors (white) with more moderate levels of
gene expression have lower percentages of predicted miRNA
targeting (48.39% and 48.06%, respectively). These results
suggest that the transcripts of disordered proteins with high
levels of expression are more likely to be regulated by miRNA
compared to those with moderate and low or transient
expression. In addition, the transcripts of highly disordered
proteins belonging to the four expression profiles (tissue-spe-
cific, high expressors, medium expressors and low or tran-
sient expressors) are more likely to be miRNA targets than
the transcripts on the microarray chip (Figure 4b). This
observation supports the trend observed previously (Table 2)
that transcripts encoding disordered proteins are more likely
to be targeted by miRNAs compared to protein coding tran-
scripts in general (Figure 4; Figures S1c and S2c in Additional
data file 1).
Protein disorder and ubiquitination
To our knowledge, this study presents the first estimate of the
percentage of proteins of the human proteome with at least
one predicted ubiquitination site and the percentage of resi-
dues predicted as ubiquitination sites. We predict that 70.71%
of proteins have at least one ubiquitination site and 0.42% of
amino acid residues in the proteome are ubiquitination sites.
The percentage of proteins predicted to contain at least one
ubiquitination site and the percentage of residues predicted
as ubiquitination sites are higher in disordered proteins com-
pared to ordered proteins. Comparing the highly disordered
proteins with the highly ordered proteins, we observe
increases of 33.81% and 42.50% in the percentage of proteins
possessing at least one ubiquitination site and the percentage
of residues predicted to be ubiquitination sites, respectively
(Figure 1e). The proteins possessing at least one ubiquitina-
tion site are slightly over-represented in the highly disordered
proteins (P < 0.98; Figure S3a in Additional data file 1) and
grossly under-represented in the highly ordered proteins (P <
2.2 × 10
-16
; Figure S3a in Additional data file 1). The first
trend is not statistically significant. The predicted ubiquitina-
tion sites are over-represented in the highly disordered pro-
teins (P < 2.2 × 10
-16
; Figure S4a in Additional data file 1) and
under-represented for the highly ordered proteins (P <
0.002; Figure S4a in Additional data file 1). Comparing the
disordered proteins with the ordered proteins, we observe
increases of 33.57% and 12.8% in the percentage of proteins
possessing at least one ubiquitination site and the percentage
of residues predicted to be ubiquitination sites, respectively
(Figure S1d in Additional data file 1). Proteins with one or
more predicted ubiquitination sites are over-represented in
the disordered datasets (P < 2.2 × 10
-16
; Figure S3b in Addi-
tional data file 1) and under-represented in the ordered pro-
teins (P < 2.2 × 10
-16
; Figure S3b in Additional data file 1). A
similar trend is obtained for the percentage of residues pre-
dicted as ubiquitination sites.
The relationship between the percentage of proteins with at
least one ubiquitination site and the percentage of protein
disorder is complex and non-linear, while the percentage of
residues predicted as ubiquitination sites and the percentage
of protein disorder are positively correlated. The percentage
of proteins predicted to have a ubiquitination site increases
with the percentage of protein disorder for the first three dis-
order categories (Figure 2e). The percentage of proteins pre-
dicted to have a ubiquitination site remains high at 74.3% for
the (60,80]% disorder class and then drops significantly to
55.8% for the (80,100]% disorder category. This is consistent
with proteins with one or more predicted ubiquitination sites
being over-represented in the (20,40]%, (40,60]% and
(60,80]% disorder categories (P < 0.04; Figure S3c in Addi-
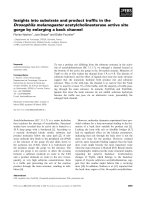
Summary of transcripts encoding highly disordered proteins as putative miRNA targets associated with expression profilesFigure 4
Summary of transcripts encoding highly disordered proteins as putative
miRNA targets associated with expression profiles. (a) The percentage of
the transcripts as predicted targets of miRNA (y-axis) versus the different
datasets (x-axis) that comprise transcripts with different patterns of gene
expression (Table 3). The error bars represent the confidence in the
percent value according to different sample sizes for the different groups.
(b) The log
10
odds-ratio (y-axis) discriminates categories as under- and
over-represented in relation to being a predicted miRNA target.
Genome Biology 2009, Volume 10, Issue 5, Article R50 Edwards et al. R50.11
Genome Biology 2009, 10:R50
tional data file 1) and under-represented in the [0,20]% and
(80,100]% disorder categories (P < 0.00005; Figure S3c in
Additional data file 1). On examination of the second ubiqui-
tination descriptor, a different trend is observed; the percent-
age of residues predicted as ubiquitination sites increases as
the percentage of protein disorder increases, illustrating a
strong positive correlation between the two variables (Figure
2e). Proteins with one or more predicted ubiquitination sites
are under-represented in the [0,20]% disorder category and
over-represented in the remaining four disorder classes (P <
2.2 × 10
-16
; Figure S4c in Additional data file 1).
As lysine is over-represented in disordered regions [1,76,77],
we investigated the percentage of residues predicted as ubiq-
uitination sites in relation to the percentageof protein disor-
der, taking into account lysine residue biases (Figure S5a in
Additional data file 1). First, we calculated a correlation coef-
ficient for the percentage of predicted ubiquitination sites and
the percentage of lysine composition for the five disorder cat-
egories and obtained a strong positive correlation (R =
0.844772). Second, we normalized the number of predicted
ubiquitination sites with respect to the number of lysines for
each dataset. The trends observed for the percentage of pre-
dicted ubiquitination sites normalized for lysine frequency
and disorder are similar to those obtained with the percent-
age of predicted ubiquitin sites and disorder ignoring lysine
biases (Figure S5b in Additional data file 1). Comparing the
disorder categories with the order categories, the calculations
normalized using the lysine frequency result in differences
that are smaller in magnitude. For example, comparing the
highly disordered proteins with the highly ordered proteins,
an increase of 23.5% is observed instead of 42.5%, and com-
paring the disordered proteins with the ordered proteins, an
increase of 4.4% is observed instead of 12.8%.
Discussion
This is the first analysis presenting a comprehensive and sys-
tematic study of gene expression levels, mRNA decay rates,
miRNA targeting and ubiquitination in association with tran-
scripts encoding protein disorder in humans. Using the
human proteome and transcriptome, we set out to elucidate
novel insights into the regulation of disordered proteins. This
aim was achieved and we discuss our findings in the following
sections.
Protein disorder and gene expression
On consideration of the gene expression levels for transcripts
encoding disorder in proteins, two main trends emerge.
Firstly, on average, the transcripts encoding disordered pro-
teins are expressed to a significantly lower extent than those
encoding ordered proteins. This suggests that, typically, the
cell has evolved regulatory mechanisms to ensure that it does
not have a large proportion of highly expressed transcripts
encoding high amounts of protein disorder. Secondly, for the
highly disordered proteins, there are five broad classes of
gene expression patterns observed. These are constitutive
expressors, high expressors, medium expressors, tissue-spe-
cific expressors and low or transient expressors. The constitu-
tive expressors represent the transcripts that are
constitutively and highly expressed across all samples. The
high expressors contain protease inhibitors (specifically
cysteine proteases) and enzyme regulatory functions. These
proteins function in order to prevent their enzyme counter-
parts from cleaving peptide bonds; it is thus expected that
their expression levels should remain relatively high in
unstimulated tissue samples. This group is also enriched in
functions directly related to splicing machinery, DNA packag-
ing, nucleosome assembly and the components involved in
DNA-protein and protein-protein complex assembly. In the
medium expressor group, the transcription factors are pre-
dominantly positive regulators of transcription and are
involved in muscle, cellular differentiation and general tissue
development processes. The tissue-specific expressors are
enriched in the transcription factors that target the nuclear
hormone receptors and the ligands that are coordinately reg-
ulated with their receptor binding partners. The tissue-spe-
cific expressors are predominantly negative regulators of cell
organization and promote complex disassembly and DNA
unwinding and replication.
These novel observations have high biological relevance. Dis-
ordered proteins have important roles in the cell [1-31]; natu-
rally they have to be expressed to carry out their specified
function, but high levels of highly disordered proteins in the
cell can cause a major problem through protein misfolding,
misidentification and mis-signaling [24]. Our analysis sug-
gests that one of the ways in which the cell keeps the level of
highly disordered proteins under control is to keep the
expression levels of transcripts encoding them low.
A recent study by Paliy and colleagues [78] claims that pro-
tein disorder is weakly positively correlated with gene expres-
sion in Eschericha coli. In our study, however, the trends
between protein disorder and gene expression are complex
and non-linear. Differences exist between the trends
observed in E. coli [78] and those we report for human data.
These differences are attributed to the differences in the
methodologies (such as the disorder prediction methods and
the definition of gene expression levels) and the considera-
tion of species from disparate taxonomical classes. It is widely
accepted that E. coli (a prokaryote) has about 5% of proteins
that contain disordered regions whilst human (a eukaryote)
has approximately 30% [6]. Paliy et al. [78] examined the
highly expressed transcripts for proteins possessing high lev-
els of predicted disorder in a prokaryote (E. coli). The types of
genes that fall into this category encode RNA and protein
chaperones, protein carriers, transcriptional and transla-
tional regulators and multi-enzyme complexes. Some of the
genes are found only in prokaryotes - these include the pepti-
doglycan-associated lipoprotein and the glycine cleavage
Complex H protein [78] - whilst other genes exist in all taxo-
Genome Biology 2009, Volume 10, Issue 5, Article R50 Edwards et al. R50.12
Genome Biology 2009, 10:R50
nomical classes and some of these are identified in our study
(for example, the ribosomal proteins and the translational
initiation factor). The products of these transcripts whilst
highly disordered are required by all cell types and by all spe-
cies (prokaryote or eukaryote) and the transcripts are consti-
tutively expressed at high levels. In contrast to the E. coli
study [78], we find distinct transcripts encoding highly disor-
dered proteins that are low or transiently expressed. These
proteins are predominantly transcription factors or activators
of transcription involved in developmental processes specific
to complex higher organisms (Figure 3).
Protein disorder, mRNA decay rates and protein
stability indices
We examined trends between mRNA decay rates and
amounts of disordered residues, and between protein half-
lives and frequency of disordered residues. The mRNA decay
rates for the transcripts encoding highly disordered proteins
are more than twice that observed for the transcripts encod-
ing highly ordered proteins. Large quantities of proteins con-
taining high levels of disordered residues can cause function
problems for the cell [24] and a higher mRNA decay rate
could indicate the necessity for removal of potentially prob-
lematic proteins. Our finding of a correlation between high
mRNA degradation rates and disordered proteins would
appear to be in agreement with this.
The correlation between increasing amounts of protein disor-
der and longer half-lives was not expected since intrinsically
disordered sequences are known to be extremely susceptible
to proteolytic degradation [79]. However, these results were
consistent with findings reported in Yen et al. [75], who
observed an enrichment of disorder promoting residues in
more stable proteins. This may be a feature of the way in
which stability was measured. Attachment of an amino-ter-
minal GFPS tag to a protein in the global protein stability
assay may interfere with cellular localization and the authors
of this study recognize that the stability values tended only to
be reliable for nuclear proteins. Additionally, it is likely that
this tag affects correct folding of the protein and might
obscure amino-terminal degradation signals (N-degrons),
which are a major determinant of stability in eukaryotic
sequences [80]. Considering these features of the available
dataset, it may be that proteins with longer half-lives are
enriched in the set that coincided with our data. However, the
occurrence of highly stable sequences with long half-lives
observed within sequences containing between 80% and
100% of disordered residues correlates well with the hypoth-
esis that highly disordered proteins exist as complexes in
vivo. A similar conclusion was drawn in the global protein
stability profiling study where Yen et al. suggest that this
mechanism constitutes a protection mechanism from cellular
protein degradation machinery [75].
Recent work on protein disorder [81,82] arrived at similar
conclusions to our study. They suggested that certain disor-
dered proteins may be required to remain in the cell for long
periods of time, and thus need to avoid the degradation proc-
ess. They suggest that such avoidances are evident by an
increase in protein stability for some disordered proteins.
Separately, they also found a correlation between decay rates
and mRNA stability for disordered proteins, in agreement
with our analysis.
Protein disorder and miRNA targets
We find a significantly higher level of predicted miRNA regu-
lation of the transcripts encoding highly disordered proteins
compared with the transcripts encoding highly ordered pro-
teins. The predicted levels of miRNA regulation of the tran-
scripts encoding highly disordered proteins are twice that
observed for the transcripts encoding highly ordered pro-
teins. Over one-third of the transcripts encoding disordered
proteins are predicted to be regulated by miRNA. One-fifth of
the transcripts encoding ordered proteins are predicted to be
miRNA targets. Furthermore, miRNA-regulated gene expres-
sion is over-represented in transcripts encoding disordered
proteins and under-represented in the transcripts coding for
ordered proteins. These trends take into account 99% of the
transcriptome encoding disordered proteins (that is, exclud-
ing the (80,100]% disorder category). We find that the tran-
scripts of highly disordered proteins with high levels of
expression are more likely to be affected by miRNA compared
to those with moderate and low or transient expression. We
provide strong evidence for miRNA regulation being particu-
larly important for transcripts encoding disordered proteins.
The observations make sense in a biological context. Typi-
cally, if a protein has high proportions of disorder, it is rapidly
degraded in the cell [32]. For the cell, it would make economic
sense to have an analogous system in place to handle the flag-
ging up and degradation of the corresponding mRNA at the
transcriptome level. This increased likelihood of miRNA
binding to mRNA molecules that encode disordered proteins
would regulate the gene expression of the mRNA molecule
and prevent undesirable and wasteful translation of proteins
no longer required by the cell.
Protein disorder and ubiquitination
The percentage of residues predicted as possible ubiquitina-
tion sites increases with increasing amounts of disorder.
Interestingly, the relationship between these two properties
is linear and positive. The trend between the percentage of
proteins predicted to have one or more ubiquitination sites
and disorder is more complex. The (80,100]% category has
the lowest proportion of proteins predicted to have one or
more ubiquitination sites compared to the remaining four
categories. This follows a similar trend observed for mRNA
decay rates and predicted miRNA targeting. This suggests
that a significantly lower proportion of these proteins are
likely not to be down-regulated by ubiquitination. This sup-
ports the observation described earlier that a significant pro-
portion of highly disordered proteins is required to be
expressed at high levels in all tissues or some tissues, and
Genome Biology 2009, Volume 10, Issue 5, Article R50 Edwards et al. R50.13
Genome Biology 2009, 10:R50
some are sometimes constitutively expressed. If high propor-
tions of these highly disordered proteins and their corre-
sponding transcripts did have positive signals for targeted
degradation, this could adversely affect fitness. Additionally,
highly disordered proteins with one or more predicted ubiq-
uitination sites that are not constitutively or highly expressed
may have a higher chance of being removed from the cell, as
they are likely to have a higher density of ubiquitination sites.
The (80,100]% disorder category is most likely to have the
highest density of ubiquitination sites (Figure 2e).
Protein disorder in relation to the five properties
studied
The increase in the decay rate of the transcripts encoding dis-
ordered proteins is likely attributable, in part, to the increase
in predicted miRNA regulation. The transcripts encoding dis-
ordered proteins are targeted to a higher extent by miRNA
compared to the transcripts encoding ordered proteins. This
will result in the down-regulation of gene expression. The
absolute gene expression levels and the predicted miRNA reg-
ulation are anti-correlated. The overall decrease in the gene
expression of the transcripts encoding disordered proteins is
likely attributable, in part, to the increased miRNA targeting
that results in the down-regulation of these transcripts.
On the one hand, the majority of the disordered proteins have
evolved with higher mRNA decay rates, higher levels of
miRNA targeting, and higher levels of ubiquitination, which
overall result in lower gene expression levels and protein lev-
els for a high proportion of these disordered proteins com-
pared to the ordered proteins. On the other hand, it is shown
that for a significant proportion of highly disordered proteins,
the converse is true. For the (80,100]% disorder class there is
a decrease in mRNA decay rates, lower proportions of miRNA
targeting and lower proportions of proteins being targeting
for ubiquitination. These properties play a role in the high
levels of gene expression observed in the highly disordered
proteins compared to proteins with less disorder. The regula-
tion of disordered proteins is affected by the various factors
studied, and the relationships between these properties and
protein disorder are inter-related, non-linear and complex.
Chen et al. [83] performed a structural biology analysis for
the purpose of studying associations between structural vul-
nerability and co-expression in yeast and human. They claim
that structural vulnerability (structural disorder) affects gene
co-expression in a quantifiable manner [83]. In their study,
they consider post-transcriptional regulation of transcripts of
highly vulnerable proteins and find that 45% of human genes
are predicted to have a least one miRNA target site compared
to 82.9% of extremely vulnerable genes (87 out of 105) [83].
The mean number of miRNA target sites is 2.66 for human
genes and 6.01 for vulnerable genes [83]. They show that vul-
nerability (disorder) requires significant additional regula-
tion at the post-transcriptional level. This is an observation
also made in our study; however, our miRNA study provides
a more comprehensive analysis. For example, we investigate
three different views of disorder. The first definition divides
the transcriptome into transcripts encoding disordered pro-
teins or ordered proteins. Second, transcripts encoding highly
disordered or highly ordered proteins are considered. Third,
we examined miRNA targeting of mRNAs encoding proteins
with different percentages of disordered residues. Our study
therefore provides more information in relation to disordered
and highly disordered proteins. For example, we find that
transcripts encoding disordered proteins are more likely to be
targeted by miRNA than the transcripts encoding highly dis-
ordered proteins (Figures 1d and 2d; Figure S1c in Additional
data file 1). Additionally, the method and the materials of
Chen et al. [83] provide an estimate of miRNA targeting
higher than our analysis and higher than estimates in other
studies [39,45]. Our overall estimate of 26.5% for miRNA tar-
geting agrees well with other estimates for miRNA targeting
of protein coding transcripts [39,45]. miRNAs are shown to
preferentially target genes with high transcriptional regula-
tion complexity [84], and those involved in cellular signaling
[85] and protein-protein interaction networks [86]. Func-
tional properties such as transcriptional regulation, signaling
and protein-protein interactions are associated with disor-
dered proteins [1,2,5-9,78,83]. Our study highlights the asso-
ciation between predicted miRNA targets and protein
disorder in a general way.
Mono-ubiquitination rather than polyubiquitination is the
prevalent signal in intranuclear trafficking and triggers the
first step of endocytosis [53,87-89]. The transcripts relating
to polyubiquitination GO categories are down-co-regulated
with highly disordered proteins (Table 4). Our results show
that expression levels for the transcripts encoding highly dis-
ordered proteins are anti-correlated with transcripts involved
in proteolysis and ubiquitin-dependent cellular catabolism.
The expression levels for the transcripts encoding highly dis-
ordered proteins are positively correlated with proteolytic
inhibitors. Whilst post-translational modification of proteins
by ubiquitin is a key regulatory event, de-ubiquitination pro-
teases, the enzymes that remove and process ubiquitin from
proteins, are known to be functionally important [90]. Many
of the de-ubiquitination proteases are cysteine proteases
[90]. Transcripts coding for cysteine protease inhibitors,
endopeptidase inhibitors and protease inhibitors are up-co-
regulated with highly disordered protein transcripts (Table
4), which may suggest that protease enzymes involved in de-
ubiquitination are not expressed when the expression of dis-
ordered protein transcripts is high. We hypothesize that if a
highly disordered protein has a ubiquitin tag, the function of
this tag is more likely to be brought to fruition [87,90]. Highly
disordered proteins with one or more predicted ubiquitina-
tion sites that are not constitutively or highly expressed may
have a higher chance of being removed from the cell, as they
are likely to have a higher density of ubiquitination sites. The
(80,100]% disorder category is likely to have the highest den-
sity of ubiquitination sites (Figure 2e). Since ubiquitination is
Genome Biology 2009, Volume 10, Issue 5, Article R50 Edwards et al. R50.14
Genome Biology 2009, 10:R50
a feature of many biological processes [87-89] the presence of
these ubiquitin target sites may also be implicated in protein
transport between membrane components, possibly serving
as a sorting signal and/or a regulatory signal for internaliza-
tion into the endocytic pathways.
Transcripts associated with GO terms involved with protein
complex formation are co-expressed with transcripts of
highly disordered proteins (Table 4). Transcripts belonging to
the (60,80]% disorder class are co-expressed with transcripts
involved in heterodimeric complex assembly whilst those that
belong to the (80,100]% class are co-expressed with those
transcripts involved in homodimeric complex assembly. Sev-
eral disordered proteins are known to be involved in protein
cellular complexes [5,78,83], providing support for this find-
ing. Transcriptome and interactome studies are known to
provide complementary results [91,92]. The results indicat-
ing that chaperone binding correlates with highly disordered
proteins (Table 4) are not conclusive and this is supported by
a recent analysis [93]; it is hypothesized that disordered pro-
teins that bind chaperones do so to avoid aggregation and
assist in complex assembly [94-97]. Expression levels for
transcripts involved in catabolic processes are down co-regu-
lated with expression of transcripts encoding disordered pro-
teins, that is expression levels of these transcript groups are
simultaneously low (Table 4). This suggests that there is a
reduction in the catabolism of biopolymers (such as proteins)
and that the transcripts encoding highly disordered proteins
and the resulting protein product remain in the cell longer to
carry out function. The gene expression measurements were
taken from 200 normal, 'resting' and un-stimulated tissues
and this could partly explain the down-regulation of catabolic
processes as well as other observations.
Conclusions
Our results suggest that the enrichment of miRNA targeting
signals and ubiquitination signals may help prevent the accu-
mulation of disordered proteins and their transcripts in the
cell. Unexpectedly, for a proportion of highly disordered pro-
teins, all four of these trends were reversed. The highly disor-
dered proteins that are constitutively and/or highly expressed
are shown to have low levels of estimated miRNA targeting,
ubiquitination and lower mRNA decay rates, suggesting
mechanisms by which highly disordered proteins can escape
rapid degradation to allow them to successfully carry out their
function. We conclude that the results of our study can serve
as a baseline for characterizing the steady state abundance of
disordered transcripts in normal tissues and cell lines as well
as providing insights into how disordered transcripts might
be regulated. These results can be used in future to compare
disease states to normal states to identify disordered pro-
teins, transcripts and modes of regulation that could be tar-
gets for therapeutic intervention in disease. Our study
provides a better understanding of the regulation of tran-
scripts for disordered proteins and some insights into the cel-
lular regulatory mechanisms of key proteins that are likely to
be involved in disease states.
Materials and methods
Disorder prediction in the human proteome
Human protein sequences were obtained from the Ensembl
FTP website (Assembly version 35). Disorder predictions
were carried out using DISOPRED2 [6] with a 2% false posi-
tive rate. Our definition of a disordered protein states that it
must contain at least one region of 30 contiguous disordered
residues. This cut-off was based on previous work [98]. Two
or more disordered regions separated by a number of ordered
residues were considered distinct disordered regions. Using
MEMSAT3 [99] and PFILT [100], we filtered our datasets for
transmembrane and coiled-coil regions. This ensured a low
false positive rate in our disorder predictions. An ordered
protein is defined as one that has no disordered regions; that
is, it does not contain a contiguous region comprising 30 or
more predicted disordered residues. Using these definitions
[98], proteins were classed as being ordered or disordered
(Table 2).
A second classification scheme was devised to generate pro-
tein datasets reflective of high order and high disorder. To
achieve this, we divided the proteome into 3 groups: those
containing less than 10 residues of disorder; those containing
60% or more disordered residues; and those not fitting within
either group. For the highly ordered protein dataset (Table 2),
we chose a lower end cut-off of less than ten residues of disor-
der to allow for false positive disordered residues. For the
highly disordered proteins (Table 2), an upper cut-off of 60%
was used to ensure that this group contained genuine high
levels of disorder in proteins. A third scheme to classify disor-
der in proteins was based on the percentage of disordered res-
idues in the protein. The percentage of disordered residues in
the protein datasets were binned (Table 2). The first bin
[0,20]% has from 0% (inclusive) to 20% (inclusive) residues
disordered; the second bin (20,40]% has >20% and 40%
residues disordered and so on until the final bin (80,100]%,
which has >80% and 100% residues disordered.
Protein disorder and gene expression
Microarray data pre-processing, normalization and summarization
We combined and integrated 207 normal tissue and cell line
samples at the probe-level from microarray datasets (Table 1)
downloaded from the Gene Expression Omnibus (GEO) data-
base [101]. The Novartis gene expression atlas includes 79
samples, each having two replicates. Seven samples (cancer
tissues and an unknown tissue type) were excluded (Table 1).
Each experimental sample was adjusted for background
using the GCRMA algorithm [102] and quantile normalized
using a common reference distribution constructed from 50
selected and maximally varying U133a chip samples. Summa-
rization was carried out on a per-transcript level using the
Ensembl transcript hs133ahsenst, hs133ahsenstcdf and
Genome Biology 2009, Volume 10, Issue 5, Article R50 Edwards et al. R50.15
Genome Biology 2009, 10:R50
hs133ahsenstprobe custom cdf environments [103]. Sample
R code [104] for the procedure can be found online [105].
Comparison of absolute transcript abundance
The transcripts identified on the microarray were divided into
two distinct groups: those encoding highly disordered pro-
teins (346) and those encoding highly ordered proteins
(2,127). The average transcript abundance in each tissue was
calculated and compared between the two groups. The same
was carried out for disordered (10,681) and ordered (4,883)
categories.
Evaluating significant absolute transcript expressions
Significance values were calculated for absolute transcript
abundances within sample tissues and cell lines using Z
scores to identify outliers. The null hypothesis that the tran-
script was not significantly expressed in the sample was
rejected at P-values of < 0.05.
Evaluating significant expression correlations
Relative transcript abundances were obtained by double
mean centering the absolute transcript levels across the tis-
sues and between the probe-sets. The mean expression for
each probe-set was weighted according to the number of rep-
licates in each tissue group. Weights were calculated such that
the contribution of sample replicates for the same tissue or
cell line summed to 1. Co-expression of the transcript pairs
was then evaluated using a weighted correlation coefficient.
Significance of correlation was evaluated explicitly by apply-
ing a Z score transform to the distribution of Pearson correla-
tion coefficients. Transcripts were considered to be
significantly correlated and consequently co-expressed at P-
values of < 0.01. This significance threshold corresponded to
Pearson's correlation values of 0.749 and -0.729 at the upper
and lower distribution tails, respectively (Figure S6 in Addi-
tional data file 1).
Gene Ontology analysis
GO annotations were downloaded from Ensembl BioMart
[106] for BP and MF transcripts. To robustly identify over-
representation of functions in the sets of transcripts co-regu-
lated with disordered transcripts, a two step statistical testing
procedure was used. First, multiple hypergeometric testing
was performed to identify functions enriched within a set of
co-regulated transcripts for a given disordered transcript.
Prior probabilities for each function class were determined by
the observed frequencies across all transcripts. The null
hypothesis was rejected at P-values below 0.05 controlling
the false discovery rate at 5%. Subsequently binomial testing
was performed (assuming replacement) to model the enrich-
ment of functions common to groups of co-regulated tran-
scripts. The prior probability of enrichment for a function
class between multiple sets of co-regulated transcripts was
determined by evaluating the frequency of positive outcomes
resulting from the hypergeometric test over all co-regulated
transcripts. The false discovery rate for group-wise functional
enrichment was controlled at 1%.
Protein disorder, mRNA decay rates and protein
stability indices
In previous work, Yang et al. [33] measured the mRNA decay
rates of 5,245 human transcripts. The mapping of the EMBL
(GenBank/DBJ) identifiers for these mRNA transcripts [33]
to the Ensembl protein identifiers of our protein datasets was
facilitated by the use of Biomart [106]. Using their EMBL
(GenBank/DBJ) identifiers, we mapped the decay rates to the
Ensembl protein identifiers of our dataset of human proteins.
This gave a dataset of 3,839 proteins, each of which has an
associated experimentally determined mRNA decay rate. We
separated our 3,839 protein dataset into 3 groups; highly dis-
ordered (74 proteins); highly ordered (536 proteins); and the
remainder (3,229 proteins).
Recent work by Yen et al. [75] reported half-life protein sta-
bility measures for more than 8,000 human proteins using
their global protein stability assay. This study is one of the
most comprehensive studies of in vivo stability measured for
proteins in complex cellular mixtures. We mapped these sta-
bility measures to our disorder protein dataset, which
resulted in a set of 6,886 proteins. We separated this dataset
into three groups, as described above. This resulted in 179
highly disordered proteins, 1,396 highly ordered proteins and
5,311 remaining proteins.
Protein disorder and miRNA targets
The predicted mRNA targets of mammalian miRNAs were
downloaded from the TargetScanS website [44]. The dataset
downloaded (release 4.2; April 2008) contains 218,298
mRNA target predictions. The predictions were performed
using TargetScanS [44]. From this dataset, 7,928 unique
genes (HUGO identifiers provided) were predicted to be tar-
gets of miRNA. The HUGO identifiers [107] for the mRNA
genes were extracted into a gene list. An analysis pipeline was
developed to establish whether a correlation exists between
the disordered proteins and the transcripts targeted by
miRNA. The first part uses the Ensembl database and the
PERL API [108] to map the HUGO identifiers to Ensembl
identifiers (the gene, the transcript and the protein) and
extract the associated translated protein sequences. We iden-
tified 15,954 transcripts for the 7,928 HUGO gene identifiers.
The second part categorizes the protein datasets based on the
amounts of disorder (Table 2). With each protein category, a
protein list is derived and protein sequence dataset is created.
The third part compares each protein dataset with the trans-
lated products of the mRNA targets regulated by miRNAs by
tallying identical protein sequences derived from the 15,954
transcripts and the transcripts from each disorder category.
For a given dataset (Table 2), to calculate the percentage of
protein transcripts that are predicted miRNA targets, the
number of matches between the two datasets was divided by
the total number of proteins in the disordered protein cate-
Genome Biology 2009, Volume 10, Issue 5, Article R50 Edwards et al. R50.16
Genome Biology 2009, 10:R50
gory under consideration and this fraction was multiplied by
100. Fisher's exact tests were carried out in R [109] to identify
groups of transcripts that were enriched in miRNA target
sites.
Protein disorder and ubiquitination
Ubiquitin targeting signal sites were predicted for the pep-
tides encoded by the Ensembl transcripts using a neural net-
work-based predictor. Our predictor uses a single hidden-
layer back-propagation network trained to recognize features
of ubiquitin targeting signals over a sliding window of 21
amino acids in the target sequence. The network was trained
using a balanced dataset of Swiss-Prot annotated
ubiquitination sites [110] and rigorously cross-validated
using a jack-knife leave-one-out approach. The performance
of our predictor on both the Swiss-Prot training data and a
non-redundant experimentally defined dataset [110] was also
determined (Figure S7 in Additional data file1). Predictions
were only reported at a false discovery rate of <5% estimated
from our model. Although no ubiquitination predictors were
available when we carried out this study, the Ubi-pred tool
[111] has subsequently been published. This tool obtains a
final area under the curve (AUC) [112] of 0.85, sensitivity of
70.86, specificity of 0.954 and a Matthews correlation coeffi-
cient of 0.69 compared to our own ubiquitination predictor,
which obtains a final AUC of 0.88, sensitivity of 83.44, specif-
icity of 85.43 and a Matthews correlation coefficient of 0.69.
These statistics provided the justification for using our own
ubiquitination prediction tool over Ubi-pred [111] due to the
observed lower false positive rate. The percentage accuracy is
defined here as 100% - Percentage of errors and the AUC is
the area under the receiver operating characteristic (ROC)
curve (a standard score for prediction algorithms between 0
and 1).
As an independent test of our ubiquitin site prediction algo-
rithm, we scanned a dataset of putative and experimentally
determined ligase target sequences [113] for the presence of
ubiquitin modification sites (Table S4 in Additional data file
2). In total, 72.6% of sequences (257 of 345) were predicted to
contain at least 1 modification site. This demonstrates that
our in silico predictions are in good agreement with inde-
pendent experimental outcomes.
Abbreviations
AUC: area under the curve; BP: biological process; GEO:
Gene Expression Omnibus; GO: Gene Ontology; MF: molec-
ular function; miRNA: microRNA.
Authors' contributions
YKE carried out the miRNA and ubiquitin target analysis and
drafted the major part of the manuscript. AEL carried out the
microarray analysis, ubiquitin predictions and function anal-
ysis and assisted in all other aspects of the work. MP carried
out the analysis of decay rates and protein stability. DTJ pro-
vided the ubiquitin site prediction algorithm. DTJ and AEL
conceived of the study and participated in its design and coor-
dination. All authors contributed to and approved the final
manuscript.
Additional data files
The following additional data are available with the online
version of this paper: supplementary Figures S1 to S7 (Addi-
tional data file 1); supplementary Tables S1 to S4 (Additional
data file 2).
Additional data file 1Figures S1 to S7Figure S1 is a four part figure detailing the distributions of four properties, expression abundance, decay rate, and frequency of miRNA and ubiquitin target sites between disordered and ordered sequences. The plots are similar to those shown in Figure 1 but use alternative definitions of disorder and order to partition the data. Figure S2 is a plot of the occurrence of miRNA target sites as the amount of disorder increases. Figure S2a represents the occurrence of miRNA target sites in highly ordered and highly disordered sequences. Figure S2b represents the occurrence of miRNA target sites between ordered and disordered sequences and Figure S2c shows the occurrence of miRNA target sites as the amount of disor-der increases. Figure S3 is a series of plots showing the frequency of sequences that are predicted to contain at least one ubiquitin tar-get site. Figure S3a compares these frequencies between highly ordered and highly disordered sequences. Figure S3b is a similar plot between ordered and disordered sequences. Figure S3c is a bar plot of the frequency of ubiquitinated sequences in populations of disordered, ordered and all sequences as the amount of disorder increases. Figure S4 is a series of plots showing the frequency of predicted ubiquitin target sites in relation to varying amounts of disorder. Figure S4a is a bar plot of the frequency of ubiquitinated residues in highly disordered and highly ordered sequences. Figure S4b is a bar plot of the occurrence of ubiquitinated residues between ordered and disordered sequences. Figure S4c is a plot of the frequency of ubiquitinated residues in ordered, disordered and all sequences as the proportion of disordered residues increases. Figure S5a, b provides evidence that the predictions of ubiquitin target sites are independent of the proportion of lysine residues in the sequence despite the fact that both increase with the amount of disorder in the sequence. Figure S5a is a plot of the relationship between predicted ubiquitin target sites and occurrence of lysine residues with increasing amounts of disorder. Figure S5b shows the occurrence of predicted ubiquitin target sites normalized to the fre-quency of lysine residues as disorder increases. Figure S6 shows the distribution of transcript pair correlations obtained from the sam-ples in the combined microarray studies. The distribution was used to empirically derive P-value cut-offs for significant correlation val-ues. Figure S7 is a receiver operating characteristic (ROC) curve obtained using the ubiquitin site prediction algorithm on experi-mentally determined ubiquitin target sites.Click here for fileAdditional data file 2Tables S1 to S4Table S1 is a color coded listing of molecular function GO terms that are over-represented in clusters of disordered transcripts. Table S2 is a color coded listing of biological process GO terms that are over-represented in clusters of disordered transcripts. Tables S3a details the datasets used in the study and their composition when filtered for redundancy at 90% sequence identity. Table S3b lists the number of sequences that are classed as ordered and disordered when binned according to the amount of disorder present. Table S4 lists the ubiquitin target site predictions for the experimentally determined ligase target dataset.Click here for file
Acknowledgements
One of the authors, YJKE, was financially supported by the Wellcome Trust
Functional Genomics Initiative on Stem Cells (grant number
GR066745MA). The funders had no role in study design, data collection and
analysis, decision to publish, or preparation of the manuscript. We
acknowledge technical support for provision of computer services that ena-
bled us to complete this work and Dr Kevin Bryson for helpful discussions.
References
1. Dunker AK, Lawson JD, Brown CJ, Williams RM, Romero P, Oh JS,
Oldfield CJ, Campen AM, Ratliff CM, Hipps KW, Ausio J, Nissen MS,
Reeves R, Kang C, Kissinger CR, Bailey RW, Griswold MD, Chiu W,
Garner EC, Obradovic Z: Intrinsically disordered protein. J Mol
Graph Model 2001, 19:26-59.
2. Dunker AK, Brown CJ, Lawson JD, Iakoucheva LM, Obradovic Z:
Intrinsic disorder and protein function. Biochemistry 2002,
41:6573-6582.
3. Dunker AK, Cortese MS, Romero P, Iakoucheva LM, Uversky VN:
Flexible nets. The roles of intrinsic disorder in protein inter-
action networks. FEBS J 2005, 272:5129-5148.
4. Uversky VN, Oldfield CJ, Dunker AK: Showing your ID: intrinsic
disorder as an ID for recognition, regulation and cell
signaling. J Mol Recognit 2005, 18:343-384.
5. Hegyi H, Schad E, Tompa P: Structural disorder promotes
assembly of protein complexes. BMC Struct Biol 2007, 7:65.
6. Ward JJ, Sodhi JS, McGuffin LJ, Buxton BF, Jones DT: Prediction and
functional analysis of native disorder in proteins from the
three kingdoms of life. J Mol Biol 2004, 337:635-645.
7. Dyson HJ, Wright PE: Intrinsically unstructured proteins and
their functions. Nat Rev Mol Cell Biol 2005, 6:197-208.
8. Haynes C, Oldfield CJ, Ji F, Klitgord N, Cusick ME, Radivojac P, Uver-
sky VN, Vidal M, Iakoucheva LM: Intrinsic disorder is a common
feature of hub proteins from four eukaryotic interactomes.
PLoS Comput Biol 2006, 2:e100.
9. Lobley A, Swindells MB, Orengo CA, Jones DT: Inferring function
using patterns of native disorder in proteins. PLoS Comput Biol
2007, 3:e162.
10. Wright PE, Dyson HJ: Intrinsically unstructured proteins: re-
assessing the protein structure-function paradigm. J Mol Biol
1999, 293:321-331.
11. Uversky VN, Gillespie JR, Fink AL: Why are "natively unfolded"
proteins unstructured under physiologic conditions? Proteins
2000, 41:415-427.
12. Dunker AK, Obradovic Z: The protein trinity - linking function
and disorder. Nat Biotechnol 2001, 19:805-806.
13. Tompa P: Intrinsically unstructured proteins. Trends Biochem Sci
2002, 27:527-533.
14. Uversky VN: Natively unfolded proteins: a point where biol-
ogy waits for physics. Protein Sci 2002, 11:739-756.
15. Uversky VN: Protein folding revisited. A polypeptide chain at
the folding-misfolding-nonfolding cross-roads: which way to
go? Cell Mol Life Sci 2003, 60:1852-1871.
16. Tompa P: The interplay between structure and function in
intrinsically unstructured proteins. FEBS Lett 2005,
579:3346-3354.
17. Xie H, Vucetic S, Iakoucheva LM, Oldfield CJ, Dunker AK, Obradovic
Genome Biology 2009, Volume 10, Issue 5, Article R50 Edwards et al. R50.17
Genome Biology 2009, 10:R50
Z, Uversky VN: Functional anthology of intrinsic disorder. 3.
Ligands, post-translational modifications, and diseases asso-
ciated with intrinsically disordered proteins. J Proteome Res
2007, 6:1917-1932.
18. Vucetic S, Xie H, Iakoucheva LM, Oldfield CJ, Dunker AK, Obradovic
Z, Uversky VN: Functional anthology of intrinsic disorder. 2.
Cellular components, domains, technical terms,
developmental processes, and coding sequence diversities
correlated with long disordered regions. J Proteome Res 2007,
6:1899-1916.
19. Xie H, Vucetic S, Iakoucheva LM, Oldfield CJ, Dunker AK, Uversky
VN, Obradovic Z: Functional anthology of intrinsic disorder. 1.
Biological processes and functions of proteins with long dis-
ordered regions. J Proteome Res 2007, 6:1882-1898.
20. Cortese MS, Uversky VN, Dunker AK: Intrinsic disorder in scaf-
fold proteins: getting more from less. Prog Biophys Mol Biol 2008,
98:85-106.
21. Iakoucheva LM, Brown CJ, Lawson JD, Obradovic Z, Dunker AK:
Intrinsic disorder in cell-signaling and cancer-associated
proteins. J Mol Biol 2002, 323:573-584.
22. Dunker AK, Obradovic Z, Romero P, Garner EC, Brown CJ: Intrin-
sic protein disorder in complete genomes. Genome Inform Ser
Workshop Genome Inform 2000, 11:161-171.
23. Oldfield CJ, Cheng Y, Cortese MS, Brown CJ, Uversky VN, Dunker
AK: Comparing and combining predictors of mostly disor-
dered proteins. Biochemistry 2005, 44:1989-2000.
24. Uversky VN, Oldfield CJ, Dunker AK: Intrinsically disordered
proteins in human diseases: introducing the D2 concept.
Annu Rev Biophys 2008, 37:215-246.
25. Weinreb PH, Zhen W, Poon AW, Conway KA, Lansbury PT Jr:
NACP, a protein implicated in Alzheimer's disease and
learning, is natively unfolded. Biochemistry 1996,
35:13709-13715.
26. Rochet JC, Lansbury PT Jr: Amyloid fibrillogenesis: themes and
variations. Curr Opin Struct Biol 2000, 10:60-68.
27. Uversky VN: Alpha-synuclein misfolding and neurodegenera-
tive diseases. Curr Protein Pept Sci 2008, 9:507-540.
28. Uversky VN: Amyloidogenesis of natively unfolded proteins.
Curr Alzheimer Res 2008, 5:260-287.
29. Cheng Y, LeGall T, Oldfield CJ, Dunker AK, Uversky VN: Abun-
dance of intrinsic disorder in protein associated with cardio-
vascular disease. Biochemistry 2006, 45:10448-10460.
30. Uversky VN, Roman A, Oldfield CJ, Dunker AK: Protein intrinsic
disorder and human papillomaviruses: increased amount of
disorder in E6 and E7 oncoproteins from high risk HPVs. J
Proteome Res 2006, 5:1829-1842.
31. Galzitskaya OV, Garbuzynskiy SO, Lobanov MY: Prediction of
amyloidogenic and disordered regions in protein chains. PLoS
Comput Biol 2006, 2:e177.
32. Goldberg AL: Protein degradation and protection against mis-
folded or damaged proteins. Nature 2003, 426:895-899.
33. Yang E, van Nimwegen E, Zavolan M, Rajewsky N, Schroeder M, Mag-
nasco M, Darnell JE Jr: Decay rates of human mRNAs: correla-
tion with functional characteristics and sequence attributes.
Genome Res 2003, 13:1863-1872.
34. Raghavan A, Bohjanen PR: Microarray-based analyses of mRNA
decay in the regulation of mammalian gene expression. Brief
Funct Genomic Proteomic 2004, 3:112-124.
35. Tompa P, Prilusky J, Silman I, Sussman JL: Structural disorder
serves as a weak signal for intracellular protein degradation.
Proteins 2008, 71:903-909.
36. Orphanides G, Reinberg D: A unified theory of gene expression.
Cell 2002, 108:439-451.
37. He L, Hannon GJ: MicroRNAs: small RNAs with a big role in
gene regulation.
Nat Rev Genet 2004, 5:522-531.
38. Bartel DP: MicroRNAs: genomics, biogenesis, mechanism,
and function. Cell 2004, 116:281-297.
39. Jackson RJ, Standart N: How do microRNAs regulate gene
expression? Sci STKE 2007, 2007:re1.
40. Lodish HF, Zhou B, Liu G, Chen CZ: Micromanagement of the
immune system by microRNAs. Nat Rev Immunol 2008,
8:120-130.
41. Hobert O: Gene regulation by transcription factors and
microRNAs. Science 2008, 319:1785-1786.
42. Ambros V: The functions of animal microRNAs. Nature 2004,
431:350-355.
43. Krek A, Grün D, Poy MN, Wolf R, Rosenberg L, Epstein EJ, MacMe-
namin P, da Piedade I, Gunsalus KC, Stoffel M, Rajewsky N: Combi-
natorial microRNA target predictions. Nat Genet 2005,
37:495-500.
44. TargetScanS. [ />45. Lewis BP, Burge CB, Bartel DP: Conserved seed pairing, often
flanked by adenosines, indicates that thousands of human
genes are microRNA targets. Cell 2005, 120:15-20.
46. Grün D, Wang YL, Langenberger D, Gunsalus KC, Rajewsky N:
MicroRNA target predictions across seven Drosophila spe-
cies and comparison to mammalian targets. PLoS Comput Biol
2005, 1:e13.
47. Rajewsky N: microRNA target predictions in animals. Nat
Genet 2006, 38(Suppl):S8-S13.
48. Sethupathy P, Corda B, Hatzigeorgiou AG: TarBase: A compre-
hensive database of experimentally supported animal micro-
RNA targets. RNA 2006, 12:192-197.
49. Sethupathy P, Megraw M, Hatzigeorgiou AG: A guide through
present computational approaches for the identification of
mammalian microRNA targets. Nat Methods 2006, 3:881-886.
50. Mazière P, Enright AJ: Prediction of microRNA targets. Drug Dis-
covery Today 2007, 12:452-458.
51. Griffiths-Jones S, Saini HK, van Dongen S, Enright AJ: miRBase:
tools for microRNA genomics. Nucleic Acids Res 2008,
36:D154-D158.
52. Haglund K, Dikic I: Ubiquitylation and cell signaling. EMBO J
2005, 24:3353-3359.
53. Welchman RL, Gordon C, Mayer RJ: Ubiquitin and ubiquitin-like
proteins as multifunctional signals. Nat Rev Mol Cell Biol 2005,
6:599-609.
54. Pickart CM, Fushman D: Polyubiquitin chains: polymeric pro-
tein signals. Curr Opin Chem Biol 2004, 8:610-616.
55. Thrower JS, Hoffman L, Rechsteiner M, Pickart CM: Recognition of
the polyubiquitin proteolytic signal. EMBO J 2000, 19:94-102.
56. Salghetti SE, Caudy AA, Chenoweth JG, Tansey WP: Regulation of
transcriptional activation domain function by ubiquitin. Sci-
ence 2001, 293:1651-1653.
57. Muratani M, Tansey WP: How the ubiquitin-proteasome system
controls transcription. Nat Rev Mol Cell Biol 2003, 4:192-201.
58. Lipford JR, Deshaies RJ: Diverse roles for ubiquitin-dependent
proteolysis in transcriptional activation. Nat Cell Biol 2003,
5:845-850.
59. Molnár A, Schwach F, Studholme DJ, Thuenemann EC, Baulcombe
DC: miRNAs control gene expression in the single-cell alga
Chlamydomonas reinhardtii. Nature 2007, 447:1126-1129.
60. Zhao T, Li G, Mi S, Li S, Hannon GJ, Wang XJ, Qi Y: A complex sys-
tem of small RNAs in the unicellular green alga
Chlamydomonas reinhardtii. Genes Dev
2007, 21:1190-1203.
61. Ha BH, Kim EE: Structures of proteases for ubiqutin and ubiq-
uitin-like modifiers. BMB Rep 2008, 41:435-443.
62. Calin GA, Croce CM: MicroRNA signatures in human cancers.
Nat Rev Cancer 2006, 6:857-866.
63. Calin GA, Croce CM: MicroRNA-cancer connection: the begin-
ning of a new tale. Cancer Res 2006, 66:7390-7394.
64. Hoeller D, Hecker CM, Dikic I: Ubiquitin and ubiquitin-like pro-
teins in cancer pathogenesis. Nat Rev Cancer 2006, 6:776-788.
65. Bushati N, Cohen SM: MicroRNAs in neurodegeneration. Curr
Opin Neurobiol 2008, 18:292-296.
66. Rubinsztein DC: The roles of intracellular protein-degradation
pathways in neurodegeneration. Nature 2006, 443:780-786.
67. Scalbert E, Bril A: Implication of microRNAs in the cardiovas-
cular system. Curr Opin Pharmacol 2008, 8:181-188.
68. Patterson C, Ike C, Willis PW 4th, Stouffer GA, Willis MS: The
bitter end: the ubiquitin-proteasome system and cardiac
dysfunction. Circulation 2007, 115:1456-1463.
69. Mearini G, Schlossarek S, Willis MS, Carrier L: The ubiquitin-pro-
teasome system in cardiac dysfunction. Biochim Biophys Acta
2008, 1782:749-763.
70. Lenburg ME, Liou LS, Gerry NP, Frampton GM, Cohen HT, Christ-
man MF: Previously unidentified changes in renal cell carci-
noma gene expression identified by parametric analysis of
microarray data. BMC Cancer 2003, 3:31.
71. Su AI, Wiltshire T, Batalov S, Lapp H, Ching KA, Block D, Zhang J,
Soden R, Hayakawa M, Kreiman G, Cooke MP, Walker JR, Hogenesch
JB: A gene atlas of the mouse and human protein-encoding
transcriptomes. Proc Natl Acad Sci USA 2004, 101:6062-6067.
72. Ge X, Yamamoto S, Tsutsumi S, Midorikawa Y, Ihara S, Wang SM,
Aburatani H: Interpreting expression profiles of cancers by
genome-wide survey of breadth of expression in normal
tissues. Genomics 2005, 86:127-141.
Genome Biology 2009, Volume 10, Issue 5, Article R50 Edwards et al. R50.18
Genome Biology 2009, 10:R50
73. Cordero F, Botta M, Calogero RA: Microarray data analysis and
mining approaches. Brief Funct Genomic Proteomic 2007, 6:265-281.
74. Kilpinen S, Autio R, Ojala K, Iljin K, Bucher E, Sara H, Pisto T, Saarela
M, Skotheim RI, Björkman M, Mpindi JP, Haapa-Paananen S, Vainio P,
Edgren H, Wolf M, Astola J, Nees M, Hautaniemi S, Kallioniemi O:
Systematic bioinformatic analysis of expression levels of
17,330 human genes across 9,783 samples from 175 types of
healthy and pathological tissues. Genome Biol 2008, 9:R139.
75. Yen HC, Xu Q, Chou DM, Zhao Z, Elledge SJ: Global protein sta-
bility profiling in mammalian cells. Science 2008, 322:918-923.
76. Romero P, Obradovic Z, Li X, Garner EC, Brown CJ, Dunker AK:
Sequence complexity of disordered protein. Proteins 2001,
42:38-48.
77. Vucetic S, Brown CJ, Dunker AK, Obradovic Z: Flavors of protein
disorder. Proteins 2003, 52:573-584.
78. Paliy O, Gargac SM, Cheng Y, Uversky VN, Dunker AK: Protein dis-
order is positively correlated with gene expression in
Escherichia coli. J Proteome Res 2008, 7:2234-2245.
79. Dunker K, Silman I, Uversky VN, Sussman JL: Function and struc-
ture of inherantly disordered proteins. Curr Opin Struct Biol
2008, 18:756-764.
80. Mogka A, Schmidta R, Bukaua B: The N-end rule pathway for reg-
ulated proteolysis: prokaryotic and eukaryotic strategies.
Trends Cell Biol 2007, 17:165-172.
81. Gsponer J, Futschik ME, Teichmann SA, Babu MM: Tight regulation
of unstructured proteins: from transcript synthesis to pro-
tein degradation. Science 2008, 322:1365-1368.
82. Uversky VN, Dunker AK: Biochemistry: Controlled chaos. Sci-
ence 2008, 322:1340-1341.
83. Chen J, Liang H, Fernández A:
Protein structure protection com-
mits gene expression patterns. Genome Biol 2008, 9:R107.
84. Cui Q, Yu Z, Pan Y, Purisima EO, Wang E: MicroRNAs preferen-
tially target the genes with high transcriptional regulation
complexity. Biochem Biophys Res Commun 2007, 352:733-738.
85. Cui Q, Yu Z, Purisima EO, Wang E: Principles of microRNA reg-
ulation of a human cellular signaling network. Mol Syst Biol
2006, 2:46.
86. Liang H, Li WH: MicroRNA regulation of human protein pro-
tein interaction network. RNA 2007, 13:1402-1408.
87. Mukhopadhyay D, Riezman H: Proteasome-independent func-
tions of ubiquitin in endocytosis and signaling. Science 2007,
315:201-205.
88. Mellman I, Nelson WJ: Coordinated protein sorting, targeting
and distribution in polarized cells. Nat Rev Mol Cell Biol 2008,
9:833-845.
89. Hicke L, Dunn R: Regulation of membrane protein transport
by ubiquitin and ubiquitin-binding proteins. Annu Rev Cell Dev
Biol 2003, 19:141-172.
90. Nijman SM, Luna-Vargas MP, Velds A, Brummelkamp TR, Dirac AM,
Sixma TK, Bernards R: A genomic and functional inventory of
deubiquitinating enzymes. Cell 2005, 123:773-786.
91. Ge H, Liu Z, Church GM, Vidal M: Correlation between tran-
scriptome and interactome mapping data from Saccharomy-
ces cerevisiae. Nat Genet 2001, 29:482-486.
92. Jansen R, Greenbaum D, Gerstein M: Relating whole-genome
expression data with protein-protein interactions. Genome
Res 2002, 12:37-46.
93. Hegyi H, Tompa P: Intrinsically disordered proteins display no
preference for chaperone binding in vivo. PLoS Comput Biol
2008, 4:e1000017.
94. Kovacs D, Rakacs M, Agoston B, Lenkey K, Semrad K, Schroeder R,
Tompa P: Janus chaperones: assistance of both RNA- and pro-
tein-folding by ribosomal proteins. FEBS Lett 2008, 583:88-92.
95. Fuxreiter M, Tompa P, Simon I, Uversky VN, Hansen JC, Asturias FJ:
Malleable machines take shape in eukaryotic transcriptional
regulation. Nat Chem Biol 2008, 4:728-737.
96. Tompa P, Fuxreiter M: Fuzzy complexes: polymorphism and
structural disorder in protein-protein interactions. Trends Bio-
chem Sci 2008, 33:2-8.
97. Dice JF: Chaperone-mediated autophagy. Autophagy 2007,
3:295-299.
98. Ward JJ, McGuffin LJ, Bryson K, Buxton BF, Jones DT: The DISO-
PRED server for the prediction of protein disorder. Bioinfor-
matics 2004, 20:2138-2139.
99. Jones DT: Improving the accuracy of transmembrane protein
topology prediction using evolutionary information. Bioinfor-
matics 2007, 23:538-544.
100. Jones DT, Taylor WR, Thornton JM: A model recognition
approach to the prediction of all-helical membrane protein
structure and topology. Biochemistry 1994, 33:3038-3049.
101. Barrett T, Troup DB, Wilhite SE, Ledoux P, Rudnev D, Evangelista C,
Kim IF, Soboleva A, Tomashevsky M, Edgar R: NCBI GEO: mining
tens of millions of expression profiles - database and tools
update. Nucleic Acids Res 2007, 35:D760-D765.
102. Wu Z, Irizarry RA: Preprocessing of oligonucleotide array
data. Nat Biotechnol 2004, 22:656-658.
103. Dai M, Wang P, Boyd AD, Kostov G, Athey B, Jones EG, Bunney WE,
Myers RM, Speed TP, Akil H, Watson SJ, Meng F: Evolving gene/
transcript definitions significantly alter the interpretation of
GeneChip data. Nucleic Acids Res 2005, 33:
e175.
104. Gentleman RC, Carey VJ, Bates DM, Bolstad B, Dettling M, Dudoit S,
Ellis B, Gautier L, Ge Y, Gentry J, Hornik K, Hothorn T, Huber W,
Iacus S, Irizarry R, Leisch F, Li C, Maechler M, Rossini AJ, Sawitzki G,
Smith C, Smyth G, Tierney L, Yang JY, Zhang J: Bioconductor: open
software development for computational biology and
bioinformatics. Genome Biol 2004, 5:R80.
105. Sample R code for microarray pre-processing. [http://bio
inf.cs.ucl.ac.uk/disorder_regulation/]
106. Kasprzyk A, Keefe D, Smedley D, London D, Spooner W, Melsopp C,
Hammond M, Rocca-Serra P, Cox T, Birney E: EnsMart: a generic
system for fast and flexible access to biological data. Genome
Res 2004, 14:160-169.
107. Bruford EA, Lush MJ, Wright MW, Sneddon TP, Povey S, Birney E:
The HGNC Database in 2008: a resource for the human
genome. Nucleic Acids Res 2008, 36:D445-D448.
108. Flicek P, Aken BL, Beal K, Ballester B, Caccamo M, Chen Y, Clarke L,
Coates G, Cunningham F, Cutts T, Down T, Dyer SC, Eyre T, Fitzger-
ald S, Fernandez-Banet J, Gräf S, Haider S, Hammond M, Holland R,
Howe KL, Howe K, Johnson N, Jenkinson A, Kähäri A, Keefe D,
Kokocinski F, Kulesha E, Lawson D, Longden I, Megy K, et al.:
Ensembl 2008. Nucleic Acids Res 2008, 36:D707-D714.
109. R: A Language and Environment for Statistical Computing.
[]
110. Farriol-Mathis N, Garavelli JS, Boeckmann B, Duvaud S, Gasteiger E,
Gateau A, Veuthey AL, Bairoch A: Annotation of post-transla-
tional modifications in the Swiss-Prot knowledge base. Pro-
teomics 2004, 4:1537-1550.
111. Tung CW, Ho SY: Computational identification of ubiquityla-
tion sites from protein sequences. BMC Bioinformatics 2008,
9:31.
112. Mason SJ, Graham NE: Areas beneath the relative operating
characteristics (ROC) and levels (ROL) curves: statistical sig-
nificance and interpretation. Quart J R Meteorol Soc 2002,
128:2145-2166.
113. Yen HC, Elledge SJ: Identification of SCF ubiquitin ligase sub-
strates by global protein stability profiling. Science 2008,
322:923-929.