assessing financial vulnerability an early warning system for emerging markets phần 3 pot
Bạn đang xem bản rút gọn của tài liệu. Xem và tải ngay bản đầy đủ của tài liệu tại đây (154.5 KB, 11 trang )
20 ASSESSING FINANCIAL VULNERABILITY
tion periods because the high-inflation episodes would distort the historic
mean. To avoid this, we divided the sample according to whether inflation
in the previous six months was higher than 150 percent and then con-
structed an index for each subsample.
19
As noted in earlier studies that use the signals approach, the dates of
currency crises derived from this index map well onto the dates that
would be obtained if one were to define crises by relying exclusively on
events, such as the closing of the exchange markets or a change in the
exchange rate regime.
Banking Crises
Our dating of bankingcrisesstressesevents.Thisis because on thebanking
side there are no time series comparable to international reserves and the
exchange rate. For instance, in the banking panics of an earlier era large
withdrawals of bank deposits could be used to date the crisis. In the wake
of deposit insurance, however, bank deposits ceased to be useful for
dating banking crises. As Japan’s banking crisis highlights, many modern
financial crises stem from the asset side of the balance sheet, not from
deposit withdrawals. Hence the performance of bank stocks relative to the
overall equity market could be an indicator. Yet in many of the developing
countries an important share of the banks are not traded publicly. Large
increases in bankruptcies or nonperforming loans could also be used to
mark the onset of the crisis. Indicators of business failures and nonper-
forming loans are, however, usually available only at low frequencies, if
at all; the latter are also made less informative by banks’ desire to hide
their problems for as long as possible.
Given these data limitations, we mark the beginning of a banking crisis
by two types of events: bank runs that lead to the closure, merging, or
takeover by the public sector of one or more financial institutions (as in
Venezuela in 1993); andifthere are no runs, the closure, merging,takeover,
or large-scale government assistance of an important financial institution
(or group of institutions) that marks the start of a string of similar out-
comes for other financial institutions (as in Thailand in 1997). We rely on
existing studies of banking crises and on the financial press; according
to these studies the fragility of the banking sector was widespread during
these periods.
Our approach to dating the onset of the banking crises is not without
drawbacks. It could date the crises ‘‘too late’’ because the financial prob-
lems usually begin well before a bank is finally closed or merged. It could
also date crises ‘‘too early’’ because the worst of crisis may come later.
19. Similar results are obtained by looking at significant departures in inflation from a 6-
and 12-month moving average.
Institute for International Economics |
METHODOLOGY 21
To address this issue we also indicate when the banking crisis hits its
peak, defined as the period with the heaviest government intervention
and/or bank closures.
Identifying the end of a banking crisis is one of the more difficult
unresolved problems in the empirical crisis literature—that is, there is no
consensus on what the criteria ought to be for declaring the crisis to be
over (e.g., resumption of normal bank lending behavior, or a marked
decrease in the share of nonperforming loans, or an end to bank closures
and large-scale government assistance). In our discussion of the aftermath
of crises in chapter 7, however, the end of a banking crisis is understood
to be its resolution (i.e., the end of heavy government financial interven-
tion), not when bank balance sheets cease to deteriorate.
Other empirical studies on banking crises have focused on annual data
and provide no information on the month or quarter in which banking
sector problems surface. Hence it is not possible to compare the exact
dates with our own analysis. We can, however, compare the dating of
the year of the crisis. In most cases, our dates for the beginning of crises
correspond with those found in other studies, but there are several
instances where our starting date is a year earlier than theirs. Tables 2.1
and 2.2 list the currency and banking crisis dates, respectively, for the 25
countries in our sample.
The Indicators
In addition to the 15 early warning indicators originally considered in
Kaminsky and Reinhart (1999), we evaluate the ability of nine additional
indicators that figure prominently in both the theoretical literature on
banking and currency crises and in the popular discussion of these events.
The indicators used in Kaminsky and Reinhart (1999) were international
reserves (in US dollars), imports (in US dollars), exports (in US dollars),
the terms of trade (defined as the unit value of exports over the unit value
of imports), deviations of the real exchange rate from trend (in percentage
terms),
20
the differential between foreign (US or German) and domestic
real interest rates on deposits (monthly rates, deflated using consumer
prices and measured in percentage points), ‘‘excess’’ real M1 balances,
the money multiplier (of M2), the ratio of domestic credit to GDP, the
real interest rate on deposits (monthly rates, deflated using consumer
prices and measured in percentage points), the ratio of (nominal) lending
20. The real exchange rate is defined on a bilateral basis with respect to the German mark
for the European countries in the sample and with respect to the US dollar for all other
countries. The real exchange rate index is defined such that an increase in the index denotes
a real depreciation.
Institute for International Economics |
22 ASSESSING FINANCIAL VULNERABILITY
Table 2.1 Currency crisis starting dates
Country Currency crisis
Argentina June 1975
February 1981*
July 1982
September 1986*
April 1989
February 1990
Bolivia November 1982
November 1983
September 1985
Brazil February 1983
November 1986*
July 1989
November 1990
October 1991
Chile December 1971
August 1972
October 1973
December 1974
January 1976
August 1982*
September 1984
Colombia March 1983*
February 1985*
Czech Republic May 1997
Denmark May 1971
June 1973
November 1979
August 1993
Egypt January 1979
August 1989
June 1990
Finland June 1973
October 1982
November 1991*
September 1992*
Greece May 1976
November 1980
July 1984
Indonesia November 1978
April 1983
September 1986
August 1997
Israel November 1974
November 1977
October 1983*
July 1984
Malaysia July 1975
August 1997*
(continued next page)
Institute for International Economics |
METHODOLOGY 23
Table 2.1 (continued)
Country Currency crisis
Mexico September 1976
February 1982*
December 1982*
December 1994*
Norway June 1973
February 1978
May 1986*
December 1992
Peru June 1976
October 1987
The Philippines February 1970
October 1983*
June 1984
July 1997*
South Africa September 1975
July 1981
July 1984
May 1996
South Korea June 1971
December 1974
January 1980
October 1997
Spain February 1976
July 1977*
December 1982
February 1986
September 1992
May 1993
Sweden August 1977
September 1981
October 1982
November 1992*
Thailand November 1978*
July 1981
November 1984
July 1997*
Turkey August 1970
January 1980
March 1994*
Uruguay December 1971*
October 1982*
Venezuela February 1984
December 1986
March 1989
May 1994*
December 1995
* ס twin crises
Institute for International Economics |
24 ASSESSING FINANCIAL VULNERABILITY
Table 2.2 Banking crisis starting dates
K&R(1999) and G, K, & R C & K IMF (1996
Country (beginning) (1996) and 1998a & b)
Argentina March 1980 1980 1980
May 1985 1985 1985
1989
December 1994 1995 1995
Bolivia October 1987 1986 n.a.
Brazil November 1985 1990
December 1994 1994 1994
Chile 1976
September 1981 1981
Colombia July 1982 1982 1982
April 1998
Czech Republic 1994 n.a. n.a.
Denmark March 1987 n.a. 1988
Egypt January 1980 1980 1981
January 1990 1990 1990
Finland September 1991 1991 1991
Greece 1991 n.a. n.a.
Indonesia November 1992 1994 1992
1997
Israel October 1983 1977 1983
Malaysia July 1985 1985 1985
September 1997
(continued next page)
to deposit interest rates,
21
the stock of commercial banks’ deposits (in
nominal terms), the ratio ofbroadmoney (converted into foreign currency)
to gross international reserves, an index of output, and an index of equity
prices (in US dollars). All these series are monthly. For greater detail, see
the appendix. The links between particular early warning indicators and
underlying theories of exchange rate and banking crises are discussed in
some detail in earlier papers (e.g., Kaminsky and Reinhart 1999).
Turning to the nine ‘‘new’’ indicators introduced here, four of them
are expressed as a share of GDP. These are the current account balance,
short-term capital inflows, foreign direct investment, and the overall bud-
21. This definition of the spread between lending and deposit rates is preferable to using
merely the difference between nominal lending and deposit rates because inflation affects
this difference and thus the measure would be distorted in the periods of high inflation.
An alternative would have been to use the difference between real lending and deposit rates.
Institute for International Economics |
METHODOLOGY 25
Table 2.2 (continued)
K&R(1999) and G, K, & R C & K IMF (1996
Country (beginning) (1996) and 1998a & b)
Mexico September 1982 1981 1982
October 1992 1995 1994
Norway November 1988 1987 1987
Peru March 1983 n.a. 1983
Philippines January 1981 1981 1981
July 1997
South Africa December 1977 1977 1980
South Korea January 1986 n.a. 1983
July 1997 1997
Spain November 1978 1977 1977
Sweden November 1991 1991 1990
Thailand March 1979 1983 1983
May 1996 1997
Turkey 1982
January 1991 1992 1991
1994 1994
Uruguay March 1971
March 1981 1981 1981
Venezuela 1980 1980
October 1993 1994 1993
n.a. ס not applicable
K&Rס Kaminsky and Reinhart (1999)
G, K, & R ס Goldstein, Kaminsky, and Reinhart
C&Kס Caprio and Klingebiel (1996b)
get deficit. In addition, we look at the growth rates in the following
variables (the first three as shares in GDP and the fourth as a share of
investment): general government consumption, central bank credit to the
public sector, net credit to the public sector, and the current account
balance. The latter measure of the current account was motivated by the
view, particularly popular in the wake of the 1994-95 Mexican peso crisis,
that large current account deficits are more of a concern if they stem from
low saving as opposed to high levels of investment. Recent events in
Asia—a region noted for its exceptionally high levels of domestic saving
and its even higher levels of investment—have led to a reassessment of
that view. We also look at two measures of sovereign credit ratings. As
most of the new indicators are not available at monthly or quarterly
frequencies, annual data were used.
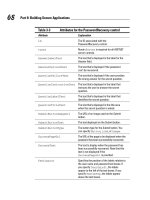
Table 2.3 provides a list of the indicators we examine in this book, their
periodicity, and the transformation used. In chapter 4, we examine the
Institute for International Economics |
26 ASSESSING FINANCIAL VULNERABILITY
Table 2.3 Selected leading indicators of banking and currency crises
Indicator Transformation Data frequency
Real output 12-month growth rate Monthly
Equity prices 12-month growth rate Monthly
International reserves 12-month growth rate Monthly
Domestic/foreign real interest rate Level Monthly
differential
Excess real M1 balances Level Monthly
M2/ international reserves 12-month growth rate Monthly
Bank deposits 12-month growth rate Monthly
M2 multiplier 12-month growth rate Monthly
Domestic credit/GDP 12-month growth rate Monthly
Real interest rate on deposits Level Monthly
Ratio of lending interest rate to deposit Level Monthly
interest rate
Real exchange rate Deviation from trend Monthly
Exports 12-month growth rate Monthly
Imports 12-month growth rate Monthly
Terms of trade 12-month growth rate Monthly
Moody’s sovereign credit ratings 1-month change Monthly
Institutional Investor sovereign credit ratings Semiannual change Semiannual
General government consumption/GDP Annual growth rate Annual
Overall budget deficit/GDP Level Annual
Net credit to the public sector/GDP Level Annual
Central bank credit to public sector/GDP Level Annual
Short-term capital inflows/GDP Level Annual
Foreign direct investment/GDP Level Annual
Current account imbalance/GDP Level Annual
Current account imbalance/investment Level Annual
track record of sovereign credit ratings when it comes to ‘‘predicting’’
financial crises. Specifically, we examine the performance of the Institu-
tional Investor and Moody’s ratings.
As noted, in most cases we focus on 12-month changes in the variables.
This transformation has several appealing features. First, it eliminates
the nonstationarity problem of the variables in levels. It also makes the
indicators more comparable across countries and across time. Some of
the indicators have a strongseasonalpattern, which the 12-month transfor-
mation corrects for. For some indicators, such as equity prices, one could
contemplate using a measure of under- or overvaluation. However, the
empirical performance of most asset pricing models is not strong enough
to justify such an exercise.
For the monthly variables (with the exception of the deviation of the
real exchange rate from trend, the ‘‘excess’’ of real M1 balances, and the
three variables based on interest rates), the indicator on a given month
was defined as the percentage change in the level of the variable with
respect to its level a year earlier. This filter has several attractive features:
it reduces the ‘‘noisiness’’ of working with monthly data, it facilitates
cross-country comparisons, and it ensures the variables are stationary
with well-defined moments.
Institute for International Economics |
METHODOLOGY 27
Turning to credit ratings, Institutional Investor constructs an index that
rises with increasing country creditworthiness and ranges from 0 to 100;
this index is published twice a year and is released in March and Septem-
ber.
22
Hence we work with the six-month percentage change in this rating
index. For Moody’s Investor services, monthly changes in the sovereign
ratings are used. A downgrade takes on the value of minus one; no change
in the rating takes on a value of zero, and an upgrade takes on the value
of one. Since Moody’s ratings take on values from 1 to 16, we also worked
with changes in the ratings that took into account the magnitude of the
change. This issue will be discussed in greater detail in chapter 4.
The Signaling Window
Let us call a signal (yet to be precisely defined) a departure from ‘‘normal’’
behavior in an indicator.
23
For example, an unusually large decline in
exports or output may signal a future currency or banking crisis. If an
indicator sends a signal that is followed by a crisis within a plausible
time frame we call it a good signal. If the signal is not followed by a crisis
within that interval, we call it a false signal, or noise. The signaling
window for currency crises is set a priori at 24 months preceding the crisis.
If, for instance, an unusually large decline in exports were to occur 28
months before the crisis, the signal would fall outside the signaling win-
dow and would be labeled a false alarm.
Alternative signaling windows (18 months and 12 months) were consid-
ered as part of our sensitivity analysis. While the results for the 18-month
window yielded similar results to those reported in this book, the 12-
month window proved to be too restrictive. Specifically, several of the
indicators we use here, including real exchange rates and credit cycles,
signaled relatively early (consistent with a protracted cycle), and the
shorter 12-month window penalized those early signals by labeling them
as false alarms.
For banking crises, we employ a different signaling window. Namely,
any signal given in the 12 months preceding the beginning of the crisis
or the 12 months following the beginning of the crisis is labeled a good
signal. The more protracted nature of banking crises and the high inci-
dence of denial by both bankers and policymakers that there are problems
in the banking sector motivate the more forgiving signaling window for
banking crises.
22. Since there are two readings of this index per year, in a typical year, say 1995, we would
have the percentage change in the rating from September 1994 to March 1995, from March
1995 to September 1995, and the change from September 1995 to March 1996.
23. Of course, normal behavior may change over time, hence, this approach, like other
commonly used alternatives (such as logit or probit) is not free from Lucas-critique limita-
tions. For further discussion of this issue, see Kaminsky and Reinhart (1999).
Institute for International Economics |
28 ASSESSING FINANCIAL VULNERABILITY
The Threshold
Suppose we wish to test the null or maintained hypothesis that the econ-
omy is in a ‘‘state of tranquility’’ versus the alternative hypothesis that
a crisis will occur sometime in the next 24 months. Suppose that we
wish to test this hypothesis on an indicator-by-indicator basis. As in any
hypothesis test, this calls for selecting a threshold or critical value that
divides the probability distribution of that indicator into a region that is
considered normal or probable under the null hypothesis and a region
that is considered aberrant or unlikely under the null hypothesis—the
rejection region. If the observed outcome for a particular variable falls
into the rejection region, that variable is said to be sending a signal.
To select the optimal threshold for each indicator, we allowed the size
of the rejection region to oscillate between 1 percent and 20 percent. For
each choice, the noise-to-signal ratio was tabulated and the ‘‘optimal’’ set
of thresholds was defined as the one that minimized the noise-to-signal
ratio—that is, the ratio of false signals to good signals.
24
Table 2.4 lists the thresholds for all the indicators for both currency
and banking crises. For instance, the threshold for short-term capital
flows as a percentage of GDP is 85 percent. This conveys two kinds of
information. First, it indicates that 15 percent of all the observations in
our sample (for this variable) are considered signals. Second, it highlights
that the rejection region is located at the upper tail of the frequency
distribution, meaning that a high ratio of short-term capital inflows to
GDP will lead to a rejection of the null hypothesis of tranquility in favor
of the alternative hypothesis that a crisis is brewing.
While the threshold or percentile that defines the size of the rejection
region is uniform across countries for each indicator, the corresponding
country-specific values are allowed to differ. Consider the following illus-
tration. There are two countries, one which has received little or no short-
term capital inflow (as a percentage of GDP) during the entire sample,
while the second received substantially larger amounts (also as a share
of GDP). The 85th percentile of the frequency distribution for the low
capital importer may be as small as a half a percent of GDP and any
increase beyond that would be considered a signal. Meanwhile, the coun-
try where the norm was a higher volume of capital inflows is likely to
have a higher critical value; hence only values above, say 3 percent of
GDP, would be considered signals.
24. For variables such as international reserves, exports, the terms of trade, deviations of
the real exchange rate from trend, commercial bank deposits, output, and the stock market
index, for which a decline in the indicator increases the probability of a crisis, the threshold
is below the mean of the indicator. For the other variables, the threshold is above the mean
of the indicator.
Institute for International Economics |
METHODOLOGY 29
Table 2.4 Optimal thresholds (percentile)
Indicator Currency crisis Banking crisis
Bank deposits 15 20
Central bank credit to the public sector 90 90
Credit rating (Institutional Investor) 11 11
Current account balance/GDP 20 14
Current account balance/investment 15 10
Domestic credit/GDP 88 90
Interest rate differential 89 81
Excess M1 balances 89 88
Exports 10 10
Foreign direct investment/GDP 16 12
General government consumption/GDP 90 88
Imports 90 80
Lending-deposit interest rate ratio 88 87
M2 multiplier 89 90
M2/reserves 90 90
Net credit to the public sector/GDP 88 80
Output 10 14
Overall budget deficit/GDP 10 14
Real exchange rate
a
10 10
Real interest rate 88 80
Reserves 10 20
Short-term capital inflows/GDP 85 89
Stock prices 15 10
Terms of trade 10 19
a. An increase in the index denotes a real depreciation.
Table 2.5 illustrates the ‘‘custom tailoring’’ of the optimal threshold by
showing the country-specific critical values for export growth and annual
stock returns for Malaysia, Mexico, and Sweden. A 25 percent decline in
stock prices would be considered a signal of a future currency crisis in
Malaysia and Sweden but not in Mexico, with the latter’s far greater
historical volatility.
25
Figure 2.1 provides another illustration of the country-specific nature
of the optimal threshold calculations. It shows for the entire sample our
measure of the extentofovervaluationin the real exchange rate for Mexico.
The horizontal line is the country-specific threshold, and a reading below
this line (recall that a decline represents an appreciation) represents a
signal. The shaded areas are the 24 months before the crisis, or the signal-
ing window. Around 1982 the shaded area is wider due to the fact that
there was a ‘‘double dip,’’ with two crises registering. If the indicator
crossed the horizontal line andnocrisisensued in the following 24 months,
25. Indeed, as shown in Kaminsky and Reinhart (1998), the volatility pattern for these
three countries is representative of the broader historical regionalpattern. The wild gyrations
in financial markets in Asia in 1997-99, however, may be unraveling those historic patterns.
Institute for International Economics |
30 ASSESSING FINANCIAL VULNERABILITY
Table 2.5 Examples of country-specific thresholds: currency
crises
Critical value for exports Critical value for stock prices
Country (12-month percentage change) (12-month percentage change)
Malaysia מ 9.05 מ15.20
Mexico מ13.10 מ38.30
Sweden מ11.25 מ20.78
as it did in early 1992, it is counted as a false alarm. In the remainder of
this section we will define these concepts more precisely.
Signals, Noise, and Crises Probabilities
A concise summary of the possible outcomes is presented in the following
two-by-two matrix (for a currency crisis).
Crisis occurs in the No crisis occurs in the
following 24 months following 24 months
Signal AB
No signal CD
A perfect indicator would only have entries in cells A and D. Hence, with
this matrix we can define several useful concepts that we will use to
evaluate the performance of each indicator.
If one lacked any information on the performance of the indicators, it
is still possible to calculate, for a given sample, the unconditional probability
of crisis,
P(C) ס (A ם C)/(A ם B ם C ם D) (2.2)
If an indicator sends a signal and that indicator has a reliable track record,
then it can be expected that the probability of a crisis, conditional on a signal,
P(C/S), is greater than the unconditional probability. Where
P(C ͉S) ס A/(A ם B) (2.3)
Formally,
P(C ͉S) מ P(C) Ͼ 0 (2.4)
The intuition is clear: if the indicator is not ‘‘noisy’’ (prone to sending
false alarms), then there are relatively few entries in cell B and P(C ͉S)
Ϸ 1. This is one of the criteria that we will use to rank the indicators in
the following chapters.
Institute for International Economics |