assessing financial vulnerability an early warning system for emerging markets phần 4 pot
Bạn đang xem bản rút gọn của tài liệu. Xem và tải ngay bản đầy đủ của tài liệu tại đây (208.74 KB, 11 trang )
31
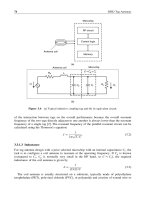
Figure 2.1 Mexico: real exchange rate, 1970-96
average of the sample ס 100
Institute for International Economics |
32 ASSESSING FINANCIAL VULNERABILITY
We can also define the noise-to-signal ratio, N/S, as
N/S ס [B/(B ם D)]/[A/(A ם C)] (2.5)
It may be the case that an indicator has relatively few false alarms in its
track record. This could be the result of the indicator issuing signals
relatively rarely. In this case, there is also the danger that the indicator
misses the crisis altogether (it does not signal and there is a crisis). In this
case, we also wish to calculate for each indicator the proportion of crises
accurately called,
PC ס C/(A ם C). (2.6)
In the next chapter, we employ these concepts to provide evidence on
the relative merits of a broad range of indicators in anticipating crises.
Institute for International Economics |
33
3
Empirical Results
The signals approach was applied to the indicators around the dates of
the 29 banking and the 87 currency crises. In what follows, we first
compare our results for the 15 monthly indicators to those presented in
Kaminsky and Reinhart (1999) and reproduced in table 3.1. In addition
to presenting our in-sample findings, this exercise allows us to gauge
robustness of the signals approach, since the results reported here are
derived from a larger sample of countries (25 versus 20.)
1
Moreover, in
this chapter we report results for many of the indicators that have been
stressed in the financial press surrounding the coverage of the Asian crisis.
The Monthly Indicators: Robustness Check
Tables 3.1 and 3.2 summarize the in-sample performance of the monthly
indicators along the lines described in chapter 2 and presented in Kamin-
sky, Lizondo, and Reinhart (1998) and Kaminsky (1998). Table 3.1 covers
banking crises, and table 3.2 presents the results for currency crises. The
variables are shown in descending order based on their marginal predict-
ive power. For banking crises, for instance, the real exchange rate has the
greatest predictive power and imports the least. For each indicator, the
first column of the tables shows the noise-to-signal ratio. An indicator
with a noise-to-signal ratio of unity, such as those in the bottom of the
1. The five countries included here that were not a part of the Kaminsky and Reinhart
(1999) sample are the Czech Republic, Egypt, Greece, South Africa, and South Korea.
Institute for International Economics |
34 ASSESSING FINANCIAL VULNERABILITY
Table 3.1 Ranking the monthly indicators: banking crises
Percent Difference
Noise- of crises Rank in in rank
to- accurately P(C͉S) Kaminsky (ם denotes an
Indicator signal called P(C͉S) P(C) (1998) improvement)
Real exchange 0.35 52 24.0 14.1 1 0
rate
Stock prices 0.46 76 23.4 11.2 3 0
M2 multiplier 0.46 63 18.3 9.0 4 0
Output 0.54 90 17.3 7.2 5 0
Exports 0.68 79 14.3 4.7 7 ם1
Real interest rate 0.68 96 16.8 4.2 6 מ1
Real interest rate 0.73 100 15.6 3.7 8 0
differential
Bank deposits 0.73 64 12.9 3.1 9 0
M2/reserves 0.84 72 11.4 1.7 10 0
Excess real M1 0.88 44 11.0 1.2 13 ם2
balances
Domestic credit/ 0.89 46 10.9 1.1 11 מ1
nominal GDP
Reserves 0.92 83 10.7 0.8 12 מ1
Terms of trade 1.01 92 11.6 מ0.1 14 0
Lending-deposit 1.48 56 8.3 מ3.5 15 0
interest rate
Imports 1.75 64 6.0 מ4.1 16 0
Sources: The authors and Kaminsky (1998).
tables, issues as many false alarms as good signals. The second column
shows the percent of crises (for which there were data for that indica-
tor) accurately called, while the third column lists the probability of a
crisis conditionalon a signal from theindicator, P(C͉S). The fourth column
shows the differencebetween the conditional andunconditionalprobabili-
ties, P(C͉S) מ P(C), the fifth column shows the ranking that the indicator
received in the previous signals approach analysis, and the last column
calculates the difference between its current and previous rank. Hence,
a ם3 in the last column would mean that the indicator moved up three
notches as the sample was enlarged, while a מ2 would reflect a decline
in its ranking.
The indicators’ rankings based on their marginal predictive power are
shown under the heading P(C͉S) מ P(C). The better the indicator, the
higher the probability of crisis conditioned on its signaling—that is, the
higher the P(C͉S)—and the bigger the gap between the conditional proba-
bility (P(C͉ S) and the unconditional probability P(C). The unconditional
probability of a banking crisis (not shown) varies slightly from indicator to
Institute for International Economics |
EMPIRICAL RESULTS 35
Table 3.2 Ranking the monthly indicators: currency crises
Percent Difference in
Noise- of crises Ranking rank
to- accurately P(C͉S) in K & R (ם denotes an
Indicator signal called P(C͉S) P(C) (1999) improvement)
Real exchange rate 0.22 58 62.1 35.2 1 0
Banking crisis 0.32 46.0 17.0 2 0
Stock prices 0.46 66 47.6 18.3 4 ם1
Exports 0.51 80 42.4 15.0 3 מ1
M2/reserves 0.51 75 42.3 14.9 5 0
Output 0.57 71 43.0 12.5 6 0
Excess real M1 0.57 57 40.1 12.3 7 0
balances
Reserves 0.58 72 38.9 12.2 8 0
M2 multiplier 0.59 72 39.2 11.6 9 0
Domestic credit/ 0.68 57 35.6 8.3 10 0
nominal GDP
Terms of trade 0.74 77 35.4 6.5 11 0
Real interest rate 0.77 89 32.0 5.5 12 0
Imports 0.87 59 30.1 2.9 14 ם1
Real interest rate 1.00 86 26.1 מ0.1 12 מ1
differential
Lending-deposit 1.32 63 24.4 מ4.8 16 ם1
interest rate
Bank deposits 1.32 43 22.3 מ5.2 15 מ1
K&Rס Kaminsky and Reinhart (1999).
Sources: The authors and Kaminsky and Reinhart (1999).
indicator because of differences in data availability, since not all indicators
span the entire sample.
2
For some indicators the sample is such that the
incidence of banking crises (i.e., their unconditional probability) is as low
as 9.8 percent or as high as 12 percent. For currency crises, the uncondi-
tional probability is clustered in the 27 to 29 percent range.
Several interesting features stand out from tables 3.1 and 3.2.
First, the ranking of the indicators appears to be quite robust across
sample selections, as shown in the last column of table 3.1. In other words,
the results from the 25-country sample closely match the results of the
20-country sample. For currency crises, none of the monthly indicators
changes in relative performance by more than one position as the sample
is enlarged, and for 10 of the indicators, there is no change at all. For
2. As shown in Kaminsky, Lizondo, and Reinhart (1998), the bigger the gap between the
conditional probability (P(C͉S) and the unconditional probability P(C), the lower the noise-
to-signal ratio.
Institute for International Economics |
36 ASSESSING FINANCIAL VULNERABILITY
banking crises, the maximum ranking change is two positions and 10 of
the monthly indicators show no change in their relative ranking. This is
a positive factor for the expected out-of-sample usefulness of the signals
approach. Specifically, it suggests that the indicators could well have a
similar relative predictive ability for countries that are not included in
the sample.
3
Second, some of the most reliable indicators are the same for banking
and currency crises. Deviations of the real exchange rate from trend and
stock prices stand out in this regard. Close runners-up are output and
exports. A similar statement applies to the least useful indicators; imports
and the lending-deposit ratios, for example, do not have any predictive
ability for either type of crisis. Several of the low-scoring indicators also
carry the weakest or most ambiguous theoretical rationale.
4
Third, there are some important differences in the ranking of indicators
between currency and banking crises. This suggests that currency and
banking sector vulnerability takes on different forms. A case in point is
the ratioof M2(in dollars) to foreign exchange reserves, a variable stressed
by Calvo and Mendoza (1996) as capturing the extent of unbacked implicit
government liabilities. It does quite well (ranks fifth) among the 16 indica-
tors of currency crises, but it is far less useful when it comes to anticipating
banking crises. Similarly, the money multiplier, real interest rates, and
bank deposits are of little use when it comes to predicting currency crises
but do much better in predicting vulnerability to banking crises. This
result should not come as a surprise. Both the money multiplier and real
interest rates are strongly linked to financial liberalization, which itself
helps predict banking crises. As shown in Galbis (1993), real interest
rates tend to increase substantially in the wake of financial liberalization.
Furthermore, the steep reductions in reserve requirements that usually
accompany financial liberalization propel increases in the money multi-
3. We did not included the larger industrial countries (particularly the G-7 countries) in
our sample because they have characteristics (such as the ability to borrow in their own
currency, a relatively good external-debt servicing history, and high access to private capital
markets) that on a priori grounds would seem to make their crisis vulnerability different
from that of most emerging economies. In addition, data constraints, extremely large struc-
tural shifts over time, and difficulties associated with identifying a ‘‘normal’’ period led to
the decision to exclude China, Russia, and most of the transitional economies from the
sample. Finally, we excluded low-income developing countries from the sample because
we wanted to concentrate on emerging economies that had (in addition to the requisite
data availability) significant involvement with private international capital markets. In the
end, however, one can only tell whether our sample selection results in certain biases by
doing further robustness checks on alternative samples of countries.
4. For instance, lending-deposit interest rate spreads could widen in advance of a crisis
due to a deterioration in loan quality or a worsening in adverse selection problems. Alterna-
tively, it could be persuasively argued that ahead of financial crises, banks may be forced
to offer higher deposit rates, so as to stem capital flight.
Institute for International Economics |
EMPIRICAL RESULTS 37
plier. Bank runs and deposit withdrawals are at the heart of multiple-
equilibriums explanations of banking crises (Diamond and Dybvig 1983)
yet figure less prominently in explanations of currency crises.
5
Lastly, banking crises are even more of a challenge to predict than
currency crises. For currency crises, the marginal predictive power of 12
of the 16 indicators (column five) is 5 percent or higher; for the real
exchange rate, marginal predictive power goes as high as 35 percent.
Indeed 9 of the 16 indicators have marginal predictive power in excess
of 10 percent. By way of contrast, for banking crisis 11 of the 15 indicators
have marginal predictive power of less than 5 percent, and even the top-
ranked macroeconomic indicators have marginal predictive power of less
than 15 percent. This relative inability of indicators to anticipate crises in
sample may be due to two factors. For one thing, for the earlier part of
the sample, banking crises were still relatively rare vis-a
`
-vis currency
crises—there is a large discrepancy between the number of currency and
banking crises studied here. Detecting recurring patterns becomes more
difficult in the smaller sample of banking crises. Also, pinning down the
timing of a banking crisis requires a tricky judgment about when banking-
sector ‘‘distress’’ turns into a full-fledged crisis. As discussed in chapter 2,
the timing of currency crises is more straightforward.
The empirical evidence on the ‘‘predictability’’ of banking crises is
still limited to a handful of studies. Some have followed the approach
pioneered by Blanco and Garber (1986) for currency crises and have
attempted to model the probability of banking crises on the basis of
domestic and external fundamentals. These studies have encountered
some of the same problems highlighted in table 3.1—specifically, the
relatively poor predictive power of the models. Moreover, the results in
the studies sometimes conflict with one another. Eichengreen and Rose
(1998), for example, find that external conditions, specifically international
interest rates, play an important role in predicting banking crises. Real
exchange rate overvaluations, growth, and budget deficits have predictive
power in their regressions. The composition of external debt also seems
to matter. Other variables, including credit growth, they conclude, have
little or no predictive ability. In contrast, Demirgu
¨
c
¸
-Kunt and Detragiache
(1998) find no evidence in favor of budget deficits, while real interest
rates, credit growth, and M2/reserves figure prominently among their
significant regressors. Both studiesdofind,however, that slower economic
growth increases the probability of a banking crisis. In any case, it appears
that, to improve upon the ability to predict banking crises, we may need
to look beyond macroeconomic indicators—an issue that we take up later.
5. However, some recent models (Goldfajn and Valde
´
s 1995) have highlighted the role of
bank runs in precipitating currency crises.
Institute for International Economics |
38 ASSESSING FINANCIAL VULNERABILITY
Table 3.3 Annual indicators: banking crises
Percent
of crises
Noise-to- accurately
Indicator signal called P(C͉S) P(C͉S)P(C)
Short-term capital inflows/GDP 0.38 43 36.8 18.5
Current account balance/ 0.38 38 36.1 18.4
investment
Overall budget deficit/GDP 0.47 52 26.9 12.1
Current account balance/GDP 0.50 33 29.3 12.1
Central bank credit to the public 0.52 23 23.8 7.6
sector/GDP
Net credit to the public sector/GDP 0.72 15 18.3 4.5
Foreign direct investment/GDP 1.05 24 15.6 מ0.6
General government consumption/ 1.44 15 10.0 מ3.8
GDP
The Annual Indicators: What Works?
Tables 3.3 and 3.4 present evidence on the performance of eight annual
indicators that have been prominent in recent discussions of the causes
of financial crises. The indicators include the fiscal variables stressed in
the Krugman (1979) model of a currency crisis as well as the short-term
debt exposure indicatorsstressed in recent theoreticaland empirical expla-
nations of the Asian crisis (Calvo 1998; Calvo and Mendoza 1996; Gol-
dstein 1998b; Radelet and Sachs 1998). As before, the indicators are ranked
according to their marginal predictive power. The first column provides
information on the noise-to-signal ratio, the second column lists the per-
cent of crises accurately called, the third column provides information on
the probability of crisis conditional on signaling, while the last column
provides information on the marginal predictive power of the variable.
The top indicator for banking crises is the share of short-term capital
inflows toGDP. This is consistent withthe results in Eichengreen andRose
(1997) and supports the view that the banking sector becomes particularly
vulnerable during cycles of short-term capital inflows. Such short-term
inflows are more likely to be intermediated through the domestic banking
sector than other types of capital flows, such as foreign direct investment
(FDI) and portfolio flows. Indeed, the share of FDI/GDP does poorly as
a predictor of banking crises. Two of the fiscal variables—the budget
deficit and central bank credit to the public sector—do moderately well,
Institute for International Economics |
EMPIRICAL RESULTS 39
Table 3.4 Annual indicators: currency crises
Percent
of crises
Noise-to- accurately
Indicator signal called P(C͉S) P(C͉S)P(C)
Current account balance/GDP 0.41 56 43.2 19.5
Current account balance/ 0.49 31 39.0 15.1
investment
Overall budget deficit/GDP 0.58 22 36.4 11.5
Short-term capital inflows/ 0.59 29 35.2 10.9
GDP
General government 0.74 15 29.4 5.9
consumption/GDP
Net credit to the public 0.88 20 26.2 2.4
sector/GDP
Central bank credit to the 0.99 13 23.8 0.1
public sector/GDP
Foreign direct investment/ 1.00 24 21.7 0.1
GDP
while the third—government consumption—does poorly. Hence the role
of the public sector in fueling banking crises is somewhat mixed.
Without overinterpreting the results, it is interesting that the composi-
tion of the current account matters, in the sense that the current account
as a percentage of investment does better in predicting banking crises
than the current account as a share of GDP. It may be that investment is
more likely to be financed through the international issuance of bonds
and stocks or overseas loans, while consumption is more dependent on
local bank credit.
Turning to currency crises, the annual indicators that perform best are
those measuring current account imbalances. This finding is not represen-
tative of the broader empirical literature. As discussed in Kaminsky,
Lizondo, and Reinhart (1998), most of the studies that have attempted to
explain the k-period ahead probability of a currency crisis have had mixed
results regarding the current account, with most studies finding it
insignificant.
The various fiscal indicatorsdomoderatelywell in anticipating currency
crises, lending some support to Krugman-type models. By contrast with
banking crises, the composition of capital inflows appears to have rela-
tively little to add to our understanding of what drives a currency crisis.
This result, however, may in part be due to the fact that a large share of
Institute for International Economics |
40 ASSESSING FINANCIAL VULNERABILITY
Table 3.5 Short-term debt: selected countries, June 1997 (percent)
Short-term Short-term
Country debt/total debt debt/reserves
Asia
Indonesia 24 160
Malaysia 39 55
Philippines 19 66
South Korea 67 300
Thailand 46 107
Latin America
Argentina 23 108
Brazil 23 69
Chile 25 44
Colombia 19 57
Mexico 16 126
Sources: Bank for International Settlements; International Financial Statistics; World Bank.
the currency crises (as opposed to the banking crises) took place in the
1970s in an environment of highlyregulated internal andexternal financial
markets, where portfolio flows were negligible.
While our list of indicators is comprehensive, it is by no means exhaus-
tive. The Asian crisis in particular highlighted the importance of currency
and maturity mismatches in increasing vulnerability to currency and
banking crises. Table 3.5 presents an indicator of the imbalance between
liquid liabilities and liquid assets: namely, the ratio of short-term debt to
international reserves. All the emerging economies in this group with
debt-to-reserves levels in excess of 100 percent in mid-1997 have been
casualties of financialturmoil in recentyears (even ifnot all the speculative
attacks ultimately succeeded, as in the case of Argentina.) This suggests
that variables such as short-term debt to reserves could be a valuable
addition to our list of leading indicators of crisis vulnerability.
6
Do the Indicators Flash Early Enough?
The previous discussion has ranked the indicators according to their
ability to anticipate crises while producing few false alarms. Such criteria,
however, do not speak to the lead time of the signal. From the vantage
point of a policymaker or financial market participant who wants to
implement preemptive or risk-mitigating measures, it is not a matter of
6. See Calvo and Mendoza (1996) for an early discussion of this issue. We did not use the
ratio of short-term debt to reserves as an indicator in our tests because its relevance was
highlighted mainly by the Asian crisis and we did not want the out-of-sample tests to be
biased byits inclusion.Inaddition, the datawere notavailablefor theearly part ofour sample.
Institute for International Economics |
EMPIRICAL RESULTS 41
Table 3.6 How leading are the signals? (average number of months
from when the first signal is issued to the crisis month)
Indicator Currency crisis Banking crisis
Bank deposits 15 8
Beginning of banking crisis 19 n.a.
Domestic credit/GDP 12 7
Domestic-foreign interest rate differential 14 16
Excess M1 balances 15 6
Exports 15 16
Imports 16 11
Lending-deposit interest rate ratio 13 6
M2 multiplier 16 12
M2/reserves 13 14
Output 16 13
Real exchange rate 17 10
Real interest rate 17 16
Reserves 15 10
Stock prices 14 12
Terms of trade 15 18
n.a. ס not applicable
indifference whether an indicator sends a signal well before the crisis
occurs or if the signal is given only when the crisis is imminent. Consider
for example, the Conference Board’s composite indices of business cycle
activity for theUnitedStates, which are publishedona monthly basis. Both
financial market participants and policymakers alike find the leading-
indicator composite index more valuable than the coincident and lagging
indices. Market participants incorporate this information in their invest-
ment decisions,while policymakers giveit weight in their policy reactions.
Over the years, US monetary policy has become increasingly forward-
looking and hence preemptive rather than reactive. One could argue that
this transition was facilitated by an improvement in our understanding
of the business cycle and early signs of its turning points.
In what follows, we tabulate for each of the monthly indicators the
average number of months before the crisis when the first signal occurs.
This, of course, does not preclude the indicator from giving signals
through the entire period immediately preceding the crisis. Indeed, for
the morereliable indicators,signals tend to become increasingly persistent
ahead of crises. For the low-frequency (annual) indicators, lead time is
not much of an issue since some of these are published with a considerable
lag and hence tend to be of less use from an early warning standpoint.
Table 3.6 presents the lead times for our monthly indicators—both for
currency and banking crises. In the case of currency crises, the most
striking observation is that, on average, all the indicators send the first
signal anywhere between a year and 18 months before the crisis erupts,
with banking-sector problems (our second-ranked indicator) offering the
Institute for International Economics |