International economics 6th edition phần 3 potx
Bạn đang xem bản rút gọn của tài liệu. Xem và tải ngay bản đầy đủ của tài liệu tại đây (286.46 KB, 54 trang )
cost. The more of one good a country produces, the lower its cost of producing it becomes.
Expanding output to serve a world market rather than a national market allows costs per unit
to fall. Depending upon how prices are set in relation to costs, both countries can gain from
trade in these circumstances. The actual pattern of trade, and the determination of what
goods a country imports and what goods it exports, may reflect a created comparative
advantage attributable to historical accident or government intervention.
Some economies of scale exist that are external to an individual firm. A single firm may
continue to face rising marginal costs of production as it expands output, just as in the H–O
world with perfectly competitive producers. If all firms in the industry expand output, how-
ever, costs for all of the firms as a group may fall. Such economies may be particularly
common if an industry is concentrated in a region. Examples of such concentrations are
producers of semiconductors in Silicon Valley of California, international financial services
in London, watches in Switzerland, and software in Bangalore, India. The possibility of such
economies can alter our conclusions about patterns of trade and gains from trade, as we show
in the first section of this chapter even when we retain the assumption of perfectly
competitive markets.
More often, economies of scale are internal to the firm. As an individual firm expands
output, its cost per unit declines. As a result it may gain an advantage over other firms, both
domestic and foreign, in producing a particular good or variety of good. To develop this
line of reasoning, we begin by considering two contributions that provide useful insights but
provide a much less comprehensive framework for analysis than the H–O model. One
examines a firm’s introduction of a new product, a case where firms in all countries no longer
are assumed to use the same technology to produce the same products. While the innovating
firm gains at least a temporary competitive advantage over others, that advantage may
erode over time. A country that initially exports the product eventually may come to import
it instead. For the United States, TVs are an example of such a product cycle. A second
theory places more attention on product variety and the tendency for similar countries to
trade different varieties of the same product. For example, a country may produce and export
some types of automobiles but nevertheless import others. Such intra-industry trade of
manufactured products is particularly noticeable among high-income countries.
Economists have tried to explain such trade more formally in models that pay more
explicit attention to industry structure and the number of firms in an industry and to general
equilibrium concerns over the allocation of resources across industries. Yet, economists have
no single unified theory to predict how markets function between the extremes of perfect
competition and monopoly. Therefore, theories of international trade that recognize the
importance of internal economies of scale depend critically on what economists assume
about a particular market. Are there many producers or only a few? To answer that question,
it is often useful to know the importance of a firm’s fixed costs, which must be borne even if
the firm produces nothing at all, relative to its variable costs. When fixed costs are relatively
unimportant, it is easier for new competitors to enter an industry when prices rise, and they
are most likely to leave the industry when prices fall. In those circumstances, models of
monopolistic competition and product differentiation provide important insights. For
example, if Ireland imports Heineken beer from the Netherlands but exports Guinness beer
to the Netherlands, this trade in similar products implies that the availability of different
varieties of a product is important to consumers. Economists have developed increasingly
more complete models to analyze trade under these circumstances. We consider such models
later in this chapter, and assess how this approach affects our predictions about patterns of
trade, the gains from trade, and the implications of trade for income distribution.
4 – Trade between similar countries 83
In other markets, fixed costs may be large relative to variable costs, and a new firm may
face major obstacles in entering an industry. Economists use the term “oligopoly market”
to describe such a situation where few firms produce. Because of the high barriers to entry in
such markets, firms may earn economic profits that are not competed away by others. Prices
are not determined simply by costs of production but also by the producers’ ability to charge
more than the average cost of production. In the final section of this chapter we consider
how such models give different predictions about the patterns of trade and gains from trade.
External economies of scale
When several firms in the same industry expand output, they all may achieve lower costs of
production. This situation characterizes external economies of scale and it is particularly
likely to arise when the firms operate in the same region. The source of these lower costs may
be gains from the emergence of specialized input suppliers, benefits from a common pool of
skilled workers, or the spillover of knowledge among firms which allows new technologies
to diffuse and develop more quickly. Let us consider these possibilities in turn and note the
importance of proximity of firms when it arises.
Specialized machinery to serve the needs of a specific industry can allow productivity to
rise and costs of production to fall. However, a firm in that industry may find it quite time-
consuming and inefficient to try to design and make such machinery itself. If the firm is part
of an industry where several producers face similar production bottlenecks and limitations,
they may all benefit if a new firm specializes in the task of developing more efficient equip-
ment that all of them can buy. The gain will be even greater if there are enough producers
of the final good to entice several new entrants into this specialization in input production,
thereby resulting in more competition among them.
An example of this development is American agriculture as the country moved westward.
A pioneer family had to be jacks-of-all trades, able to do all of the myriad tasks of clearing
land, building a house, planting and harvesting a crop, and tending livestock. Self-sufficiency
was a more common goal than specialization. An individual farmer might figure out how to
plow the ground, harvest and thresh grain more efficiently, or save the best seed from one
harvest to plant next year, but such knowledge simply made that farm more efficient. It was
the eventual concentration of many farmers in particularly fertile regions, all producing the
same crops, that helped make specialization more worthwhile. Clever individuals who came
up with successful innovations that worked for them became full-time producers of plows
and threshers to sell to others. Although better communication and transportation even-
tually allowed those ideas and products to spread to farmers in more isolated areas, producers
of implements or hybrid seeds had an incentive to locate in the fertile regions where the
concentration of potential customers was greater.
Not only may equipment become highly specialized to serve an industry, but labor skills
specific to an industry also are likely to develop. To meet that need, one solution is for each
firm to train the labor it requires. While that certainly may occur, proximity to other firms
offers an additional advantage. Random good luck may cause the demand faced by one
producer to rise, while random bad luck causes demand faced by another to contract. When
the two firms are located in the same region, the expanding firm can hire the labor laid off
by the contracting firm, without having to experience the delay of training newcomers.
Thus, production costs for the industry will be lower.
Finally, spillovers of knowledge may spread new technology quickly among firms. When
firms are geographically close to each other, that process occurs more easily and improve-
84 International economics
ments are introduced at a faster pace. Of course, firms often have an incentive to keep new
technology a secret. In the eighteenth and nineteenth centuries, immigrants to the United
States arrived, not carrying a purloined set of blueprints for a machine, but having memo-
rized how such a machine was built in Europe. What are the consequences of this transfer
of technology? If firms reap no benefit from developing a new product or production
process, their incentive to innovate is reduced. But, once an idea is developed, society
benefits if it is shared widely. In Chapter 9 we consider the trade-off that exists between
rigorous enforcement of the rights of the inventor and the social gains from others’ gaining
access to new technology. That issue has been particularly important in recent international
negotiations over intellectual property rights and patents.
In industries where technology is changing very quickly, and one idea is quickly super-
seded by another, even innovating firms may benefit from rapid diffusion. The gain from
access to new ideas offsets the loss from not being able to prevent spillovers to others. Under
those circumstances, the innovator is less worried about competitors being free-riders on its
research and development efforts.
Are external economies likely to be limited to a country or even some region within
a country? Some barriers to diffusion are geographic because ideas spread more rapidly when
those who work in the same industry move from company to company and socialize together.
The spread of Internet usage, however, may reduce the role of proximity or national boun-
daries in some industries. Sometimes the barriers to diffusion are cultural. If American
engineers do not read Japanese, they will not learn about the latest Japanese research
and development in semiconductor design and production as rapidly. Sometimes the barriers
to diffusion are legal. For example, legal scholars have attributed part of the success of the
electronic revolution in California, and its retreat in Massachusetts, to different interpre-
tations of what information an individual hopping from one firm to another can pass on
without violating stipulations that they must not compete with their former employers.
1
For
the current discussion, we assume that there are settings where the potential sources of
external economies within a country that we have mentioned here are significant.
Decreasing opportunity cost
The existence of external economies affects the shape of the production-possibility curve.
To demonstrate why that is true, we begin by restating the effect of these economies of scale
in a slightly different form: an industry that doubles the inputs it hires will more than double
the output it produces. Expansion of output by a greater proportion than inputs used in
production is what allows costs per unit to fall.
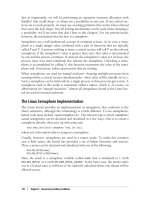
The importance of this condition is shown in Figure 4.1, which represents an economy’s
ability to produce semiconductors and soybeans. To simplify our diagram, we assume there
are no differences in factor intensities in the production of these two goods. If we imposed
the assumption of constant returns to scale, we would be right back to the classical model
of constant opportunity cost in Chapter 2. In a more complete analysis, we could assess how
differences in factor intensities create a tendency toward increasing opportunity costs, as
demonstrated in Chapter 3, which in turn may be offset by increasing returns to scale and a
tendency toward decreasing opportunity cost. Our more modest goal here is to show why
increasing returns to scale result in decreasing opportunity cost.
The production-possibility curve is bowed inward (convex to the origin) in contrast to
the curve that bowed outward (concave to the origin) in the case of increasing opportunity
cost. Start at point A, which represents the case where just half of the country’s resources
4 – Trade between similar countries 85
are devoted to the production of each good. As drawn in Figure 4.1, that corresponds to
being able to produce 25 units of each good. Suppose now that the economy allocates all
resources to semiconductor production. Inputs into semiconductor production have just
doubled. Due to economies of scale, however, output of semiconductors more than doubles
to 100 units. A comparable result is shown if all resources are allocated to soybean
production: doubling inputs leads to more than double the output.
We can interpret those changes in terms of opportunity cost, too. As the economy moves
from point C to point A, it gives up 75 tons of soybeans in return for 25 semiconductors,
which implies a relative price of 3 tons of soybeans per semiconductor. Now move the
economy from point A to point B. It has given up 25 tons of soybeans in return for 75
additional semiconductors, which implies a relative price of 0.33 tons of soybeans per
semiconductor. The marginal rate of transformation is declining as more semiconductors are
produced, which also represents decreasing opportunity cost.
In a closed economy the equilibrium level of production of the two goods again is given
by the tangency of the community indifference curve i with the production-possibility
curve. All firms still act as price takers and each one expands its output of a good until its
marginal cost of production equals the market price. Because that condition will not be met
in the imperfectly competitive models that follow later in this chapter, we note it here. Thus
far, the autarky solution for this economy appears no different from that in our previous
models.
When we consider the possibility of trade, this similarity no longer automatically holds.
To demonstrate these differences most clearly, consider two economies that are identical
in all respects. In autarky they both choose the same consumption point A along the
production-possibility curve in Figure 4.1, and they both face the same relative prices at that
point. By the principles of comparative advantage developed in the preceding two chapters,
there would appear to be no basis for trade. Yet both economies could gain if one were to
specialize in semiconductors and the other in soybeans. In Figure 4.2 we show the special
86 International economics
Soybeans
025
25
100
100
C
A
B
i
Semiconductors
Figure 4.1 Equilibrium in a closed economy with decreasing opportunity cost. External economies
of scale allow industry output to expand by a greater proportion than the expansion of
inputs used in production. Compare production at point A where half of the economy’s
resources are devoted to producing each good with points B and C where all resources are
devoted to the production of a single good. Inputs double and output more than doubles.
case of symmetric demand and production conditions, where each economy can trade along
the barter line CDB. One economy specializes in semiconductors. It produces at point B,
consumes at point D, and trades BE of semiconductors for ED of soybeans. The other
economy specializes in soybeans. It produces at point C, consumes at point D, and trades CF
soybeans for FD semiconductors. The two trade triangles are identical at this equilibrium
price. Also, both economies move to a higher indifference curve, from i
1
to i
2
. Two countries
can gain from trade by having each exhaust the available external economies in producing
one good rather than each trying to be self-sufficient and unable to achieve those same
economies.
The possibility of gains from trade is familiar, but we cannot rely upon differences in
autarky prices to explain why this pattern of trade emerges. In this example of perfectly
identical economies, the pattern of trade is indeterminate; it could be assigned by a master
planner or settled by the flip of a coin but it would not matter, because both countries
experience the same gains from trade. In a more realistic setting, the equilibrium price ratio
is not likely to be one that results in both countries moving to the same higher indifference
curve. For example, suppose consumers in both countries have a stronger preference for
semiconductors than for soybeans. Let trade again result in the same specialized production
pattern, but now observe that a higher price of semiconductors and a steeper barter line
drawn from point B would allow the country that specializes in their production to reach a
higher indifference curve. Correspondingly, the country that specializes in producing
soybeans now finds that the barter line drawn from point C gives it a smaller gain in welfare
than in the symmetric case of Figure 4.2. Although both countries start from identical
circumstances, the pattern of production that emerges rewards one more than the other.
Such an outcome fuels policy debates over the potential role of governments to pick
successful industries that allow larger gains from trade and to avoid those that may even leave
a country worse off. We return to this topic in Chapter 6.
4 – Trade between similar countries 87
C
F
D
A
0E
B
Semiconductors
Soybeans
i
2
i
1
Figure 4.2 Equilibrium with foreign trade and decreasing opportunity cost. This special case of trade
under conditions of decreasing opportunity cost shows identical countries gaining equally
from the opportunity to trade. One country specializes in semiconductors and trades EB
semiconductors for 0F soybeans. The other country specializes in soybean production and
trades CF soybeans for 0E semiconductors. Both countries move to the higher indifference
curve i
2
.
This indeterminacy of the actual pattern of trade can be demonstrated in another way.
One country may have greater potential to achieve low per-unit costs of production, perhaps
due to a difference in endowments that favors the factor used intensively in producing the
good where scale economies exist. The other country, however, may have a head-start in
producing the good. Because of that head-start and higher volume of output, the country
achieves economies of scale that allow it to sell at a lower price than the prospective
competitor. We represent such a situation in Figure 4.3, which shows average cost curves
that correspond to Chinese and Japanese production of automobiles. At any level of output,
the Chinese industry’s cost curve lies below the Japanese industry’s curve. Yet, because of
Japan’s head-start, its industry produces a much greater quantity of cars and achieves a lower
average cost than China does based on its smaller volume of output.
The existence of scale economies can offset the importance of differences in factor
intensities and relative factor abundance, which may otherwise account for China’s pro-
jected cost advantage. Japan may export a labor-intensive good, even though labor is a scarce
factor in Japan, because large external economies of scale exist in its production. If the
Japanese industry expands aggressively, as its initial success and profitability allow it to
do, it may maintain this advantage over China. The Chinese projected cost advantage never
is observed in the market.
The Japanese advantage may rest not only on external economies of scale but also on
economies of scale internal to the firm. To consider their role, however, we need to specify
more fully what determines industry structure in each country and how firms set prices in
relation to their costs. Those are topics we pursue later in this chapter.
88 International economics
AC
AC
C
Q
C
Q
J
AC
J
Q
Cumulative
Cars
AC
China
AC
Japan
Figure 4.3 The advantage of a long-established industry where scale economies are important. China
has the potential to be a more efficient producer of this good than Japan, but the Japanese
industry is already large, operating at Q
J
, and therefore enjoys large-scale economies. The
far smaller Chinese industry, operating at Q
C
, cannot compete successfully against the
Japanese industry because the Chinese lack the large-scale economies that Japan enjoys.
The product cycle
When economies of scale are internal to a firm and not all firms share the same technology,
the perfectly competitive markets assumed above are not appropriate. On the other hand,
when new products and technology are developed, the innovator is unlikely to gain a
permanent monopoly position as the producer of such a product. Raymond Vernon proposed
the hypothesis that new products pass through a series of stages in the course of their
development,
2
and the comparative advantage of the producers in the innovating country
will change as products move through this product cycle. The theory, often referred to as
the “Vernon product cycle,” applies best to trade in manufactured, as opposed to primary,
products.
Looking at the 1950s and 1960s, Vernon noted that many new products were initially
developed in the United States. To some extent that was a function of US scientific and
innovative capacity, and indeed subsequent research has shown that US exports used the
skills of R&D scientists and engineers intensively.
3
Yet some inventions that occurred
outside the United States, such as television, were first commercialized in the United States.
That aspect of the cycle was attributable to the US position after World War II as a nation
that did not have to use scarce resources to rebuild a war-torn economy. Rather, the United
States could devote more of its resources to production and consumption of new goods that
were not simply essentials for survival but often luxuries that only those with more
discretionary income could afford to buy. Also, in some circumstances it was the relatively
higher cost of labor in the United States that provided an incentive to develop new products
and processes that economized on the use of that scarce input.
Thus, many new products initially were developed in the United States, with production
and sales first occurring in the domestic market. Locating production close to buyers was
important, so that problems identified by consumers could be communicated immediately
to producers, and changes could be made without long delays or the build-up of defective,
unsatisfactory inventory. After a new product caught on in the United States, however, the
US producer might send a sales force abroad to cultivate foreign markets among consumers
with similar preferences and income levels. Or, foreign merchants and trading companies
attentive to developments in the United States might place orders for the product. Thus,
the United States began to export the product.
As foreign demand grew, sales in some countries might eventually reach a threshold level
large enough to tempt foreign firms to undertake production for themselves. Foreign firms
might acquire the technology necessary to manufacture the product or the US producer
might find it profitable to establish a subsidiary abroad to produce the good. In either case,
a certain degree of standardization presumably had occurred with respect to the product’s
features and reliability, which meant that immediate contact between the producer and
consumer was no longer so important. Production of the standardized good no longer
required large inputs from scientists and engineers but instead relied upon assembly
operations performed by less skilled workers. As production in other countries rose, US
exports to those markets fell, as well as to third-country markets.
Finally, as foreign firms mastered the production process and as their costs fell with the
increased scale of production, they might begin to export the product to the United States
itself. This sequence of events completes the cycle: the United States began as the exclusive
exporter, then competed with foreign producers for export sales, and finally became a net
importer of the new product. In terms of the US trade position, the product cycle implies a
change through time as illustrated in Figure 4.4 with the following four stages:
4 – Trade between similar countries 89
I Product development and sale in US market.
II Growth in US exports as foreign demand cultivated.
III Decline in US exports as production abroad begins to serve foreign markets.
IV United States becomes a net importer as foreign prices fall.
This scenario seems to fit very well the observed experience with a number of new
products in recent decades, such as radio, television, synthetic fibers, transistors, and pocket
calculators. There is some evidence that the time span between stages I and IV may be
getting shorter, although the length of the cycle varies from one product to another. A
particular product might even move directly from stage I to stage IV, skipping stages II and
III altogether, as cheaper foreign production sites are immediately used to supply all markets.
The product cycle hypothesis can be adapted and modified to take account of a variety of
circumstances and explanatory factors. This gives it great flexibility but also weakens its
predictive power as a theory. For example, the unique role of the United States as a high
income market fertile for new product innovation no longer holds with such force. Rapid
growth in Japan and economic integration in Europe have resulted in other large markets
where economies of scale can be achieved and new product innovation will be profitable.
Differences in factor endowments are smaller and the distribution of scientists and engineers
engaged in research and development is wider now than in the 1950s. Other countries now
have higher wage costs and an incentive to develop labor-saving innovations.
Even if it is now less certain where a new product cycle may begin, the innovating country
will find that its lead is temporary. As demand grows for a product, as the new technology is
learned and assimilated in other countries, and as the productive process is standardized,
then the basic determinants of comparative advantage begin once again to dominate the
location of production. Thus, this theory is essentially short-run, and it is explicitly dynamic.
If the United States is a leader in innovation, it has a temporary comparative advantage in
the latest products, but it steadily loses that advantage and must continually develop other
new products to replace those that are maturing and being lost to competitors. The United
States benefits from a favorable terms-of-trade shift and the monopoly power of its firms that
introduce new products, but its terms of trade decline as competition from new producers
and products occurs.
We emphasize again that the product cycle theory is not directly in conflict with
comparative advantage and factor proportions theory. The United States has a relative
90 International economics
US production,
US exports
US imports,
foreign
production
0
I II III
IV
US
production
Time
Foreign
production
(
X
–
M
)
US
Figure 4.4 The product cycle. The United States has a monopoly on the knowledge necessary to
produce this good through stages I and II, and therefore has growing output and exports.
At the beginning of stage III, however, production in other countries begins, pulling the
original innovating country’s output and exports down. In stage IV, this country imports
the product that it had previously invented and exported.
abundance of scientific and technical personnel, which gives it a comparative advantage in
innovation. However, once a breakthrough is accomplished and a learning period has
elapsed, production will gravitate toward the countries that have a relative abundance of
factors required for routine production of the new product.
The compression of the product cycle, which leaves fewer years between stages I and IV,
may be partly the result of an acceleration in the rate of technical change, so that product
monopolies are more short-lived than they were in the past. Products can be “reverse-
engineered” and successfully imitated and even improved by those able to apply the new idea
developed by another. More countries have that imitative capability than in the past.
Industrial espionage and theft of intellectual property also are current concerns of those who
innovate. In addition, the product cycle may be compressed because multinational firms
move production abroad. The company may retain a monopoly position but the inventing
country does not. The fact that many US firms carry on research and development activities
abroad further complicates the product cycle model, which initially was interpreted in terms
of a unidirectional flow of ideas and goods. Texas Instruments, for example, does much of its
scientific programming in Bangalore, India, and the results of these efforts are applied to
US production.
It has also become more common to license technology to foreign firms, particularly for
inventions that are expected to have a short period of profitability. Allowing foreign firms
to use technology in exchange for a fee is often the preferred way of maximizing profits over
a brief lifetime. It is too expensive to build factories abroad which may only be needed for a
few years, and domestic capacity may be inadequate to meet export demand. A recently
invented computer chip, for example, may only be marketable for a few years before it is
replaced by a newly developed competitor. Understanding the short expected lifetime of
such a product encourages its inventors to license it for foreign production quickly in order
to extract as much revenue from it as possible before improved competitors arrive.
This process is further complicated by the fact that research and development costs have
risen so rapidly that many companies have concluded that they can no longer finance new
products by themselves. Consequently, companies in different countries often share the costs
of developing a new product, with each of them using the new technology in their home
markets. For example, Toyota and General Motors have formed one alliance, and Daimler-
Chrysler, Ford and Ballard Power Systems of Canada another to develop alternatives to the
internal combustion engine.
4
In summary, the product cycle hypothesis provides important insights into the ways the
process of new product innovation and production affects the mix of products a country
trades internationally and the country’s gains from that trade. Anecdotally, it explains why
innovators may initiate production but subsequently cease production altogether. As a
predictive theory it is difficult to apply in a systematic way, though, because we are less able
to claim where a product cycle will begin or how long it will last.
Preference similarities and intra-industry trade
Staffan Burenstam Linder formulated the preference similarity hypothesis, which starts
with the proposition that as a rule a nation will export products for which it has a large and
active domestic market.
5
The reason is simply that production for the domestic market must
be large enough to enable firms to achieve economies of scale and thus to reduce costs
enough to break into foreign markets. Linder argues that the most promising and receptive
markets for exports will be found in other countries whose income levels and tastes are
4 – Trade between similar countries 91
generally comparable to those of the exporting country. This is why the term preference
similarity is relevant. Linder contends that countries with similar income levels will have
similar tastes. Each country will produce primarily for its home market, but part of the output
will be exported to other countries where a receptive market exists.
An interesting aspect of this theory is its implication that trade in manufactured products
will take place largely between countries with similar income levels and demand patterns.
The theory also implies that the commodities entering into trade will be similar, though in
some way differentiated. These two implications accord well with recent experience: the
great majority of international trade in manufactured goods takes place among the relatively
high-income countries: the United States, Canada, Japan, and European countries.
Furthermore, a great deal of this trade involves the exchange of similar products. Each
country imports products that are very much like the products it exports. Germany exports
BMWs to Italy while importing Fiats. France imports both car brands, and exports Peugeots
and Renaults to Germany and Italy.
Linder emphasized that his theory was applicable only to trade in manufactured goods, in
which tastes and economies of scale were deemed to be especially important. In his view,
trade in primary products can be adequately explained by the traditional theory, with its
emphasis on the supply of productive factors, including climate and natural resources.
The Linder model does not explain why one country originates particular products or why
particular firms enter the industry, and so these origins might be viewed as accidental. BMW
happened to start producing cars in Bavaria, whereas Fiat began in Milan, and Peugeot
entered the car business from Paris. Each local economy had to be large enough to support
a firm that was big enough to gain economies of scale, thus making competitive exports
possible. Otherwise, there is no particular explanation of why various types of cars were
produced in each country.
The Linder trade argument, like those discussed earlier, also depends on economies of
scale and implies imperfectly competitive markets. If there were no economies of scale, intra-
industry trade would be unlikely because each model or type of product could be efficiently
produced in each country, thereby saving transport costs. BMW would have factories in
France and Italy, while Fiat would produce in France and Germany. Sizable economies of
scale in automobile assembly, however, would make it very inefficient for these companies
to maintain factories in each country, and large savings would become available by
concentrating production of each type of car in one factory and exporting cars to the two
foreign markets.
The examples of trade in cars demonstrate that consumers value product variety.
Producers also gain from product variety, as implied by our earlier discussion of the gains
from specialized inputs that enable the firm to be more productive and produce at lower cost.
Specialized intermediate inputs are a significant source of trade. Steel alloys can differ in
their tensile strength, corrosion resistance, and malleability, or semiconductors can differ in
92 International economics
Box 4.1 Intra-industry trade: how general is it?
Although intra-industry trade is important for a variety of high-income countries, this
is not a universal pattern. Figures in Table 4.1 indicate a substantial discrepancy
between the values observed for the United States and Europe on the one hand, and
for Japan on the other hand.
4 – Trade between similar countries 93
Table 4.1 calculations are based on the following formula for intra-industry trade
in industry i: IIT
i
= {1 – [|X
i
– M
i
| / (X
i
+ M
i
)]} ϫ 100, where the numerator is the
absolute value of the trade balance in that good and IIT ranges in value from zero to
100. A value of zero denotes no intra-industry trade and will occur when the product
is either imported or exported, but exports and imports do not occur simultaneously.
A value of 100 denotes exports equal to imports. The values for each industry are
weighted by their share of trade to give a country average value. The 1970 entry for
Japan of 32 represents much less intra-industry trade than the French value of 78
does.
Such calculations are always subject to imprecise interpretations because they may
reflect two contrasting cases: (1) imported inputs of intermediate goods and exports
of final goods categorized in the same industry, which may be quite consistent with
the H–O model’s explanation of trade, and (2) trade in different varieties of final
goods, which represents the type of trade predicted by Linder. More significantly,
such calculations have fueled debate over the openness of the Japanese economy,
the protective effect of private business practices, and the ease of distributing
products within the current inefficient system. Critics claim the lack of intra-industry
trade is clear evidence of a Japanese mercantilistic philosophy that tries to eliminate
any reliance on foreign production for goods that can be produced domestically.
Defenders of Japanese practice note that Japan’s pattern of trade differs from that of
other countries due to its much greater dependence on imports of raw materials and
consequent need to export a larger volume of manufactured exports. As a result, less
intra-industry trade will occur.
Such calculations have caused economists more recently to estimate whether a
country’s manufactured imports, or imports from a particular country, differ
significantly from what we would predict after controlling for the country’s domestic
production or factor endowments. A study by James Harrigan calculates that Japan’s
ratio of imports to expenditure is only 28 percent of the US value,
6
but the US value
is much smaller than comparable European ratios. On a bilateral basis, he finds the
United States is more open to trade in manufactures than any of its Organization
for Economic Cooperation and Development (OECD) partners.
An appeal to numbers alone is unlikely to resolve this debate. In years of depressed
Japanese economic growth and burgeoning Japanese trade surpluses, the issue is
certain to attract western attention.
Table 4.1 Average intra-industry trade in manufactured products
Country 1970 1975 1980 1985
Japan 32 26 28 26
United States 57 62 62 61
France 78 78 82 82
West Germany 60 58 66 67
South Korea 19 36 40 49
Source: Edward Lincoln, Japan’s Unequal Trade (The Brookings Institution, 1990), p. 47. Calculations based
on three-digit SIC categories.
their performance at extreme temperatures or power requirements. Different final uses
require different specialized characteristics, and a single supplier will seldom find it efficient
to try to produce all these different varieties. Thus, intra-industry trade can be motivated by
a variety of reasons. The theories that we have discussed thus far, however, do not develop
that reasoning very rigorously. In the next section we examine work that looks at product
variety and imperfect competition more systematically.
Economies of scale and monopolistic competition
The previous examples of individual firms specializing in different varieties of a product rest
upon the existence of economies of scale internal to the firm: a firm’s average cost of
production falls as its own output rises. We begin by considering two possible sources of such
economies of scale and the implication that a firm will find it efficient to specialize in
particular products rather than produce an entire range of products itself. We then examine
the sources of gains from trade in the case of monopolistic competition in two countries,
where firms find it easy enough to enter this industry that any economic profits are eliminated.
One of the most common sources of economies of scale is fixed costs of production. To
enter an industry, before it even starts to produce any output at all, a firm typically must buy
equipment, set up a distribution network, engage in research and development, or launch
an advertising campaign. These costs are then recovered through subsequent sales of the
good it produces. The average fixed cost per unit declines the more units are sold, and the
firm will be able to cover those costs at a lower price.
Simply setting up a production line to produce a different product can have a high
opportunity cost, because production of one good must cease while machinery is recalibrated
to produce another product. This down-time to produce very small quantities of a different
good represents a fixed cost of production. Short production runs can only be justified if
prices are sufficiently high to recover those fixed costs. Studies of the Canadian economy in
the 1960s indicated the disadvantage of a policy to protect domestic producers and produce
small amounts of a broad range of goods: few economies of scale were achieved in comparison
with producers in the United States, and consequently average costs of production were 20
percent higher for many household appliances.
7
Economies of scale also exist when there are increasing returns to scale, and a doubling of
variable inputs leads to more than a doubling of output. A set of industries where firms
experience these economies of scale includes beer brewing, flour milling, oil refining, and
chemical processing. Production in these industries often requires vats, tanks, silos, or
warehouses where the material necessary to make them depends upon their surface area, but
the output obtained from them depends upon the volume they hold. Because the surface area
of a sphere, for example, increases with the square of the radius, while the volume it holds
is a function of the radius cubed, increasing returns to scale occur over an important range
of output as the radius is increased.
Increasing returns to scale apply to cases such as the early automobile production lines of
Henry Ford, who used much more capital equipment than the craft shops that initially
dominated the auto industry. This much larger scale of plant allowed Ford to obtain a more
than proportional increase in output. His ability to achieve these economies of scale as he
produced large volumes of automobiles allowed his average cost per unit to fall below that
of his competitors.
Although we treat other sources of economies of scale in this chapter, the two concepts
covered thus far give us a basis for expecting to observe an initial range of output where the
94 International economics
firm is able to reduce average cost per unit by producing more units. If fixed costs are
particularly large relative to total costs or increasing returns continue to exist as output
expands, these economies of scale give a firm an incentive to expand output. If the firm does
not encounter other constraints in expanding output, potentially it may take over the entire
market. While some industries do become monopolies, with only a single producer, more
often a firm’s choice to expand output is limited by the demand conditions that it faces,
especially the possibility that other firms may enter the industry and lure customers away
from the original producer. In this section of the chapter, we consider the model of mono-
polistic competition to explain what firms will produce.
Figure 4.5 shows a firm that faces a downward-sloping demand curve. The firm has market
power to set prices, but it will not exercise that power arbitrarily. Rather, the firm will
determine its optimal level of output where the extra revenue from producing another unit
just equals the extra cost, that is, where marginal revenue equals marginal cost. The extra
revenue from selling another unit of output no longer equals the price of that unit, as in a
perfectly competitive market, because the firm must take into account the reduction in price
necessary to expand the quantity sold. Additional revenue is raised only when the gain from
more units sold offsets the loss from offering existing customers a lower price. Marginal
revenue will be positive only if demand for the product is elastic, and the positive quantity
effect offsets the negative price effect. Based on the profit-maximizing rule that the firm
produces where marginal revenue equals marginal cost, the firm chooses to produce at Q*.
The price that customers are willing to pay for this much output is P*. This price represents
a mark-up above marginal cost, which will be larger when customers have fewer options and
demand is less elastic. In spite of being able to charge a price greater than marginal cost,
however, the firm only makes an average rate of return. There are no economic or above-
average returns. That result is shown by the tangency of the average total cost (ATC) curve
to the demand curve at P*, where ATC includes an average rate of return to capital used by
the firm. If the ATC curve had been lower and positive economic profits had been earned,
those profits would have attracted new entrants into the industry. In that case the demand
curve for the existing firm shifts inward until this tangency condition is established.
4 – Trade between similar countries 95
P
*
Q
*
ATC
MC
D
MR
Quantity
Figure 4.5 Production under monopolistic competition. The firm produces at Q* where marginal
revenue, MR, equals marginal cost, MC. The firm charges the price P*, which represents
a mark-up above marginal cost, which will be greater the less elastic is demand. The firm
makes an average rate of return, because P equals ATC.
When trade is possible between two countries that each have monopolistically
competitive industries, what results can we predict regarding the pattern of trade and the
gains from trade? If both countries have the same preferences and factor endowments, as well
as the same technical capabilities, then firms from one country are just as likely to be
successful producers in an integrated market as are firms from the other country. For identical
countries, we expect the same number of producers of a good to exist in autarky in each
country. Nevertheless, integration of the market does offer gains to both countries, because
we expect industry rationalization to occur. As a result of the opportunity to serve a larger
market, some firms will expand and achieve greater economies of scale, which allows them
to underprice those which continue to produce the same level of output for the domestic
market only. Some firms will be driven out of business as this process of industry
rationalization occurs. There will be fewer total firms in each country, but the average output
of each one will be greater than before trade. Average costs of production fall as the demand
curves for the remaining firms shift outward in Figure 4.5. Even when the marginal cost of
production is constant, and does not fall as output expands, average cost per unit falls and
the economy as a whole gains, because there is less duplication from separate firms meeting
the fixed costs of entering this industry. If there are increasing returns to scale, which results
in both average cost and marginal cost falling as each firm’s output expands, the gain from
rationalization is even easier to see. Trade results in competition between more firms and
ensures that these cost savings are passed on to consumers. Because consumers now can buy
from both domestic and foreign producers when trade is possible, available foreign product
variety increases too. Consumers gain from trade on two counts: a lower price and greater
variety.
We might summarize this relationship between trade and competitiveness as shown in
Figure 4.6. PP represents the relationship between the number of firms and the ability of
competition to lower costs and prices. The larger the number of firms, the more vigorous the
competitive climate. CC represents the impact of economies of scale on average costs within
a closed national economy; as the number of firms increases, and therefore the size of the
typical firm declines, average costs rise. With a small number of firms, however, each
enterprise will be larger. It will more fully exploit economies of scale, thereby driving down
costs. With a closed national market, the equilibrium average cost is AC. If the market is
instead defined as the world, because imports and exports are allowed, the relationship
between the number of firms and average costs shifts to CC′ because far more firms can exist
without losing economies of scale in the much larger world market. Free trade then helps
lower the equilibrium average cost to AC′ because the world market has both larger firms
and more vigorous competition than were possible in an isolated national market.
Where scale economies are important, international trade can also offer consumers a far
more diverse set of product choices than would be possible with only domestic sourcing.
Economies of scale may mean that only a few models or product types can be produced
within a nation, but if imports are allowed, far more product types can be made available
without the loss of economies of scale. The Canadian automobile market provides a useful
example of this impact of trade. Before the 1965 US–Canada auto pact, Canada maintained
tariffs on US cars. All of the major US auto companies operated plants in Canada, but the
market was so constrained that only a limited range of cars could be produced, and even with
this limitation costs and prices were high. In the mid-1960s the United States and Canada
agreed on free trade in cars and parts, with side agreements between the car companies and
the Canadian government guaranteeing the maintenance of Canadian production and
employment. Through this arrangement all of the car models and types available in the
96 International economics
United States became available in Canada. Moreover, the Canadian plants could sharply
reduce costs by concentrating on the production of one or two models, with the vast majority
of the output being shipped to the United States. Canadian car-buyers were able to choose
from a far wider range of models and no longer had to pay the high prices that resulted when
Canadian factories produced at a less-than-optimal scale.
The implications of this trade for changes in the distribution of income differ from the
H–O model too. Because the basis for trade does not rest upon different factor intensities in
production, there is no change in relative factor demands. While some firms will cease
production, industry output expands in the case of symmetric countries as presented above.
That expansion results from greater sales at the lower prices now necessary to cover lower
costs of production. When trade is liberalized among countries that primarily produce
differentiated manufactured goods with similar input requirements, necessary adjustments
may be much less contentious than in the potential conflict between skilled labor and
unskilled labor described in Chapter 3.
Trade with other forms of imperfect competition
Our analysis in the preceding section was simplified by the assumption that entry of new
firms into the industry allowed any above-average profits to be competed away. The smaller
are fixed costs relative to variable costs, the smaller the barriers to entry in the industry, and
the more likely that a surge in demand and higher profits will attract new entrants into the
industry. On the other hand, some industries are not well described by those conditions.
Barriers to entry are significant enough that some firms can earn above-average profits and
no new entrant competes them away. What part of any cost savings is passed on to
consumers in the form of lower prices is less certain. A further contrast to models of
4 – Trade between similar countries 97
AC
AC
∆
AC
AC
′
P
P
C
C′
C
C′
1
2
Number of firms
Figure 4.6 The impact of free trade on prices: increased competitiveness despite economies of scale.
The PP line indicates that the more firms in a market, the more vigorous the competition
and the lower the average costs. The CC line represents economies of scale in the domestic
industry and shows that the more firms, the smaller each must be and the fewer scale
economies they will enjoy. As a result, more firms means higher average costs. If free trade
exists, so that the relevant market includes foreign producers and markets, CC shifts to C´
C´ because there can be both more firms and bigger firms in a world market. A combination
of larger firms and more vigorous competition is therefore possible at point 2 than was true
in a solely domestic market at point 1. The impact of trade then is to lower average costs.
monopolistic competition is that there are few enough firms in the industry that the action
of one will not be ignored by the others.
There is even more diversity among models that economists have applied to represent the
variety of circumstances that may apply. One extreme is the case where a single domestic
producer would not find it attractive to produce for the domestic market alone, but the
opportunity to trade and serve the larger world market would warrant the entry of one firm.
98 International economics
Box 4.2 Further reasons for economies of scale: the learning curve
Fixed costs and increasing returns to scale are not the only reasons why average costs
of production fall as output rises. Another important factor in some industries has been
the learning curve, which relates the firm’s average cost of production to its cumulative
output. An example of the way we might express such economies is that every time a
company doubles its output, costs per unit fall by 25 percent. Such reductions in cost
may occur due to better organization and scheduling of complex production processes,
such as the assembly of aircraft. In the production of semiconductors they result from
the ability to eliminate flaws in the production process. Initial production runs may
yield as few as five usable chips out of 100 produced; after more experience is gained,
the yield of usable chips may rise as high as 95 percent.
An important aspect of learning is whether it can be transferred from one plant to
another within a company or whether it easily spills over to other firms in the same
country or even to other countries. A steep learning curve where costs fall rapidly as
output expands is likely to result in an industry with fewer firms, because learning
represents a barrier to entry similar to fixed costs or increasing returns. Learning is less
of a barrier to entry if it easily spills over to domestic competitors. In fact, that
possibility is what creates external economies of scale in an industry. If the learning of
one firm spills over to another, and vice versa, then expansion of industry output allows
all firms to produce more cheaply. Correspondingly, if learning spills over
internationally to firms in other countries, then external economies do not create a
competitive advantage for producers of just one nation.
A study by Douglas Irwin and Peter Klenow of the worldwide semiconductor industry
provides empirical evidence on several of the points raised above.
8
Based on analysis of
seven successive generations of dynamic random-access memory chips (DRAMs) from
1972 to 1992, they report an average learning rate of 20 percent. This figure holds for
both US and Japanese firms. With respect to spillovers within the industry, they find
that firms learn three times more from an additional unit of their own cumulative
output than from another firm’s cumulative output. Thus, firms appear able to
appropriate a large share of the benefits from their learning, but because world output
is far more than three times the output of any one firm, spillovers play a major role in
allowing firm production costs to fall. Spillovers that do occur are just as large across
firms in different countries as they are across firms in the same country, and therefore
policies to promote national production end up providing a benefit to others. Also,
spillovers across different generations of chips generally are not observed, specifically
not in the two most recent generations. Thus, fears that government measures will
create successful firms in one generation and thereby develop a competitive advantage
over other firms in subsequent generations do not appear well founded.
High research and development costs to develop a drug that very few people in any one
country ever require represents such a case. In the absence of trade, the drug simply would
not exist, a clear loss of world welfare. Similarly, the high cost of developing a wide-bodied
long-range aircraft to seat 600 passengers would never be warranted if sales were limited to
airlines based in a single-country market, and even with access to the world market, no more
than one producer appears likely to produce such a plane.
Consider a less extreme case where two firms producing an identical product do exist to
serve the world market. We begin by applying a duopoly model that shows how one firm
alters its output in response to output decisions of the other firm.
9
Such a model, developed
by Augustin Cournot,
10
can be summarized in two reaction curves as shown in Figure 4.7.
Let the two curves correspond to a Dutch firm and to an English firm. If the Dutch firm held
a monopoly it would produce at point D
M
along the vertical axis; if the English firm held a
monopoly it would produce at point E
M
along the horizontal axis. The English firm’s reaction
function shows that as Dutch output rises, English production will fall. Because two firms
find it profitable to operate in this industry, the English firm will not be able to operate as a
monopolist at point E
M
. If English output initially were at that level, the Dutch response
would be to produce at D
1
, as given by the Dutch reaction function. At that level of output,
the English firm would then choose to produce E
1
. In turn, the Dutch firm would respond by
producing D
2
. This process converges to the equilibrium shown at Z where the two reaction
curves intersect. Point Z does not lie along a straight line connecting D
M
and E
M
, and
therefore this solution shows that more total output will be produced than when a monopoly
controls the market. Because more output is sold, a lower price must be charged. Thus, gains
from competition are possible in a duopoly setting.
Douglas Irwin applied this duopoly framework to explain the rivalry between the English
East India Company and the Dutch United East India Company for the spice trade with
Southeast Asia from 1600 to 1630.
11
Because land transportation was such an expensive
alternative, competition between sea-faring traders provided the main check on the market
power of any one firm. Furthermore, Queen Elizabeth I granted a 15-year exclusive monopoly
4 – Trade between similar countries 99
W
English reaction curve
Dutch reaction curve
Z
Y
E
1
D
1
D
2
D
M
E
M
Dutch output
English output
Figure 4.7 Reaction curves and duopoly trade. An English monopolist chooses to produce E
M
. If a
Dutch firm enters the market, it offers the quantity D
1
as indicated by its reaction curve.
The English firm reacts by producing E
1
, as indicated by its reaction curve, which results
in a further Dutch response to offer D
2
. This sequential adjustment leads to equilibrium at
point Z.
to the English East India Company, and the Dutch similarly granted the Dutch United East
India Company monopoly rights to trade with Asia. No other country had comparable
maritime power, and thus, a duopoly setting describes this trading situation quite accurately.
The Cournot model implies that the basic decision each firm must make is how large a
quantity of goods to bring to market, which is an appropriate description of the spice trade.
Each trading company determined the number of ships to send to Asia and then auctioned
off the pepper brought back to Europe. The symmetric diagram shown in Figure 4.7 also
appears appropriate because the Dutch and English each sold pepper in the same European
market, they both had access to the Asian markets to acquire pepper, and they had
comparable costs to transport it back to Europe. We would expect each firm to gain half of
the market.
That outcome, however, did not emerge. The Dutch accounted for nearly 60 percent of
the market. Irwin suggests that the Dutch East India Company followed a strategy other than
the profit maximization assumed in the Cournot model. Stockholders could not check the
actions of company agents in the field, whose remuneration depended upon total turn-
over and growth. Such agents had no incentive to cut back their efforts when British
sales expanded, and the Dutch produced more than called for by the Cournot model.
Nevertheless, this strategy was beneficial to the Dutch, giving them 20 percent higher profits
than in the Cournot case, because it in effect implemented a leadership strategy later
identified by Heinrich von Stackelberg.
12
The success of the strategy arises due to the
reduction in the competitor’s (British) output, given the leader’s (Dutch) decision to expand
so much. The outcome is comparable to Dutch maximization of profits assuming it could
count on a subsequent British reduction in output. In terms of Figure 4.7, the strategy
represents a point such as W, where total industry output (British plus Dutch) is greater than
at Z, and prices are lower. Dutch profits are greater due to their larger share of this expanded
market. Even though prices are lower, they still exceed the cost of production and contribute
to higher profits when sales expand sufficiently.
In Chapter 6 we return to this topic because it has arisen in current debates over strategic
trade policy. The Dutch gain was not the result of a carefully implemented government
strategy, and Irwin demonstrates that an even larger gain was possible. Could modern-day
governments achieve similar gains with more purposeful intervention? Although any
historical example is subject to multiple interpretations, Irwin raises the cautionary note that
aggressive Dutch expansion in the Indonesian spice trade relegated Britain to greater trade
with India. The subsequent British opportunity to develop trade in cotton and cotton
textiles is viewed by some economic historians as an important ingredient in the birth of the
Industrial Revolution.
13
The model presented above applies when two firms compete to serve a single market as
in the case of the seventeenth-century pepper trade. An advantage of that situation is that
drawing any conclusions about the welfare of the two supplying countries is more straight-
forward. When the consumption primarily occurs in some third-country market, only the
change in profits earned by the supplying firms must be examined. However, we can also
apply this framework to consider two identical countries that initially are each served by a
domestic monopoly. If trade becomes possible and the two firms compete as Cournot
oligopolists, with the same cost of serving either market, the solution in Figure 4.7 applies
to any one country’s market. The English producer, for example, no longer holds a monopoly
in the English market. Competition with the Dutch firm leads to the solution at point Z,
where more of the product is sold to consumers at a lower price. In the Dutch market, the
Dutch monopolist likewise must compete with the English firm, which results in a greater
100 International economics
quantity and a lower price being charged. The possibility of trade has a pro-competitive
effect that benefits each country, as the market price comes closer to marginal cost, the
optimal condition from a competitive market. Although monopoly profits fall, that
represents a benefit to consumers, and in the symmetric case assumed here, any loss in
English (Dutch) profits is more than offset by gains to English (Dutch) consumers.
Cartels
If the Dutch and English firms represented above could reach an agreement not to compete
against each other, they could increase their profitability. In Irwin’s example of the world
pepper trade, he estimated that their combined profits would have been 12 percent greater
with collusion than in the Cournot solution. Such collusion simply represented both firms
producing half the amount that a monopolist would choose, at point Y in Figure 4.7. As long
as this market sharing arrangement can be enforced, the two firms can each earn higher
profits and gain at the expense of the world’s consumers.
Real-world examples of cartels do not exhibit the symmetries assumed in the example
above, and it is worth examining more realistic cases to understand why collusion and cartel
agreements often are fragile. The most significant case of the past three decades has been the
Organization of Petroleum Exporting Countries (OPEC). Its success in the 1970s appeared
to be a role model for exporters of other primary products, who envisioned a new world order
emerging.
14
These hopes have been disappointed and even OPEC’s ability to influence prices has been
uneven over time. The requirements for creating a successful cartel are rather stringent, and
cartels have a tendency to weaken the longer they are in operation. For a cartel to be
successful in raising prices well above marginal costs, the following conditions must exist:
1 The price elasticity of demand for the product must be low, which means that it has no
close substitutes. Otherwise the volume sold will shrink dramatically when prices are
raised.
2 The elasticity of supply for the product from outside the cartel membership must be low,
which means that new firms or countries are not able to enter the market easily in
response to the higher price. If this condition does not hold, the cartel will discover that
higher prices result in a sharp reduction in its sales as new entrants crowd into the
business.
3 At least a few members of the cartel must be able and willing to reduce production and
sales to hold the price up. If all members insist on producing at previous levels despite
the higher price, there will almost certainly be an excess supply of the product, resulting
in a price decline. Such increases in production often follow secret price cuts by
members competing for sales despite promises not to do so. Production and sales
cutbacks are easier to maintain if a product is durable and can be stored. Failure to sell
perishable crops results in large losses.
4 The membership of the cartel must be congenial and small enough to allow successful
negotiations over prices, production quotas, and a variety of other matters. Cartels are
more difficult to maintain as the number of members rises, particularly if some of them
were historic adversaries.
From this list of conditions a reader can see why OPEC was temporarily successful and
why this kind of success has been so rare in other markets. Most products do have substitutes
4 – Trade between similar countries 101
and/or can be produced by new firms or countries if prices are increased sharply. Cartels have
frequently failed when the market available to the members shrank, but none of them was
willing to cut production sufficiently to support the price. Cheating in the form of secret
price cuts to gain new customers followed, and the intended monopoly collapsed. De Beers
Consolidated Mines can be viewed as a successful cartel in the diamond business. Through
its own mines and marketing contracts with other producers in Africa and elsewhere, it
controls the vast majority of the gem-quality diamonds arriving on the market, and it is
able to manage, if not quite control, prices. Nevertheless, the European Commission has
favorably ruled on De Beers’ distribution system, something the United States has not
done.
15
OPEC was successful in the 1970s because all four of the above conditions held for oil,
but the longer high prices remained in effect, the weaker OPEC became. Efforts to conserve
energy and the increased use of alternative energy sources reduced the demand for oil.
NonOPEC countries such as Mexico and the United Kingdom increased production sharply
in the late 1970s. The results were a sharp reduction in the volume of oil that OPEC
members could sell, unsuccessful attempts to get members to curtail production sufficiently,
and an eventual decline in the price, as can be seen in Figure 4.8.
102 International economics
40.00
35.00
30.00
25.00
20.00
15.00
10.00
5.00
0.00
1973
2
00
1
1974
1975
1976
1977
1978
1979
1980
1
9
81
1
98
2
1
9
83
1
98
4
1985
1992
1
99
1
1
99
0
1
98
9
1988
1987
1
986
1993
1
99
4
1
99
5
2
000
1
999
1998
1997
1
99
6
Nominal Oil Price
Real Oil Price
Figure 4.8 Nominal and real prices of crude petroleum, 1973–2001 (dollars per barrel). The real price
of oil was not much higher in the 1990s than prior to OPEC. Price increases in the twenty-
first century demonstrate renewed market power.
Source: IMF, International Financial Statistics. The real price is based on the average price of crude oil divided by the
export unit value index for industrial countries which was set equal to 1.0 for 1973.
Predicting whether OPEC is permanently weak is problematic. The low oil prices of the
1980s encouraged consumption and discouraged exploration, thus increasing world reliance
on OPEC sources. Iraq’s invasion of Kuwait in 1990 led to a temporary increase in the price
of oil. The Asian financial crises of the late 1990s, however, led to a period of slow growth
and less demand for oil; at the same time economically distressed oil-producing countries
were unwilling to reduce output. The terms of trade of oil producers in 1998 fell to a level
nearly as low as before OPEC’s formation. Subsequently, economic recovery and coordinated
reductions in output by OPEC and nonOPEC oil producers allowed oil prices to rise.
Further aspects of trade with imperfect competition
Another element of trade with imperfect competition that warrants further attention is the
effect of competition when we no longer start from symmetric situations in the two
countries. Previously, we considered the potential gains from trade when an equal number
of monopolistically competitive firms operate in each country in autarky, or when a mono-
polist in the home market becomes a duopolist in an integrated world market. What if the
symmetric expansion of production and consumption does not hold?
Regarding the gains from trade, no simple answer emerges, because two offsetting factors
operate. Allowing trade to lower prices internationally represents a gain to consumers. If this
price reduction leads to less production in a monopoly industry where price exceeds marginal
cost, however, the country may not benefit from trade. This outcome demonstrates the
principle of second best: removing one distortion in an economy where other distortions
exist may not raise welfare. Here we simply show one application of that theory.
Figure 4.9 represents an economy whose autarky production and consumption point is
A.
16
To avoid any confusion over the role of monopoly power versus economies of scale,
we present the case where opportunity costs are increasing. Note that at point A the slope
of the production-possibility curve, which gives the relative marginal costs of producing the
4 – Trade between similar countries 103
P
Corn
Cars
B
C
A
Figure 4.9 A possible decline in welfare from trade with domestic monopoly. In autarky the economy
produces and consumes at point A. The price of cars that faces consumers, given by the line
tangent to the indifference curve at A, is steeper than the marginal cost of production, given
by the line tangent to the production-possibility curve, due to the monopoly power of the
car producer. When trade occurs, the firm’s monopoly power declines, and the gap between
price and marginal cost falls, as shown at production point P. In this example, domestic
output of cars falls enough, however, for the economy to move to a lower indifference at
point C.
two goods, is not the same as the slope of the community indifference curve, which
corresponds to the price at which consumers substitute one good for another. The steeper
slope of the indifference curve indicates that the relative price of cars is greater than the
relative cost of producing cars. The gap between those two lines represents the mark-up of
the domestic monopolist in car production. Indeed, the existence of the monopoly leaves
the country worse off than it would be at point B with competitive markets, where more cars
would be produced and sold at a lower price.
Now introduce trade into this situation. The exact solution will depend upon whether
the monopolist competes with just one other firm or with several additional firms and
whether it is a relatively high-cost producer. If the monopolist is forced to operate as a perfect
competitor, where price equals marginal cost and the international price line is tangent to
the production-possibility curve, the country gains from trade. Under some conditions,
however, the new equilibrium price may result in a situation shown by production at point
P and consumption at point C. Additional competition has reduced the gap between
price and marginal cost, but production of cars has fallen so much that the country becomes
worse off, shown by the movement to a lower indifference curve. When fewer cars are
produced, the economy saves the marginal cost of producing them, but simply loses the
monopoly profit it earned from charging a higher price for cars. That margin cannot be
earned as resources are shifted into corn production. This outcome contrasts with the earlier
symmetric case, where the domestic monopoly became an exporter and increased its sales in
the foreign market at the same time as it was subject to more competition at home. If there
is little or no potential to increase sales abroad, a large country with a high-cost producer is
more likely to lose from this shift in monopoly output to foreign producers. We return to this
topic in Chapter 6 where alternative trade policies and potential profit-shifting are
evaluated.
Summary of key concepts
1 External economies of scale allow average costs in an industry to fall as its output
expands. Potential gains from specialization and trade can be considerable, even when
there are no differences in autarky prices. The actual pattern of trade, however, is
indeterminate. Historical accident or government intervention to give a country a
head-start may explain the pattern of trade observed.
2 Internal economies of scale allow average costs of a firm to fall as its output expands.
When these economies of scale are not so great that they create a major barrier to entry
in an industry, there are likely to be many producers of differentiated products in the
industry. When trade is possible, producers in just one country are unlikely to become
the sole exporters. In the absence of other cost advantages, there will be intra-industry
trade with firms in both countries exporting. The gains from trade come from a greater
variety of products becoming available in an open world market. Also, lower prices are
achieved because of greater competition internationally, while within any single
country the smaller number of producers exhaust more economies of scale.
3 Internal economies of scale may be so great that only a few firms produce in an industry.
Predicting trade in oligopoly industries requires predicting how a firm responds to the
output or price decisions of another firm. Gains from trade include greater competition
and lower prices, but the opportunity to shift oligopoly profits from one country to
another makes net benefits less certain.
104 International economics
4 Oligopolistic firms may collude by forming cartels to reduce competition among
themselves. Such collusion is difficult to enforce, not only because new entrants may be
attracted by higher profits, but also because members of the cartel have an incentive to
cheat on any agreement reached.
4 – Trade between similar countries 105
Questions for study and review
1 If the production of athletic shoes is an industry where external economies of
scale are important determinants of costs of production, how would that make
it more difficult for China to replace Korea as the world’s leading producer?
If China nevertheless were able to become the top producer, would you expect
all production to take place in a single province? What role does proximity
among producers play in determining whether external economies of scale are
achieved?
2 What assumptions of the factor proportions model does the product cycle model
relax or violate? To what extent are predictions of the product cycle model
consistent with the factor proportions model? Does the product cycle model help
explain the Leontief paradox?
3 Why does Linder’s theory of trade in manufactured products predict that more
trade will take place between similar countries? Trade in services is becoming
increasingly important to the United States; would you predict that this US trade
is more likely to be conducted with similar countries or with dissimilar countries?
4 Explain what the index of intra-industry trade shows, and suggest why the values
of this index for Japan and Germany are so different.
5 Assume the fashion industry represents a monopolistically competitive industry,
and explain what types of economies of scale exist that keep it from being a
perfectly competitive industry. How is the opportunity to trade likely to change
the structure of the fashion industry and the output of each designer in the
industry?
6 Suppose two firms serve an integrated world market, and their reaction curves are
given by
q
1
= 30 – 0.5 q
2
q
2
= 30 – 0.5 q
1
where q
1
is the output of firm 1 and q
2
is the output of firm 2. If firm 1 were
guaranteed a monopoly in this market, what would it choose to produce? What
will each duopolist produce in the equilibrium given by the intersection of these
curves? Comparing the duopoly solution to the monopoly solution, how has total
output changed and how will the price charged be affected? If these two firms were
to collude, what would they produce instead?
7 Trade increases competition in previously closed markets. What economic
conditions discussed in this chapter suggest such competition nevertheless can
leave a country worse off?
Suggested further reading
For greater attention to the case of external economies of scale, see:
• Kemp, Murray, The Pure Theory of International Trade, Englewood Cliffs, NJ: Prentice
Hall, 1964, Chapter 8.
For an early presentation on intra-industry trade, see:
• Grubel, Herbert and Peter Lloyd, Intra-Industry Trade: The Theory and Measurement of
International Trade in Differentiated Products, New York: Wiley, 1975.
For a more advanced presentation of trade with imperfect competition, see:
• Helpman, Elhanan and Paul Krugman, Market Structure and Foreign Trade, Cambridge,
MA: MIT Press, 1985.
• Helpman, Elhanan, “Increasing Returns, Imperfect Markets, and Trade Theory,” in
R. Jones and P. Kenen, eds, Handbook of International Economics, Vol. I, Amsterdam:
North-Holland, 1984, Chapter 7.
• Jones, Ronald and Peter Neary, “The Positive Theory of International Trade,” in R. Jones
and P. Kenen, eds, Handbook of International Economics, Vol. I, Amsterdam: North-
Holland, 1984, Chapter 1, pp. 48–53.
Appendix: derivation of a reaction curve
In this appendix we present the mechanics of deriving the reaction curves used in analyzing
oligopoly markets. Our goal is to be able to explain which points lie along each country’s
curve. Begin by supposing that we know the profits of the English producer at all possible
combinations of English and Dutch output. If we connect all points that represent the same
level of profit (an isoprofit curve) we obtain the sort of curves shown in Figure 4.10. For
English output of a
1
, a
2
, or a
3
, English profits are the same. We already know that E
M
repre-
sents the English monopoly solution, and we recognize that producing a smaller amount at
106 International economics
Dutch output
English output
D
3
D
2
D
1
bc
a
2
a
1
a
3
E
M
Figure 4.10 Isoprofit curves and the derivation of a reaction curve. An isoprofit curve for England
connects all combinations of Dutch and English output that yield the same level of
English profit. If Dutch output is given at D
1
, English profits are higher at a
2
than at b or
c, and therefore a
2
is the English firm’s profit-maximizing level of output. The English
reaction curve is given by finding the English profit-maximizing output, which occurs at
the peak of an isoprofit curve, for each level of Dutch output.
a
1
or a larger amount at a
3
implies a lower level of profits. That level of profits is also what
the English firm earns at a
2
, where it is no longer a monopolist. In fact, if Dutch output is
given by D
1
, then a
2
represents the English firm’s best output choice. Any other level of
English output, such as at point b or point c, lies on a lower isoprofit curve further away
from the maximum attained at E
M
. Other points along the English reaction curve are derived
by this same process of determining the highest isoprofit curve that can be attained for
a given level of Dutch output. If the English firm expects Dutch output to remain constant
irrespective of its own choice of output, its profit-maximizing output choice will be given
by a point along its reaction curve. Note, however, that as Dutch output rises, the English
firm does not reduce output by a comparable amount to restore the initial price. That
response would not maximize the firm’s own profits because it would not be the sole
beneficiary of a price increase. The Dutch firm also would reap part of the benefit from a
higher price. Therefore, any rise in Dutch output exceeds the reduction in English output,
as indicated by the steeper slope of the English reaction curve and the smaller English
response. As we noted in the text, total output of the duopolists exceeds the output of a
monopolist.
Economists also have analyzed the competition between duopolists when they compete
on the basis of the prices they set, not the quantities they produce. If one firm sets its price
assuming that the price of the other firm will remain constant, we can derive a reaction curve
similar to the situation shown for quantity choices. If the two firms produce identical
goods, competition based on prices will result in a perfectly competitive solution where price
equals marginal cost. In such a setting the implications for potential government policy
intervention can be quite different from in the Cournot case of quantity competition.
Notes
1 Ronald Gilson, “The Legal Infrastructure of High Technology Industrial Districts: Silicon
Valley, Route 128, and Covenants Not to Compete,” unpublished paper (Columbia University,
1998).
2 Raymond Vernon, “International Investment and International Trade in the Product Cycle,”
Quarterly Journal of Economics 80, May 1966, pp. 190–207.
3 See William Gruber, Dileep Mehta, and Raymond Vernon, “The R and D Factor in International
Trade and Investment of United States Industries,” Journal of Political Economy 75, February 1967,
pp. 20–37, and Robert Baldwin, “Determinants of the Commodity Structure of US Trade,”
American Economic Review 61, no. 1, March 1971, pp. 126–46.
4 “Fuel Cells Hit the Road,” The Economist, April 24, 1999, p. 77.
5 Staffan B. Linder, An Essay on Trade and Transformation (New York: Wiley, 1961).
6 James Harrigan, “Openness to Trade in Manufactures in the OECD,” Journal of International
Economics 40, 1996, pp. 23–39.
7 D.J. Daly, B.A. Keys, and E.J. Spence, Scale and Specialization in Canadian Manufacturing, Economic
Council of Canada, Staff Study No. 21 (Ottawa: Queen’s Printer, 1968).
8 Douglas Irwin and Peter Klenow, “Learning-by-Doing Spillovers in the Semiconductor Industry,”
Journal of Political Economy 102, no. 6, 1994, pp. 1200–27.
9 See Hal Varian, Intermediate Microeconomics (New York: W.W. Norton, 1987), for a thorough
treatment of alternative oligopoly models.
10 Augustin Cournot, Researches into the Mathematical Principles of the Theory of Wealth (New York:
Macmillan, 1838).
11 Douglas Irwin, “Mercantilism as Strategic Trade Policy: The Anglo–Dutch Rivalry for the East
India Trade,” Journal of Political Economy 99, no. 6, 1991, pp. 1296–314.
12 Heinrich von Stackelberg, Marktform und Gleichgewicht (Vienna and Berlin: J. Springer,
1934).
13 David Landes, The Wealth and Poverty of Nations (New York: W.W. Norton, 1998).
4 – Trade between similar countries 107