International economics 6th edition phần 5 ppsx
Bạn đang xem bản rút gọn của tài liệu. Xem và tải ngay bản đầy đủ của tài liệu tại đây (269.37 KB, 54 trang )
elements of domestic policy that national legislatures have typically controlled. In order to
avoid the experience of the unsuccessful side-agreement in the Kennedy Round, drafters of
the US 1974 Trade Act devised a procedure called “fast track.” This procedure specified that
a bill to approve agreements on nontariff measures could not be amended once introduced,
that it would be reported out of committee within a specified time limit, and that floor debate
would be limited. This procedure worked remarkably well in 1979 for the bill implementing
the Tokyo Round. Given that successful precedent, Canada insisted that the fast-track
procedure apply to the Canada–US Free Trade Agreement.
11
The Tokyo Round addressed NTBs through separate codes and agreements in several
areas: subsidies, technical barriers to trade; import licensing procedures; government
procurement; customs valuation; and dumping. Not all countries signed these codes, and
they were not automatically administered through the same dispute resolution mechanism
as the tariff agreement. The reliance on codes and their potentially limited applicability
across countries raised the fear of a GATT à la carte, where countries could pick and choose
what provisions to accept. The subsequent Uruguay Round sought to avoid that outcome.
The principle of preferential tariff treatment for imports from developing countries was
adopted in the Tokyo Round. The rationale for this approach is a variant of the infant-
industry argument. The US Generalized System of Preferences (GSP) grants duty-free
entry for imports of goods on an approved list, but it imposes a number of restrictions and
qualifications on developing countries. Many commodities were excluded from the list,
especially where imports already threatened to injure domestic producers (eg. textiles, steel,
footwear, glass, and watches). Also, the tariff preference was denied to any developing
country that supplied 50 percent or more of total US imports of a given article, or that sup-
plied more than $30 million worth of the article. As a result, only about 12 percent of the
exports of developing countries to the United States qualified for GSP treatment. European
coverage under the Lomé Convention was similar in magnitude.
The Uruguay Round
This round, which took over 7 years to complete, was by far the most difficult to conclude
and almost failed. Negotiations began in 1986, were suspended in 1990 and 1992 due to an
impasse over agricultural provisions, and finally were completed on 15 December 1993, the
day that US fast-track negotiating authority was to end. The round was more difficult than
its predecessors because tariffs had already been reduced to very low levels. Nontariff barriers
were the dominant remaining issue, but these were less easily quantified and it was much
8 – Commercial policy 191
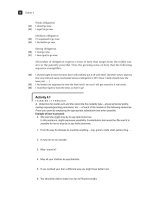
Table 8.1 Average tariff rates in selected economies
Tariffs on industrial products (percent)
Before Tokyo After Tokyo Reduction
Round Round
European Community 6.6 4.7 29
Japan 5.5 2.8 49
US 6.4 4.4 31
All industrial countries 7.1 4.7 34
Source: International Monetary Fund, Developments in International Trade Policy, Occasional Paper no. 16, 1982.
harder to reach an acceptable balance of concessions. Although further tariff cuts were a goal
of this round, other important issues included:
1 Agricultural trade and subsidies. Most developed countries subsidize agricultural prices,
making free trade very improbable. The European Union maintains very high support
prices under the Common Agricultural Policy and produces large surpluses. These
commodities are sold at very low prices in export markets, reducing prices received by
Australia, Canada, and other countries with a comparative advantage in farm products.
The United States and other agricultural exporters wanted tight limits on the ability of
the European Union to subsidize production and exports, a goal that France strongly
opposed.
2 Textiles and garments. The Multi-Fibre Agreement had become an exceedingly complex
web of product- and country-specific quotas that limit sales of products where devel-
oping countries have a comparative advantage. It discriminated against countries that
received small quotas (such as India) and provided large monopoly rents to the large-
quota holders (such as Hong Kong and Korea). Garment and textile producers in
industrialized countries strongly opposed a move away from quotas to tariffs.
3 Intellectual property. Several industrialized countries wanted stronger protection for
patents, copyrights, and trademarks.
4 Services. Purchases by foreigners of banking, insurance, medical care, education,
telecommunications, tourism, and other services have grown rapidly in recent years.
The United States, which tends to have a comparative advantage in many of these
services, wanted barriers to its exports of such services to be reduced, although it was
much less anxious to liberalize construction or transportation.
5 Dispute resolution and US unilateralism. During the 1980s the United States became
increasingly frustrated with the GATT dispute resolution mechanism. The GATT
procedures had evolved over time and reflected two different motivations, one that they
provide a clear basis for rule-based trade, and another that they facilitate negotiation
between disputing members. Referring a dispute to a panel of three or five experts to
rule on the compatibility of a country’s practices with its GATT obligations addresses
the first view. Requiring that contracting parties adopt any report by consensus
(a unanimous vote) reflects the second view. The European Union particularly felt
that some issues were of such central importance, such as the operation of its Common
Agricultural Policy, that entrusting the outcome to a panel of outsiders was unsatis-
factory. In spite of considerable US delay in bringing some of its own practices into
compliance after unfavorable GATT rulings, the United States sought a dispute
resolution mechanism with more teeth in it.
The United States unilaterally initiated actions under its own trade laws against foreign
trade practices it regarded as unfair but which were not adequately addressed by the GATT.
These Section 301 proceedings (a reference to the section of the Trade Act of 1974 under
which they were taken), together with US administration of its dumping and countervailing
duty laws, were sources of considerable dissatisfaction among US trading partners. Foreign
countries, including allies such as Canada, viewed the US procedures as biased toward a
finding of guilt, extremely expensive to defend against for foreign firms, and generally
threatening to open trade. These countries wanted GATT-enforced rules that would limit
the ability of the US government to unilaterally determine appropriate trade remedies.
This agenda was a challenging one, almost too challenging, as demonstrated by the
192 International economics
breakdown of talks at various points. Regional trade groupings looked more and more
attractive to stymied negotiators. With the deadline for the US government’s loss of its
negotiating authority approaching, the participants produced an agreement at almost the
last possible moment. Although not all goals were met, it was a surprisingly successful
outcome, given the difficulty of the issues.
12
The major accomplishments of the Uruguay
Round can be summarized as follows:
1 Tariffs. Industrialized countries reduced tariffs on manufactured goods by over one-third,
with over 40 percent of such goods to enter without tariff.
2 Agriculture. Subsidies of exports and import barriers were cut significantly over 6 years.
Domestic farm supports, which generate the surpluses that become a problem, were
decreased by 20 percent. Subsidized exports were cut by 36 percent in value. Japan and
Korea agreed to some opening of their rice markets. Countries converted their
8 – Commercial policy 193
Box 8.1 Tariff bindings and applied tariffs
Agreements to reduce tariff rates multilaterally have been central to GATT
negotiations since 1947. Also important has been the effort to encourage each country
to bind its existing tariffs at maximum rates that cannot be exceeded without
consulting with its trading partners, should a country choose to alter its trade policy in
the future. Binding creates predictability in the world trading system and warrants
greater investment to serve the world market. The Uruguay Round resulted in a
substantial increase in the extent to which countries bound their tariffs, especially
developing countries.
The figures shown demonstrate that tariffs in industrialized countries generally are
much lower than in developing countries, but many developing countries have
accepted the rationale for making tariff bindings. Those countries illustrate the pattern
of binding tariffs at rates much higher than the rates actually applied. (More generally,
for industrial goods, Latin American bindings were three times the applied rates, and
in South-East Asia the corresponding ratio was 2.5.) Nevertheless, bindings represent
a useful step in ensuring that trade liberalization is permanent.
Table 8.2 Tariff bindings and applied tariffs
Simple average bound rates Simple average applied rates
Share of Agricultural Industrial Agricultural Industrial
bound lines
European Union (2002) 100.0 16.3 4.0 16.3 4.1
Japan (FY 2002) 98.7 26.5 3.8 26.5 3.9
United States (2001) 100.0 8.1 4.0 8.1 4.4
South Africa (2001) 95.7 46.8 18.1 11.3 10.9
Brazil (2000) 100.0 35.9 29.6 12.9 13.8
Bangladesh (1999) 0.9 195.2 50.0 25.1 21.9
India (2001) 68.2 115.7 36.2 41.7 31.0
Source: WTO, 2002, p. 7–8.
quantitative restrictions to tariffs and guaranteed at least as much market access as
existed prior to the agreement; this gave rise to the tariff rate quotas discussed in
Chapter 5. Tariffs on tropical agricultural products, which largely come from developing
countries, were cut by 40 percent.
3 Textiles and garments. The Multi-Fibre Arrangement quotas were to be phased out over
10 years and tariffs to be reduced. The phase-out of quotas, however, is “back-end
loaded,” so an important part of the liberalization does not occur until 2005.
4 Intellectual property. The Agreement on Trade Related Aspects of Intellectual Property
Rights (TRIPS) was established as part of the WTO. Developing countries agreed to
much stricter protection for intellectual property. Patents for products and processes are
to be provided for 20 years from the filing of an application. Copyright protection of
music, literature, computer programs, and computer chip designs, among other items, is
to be provided. Even geographic indications are protected: thus, if a cheese carries the
name of a French region, it must come from that region of France.
5 Services. The General Agreement on Trade in Services (GATS) was established as part
of the WTO. Less was accomplished in the services area, particularly financial services
and telecommunications. Subsequently, in 1997, agreements were reached in these two
areas, a somewhat surprising result because any potential disadvantages arising from these
concessions were not balanced by favorable benefits in some other agreement. Perhaps
the important role played by an adequate financial and communications infrastructure
in producing other goods provided enough incentive for progress to be made.
6 Dispute resolution and US unilateralism. The World Trade Organization was established
as the successor to the GATT, and a stronger basis for dispute resolution procedures was
established. Panel reports are automatically approved unless appealed to a newly created
Appellate Body. Its findings are adopted automatically unless there is consensus not to
do so. Although offending countries cannot be forced by the WTO to bring their
practices into compliance, the complaining country may be granted the right to
retaliate. Voluntary export restraints are now illegal, but any limits on antidumping
actions were minor.
7 Limitations on trade-related investment measures (TRIMs). Many multinational corpora-
tions that operate in developing countries are required by host governments to export
a minimum percentage of their production or to refrain from importing parts and
components. Such laws distort trade flows away from efficient patterns and harm the
trade performance of developed countries. The Uruguay Round resulted in domestic
content requirements or trade balance requirements being prohibited, but export
performance requirements still are allowed. The United States was disappointed
over the lack of progress with respect to other TRIMs, such as technology transfer
requirements and the right to repatriate profits. Negotiations under the auspices of the
Organization for Economic Cooperation and Development, a group of largely higher-
income countries, were initiated in 1995 under the label Multilateral Agreement on
Investment (MAI). An agreement seemed more likely among countries with similar
interests. Nevertheless, these talks broke down in 1998, due to objections raised over
potential infringement of an individual country’s ability to deal with environmental
degradation, food safety, cultural diversity, and social cohesion.
13
A key aspect of the Uruguay Round was its treatment of the various agreements under the
World Trade Organization as a single package. Countries did not have the opportunity to
pick and choose what sections to accept. Because countries did not expect a favorable
194 International economics
balance of concessions in every group, but rather gains in one area could offset losses in
another, a much more ambitious agreement was reached. After almost collapsing, the
Uruguay Round turned out to be a far greater success than had been expected.
8 – Commercial policy 195
Box 8.2 WTO dispute resolution and the banana war
In 1999 the European Union and the United States had severe disagreements over
several trade issues, including bananas, beef, and biotechnology. The value of trade
involved did not seem to explain very well the intensity of the rhetoric from each side,
and the difficulty in resolving the least significant one, the banana dispute, was not a
good omen for the future operation of the dispute resolution mechanism.
The EU banana regime adopted in 1993 extended to the EU market prior British
and French preferences for bananas from former colonies in Africa, the Caribbean, and
the Pacific. Those sources were to be guaranteed 30 percent of the EU market.
Europeans were reluctant to reopen this issue, which effectively passed the cost of
supporting high banana prices on to other European partners. The change in policy
harmed more efficient Latin American producers who previously supplied the EU
market, as well as US distributors who handled those bananas. The World Bank judged
the policy to be a highly inefficient way of aiding the Caribbean states and
recommended a more generous development program.
In May 1993 a GATT panel ruled against the EC banana regime, but under GATT
rules that required panel reports to be adopted by consensus, the EC was able to block
adoption of the report. The EC issued new regulations in July, which it claimed met its
GATT obligations. In January 1994 a GATT panel ruled against this regime as well,
and the EC again blocked the adoption of the report by the GATT council. With the
formation of the WTO, panel reports could no longer be blocked by the offending
party. A 1997 panel found that the EU banana regime violated both the GATT and
the GATS. The EU appealed against these findings to the WTO Appellate Body,
which upheld the panel ruling. Efforts to negotiate a settlement were not fruitful, and
in 1998 the EU announced modifications to the banana regime that it claimed were
WTO-consistent. The EU blocked reconvening the WTO panel in the fall of 1998 and
the US announced retaliatory steps. Eventually, the panel was reconvened, and yet
again it ruled against the EU program.
In April 1999 WTO arbitrators ruled that the US could impose retaliatory trade
measures that affected $191 million of imports from the EU. Items selected by the US
included handbags, paper, bed linen, and coffee makers, although some lawmakers
favored a rotating retaliation list, to create maximum political pressure for a
settlement.
14
In fact, a successful compromise between the US and the EU was reached in April
2001 to resolve this dispute. At the time observers hoped that was a good omen for
more amiable trade relations between the two. The goodwill seemed to evaporate
quickly, however, as additional disputes arose over US export subsidies and steel
safeguards. Latin-American banana exporters conditioned their acceptance of a WTO
waiver for an EU–Africa, Caribbean and Pacific Economic Partnership upon good faith
implementation of the banana accord.
Nevertheless, the success of the agreement will depend upon the way individual countries
implement their commitments and the way they use WTO procedures. If member countries
treat WTO procedures as a forum to handle minor disputes, but rely on bilateral negotiations
to deal with major issues, the tension between rule of law and rule of negotiating power will
remain.
There has been considerable use of the WTO dispute resolution procedures. As of July
2002 the number of requests for consultation had been 261. The major complainants were
the United States (71) and the EU (57), although developing countries brought 93
complaints. Early examples of panel rulings favorable to developing countries, as were made
in the case of US restrictions on underwear imports from Costa Rica, wool shirts from India
and reformulated gasoline from Brazil and Venezuela, demonstrate the advantages of a rule-
based system to smaller countries. The goal of dispute resolution is that countries bring their
practices into conformity with WTO obligations, but in cases where insufficient adjustments
were made, retaliation was authorized: the EU ban on hormone-treated beef imports, the EU
banana import regime, Brazilian export financing of aircraft, and US export subsidies
provided through its tax code.
15
Table 8.3 lists dispute settlement cases initiated in 2002 to
indicate the breadth of complaints brought to the WTO.
196 International economics
Table 8.3 Cases brought for WTO dispute resolution in 2002
Respondent Issue Complainant
Canada Exports of wheat and treatment of imported grain US
Venezuela Import licensing on certain agricultural products US
US Safeguards on imports of steel products Chinese Taipei
Korea Trade in commercial vessels EC
Peru Antidumping duties on vegetable oils Argentina
Australia Importation of fresh pineapple Philippines
Australia Importation of fresh fruit and vegetables Philippines
EC Customs classification of frozen boneless chicken Brazil
US Antidumping measures, oil country tubular goods Argentina
US Subsidies on upland cotton Brazil
EC Export subsidies on sugar Brazil, Australia
US Antidumping measures, softwood lumber Canada
EC Imports of wine Argentina
US Antidumping and countervailing duties, steel products France, Germany
Uruguay Tax treatment on certain products Chile
EC Safeguards on imports of steel products US
US Safeguards on imports of steel products Brazil, New Zealand
US Countervailing duties, softwood lumber Canada
Turkey Import ban on pet food Hungary
Peru Tax treatment on certain imported products Chile
US Safeguards on imports of steel products Norway, Switzerland,
China, Korea
US Excise taxes by Florida on orange and grapefruit products Brazil
US Safeguards on imports of steel products Japan, EC
US Antidumping duties, softwood lumber Canada
EC Conditions for granting tariff preferences to developing
countries India
Japan Importation of apples US
US Antidumping duties, carbon steel flat products Japan
US Rules of origin for textiles and apparel products India
Source: www.wto.org/english/tratop_e/dispu_e/dispu_status_e.htm (January 1, 2003).
Intellectual property
The treatment of intellectual property rights under the WTO has proven particularly
contentious. Developed countries have a comparative advantage in research-and-
development intensive industries, and they benefit from the monopoly profits earned before
their technology becomes widely available in other countries. As a consequence, developed
countries were strong advocates of the TRIPs agreement. Prior to the step, the United States
had taken action unilaterally under provisions of the 1988 Omnibus Trade Act to retaliate
against the exports of countries whose governments did not make reasonable efforts to
enforce US patents and copyrights within their borders. China particularly was seen as a
flagrant violator.
8 – Commercial policy 197
Box 8.3 Pharmaceutical flip flops and the TRIPS agreement
The Uruguay Round TRIPs Agreement stipulated that members provide patent
protection for pharmaceutical products, among its various provisions. While copyrights
and patents for other products were important, the economic value of pharmaceutical
patents is particularly high. At the same time, poor countries reliant on foreign
technology are concerned that their failure to gain access to patented medicines at low
prices will cost human lives. The tension between these two points of view explains
some ambiguities in the agreement over the flexibility of countries to take measures to
protect public health.
Just as the textile agreement phased in slowly over time, developing and transition
economies were given 5 years, and least developed countries 11 years, to fulfill this
commitment. Over that time-frame, however, discussion changed substantially due to
the AIDS epidemic and high rates of HIV infection in many developing countries, who
could not afford to pay the high price of treatment in industrialized countries. Protests
in favor of compulsory licensing for HIV drugs occurred in Thailand and South Africa.
An Indian generic drug producer offered to sell HIV drugs at a 90 percent discount from
prices in industrialized countries. Brazil produced its own copies of several of these
drugs, and its expenditures per AIDS patient were roughly one-third of the $12,000
annual expense in the United States. As Brazil succeeded in containing the spread of
the virus and cutting its AIDS-related deaths by 50 percent, its program was viewed as
a model for other middle-income countries to follow.
16
For countries that had no
indigenous generic producers, that raised a further trade issue regarding the rights of
such countries to import drugs from producers that had no assent from the patent
holders.
Yet, if pharmaceuticals could be freely exported and imported by any country,
including the United States, what would happen to the ability of drug firms to price
discriminate and charge high prices in the US market where there was a higher ability
and willingness to pay? Without these high-priced sales, the return to innovation
of new drugs would be much lower, and many fewer life-saving remedies would be
developed.
Discourse on this topic further changed with the terrorist attacks on the United
States and a subsequent scare over an anthrax epidemic in 2001. The US Secretary for
Health and Welfare demanded a lower price from the makers of Cipro, a powerful
antibiotic, to be able to address this emergency. Many developing countries noted that
Although the loss of profits to firms that innovate makes the issue of copying appear to
be just a matter of transferring funds from the North to the South, the world as a whole has
a wider interest in ensuring that innovation continues to occur in the future. Stricter
enforcement of patents and copyrights allows higher returns to be earned by the creators of
existing literary and musical innovative works, new products, and more efficient production
processes. Those profits also provide an incentive for future innovation and result in greater
willingness to finance current research and creative activity. Thus, intellectual property
protection affects the speed at which science and technology advance.
Developing countries often have weak regimes to protect intellectual property, because
that effort drains funds and skilled personnel away from alternative uses that directly benefit
their residents rather than foreign copyright and patent holders. Charles Dickens com-
plained of weak US copyright protection in the nineteenth century, and in a similar vein
developing countries see little direct benefit from stricter enforcement today. Rather they
expect to gain from free riding on the efforts of others to promote innovation. While
that strategy may mean that few products are developed that primarily benefit developing
countries, in the case of products aimed at a worldwide market developing countries may
take little action in the absence of external pressure.
What is the effect on world welfare of enforcing rules to extract greater payments for
innovators of new products? To answer that question economists need to know whether too
little research is carried on presently, a likely outcome when much of the benefit from an
innovation spills over to others. They also must judge whether granting monopoly power to
an innovator for a 20-year period, the patent life agreed to in the Uruguay Round, is a
reasonable rule of thumb. Does it appropriately balance the payoff from future innovation
against the welfare loss that comes from charging monopoly prices that far exceed marginal
costs of production? In turn, that requires assessing how productive is another dollar spent
on research in generating new ideas, and how great will the incentive be for a monopolist
to introduce a new product that undercuts demand for one of its existing products.
The Uruguay Round agreement represents a judgment that the world is underinvesting in
research and development, and that promoting more research effort will lead to higher
standards of living. Not all countries necessarily gain from stricter enforcement of intel-
lectual property rights, which suggests why trying to reach agreement on this issue outside
of a round where several other items are considered at the same time is unlikely to be
successful. From a world perspective, even coming up with an ideally designed policy may
founder because of difficulties in enforcing any agreement.
198 International economics
AIDS, tuberculosis, and malaria constituted public health emergencies in their
countries, and their demands for lower prices or compulsory licensing agreements were
comparable. The issue became a major element of the Doha Development Agenda
established at the November 2001 ministerial meeting to launch a new round of trade
talks. Least developed countries were given until 2016 to provide patents for
pharmaceutical products. The Doha Round will attempt to clarify what circumstances
constitute national emergencies that warrant compulsory licensing or under what
conditions the initial producer can control trade in drugs after their original sale. (The
latter issue covers “parallel imports”; to be effective, price discrimination strategies rely
upon control over parallel imports.) Related issues to address include the treatment of
traditional knowledge and folklore.
The rocky road to further multilateral agreements
Although the Uruguay Round broke ground in many new areas, it merely marked the status
quo in some of them and therefore most countries anticipated a subsequent round of nego-
tiations to address this unfinished business. For example, the commitment to convert quotas
on agricultural imports into tariffs resulted in countries imposing extremely high tariffs, over
1000 percent in the case of rice in Japan. The Uruguay Round mandated that negotiations
start no later than 2000 to ensure that improved agricultural market access was accom-
plished. Similarly, in the service area countries made commitments in some sectors, but the
Uruguay Round more nearly represented a stand still on further restrictions, not a major
opening.
The expectations of initiating another round were not met at the ministerial meeting at
Seattle in November 1999. Prior to the meeting wide gaps in country positions still existed,
and further pressures were created by the protests of industrial country labor unions,
environmental activists, and other antiglobalization forces. Complaints were raised over
secrecy and the decision-making processes within the WTO. US and EU representatives
talked of the need to incorporate labor rights and environmental protection into the WTO,
while many developing countries saw these as code words to limit their potential exports.
Subsequent bilateral agreements, such as the Canadian–Chilean or US–Jordanian free trade
agreements, have addressed those topics, but no clear basis for broader action exists.
In 1998 the International Labor Organization declared that all 175 members had an
obligation to promote four fundamental rights by guaranteeing: (1) freedom of association
and the right to collective bargaining; (2) elimination of all forms of forced labor; (3)
effective abolition of child labor; and (4) elimination of discrimination in employment.
17
Yet, there is little agreement on what these provisions reasonably require, or whether
they necessarily make workers better off in a world with imperfect capital markets and the
inability to borrow against future earnings. Labor interests in industrialized countries have
seen the ILO as ineffective in ensuring adherence to these standards, and therefore they
have pushed for inclusion of this issue in trade agreements where a stronger dispute
resolution mechanism is available.
Various European and North American groups have promoted “fair trade” movements to
ensure that production in developing countries does not exploit workers or the environment.
For example, some attempt to certify that rugs are produced without child labor or that a
higher price is paid to small, organic producers of cocoa or coffee. Anti-sweatshop activists
object to working conditions in the apparel and footwear industries, and they attempt to
pressure brand name producers like Nike to subcontract only with companies that meet
basic health, safety, and human rights standards. Advocates of these changes claim that few
jobs will be lost, because any increase in costs will come primarily at the expense of profits,
especially in quota-constrained apparel markets. Many developing countries, however, fear
that their jobs are at risk, and correspondingly that their opportunity to take the first step
toward industrialization and away from low productivity agriculture or undesirable activities
such as prostitution will be blocked.
In the case of environmental issues, activists are particularly alarmed that the WTO
dispute resolution bodies will allow trade rules to dominate the provisions of domestic
legislation and international environmental agreements. Examples of those concerns are
discussed in Chapter 11.
8 – Commercial policy 199
The Doha Development Agenda
After the pronounced failure of WTO members to agree upon an agenda for further multi-
lateral trade negotiations at the Seattle ministerial meeting of 1999, a new round of multi-
lateral trade negotiations was initiated at the WTO’s fourth ministerial conference in
Doha, Qatar in November 2001. Developing countries were skeptical of participating
in such a round, because they claimed that few concrete benefits to them had emerged
from the Uruguay Round. Therefore, industrialized nations made a major effort to ensure
that concerns of developing countries would be addressed more directly through the Doha
Development Agenda. Again, the goal is to establish a single agreement covering several
areas.
Because 70 percent of poor country exports are in agriculture and textiles and apparel,
progress in these two areas is a priority.
18
Continued negotiations in agriculture were man-
dated by the Uruguay Round Agreement to begin in 2000, but the political sensitivity of
agricultural tariff rates, export subsidies and domestic supports in the EU may limit progress
here. Japanese and European negotiators sought a broader agenda including environmental
issues and competition policy, perhaps to be able to demonstrate new areas where their
interests were addressed or perhaps to slow down the entire negotiating process. With respect
to textiles and apparel, the United States found this a particularly sensitive area, especially
given promises made by the Bush Administration to gain fast-track trade negotiating
authority. Many peak rates in the US tariff schedule occur in this sector, and therefore major
reductions in these barriers may be difficult to achieve.
Several important items are to be addressed which include the following:
• implementation of WTO commitments by developing countries;
• tariffs on nonagricultural goods, including the peak rates mentioned above;
• TRIPs, especially public health concerns as discussed in Box 8.2;
• antidumping and subsidies disciplines, with particular reference to fisheries;
• regional trade agreements and determination of their compatibility with WTO
standards;
• the relationship between multilateral environmental agreements and WTO rules; and
• services, an area where further negotiations also were mandated by the Uruguay Round
to begin in 2000.
Working groups were to develop proposals that might be included in the single package,
as determined at the fifth ministerial conference in 2003: TRIMs; the interaction of trade
and competition policy; and transparency in government procurement.
Expanding the World Trade Organization
Chinese Taipei (Taiwan) became the 144th member of the WTO on 1 January 2002.
Several additional countries are in the process of negotiating accession to the WTO, and
their entry will require further attention to the unwieldy nature of decision-making in
such a large organization. The entry of China and the prospective entry of Russia and other
former communist states pose a particular challenge, due to their limited historical reliance
on market institutions.
Other nonmarket economies are WTO members, but their smaller size means that their
actions have limited impact on producers in other countries or on international prices. In
the case of Russia and China that is far from true. Determining whether the prices of goods
200 International economics
they export reflect opportunity costs of production or government subsidies is not possible.
Judging whether imports can freely enter a country and then benefit from national treatment
is difficult when purchasers and competitors are state enterprises that do not face budget
constraints. The swelling Chinese trade surplus overstates its general acceptance of a market-
oriented economic system, because such production typically occurs in export-processing
zones where any output must be exported rather than sold in domestic markets. Pervasive
8 – Commercial policy 201
Box 8.4 Who’s afraid of China?
After a lengthy process of negotiating to join the World Trade Organization, China
became a member on 1 December 2001. Although all countries had to approve China’s
membership, some of the most contentious bilateral talks occurred with the EU and
with the US. In addition to the access they sought to Chinese markets for goods
and services, both were concerned about a potential flood of products from China.
In particular, worries abounded that in sectors where state-owned enterprises still
dominated production, trade would be determined by government preferences and
priorities, not by comparative advantage or market forces. Organized labor in the
United States vehemently opposed Chinese entry, as it feared that competition with
such a labor-abundant country would drive down US wages.
On the one hand, developing countries expected some benefit from having the
strong voice of a powerful developing country in the WTO. On the other hand, devel-
oping countries were worried because they saw themselves competing much more
directly with Chinese goods. Other Asian countries particularly feared China as an
alternative site for foreign direct investment in export-oriented industries. As country-
specific quotas on textiles and apparel are removed, will countries such as Bangladesh
be able to export as many pants and shirts as in 2000? Will ASEAN countries find that
nearly all foreign investment in the region now flows to China?
Even a country as seemingly removed from the scene as Mexico was affected, and in
fact Mexico was the last country to assent to Chinese entry into the WTO. Was such
concern warranted? The rapid growth of the assembly industry in Mexico under
NAFTA was adversely affected by the US economic slowdown in 2001, as was US
trade with China. In 2002, however, after China’s accession to the WTO, US imports
from China rose by $20 billion or 20 percent, while imports from Mexico only rose
2 percent. The two countries do not compete head to head in all categories, but
Chinese expansion and Mexican contraction in several key assembly operations are
evident. In the three tariff categories for computers, office machinery, and calculators,
Chinese sales rose by $3.8 billion, or 40 percent, while Mexican sales fell by $1.4 billion
or 15 percent. A less dramatic pattern shows up in apparel, where Chinese sales rose
by $0.5 billion or 7 percent, while Mexican sales fell $0.5 billion or 6 percent.
Although this record also may reflect minor influences from exchange rate changes, the
Mexican forecast of trouble ahead appears to be accurate.
Furthermore, the difference in performance across different industry categories does
not seem to be related to the level of US tariff protection or the difference between the
most-favored-nation rate granted to WTO members and the rate applied to
nonmembers. The attraction of Chinese-based assembly seems to have risen due to the
greater perceived predictability and consistency of Chinese policy, now that it is a
WTO member.
reliance on quantitative controls to restrict the growth of imports and limited efforts to
enforce intellectual property rights suggests that substantial changes in Chinese trade
practices will be necessary to meet WTO standards. Similarly thorny issues arise in the case
of Russian accession.
Summary of key concepts
1 During the nineteenth century, Great Britain unilaterally adopted a policy of free trade,
which many other countries subsequently followed. This stance was a major contrast to
the state control of trade pursued in earlier centuries under mercantilism.
2 High tariffs adopted by the United States in 1930 contributed to a major reduction in
trade and production worldwide. In 1934, the United States began negotiating bilateral
trade agreements that reduced tariffs on a most-favored-nation basis.
3 The General Agreement on Tariffs and Trade, founded in 1947, established a set of rules
for international trade. It encouraged negotiations to reduce trade barriers on a
nondiscriminatory basis.
4 The Kennedy Round of trade negotiations, concluded in 1967, reduced tariffs under a
multilateral approach, which in general made across-the-board cuts.
5 The Tokyo Round, concluded in 1979, applied a formula to cut tariffs further, and in
separate codes it addressed several nontariff barriers to trade. Developing-country
participation in the round was limited.
6 The Uruguay Round, completed in 1994, covered several items that had escaped GATT
discipline (agriculture and textiles) and extended the agreement to include several new
areas (services, intellectual property, and investment requirements). The World Trade
Organization was established, and a more rigorous dispute resolution mechanism was
created. The agreement was treated as a single package that all members accepted
without the opportunity to make exceptions.
7 A major goal of the Doha Development Agenda initiated in 2001 is to ensure that
greater market access to highly protected sectors promised in the Uruguay Round
actually is achieved.
202 International economics
Questions for study and review
1 How is the objective of nondiscrimination achieved in GATT tariff agreements?
What are the two major exceptions that have been formally agreed on by GATT?
2 Does the growth of regional trading blocs warrant WTO encouragement? If groups
had an open membership policy would that be more desirable from a world
standpoint?
3 What is the most-favored-nation clause? How exactly does it work, and why is it
used in tariff agreements? How is it related to the concept of reciprocity?
4 If trade agreements consisted of several independent sections or codes that only
applied to countries that signed each code, how would that likely affect the extent
of liberalization of world trade?
Suggested further reading
For an excellent overview of GATT/WTO principles, see:
• Jackson, John H., The World Trading System, Law and Policy of International Economic
Relations, 2nd edn, Cambridge, MA: MIT Press, 1997.
For a contrasting overviews of the prospects for current multilateral trade negotiations and
ongoing globalization, see:
• Schott, Jeffrey, ed., The World Trading System: Challenges Ahead, Washington, DC:
Institute for International Economics, 1996.
• Raghavan, Chakravarthi, Recolonization: GATT, the Uruguay Round and the Third World,
Atlantic Highlands, NJ: Zed Books, 1990.
Notes
1 It should be added that the United States took the initiative in revising this treaty 75 years later.
The first revision graciously allowed Thailand to increase tariffs to 5 percent.
2 US Tariff Commission, Trade Barriers, Vol. 3 (Washington, DC: USTC, April 1974), Chapter
5.
3 Some observers claim this approach reflects an inappropriate mercantilistic focus, because it
implies that exports are a good thing and should be encouraged, whereas imports are harmful to a
country. See K. Bagwell and R. Staiger, “An Economic Theory of GATT,” American Economic
Review 89, no. 1, March 1999, pp. 215–48, for a defense of the focus on reciprocity as a means of
offsetting the incentive a country has to restrict trade in order to improve its terms of trade.
4 WTO, “Overview of Developments in the International Trading Environment,” (November 15,
2002), WT/TPR/OV/8 p. 10.
5 GATT, GATT in Action (Geneva, January 1952), pp. 20–1.
6 Douglas Irwin, “Changes in US Tariffs: The Role of Import Prices and Commercial Policies,”
American Economic Review 88, no. 4, September 1998, pp. 1015–26.
7 John Howard Jackson, The World Trading System: Law and Policy of International Economic Relations
(Cambridge, MA: MIT Press, 1989), pp. 131–41.
8 J.M. Finger, H. Keith Hall, and D. Nelson, “The Political Economy of Administered Protection,”
American Economic Review 72, 1982, pp. 452–66.
9 The actual formula used was proposed by the Swiss. It is:
8 – Commercial policy 203
5 The United States has encouraged foreign producers to adopt voluntary export
restraints and orderly marketing arrangements to reduce US imports and protect
domestic industries. Why has the WTO outlawed such agreements?
6 Why did the Uruguay Round almost fail in late 1990? Why was the United States
so forceful on the subject of EU agricultural subsidies? What countries might you
have expected to have been allied with the United States on this subject? Allied
with the EU on this subject? Why?
7 What countries would you expect to support the US position on intellectual
property within the WTO? Why?
8 How are trade disputes resolved within the WTO? If this rule-based approach to
trade policy were to break down, which countries would be most adversely
affected?
9 Should the WTO attempt to govern trade by nonmarket economies, or should a
different organization with a different set of rules be established to do that?
Tariff reduction = t/(t + 0.14), where t = the existing tariff rate. Thus a 40 percent existing
tariff would be cut by 0.40/(0.40 + 0.14) = 74 percent, whereas a 10 percent existing tariff
would be cut by 0.10/(0.10 + 0.14) = 42 percent.
10 Alan Deardorff and Robert Stern, “The Economic Effects of Complete Elimination of Post-Tokyo
Round Tariffs,” in William Cline, ed., Trade Policy in the 80s (Cambridge, MA: MIT Press, 1983).
11 Jackson, op. cit.
12 For a discussion of the contents of the Uruguay Round agreement, see the Economic Report of the
President: 1994 (Washington, DC: US Government Printing Office, 1994). For a more detailed
treatment of the agreement, see Jeffrey Schott, The Uruguay Round: An Assessment (Washington,
DC: Institute for International Economics, 1994).
13 See E. Graham, Fighting the Wrong Enemy (Washington, DC: Institute for International
Economics, 2000).
14 See Guy de Jonquières, “WTO Puts Skids under Banana Regime,” The Financial Times, March 20,
1997, p. 7, and “Trade Goes Bananas,” The Financial Times, January 26, 1999, p. 15, as well as
WTO, “Overview of the State-of-Play of WTO Disputes,” (May 5, 1999), />wto/dispute/bulletin/htm (May 25, 1997), and “At Daggers Drawn,” The Economist, May 8, 1999,
pp. 17–19.
15 WTO, op. cit., p. 38.
16 Miriam Jordan, “Brazil May Flout Trade Laws to keep AIDS Drugs Free for Patients,” Wall Street
Journal, February 12, 2001, p. B1, and United Nations, Human Development Report 2002, p. 106.
17 See Drusilla Brown, “Labor Standards: Where Do They Belong on the International Trade
Agenda?” Journal of Economic Perspectives 15 (Summer 2001) pp. 89–112, for further discussion of
these issues.
18 WTO, op. cit., p. 2
204 International economics
9 International mobility of labor
and capital
The previous chapters assume that goods are internationally mobile (i.e. that merchandise
trade occurs) but that factors of production are not mobile. The basis of Heckscher–Ohlin
trade is precisely that large differences in relative factor endowments produce parallel
differences in factor prices; these in turn lead to differences in relative goods prices, which
makes trade based on comparative advantage possible. A country with a relative abundance
of labor, for example, will have low wages, which will give it a comparative advantage in
labor-intensive goods such as apparel and shoes. The fact that differences in factor prices
exist prior to trade implies that labor and capital are internationally immobile; otherwise the
abundant factor in each country simply moves elsewhere to earn higher returns. Labor
will migrate to capital-abundant countries, and capital will move in the opposite direction,
roughly equalizing relative factor endowments and prices, thus eliminating the basis for
Heckscher–Ohlin trade.
Although the theory of international trade presented thus far assumes that factors
of production are immobile, in reality some labor and capital movement occurs between
countries. Labor migrates, legally or otherwise, from low- to higher-wage countries. Inter-
national capital flows seeking higher returns are a major element of international finance.
Of course, labor mobility is limited by immigration laws, transportation costs, lack of
information about job opportunities, and language differences. International investors
are deterred by different legal and regulatory environments, discriminatory taxes, potential
expropriation, incomplete information, and a variety of risks, including a decline in the
value of assets it holds that are denominated in foreign currencies. That latter topic is
addressed in Part Two of this book.
Learning objectives
By the end of this chapter you should be able to understand:
• how international capital flows reduce differences in returns across countries and
raise world output;
• how international flows of labor reduce differences in wages across countries but
may reduce per capita income in the host country;
• that a firm may have special expertise that it finds more profitable to exploit by
producing abroad (as a multinational corporation) rather than export from the
home country.
Nevertheless, there is sufficient mobility of capital and labor to warrant our attention. In
fact, some economists believe that migration of labor has had a bigger effect on the earnings
of low-skilled workers within developed countries than has imports of goods that use un-
skilled labor intensively.
1
As shown in Table 9.1, immigrants, as a share of the population
and particularly as a share of the work force, have risen in most of Europe and the United
States. While the peak rate of population growth due to immigration occurred in the
United States in 1900, at 1.2 percent annually, that rate has risen steadily since World War
II from less than 0.1 percent to 0.3 percent. Within Europe, Germany experienced rates
greater than 1.0 percent in the early 1990s due to the opening up of Eastern Europe.
2
With
respect to capital mobility, private capital flows to LDCs as a group are far larger than official
aid or multilateral assistance. Their distribution across countries is quite uneven, though,
and their volatility often raises concerns over the benefits they confer. Investment by multi-
national corporations often is linked to the flow of capital between countries, but generally
it has even more to do with the flow of ideas and technology between countries. Analyzing
the motivation for these various factor flows and assessing their consequences is the focus of
this chapter.
Arbitrage in labor and capital markets
The international migration of capital and labor can be viewed as an arbitraging process that
is similar to the movement that occurs between regions of a country. People living in low-
wage or high-unemployment areas of the United States, for example, move to states where
206 International economics
Table 9.1 The role of immigrants as a share of the population or work force
Country Share of population Share of labor force
1982 1993 1991 1999
Australia
8
20.6
3
22.7
3
24.8 24.6
Austria 4.0
4
7.1
4
8.9 9.5
Belgium 9.0
4
9.0 7.4 8.7
Canada
9
16.1 15.6
4
18.5
Denmark 2.0 3.6 2.5 2.5
Finland 0.3 1.1 1.2
France
9
6.8
2
6.3 6.2 6.1
Germany 7.6 8.5
5
8.9 8.7
Italy 0.6 1.7 3.6
Japan
7
0.7 1.1
4
0.9 1.0
Luxembourg 26.2
4
30.3 33.3 57.3
Netherlands 3.8
4
5.0 3.9 3.4
Norway 2.2 3.8
4
4.4 2.9
Spain 0.5
4
1.0 0.4 1.0
Sweden 4.9
4
5.7
4
5.5 4.1
Switzerland 14.4 18.1
4
20.1 18.1
United Kingdom
8
2.8 3.5 3.3 3.9
United States
91
4.7
2
7.9
2
9.3 11.7
1
1980 data.
2
1990 data.
3
1994 data.
4
1992 data.
5
Western Germany only.
6
Excludes unemployed.
7
Residence
permits.
8
Labor force survey.
9
Census data.
Source: Organization for Economic Cooperation and Development, Paris, OECD Observer, no. 192, February/
March 1995; Trends in International Migration, Paris, OECD, 2001.
wages and job opportunities are better. This movement reduces wage differentials by
reducing the supply of labor where wages are low and by increasing the number of people
seeking work in high-wage areas. Transportation costs, preferences for remaining in one’s
home region, and lack of information about job availability mean that this arbitraging pro-
cess is not perfect, for it does not produce a single wage across all parts of the United States.
It does, however, limit the range of wage differentials, because low-wage states consistently
lose working-age residents and higher-wage states gain them.
The international movement of workers reflects the same arbitraging process, except that
the barriers to migration are higher than in the case of domestic migration. Transportation
is more costly, information about job availability is harder to obtain, and differences in
language, culture, and even climate make preferences for remaining in one’s home country
stronger. These distinctions apply even within the European Union, in spite of the absence
of legal restrictions on movement within the EU. More generally, international migration
is restrained by national laws that limit entry to those the country chooses to accept.
In Chapter 3 the Heckscher–Ohlin framework led to the prediction that if free trade
prevailed, factor prices would become sufficiently similar to greatly reduce the pressure
for labor or capital migration. It is largely because merchandise trade is not costless or free
of restrictions that international differences in factor prices persist and thus create incentives
for migration. Heckscher–Ohlin trade and international factor mobility can then be viewed
as close substitutes in terms of both causes and effects. Both result from differences in factor
prices that reflect differences in relative factor endowments, and both would reduce or
eliminate those price differences. Either process would sharply narrow international differ-
entials in wage rates. If industrialized countries either had free trade or imposed no barriers
to people immigrating from abroad, domestic wage rates would fall and returns to capital and
land would rise.
3
This parallelism between Heckscher–Ohlin trade and factor mobility extends to politics.
Because the relatively scarce factor of production absorbs income losses from either free
trade or factor mobility, it tends to support both protectionism and strict limits on factor
movements, whereas the abundant factor of production gains from both processes, and
therefore favors free trade and more factor mobility. Within the United States the AFL-CIO
favors strict immigration laws and firm enforcement efforts for the same reason that it
supports protection. Both will maintain or increase US wage rates for less skilled workers. In
the early 1970s, American labor favored limits on the ability of US firms to move capital
abroad, and in the debate over NAFTA, labor predicted that runaway plants would be
attracted to Mexico by low wages and thereby reduce employment within the United States.
US farmers and owners of businesses, who want readily available low-wage labor, tend to
favor much less strict limits on immigration.
Formulating a model
To indicate the consequences of factor movements we consider a somewhat simpler model
than the H–O approach, which nevertheless yields many of the same insights. In Figure 9.1
we represent the utilization of capital in two economies that produce the same good.
Therefore, we cannot use this framework to show how trade is affected by factor flows. The
approach is quite useful, however, to show how factor mobility increases efficiency and total
output, which occurs because scarce productive assets move from less productive to more
productive locations and uses. Output should rise by the difference in marginal products
times the amount of the factor that moves. Rates of return, and therefore marginal products,
9 – Mobility of labour and capital 207
are equated through arbitrage. The marginal product of capital (MP
k
in the figure) is the
increase in total output that results from adding one unit of capital while holding inputs of
other factors unchanged. The marginal product lines slope down because of the law of
diminishing returns. That is, adding more capital to unchanged amounts of labor and land
reduces the marginal product of capital.
One way of thinking of capital mobility is in terms of an individual who owns a stock of
machines and chooses to lease them to firms that will use them in production. Airplanes,
railroad cars, and trucks are often leased in this way. When capital is mobile internationally,
the equipment can be leased to operators on either side of the border, but with immobile
capital, owners can only lease to operators on their own side of the border. Thus, in labeling
the vertical axis of Figure 9.1, we can think of the price reflecting the rental rate received
for the leased machines. Or we can express this return in percentage form as a share of the
value of the machine. That form may seem more familiar when we think of financial flows
across borders, which then allow borrowers to make investments in plant and equipment.
Our model applies to both situations. In this graph, the difference in interest rates, which
represent differences in the marginal productivity of capital, causes capital in the amount of
IJ to flow from the United States to Canada, where the inflow is represented as ab. As a
result, interest rates in Canada fall from r
CAN
to r′ while yields in the United States rise from
r
USA
to r′. Output in Canada rises by the area under the marginal product function, area
ecbad, whereas output in the United States falls by area FHIJK. The increase in total output,
which is the result of reallocating scarce capital to a more productive location, is the area
of the two triangles, dce and FGH. Canadians make interest payments to Americans in the
208 International economics
ab
d
e
c
GF
HK
N
M
r
′
L
IJ
r
CAN
r
USA
∆
r
USA
∆
r
CAN
∆
K
USA
∆
K
CAN
K
USA
E
USA
E
′
USA
E
CAN
MP
K
CAN
MP
K
USA
E'
CAN
r
K
CAN
0
Figure 9.1 Effects of US capital flow to Canada. With differing interest rates of r
CAN
in Canada and
r
USA
in the United States, an amount of capital E
USA
minus E ′
USA
moves from the United
States to Canada, bringing the interest rates of the two countries into equality at r ′ and
increasing the Canadian capital stock to E ′
CAN
. Rectangle abcd is the payment of interest
by Canada to US investors each year. Since Canadian output increases by area ecba, there
is a net gain for Canada of triangle dce. The United States loses output of FHIJK, but gains
interest income of IJFG, for a net gain of triangle FGH.
Source: Adapted from Peter B. Kenen, The International Economy, 2nd edn (Englewood Cliffs, NJ: Prentice Hall,
1989), p. 137.
amount of the rectangle abcd per year, which means that the net gain in income for Canada
is the triangle dce. The income received by American capitalists who invest in Canada,
given by rectangle abcd, also equals rectangle IJFG. Given the loss of US output of area
FHIJK when capital leaves the country, the net gain in income for the United States is
triangle FGH. Capital moves from less to more efficient uses, interest rates are arbitraged
together, and total income in both countries increases.
Sizable income redistribution effects exist, however. Canadian-owned capital (distance
Oa) was earning an interest rate of r
CAN
for a total income shown by the rectangle ONea.
As a result of the inflow of US funds, this yield falls to r′, which means total income of
Canadian-owned capital is now rectangle OMda, giving a loss of area MdeN. This income
is shifted to Canadian labor in the form of higher wages resulting from a higher capital-
to-labor ratio in Canada and a higher marginal product of Canadian labor. Canadian-owned
capital loses and labor gains. The same income redistribution process occurs in the United
States but in the opposite direction. US-owned capital was previously earning r
USA
for a total
income of rectangle OLHI. The increase of US interest rates to r′ means that American
capital that does not go to Canada gains rectangle LMFK. This income is extracted from
labor as US wages fall, due to a lower capital-to-labor ratio in the United States and a decline
in the marginal product of US labor. US capital gains and labor loses.
International factor mobility produces the same dilemmas as does free trade. Total output
and incomes clearly rise, but income is redistributed in ways that may be painful and
politically controversial. From the perspective of Canadian labor and US capital, the process
described here should be encouraged, but US workers and Canadian owners of capital
will have the opposite view. Political conflicts over immigration laws and policies affecting
international capital movements are likely to reflect these differing interests.
The influence of taxes and risk
Taxes can affect the conclusion that total incomes in both countries rise as a result of these
factor movements. The example above assumes that US capitalists lend money to Canadian
borrowers, and that the interest income is not subject to any Canadian tax. If instead
a Canadian tax is imposed, and as a result the Canadian government rather than the
US government taxes this income, the United States as a whole may lose from the capital
outflow.
Consider a situation where both countries impose a 40 percent income tax. If a US firm
invests domestically, let the pre-tax return be 10 percent. The net return to its investors is
only 6 percent, but the US Treasury gets 4 percent, which can be used for public pur-
poses. Suppose the pre-tax return in Canada is 12 percent. The after-tax return to a US
investor in Canada is 7.2 percent, but the US Treasury gets nothing because the 4.8 percent
collected in taxes goes to Ottawa, presuming that the United States offers a credit for the
Canadian tax paid. The total return to the United States is 7.2 percent, meaning a loss of
2.8 percent. World output rises by the 2 percent difference in gross yields, and the Canadian
government and US private investors certainly gain. However, the US government loses
4 percent of the investment income per year, and the American economy as a whole loses
2.8 percent. International capital flows do increase efficiency, as does a system of granting
foreign tax credits, but it is not clear that the flows benefit both the investing and the host
country.
The model above also has the implication that the flow of capital is in just one direction,
from a capital-abundant to a capital-scarce country. In reality, we often observe two-way
9 – Mobility of labour and capital 209
capital flows. When savers in one country choose to lend to borrowers in another country,
as when they buy a government or corporate bond, they clearly do respond to differences in
real rates of return across countries, all else being equal. They are most interested, however,
in the way a purchase of a bond in another country will affect the return to their total savings
or portfolio. Buying a bond that offers a lower rate of return can still make sense when it
reduces the riskiness of the portfolio, or the volatility of all returns received. If returns in
Japan rise exactly when returns in the United States fall, and vice versa, a Japanese saver’s
portfolio can yield the same return at a lower level of risk if it is diversified and includes US
bonds. Even though both the United States and Japan are capital-abundant countries,
capital may flow from Japan to the United States, and vice versa, as a result of these gains
from diversification. That topic is covered in Part Two. The model assumed in Figure 9.1
best applies to net flows of capital.
Our capital flow model abstracts from another aspect of capital mobility that was a feature
of the 1990s: financial instability. If lenders reassess the attractiveness of providing capital
to foreigners, the adjustment in the case of financial flows is not as simple as a leasing
company bringing its equipment home. Rather, the desire of lenders to withdraw funds may
require borrowers to sell assets that have few alternative uses. Over-reliance on short-term
debt to finance long-lived assets results in the borrower becoming particularly vulnerable to
unexpected bad news. Determining a firm’s appropriate financial strategy to avoid such
problems is another important topic in international finance.
Additional issues raised by labor mobility
The one-good model with capital flows represented in Figure 9.1 can be applied to the case
of labor mobility, too, if we assume that labor moves while capital remains fixed. Due to
changes in immigration laws in Australia, Canada, and the United States, the proportion
of immigrants from developing countries rose from 20 percent in 1960 to over 80 percent
in the 1990s. A less pronounced but similar trend has occurred in Europe.
4
Although recent
immigrants have more education than earlier immigrants, the level of education in host
countries has risen even faster. Thus, the gap between immigrant and native wages has
risen.
5
Nevertheless, higher wages in industrialized countries create a huge incentive to
move, legally or otherwise. It is becoming increasingly difficult for authorities in industrial-
ized countries to control their national borders. Many governments in developing countries
view emigration to industrialized countries as a safety valve for excess population pressures,
and therefore oppose attempts of the industrialized countries to tighten immigration
controls. A UN study estimates that restriction on migration from developing countries
reduces their income by $250 billion a year.
6
Even among developing countries, migration
occurs, as Indonesians migrate to Malaysia and Guatemalans migrate to Mexico. If high rates
of population growth continue in the developing world, this problem could prove extremely
difficult for industrialized countries and newly industrialized countries.
Although immigration into a labor-scarce country increases total income in the nation,
it does not necessarily increase per capita income, because the population grows. If the
immigrants are unskilled and bring little or no capital with them, they are likely to lower US
or European per capita output. Only if we do not count the new arrivals as part of the
population, and focus only on the original residents, is that issue avoided. While some defend
such a view on the grounds that the new arrivals must be better off or they would not have
come, most governments have to be concerned about the standard of living and eventual
integration of all who live within their borders.
210 International economics
The effect of such immigration on host-country output per person can be seen most easily
through a standard growth model:
Y = F (K, LB, LN)
where Y is gross domestic product, K is capital stock, LB is labor force, and LN is the stock
of land. This equation states that potential output is a positive function of the size of the
capital stock, the labor force and the availability of land. Technology determines the nature
of this function. Capital is defined as including education and training, which is often
referred to as “human capital.”
If the labor force is a constant proportion, a, of the population, then output per capita,
Y/c, can be expressed as:
Y/c = aF(K / LB, LN / LB)
where we have assumed constant returns to scale in production. This equation says that
output per capita is positively related to the capital-to-labor ratio and the land-to-labor ratio.
Output per capita will grow if the amount of capital per worker rises or if the amount of
land per worker increases. Improvements in technology also allow output per capita to rise.
Increases in the population of a country, without corresponding increases in the stocks of
capital and land, will cause GDP per capita to fall. This would not be true if a country were
underpopulated to the extent that useful land was idle or markets were too small to achieve
economies of scale, conditions we have excluded from the model. The United States may
have faced this situation during much of the nineteenth century, but certainly not today.
The arrival of large numbers of immigrants without significant amounts of financial or
human capital in Europe or the United States will reduce the capital-to-labor ratio and the
land-to-labor ratio, thereby decreasing wages and potential per capita GDP. In Europe,
where wages have been less flexible, the fear has been that immigrants will contribute to
a rising unemployment rate, and more people over whom to spread the same output.
European nations particularly have worried about the large influx of immigrants seeking
political asylum. The effects of emigration from labor-abundant countries such as Mexico or
Morocco are, of course, exactly opposite when unskilled labor leaves. Potential GDP per
capita increases with the reduced population and the increased capital-to-labor and land-to-
labor ratios. This explains the unavoidable conflict between the government of the United
States and the governments in Mexico City, Kingston, and San Salvador, or between
EU capitals and Algiers or Rabat. Developing countries want their citizens to have the
opportunity to seek employment in industrialized countries, and they may even view such
emigration as crucial for economic development. While total output would rise in the
industrialized countries, output per capita would not, and therefore it is not in their interest
to allow unlimited entry.
This prediction from the simple one-good model is more extreme than what the H–O
model suggests. In the latter case, an influx of unskilled labor leads to a shift in output toward
goods that require unskilled labor intensively, such as apparel. At unchanged prices, there
is no reason for wages to fall, because capital can be attracted out of capital-intensive sectors,
whose output will fall, to be reallocated to the expanding apparel sector; with no decline in
the capital-to-labor ratio, wages are not driven down. Because labor is more productive
in industrialized countries, however, the increase in their output of apparel will exceed the
decline in apparel output in the country the immigrants have left. Total apparel output will
rise and therefore we expect its price to decline. The wages of unskilled workers will fall, just
as we observed in the one-good model, because the value of their output declines. But, as
9 – Mobility of labour and capital 211
net importers of apparel, the industrialized countries will benefit from a decline in the price
of apparel. To determine the effect on income per capita we need more information to
predict how large this terms-of-trade gain may be.
In any case, an influx of immigrants can further affect welfare in the host country when
it leads to congestion in the use of public goods and services, such as roads, parks, and schools,
or greater demand for transfer payments to cover expenses of housing, food, and medical
care. The net fiscal balance from immigration depends upon taxes paid versus the extra
demands for services and transfers created.
When immigrants arrive with significant amounts of capital (financial or human), the
situation described above changes because the capital-to-labor ratio can rise rather than fall
with their arrival. That is why countries such as Canada maintain immigration preferences
for people who arrive with sufficient capital to start new businesses. Education and training
constitute the more typical form of capital that makes immigrants a potentially important
source of economic growth. The United States benefited enormously from the arrival of large
numbers of scientists and engineers fleeing Europe before World War II, as it is benefiting
today from the talented people migrating from a variety of developing countries. Scientists
from East and South Asia have become a major force in US high-technology industries.
In fact, gains to industrialized host countries pose a problem for many developing countries
similar to the example above, where capital moved from the United States to Canada and
US tax collections and US welfare fell even as world welfare rose. In this case, developing
countries lose significant tax revenue when a brain drain of highly skilled individuals occurs.
For example, nearly one-third of skilled Africans had moved to Europe as of 1987.
7
The
problem is compounded because much of the education of these individuals is paid for with
public funds. The benefits of providing more education simply spill over to the rest of the
world. Although some countries have imposed exit taxes on those emigrating, some com-
mentators instead call for payments by the wealthy host countries to compensate for this
loss of revenue. More recent trends suggest a circular flow of trained individuals, with some
acquiring experience and savings in industrialized host countries. Then they return home
and become successful entrepreneurs. Under those circumstances developing countries suffer
a short-run loss that may be offset by a long-run gain.
The unavoidable, if unpleasant, conclusion is that it is in the economic interest of
industrialized countries to allow highly educated and talented immigrants to enter, but not
to allow large numbers of unskilled people to immigrate. Only if a corresponding inflow of
capital is attracted by the higher returns possible with greater availability of unskilled labor
does this argument lose some of its force.
Multinational corporations
A multinational corporation (MNC) is a firm that operates in several countries through
branches or subsidiaries that it effectively controls. Because MNCs are not equally likely to
be observed in all industries, and not necessarily in capital-intensive sectors, we should
recognize that they are not particularly a conduit for transferring capital from countries
where it is abundant to countries where it is scarce. Rather, they are much more likely to be
in industries where superior technology or unique products provide an important com-
petitive advantage to the firm.
Although US MNCs were most prevalent in the 1950s and 1960s, recovery from World
War II in Europe and Japan led to the expansion of MNCs headquartered in many countries.
UN figures show that the US share of all foreign direct investment fell from 50 percent in
212 International economics
1967 to 25 percent in 1995. In fact, a feature of the 1990s was that MNCs from developing
countries began to emerge and in 1995 accounted for 8 percent of the stock of investment
8
The shrill rhetoric directed at US MNCs and US imperialism in the 1960s and 1970s has
declined.
9
Direct investment has become characterized by two-way flows between indus-
trialized countries, which in 1995 were the source of over 90 percent of the stock of foreign
investment and the destination of over 70 percent. Countries everywhere recognize the
advantages of gaining access to the production and marketing networks of MNCs; roughly
one-third of manufactured goods traded internationally are accounted for by MNC sales,
particularly sales from one affiliate to another as intra-company shipments. MNCs have
played a significant role in integrating the world economy.
10
Another important perspective on MNCs is given by Table 9.2, which presents the top
25 global corporations ordered on the basis of sales from Fortune magazine. A variety of
industries is represented, but many of the largest industrial corporations operate in mature
industries, such as automobiles and petroleum, not in newly emerging industries where
technological breakthroughs are most critical to success. Also, note that large Japanese
trading companies rank high in terms of sales, although they have relatively fewer employees
and less equity than the other giants. The US firm Enron shows up in this listing prior to its
collapse in 2002, and in many respects it appears similar to the Japanese trading companies,
with reported high revenues but relatively few employees or equity. Actual rankings across
years are likely to show some variation, because competition within an industry, or the
decline of an entire industry, contributes to changes in this list, as will the variation in
growth rates observed across countries in which the MNCs operate. While a conglomerate
that operated in every industry and in every country would be more immune to such
variation, such conglomerates do not tend to be the most successful MNCs.
Given that there are many disadvantages of operating in a foreign country where local
firms have the advantage of a better understanding of local culture, customs, and contacts,
why does a firm become an MNC? J.H. Dunning provides a useful framework to answer that
question.
11
He considers three factors: ownership, location, and internalization. We shall
define these terms and show how they help determine a firm’s decision to become an MNC.
We then consider how both the host and the home country are affected by the operations
of MNCs and how they try to influence those operations.
The decision to become an MNC
An MNC typically has some special expertise that it has developed and now hopes to exploit
in a larger market. Such expertise may include technological know-how that it has acquired
through research and development or learned from its past experience. This may include a
particular new product innovation or a process to produce a product. Advertising that
creates a brand image and an organizational strategy that coordinates complex production
and distribution systems also qualify as ownership advantages. A common characteristic of
many of these items is that they represent intangible knowledge that can be provided to one
operation without leaving less for others to use. The firm that owns these intangible assets
can spread the costs of developing this knowledge over more customers by selling in foreign
as well as domestic markets. Yet we have not demonstrated why such sales could not simply
occur as exports from the innovating country. Therefore, we need to consider the other
categories proposed by Dunning.
Location includes a variety of factors that make production abroad, rather than in the
MNC’s home country, attractive. In many service industries, the MNC must be located in
9 – Mobility of labour and capital 213
Table 9.2 The top 25 global corporations (in US$ million)
Rank Company Country Revenues Profits Assets Stock-holders’ Employees
equity
1 Wal-Mart Stores US 219,812.00 6,671 83,375 35,102 1,383,000
2 Exxon Mobil US 191,581.00 15,320 143,174 73,161 97,900
3 General Motors US 177,260.00 601 323,969 19,707 365,000
4 BP Britain 174,218.00 8,010 141,158 74,367 110,150
5 Ford Motor US 162,412.00 –5,453 276,543 7,786 352,748
6 Enron US 138,718.00 NA NA NA 15,388
7 DaimlerChrysler Germany 136,897.30 –593 184,671 34,728 372,470
8 Royal Dutch/Shell Neth/Brit 135,211.00 10,582 111,543 56,160 91,000
9 General Electric US 125,913.00 13,684 495,023 54,824 310,000
10 Toyota Motor Japan 120,814.40 4,925 150,064 55,268 246,702
11 Citigroup US 112,022.00 14,126 1,051,450 81,247 268,000
12 Mitsubishi Japan 105,813.90 482 61,455 7,761 43,000
13 Mitsui Japan 101,205.60 443 50,314 6,904 36,116
14 ChevronTexaco US 99,699.00 3,288 77,572 33,958 67,569
15 Total Fina Elf France 94,311.90 6,858 78,887 30,212 122,025
16 Nippon Telegraph & Telephone Japan 93,424.80 –6,496 157,551 44,564 213,000
17 Itochu Japan 91,176.60 242 35,857 3,000 36,529
18 Allianz Germany 85,929.20 1,453 839,551 28,193 179,946
19 IBM US 85,866.00 7,723 88,313 23,614 319,876
20 ING Group Neth. 82,999.10 4,099 627,816 19,155 113,143
21 Volkswagen Germany 79,287.30 2,610 92,976 21,364 322,070
22 Siemens Germany 77,358.90 1,857 82,070 21,686 484,000
23 Sumitomo Japan 77,140.10 362 36,613 4,907 30,264
24 Philip Morris US 72,944.00 8,560 84,968 19,620 175,000
25 Marubeni Japan 71,756.60 –931 36,259 1,991 31,000
Source: Fortune, July 22, 2002, p. F–1.
the same country as the customer in order to provide the service. McDonald’s can satisfy
Muscovite demand for a Big Mac only by locating in Moscow. In other industries high
transportation costs may preclude exports from one country to another. A French firm that
has special expertise in producing cement nevertheless will not find it economical to export
cement to the United States. Instead the firm will produce cement in the United States,
where it can serve US customers without incurring high transport costs. As we discussed in
the case of the product cycle, some MNCs may find that standardized production processes
are carried out most economically in countries that are well endowed with unskilled labor.
A shoe that is designed by Nike in the United States but produced in China takes advantage
of differences in factor endowments in the two locations according to their requirements in
two different stages of the production process. Location becomes an especially important
factor to MNCs when trade barriers are imposed or threatened, and MNCs find that the
protected markets can best be served by producing within a country rather than exporting
to it. For example, the common external tariff of the European Economic Community was
a major stimulus to the large direct investments made by US firms in Europe during the
1960s. US and European restrictions on imports of Japanese automobiles in the 1980s gave
Japanese firms an incentive to locate assembly plants in those countries.
The examples above are particularly relevant in identifying likely differences in the
marginal cost of serving a market from different locations. MNCs, however, are concerned
about fixed costs as well. A particularly useful way of recognizing the role of fixed costs is to
distinguish those that are specific to a plant and those that are specific to the firm as a
whole.
12
A firm’s research and development which generates ideas applicable in all locations
is a fixed cost specific to the firm as a whole, while the fixed cost of building a factory and
installing machinery is specific to a plant. The existence of high firm-specific fixed costs
makes it more likely the firm will try to serve foreign markets to exploit its unique knowledge,
but high plant-specific costs make it more likely the firm will do so by exporting rather than
by producing abroad. Separate plants in many separate locations result in the duplication
of expenditures for plant-specific costs and raise the average total cost of serving the market
that way. Conversely, when plant-specific fixed costs are low but transportation costs and
trade barriers are high and the host country’s factor endowments are well matched to the
inputs necessary to produce the good, the MNC is more likely to locate a plant abroad.
If the MNC has decided that production abroad is more efficient than exporting, we still
must consider the final criterion mentioned above, internalization, to assess why the MNC
chooses to operate its own plant rather than license someone else to produce the good. An
advantage of licensing is that the firm need not raise capital itself or tie up its own manage-
ment resources in learning how to produce in a foreign setting. Yet, by licensing technology
to others, the innovator takes the risk that this information may leak out to others or be used
to compete directly with it. Production abroad also raises the possibility that employees will
defect and start their own competing firm, but at least the MNC can control that process
better through the incentives and wages it pays its employees. When the pace of tech-
nological change is rapid in an industry, the firm may find licensing is the best way to earn
an additional return on its innovation before that product is superseded by another. In the
semiconductor industry, for example, companies have chosen to use licensing agreements
to exploit their technological advances quickly. Licensees are more likely to become com-
petitors when high tariff creates high profit potential and when plant-specific costs are low
and entry of new firms is easy.
13
Licensing may not be feasible if the innovator and prospective foreign producer cannot
agree on an acceptable royalty rate and means of enforcing the contract. Such agreements
9 – Mobility of labour and capital 215